Abstract
Salt accumulation in bare strips under film-mulched drip irrigation is a global concern as it adversely affects soil quality and hinders sustainable agricultural development in arid and semi-arid regions. This study aims to investigate the spatial distribution of soil moisture and salt under various planting patterns and assess the lateral salt accumulation effect in bare strips. Seven treatments were implemented based on the local cotton planting pattern, including the local classical planting pattern (LTP), mulch width of 220 cm (WFM-220), spacing of 90 cm (SFM-90), mulch width of 40 cm (WFM-40), spacing of 10 cm (SFM-10), ridge tillage (TFM-RT), and ditching (TFM-D), varying in mulch width, spacing, and tillage method in bare strips. Additionally, the performance of the HYDRUS-2D model was evaluated by comparing simulated and observed values using field data. The results revealed that (I) the WFM-220 cm treatment exhibited the best water content retention under mulched film, with lower salt accumulation in the surface bare strip (0–20 cm soil layer); (II) all treatments with narrow rows showed desalination effects in the 0–40 cm soil layer, with salt content reductions ranging from approximately 13% to 38% compared to the initial values; (III) under the LTP treatment, the lateral salt discharge effect in the bare strip of the 0–40 cm soil layer was the best, regardless of mulch width and spacing, with a salt accumulation rate up to three times higher than the initial value, and even up to four times higher in the 0–10 cm layer; (IV) the TFM-RT treatment exhibited the best salt accumulation ability on the surface bare strip; and (V) the HYDRUS-2D model proved to be an effective tool for studying the dynamic regulation mechanism of water and salt with root mean square error values ranging from 0.079 to 0.106 cm3·cm−3 for soil water content and from 0.044 to 0.079 dS·m−1 for electrical conductivity, indicating good agreement between simulations and observations.
1. Introduction
Film-mulched drip irrigation technology has been widely adopted in arid and semi-arid regions with similar climatic conditions in China and Central Asia since the 1990s, owing to its agronomy, water conservation, and economic advantages. It enhances water and fertilizer use efficiency and alters farmland’s water and salt transport dynamics [1,2,3,4]. However, it also presents some limitations. Crop root growth is limited to the lightly salted area within the soil moisture zone due to the localized water supply [5]. This limited water supply fails to adequately facilitate soil salt leaching in regions with severe water scarcity, leading to salt accumulation at the edge of the wet zone and in the bare strips [6], resulting in desalination under mulch films at the end of the drip irrigation cycle. Salt accumulation in bare strips and the edge of the wet zone is commonly recognized as a form of secondary salinization under film-mulched drip irrigation, posing a global challenge [7,8,9,10,11]. The salt accumulated on the soil surface that cannot be discharged decreases soil fertility and alters soil properties, adversely affecting the soil’s environmental functions [12]. For example, high salt concentration and limited rainfall produce low soil organic carbon, decreasing soil fertility and rice yield [13]. Therefore, there is a pressing need to develop adaptive agronomic strategies aimed at reducing salinity at the edge of the wet zone and bare strips, thereby ensuring the sustainable development of oases and irrigated agriculture.
Halophytes serve as economical and environmentally friendly phytoremediation tools. They are effective for removing excess soil salt from saline soils [14,15] and enhancing the physical and chemical properties of soils [16] compared to physical and chemical measures [17]. For example, Suaeda salsa has been effectively used to ameliorate saline soils in northwest China through intercropping with cotton in bare strips. Its salt-absorbing properties also influence the distribution of salts in the soil [11,18]. It is evident that the salt accumulation in bare strips is closely linked to the restorative effects of halophytes, and this accumulation depends on various factors. The complex conditions of upper boundary mulching can influence salt concentration in soil layers by altering soil water and salt transport. For example, ridge tillage in bare strips can facilitate horizontal infiltration of water and solutes due to its loose soil structure [19], making it an effective method to move salt to the surface of bare strips. Therefore, investigating the dynamics of soil water and salt movement in bare strips under an inhomogeneous subsurface is essential for transforming traditional salt regulation practices and exploring new planting and salt discharge strategies. However, most studies focus on water and salt movement under mulch film without considering factors such as mulching width and field mulching ratio [20,21,22,23]. These factors inevitably alter the pattern of soil water and salt transport due to different boundary conditions on the soil. It is essential to conduct comparative and systematic studies on soil water and salt movement under different mulching planting patterns. By doing so, we can identify methods to maximize salt accumulation in bare strips. This approach not only mitigates salinity in the crop root zone but also facilitates the effective removal of salt accumulated in bare ground strips, potentially through biological or other measures.
Mathematical models can save time, expense, and labor compared to field experiments. Mathematical models have many advantages in evaluating the effects of different planting patterns on spatial and temporal distributions of soil water and salts, thereby enabling the evaluation of various tillage and mulching combination methods under drip irrigation. This method is instrumental in optimizing soil water and salt concentrations to enhance effective soil water utilization. Previous studies have highlighted the utility of mathematical assessment, mainly through applying the HYDRUS-2D model, to analyze the relationship between soil water and salt. Several scholars have extensively researched soil water and salt transport under different mulching conditions, yielding valuable insights through numerical simulations [24,25,26]. These studies demonstrate the efficacy of the HYDRUS model in simulating soil water and salt transport.
This paper aims to (I) calibrate and validate the HYDRUS-2D model for a cotton soil system under various planting patterns, (II) compare two-dimensional soil water and salt profiles under different cropping patterns, and (III) establish a foundation for mitigating secondary soil salinization and assess the lateral salt accumulation effect in bare strips.
2. Materials and Methods
2.1. Details of the Experimental Field
The field experiment was conducted from 11 April to 5 October at the Fukang Desert Ecosystem Research Station (43°45′ N–44°30′ N, 87°45′ E–88°05′ E), located in the plain oasis agricultural area of the Sangong River Basin, Xinjiang, China, during the 2011 and 2012 seasons. The experimental field was flooded during the winter of 2011 to leach out and homogenize salinity. The experiment was set up in 2012, with data collection conducted in the field, involving both calibration and validation processes (post-calibration analysis revealed no significant differences in soil hydraulic parameters among the treatments). The predominant soil texture is sandy loam; the groundwater table lies deeper than 5 m. Table 1 overviews the physical and chemical properties within the 0−100 cm soil layer. Throughout the cotton growing season, irrigation practices were implemented, with Figure 1 illustrating the cumulative reference evapotranspiration (ET0) and precipitation trends. Meteorological data from the Fukang Desert Ecosystem Research Station were used to calculate ET0 using the Penman–Monteith equation, a methodology recommended by the Food and Agricultural Organization [27].

Table 1.
Soil properties in the 0–100 cm soil layer of the experimental field.
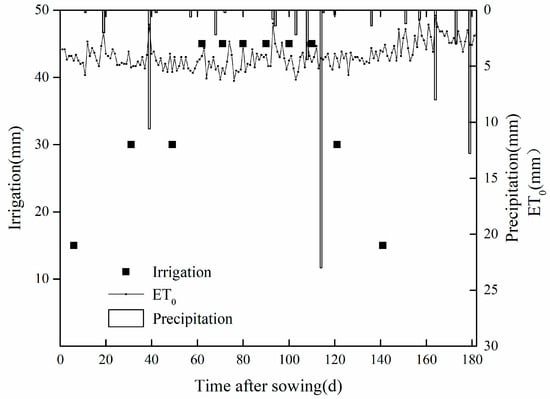
Figure 1.
The irrigation regimes for all treatments, the reference evapotranspiration (ET0), and precipitation levels during the cotton growth period.
2.2. Experimental Arrangement
The cotton variety used in this study is Xinluzao 17, a local cultivar. The planting of cotton was conducted manually on 12 April. This was followed by the typical local cotton planting patterns (Figure 2), which include a film width of 130 cm with 50 cm spacing and flat tillage treatment in the bare strip, denoted as the local classical planting pattern (LTP). Seven different treatments were investigated, along with variations in film mulching width (WFM; 220 cm, 40 cm), spacing in the unmulched zone (SFM; 90 cm, 10 cm), and treatment in the unmulched zone (TFM; ridge tillage-RT, ditching-D). Each treatment consisted of 21 plots with three repetitions arranged adjacent to each other and separated by 2 m distance protection lines (Figure 2a). Plot widths varied, with a length of 5 m to minimize the experimental error and ensure the application of three groups of mulched drip irrigation systems on each plot. Drip tapes with emitters spaced 0.3 m apart were arranged in the middle of the narrow row. The initial irrigation was conducted on 17 April, with the second irrigation scheduled for 12 May, as cotton seedlings were still in the seedling stage. The irrigation schedule specifics are outlined in Table 2. A total of 11 irrigations were applied during the growth period, with an irrigation volume of 3900 m3/ha.
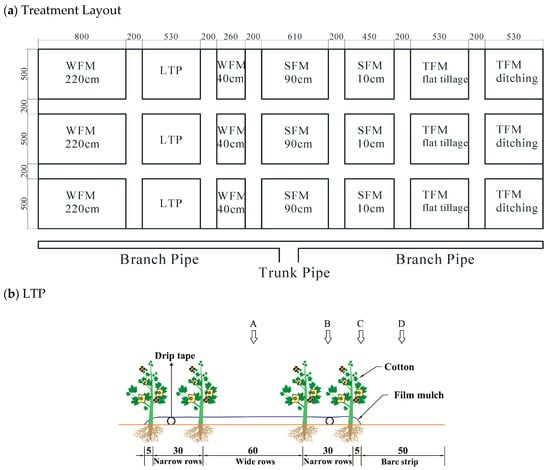
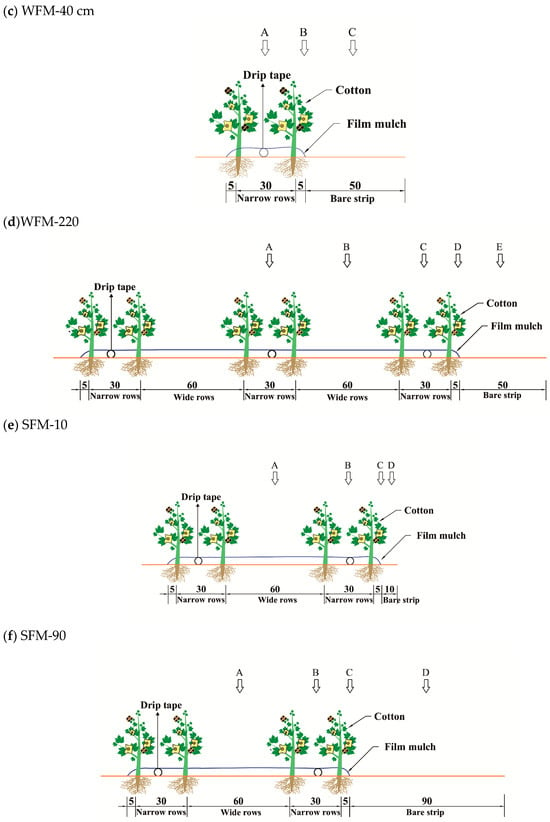
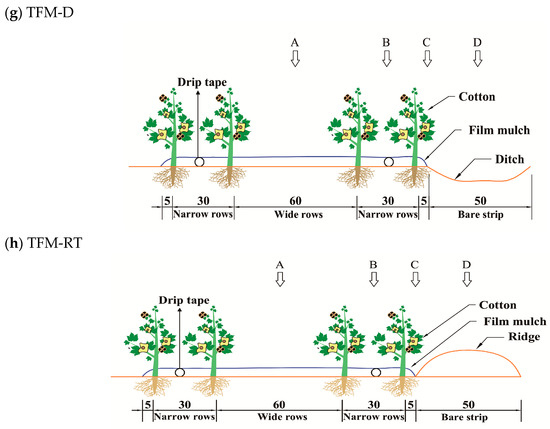
Figure 2.
A schematic showing the layout of treatments and planting patterns. In the figure, points labeled A, B, C, D, and E represent sampling locations. The dimensions in the figure are indicated in cm. These dimensions are consistent with subsequent figures in this manuscript.

Table 2.
The irrigation schedule in the growing season of 2012.
2.3. Measurement Indicators and Method
2.3.1. Physical Properties of the Soil
Fixed-location soil samples were collected at intervals of 10 cm from 0 to 20 cm depth and intervals of 20 cm from 20 to 100 cm depth, using a 3 cm diameter auger from designated points to investigate the effects of different treatments on soil water and salt transfer. This approach allowed for examining how various treatments influenced soil water and salt transfer under film-mulched drip irrigation, with findings extrapolating to a two-dimensional profile (Figure 2b–h). Initial values were recorded before cotton planting, followed by monthly soil sampling conducted 2 days before each irrigation event (8 days post-irrigation). Some soil samples underwent oven drying to measure soil water content, whereas the rest was air-dried and sieved through a 2 mm mesh to prepare dilute soil extract solutions. Soil salinity was measured through extracts using a soil-to-water ratio of 1:5 (EC1:5), which could be converted to soluble salt concentrations based on field-measured data. Additionally, the saturated paste extract conductivity of the soil (ECe) was determined using samples with a wide range of EC1:5 values, and a relationship between ECe and EC1:5 was established (R2 = 0.975) [28].
The EC1:5 values were then converted into salt concentrations (St, g kg−1) using the following relationship:
The ECe of all samples was estimated using the following equation:
2.3.2. Morphological Growth Indicator of Cotton
Three plants were selected from each plot for measurement of leaf length and width using a tape (with an accuracy of approximately 0.1 cm) every 14 days. The leaf area of the entire plant was measured, and the leaf area index (LAI) (leaf area/ground area, m2/m2) was calculated. The individual leaf area was determined by leaf length × leaf width × coefficient. Leaf size was measured using a ruler. The coefficient value was 0.7, as determined using the method described by [29]. Roots were sampled using a root drill with a 7 cm diameter drill bit and a height of 10 cm, vertically downing every 10 cm and sampling until there was no root. Samples were taken once at seedling, bud, full, and late boll stages of cotton.
2.4. Model Simulation Principle and Method
2.4.1. Mathematical Model
The HYDRUS (2D/3D) model was used in this study to simulate the two-dimensional movement, spatial and temporal variabilities, and transport patterns of water and salts. Solving the Richards equation [30] and the convection–dispersion equation. Soil moisture transport processes can be described by the following modified form of Richards’ equation, assuming a homogeneous and isotropic soil [31]:
where h is the pressure head (cm), z is the vertical coordinate taken positive upwards (cm), x is the radial coordinate (cm), K (h) is the hydraulic conductivity (cm d−1), C (h) is the water capacity function (1/cm), and is a sink term in the conservation equation representing the water disappearance rate per unit volume (1 d−1). Soil hydraulic properties are described as follows [32]:
where Ks is the saturated hydraulic conductivity (cm d−1), Se is the effective saturation, and are the saturated and residual water contents (cm3 cm−3), m and n are empirical shape parameters, and is a pore connectivity parameter, which is normally set to 0.5.
Assuming that the salt in the soil is classified as a non-reactive solute and that the adsorption, resolubilization, and inter-ionic exchange processes of the salt solution in the soil are not taken into account, the soil salt transport is usually described by the convection–dispersion equation as follows [33]:
where c is the concentration of the solute in the soil solution (g L−1), is the soil volume water content (cm3 cm−3), q is the volumetric flux density along the x and y directions (cm d−1), and D is the dispersion coefficient (cm2 d−1). The governing flow and transport equations were solved numerically using Galerkin-type linear finite element schemes.
2.4.2. Initial and Boundary Conditions
This experiment has various planting patterns, with different research areas and generalized boundary conditions. Since all treatments use the same model and modeling method, we will explain the modeling process using the treatment of mulch width of 220 cm (WFM-220 cm) as an example. According to the symmetry principle, the main study area was selected from the middle of the mulch to the middle of the bare strip. The simulated flow domain for the treatment of WFM-220 cm is illustrated in Figure 3. The horizontal width of the simulated area was set at 160 cm. The vertical depth was set at 100 cm (Figure 3). The vertical side boundary of the simulated area was set as a no-flux boundary. The bottom was set as a free drainage boundary. At the top of the simulated area, a time-variable flux boundary was applied to the mulch boundary (110 cm) and drip tape. Meanwhile, an atmospheric boundary (0.50 m) was used at the top of the bare strip. The daily crop potential evapotranspiration (ETp) used in the model was calculated using the following equation:
where the potential transpiration (Tp) and potential evaporation (Ep) for the numerical simulation were split following the procedure described by [34].
where k is the radiation extinction coefficient, taken as 0.58 for the cotton crop [35], and LAI is the leaf area index measured at four stages during the growth period. The mulch has the potential to prevent evaporation. It cannot completely block the flux due to aging problems. The potential flux through the plastic mulch can be calculated as follows:
where Emulch represents the evaporation flux through the mulching boundary, and Cp generally has a value of 0.07 [24], considered a plastic mulch partitioning coefficient. During irrigation, the flux of the drip tape was calculated as follows:
where q(t) is the input irrigation flux (cm d−1), Q(t) is the discharge rate (cm3 d−1), L is the distance between two consecutive emitters in the drip tape (cm), and W is the width of the saturation zone (cm).
q(t) = Q(t)/(LW)
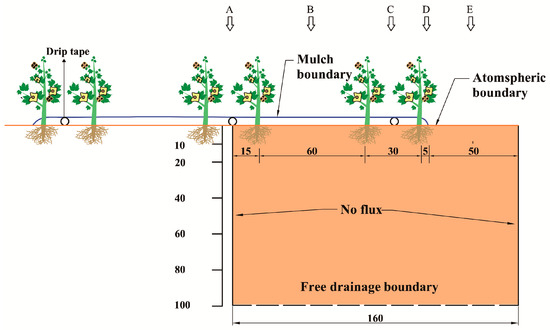
Figure 3.
Flow domain and boundary conditions used in the HYDRUS-2D simulations. In the figure, points labeled A, B, C, D, and E represent sampling locations.
- a.
- Initial conditions
The initial water and salt distribution in soil can be uniform, linear, or non-uniform. The initial conditions significantly impact the simulation results set in the HYDRUS-2D model with measured soil water content and soil water concentration. The initial conditions of Equations (3) and (6) are as follows:
where h (x, z, 0) and hi (x, z) are the pressure head of i node at the time of 0, cm, and c (x, z, 0) and ci (x, z) are the soil water concentration of i node at the time of 0, S·cm−1.
h (x, z, 0) = hi (x, z), 0 ≤ x ≤ 160, 0 ≤ z ≤ 100
c (x, z, 0) = ci (x, z), 0 ≤ x ≤ 160, 0 ≤ z ≤ 100
- b.
- Water transport boundary conditions
The situation is complex because the upper boundary involves various influencing factors, including drip irrigation, film mulching, and the bare strip between films. Therefore, the upper boundary condition is determined by the specific circumstances.
For the surface of the bare strip, influenced by atmospheric factors, such as precipitation and evaporation, the water flux Q (cm d−1) at the upper boundary should be equal to the evaporation (negative value) or precipitation (positive value) between films:
When the surface under the mulch film is not irrigated, soil evaporation is not completely halted due to the aging and breaking of the mulch film. According to Equation (10), the upper boundary is set as
When irrigating the surface under the mulch film, the boundary conditions can be categorized into wet and non-wet zones. The upper boundary conditions of the non-wet zone are the same as Equation (14), and the upper boundary conditions of the wet zone can be determined according to the flow rate of the drip tape, the width of the wet zone, and the drip tape spacing.
Xi and Xj represent the width of the wetted area below the drip tape, which is W mentioned in Equation (11).
- c.
- Soil transport boundary conditions
Various factors, including irrigation and atmospheric evaporation, influence the upper boundary of salt transport in the simulated area. These factors are described as follows:
The solute flux during evaporation at the surface of the bare strip is zero, so its upper boundary condition can be set as
where q in Equation (17) represents the evaporation (cm d−1) (negative value).
The solute flux during precipitation at the surface of the bare strip is zero, so its upper boundary condition can be set as
where q in Equation (18) represents the precipitation (cm d−1), a positive value; is the concentration of precipitation (dS/m); is precipitation (cm d−1) (positive value).
In the case where the surface under the mulch film is not irrigated and soil moisture flux is zero, there are
where q in Equation (18) represents the soil evaporation due to aging and breakage of the film (cm d−1) (positive value).
When the surface is irrigated under the film, the boundary conditions at the surface of the wet area are treated as the following equation, and the non-wet area is treated according to the zero-flux boundary.
where q in Equation (18) represents the input irrigation flux (cm d−1) (positive value); is the concentration of irrigation water (dS m−1); is dripper discharge (cm d−1) (positive value).
2.4.3. Root Water Uptake
To quantitatively describe the absorption and utilization of soil water by cotton roots, it is necessary to establish a scientific and reasonable root water absorption model. For two-dimensional conditions and simultaneous water and salinity stresses, root water uptake was computed according to the Feddes model [36,37] as follows:
where the stress response function is a dimensionless function of the soil water (h) and osmotic () pressure heads (0 ≤ ≤ 1) with default settings; b (x, z) is the root distribution function; is the maximum width of root system distribution, which is set to specific values according to field observation; and is the potential evapotranspiration (cm d−1). The root distribution function b (x, z) was calculated as follows [38]:
where Xm is the maximum horizontal distance of root distribution (20 cm), and Zm is the maximum depth of root distribution (60 cm), which is set to specific values according to field observation. The parameters x* and z* indicate the location in the profile with the maximum rooting density, taking values of 0 and 10, respectively, and Px and Pz are empirical parameters of root asymmetry, normally set to 1.0.
2.5. Model Calibration and Validation
Soil hydraulic parameters (i.e., θr, θs, α, n, and Ks) were determined based on the sand, silt, and clay percentage content in the soil particle distribution curve using the Rosetta module of HYDRUS-2D. These soil hydraulic parameters were manually calibrated by comparing simulated and observed values of soil water and salt contents (Table 3 and Table 4). The transversal dispersivities were set to one-tenth of the longitudinal dispersivities [39]. By comparing the simulated soil profile salinity values with the measured salinity in the field, adjustments were made to the solute transport parameters, such as longitudinal dispersion and transverse diffusion coefficient, to minimize the discrepancy between simulated and measured salinity values. Since molecular diffusion is typically negligible, the molecular diffusion coefficient was set to zero [40]. Root distribution parameters were obtained from actual field measurements. As individual treatments did not significantly affect the soil’s physical properties, the HYDRUS-2D model was calibrated using soil water content and ECe experimental data from treatments including LTP, WFM-220, width of 40 cm (WFM-40), and spacing of 90 cm (SFM-90) and validated using the soil water content and ECe experimental data from treatments of spacing of 10 cm (SFM-10), ditching (TFM-D), and TFM-FT, respectively.

Table 3.
Soil hydraulic parameters used in the simulations.

Table 4.
Soil-specific parameters for solute transport.
The HYDRUS-2D software simulation program takes input parameters for soil water movement, solute transport, and root water uptake in a specified sequence. The program calculates and outputs results consistently with simulated initial and boundary conditions. Periodic re-execution of the program with varying initial parameter estimates ensures convergence to the same global minimum of the objective function [41]. Additionally, a Marquardt–Levenberg-type parameter estimation technique, as described by Šimůnek and Hopmans [33], is used for the inversion of soil hydraulic parameters [42] or solute transport and response parameters from either measured transient or steady-state flow or transport data [33]. Observed data, preliminary estimates, initial and boundary conditions, and inversion schemes were used to optimize soil hydraulic and solute transport parameters.
2.6. Statistical Analysis
The consistency between simulated and observed data under various planting patterns was evaluated using the root mean square error (RMSE) and coefficient of determination (R2) to assess the agreement between simulated and measured values, which was calculated as follows:
where Oi and Si represent the observed and simulated values, respectively, and n is the total number of paired values.
3. Results
3.1. Spatial Distribution Characteristics of Soil Moisture and Salinity
Figure 4, Figure 5 and Figure 6 show the vertical distribution of soil moisture across all treatments during periods of high-frequency irrigation (10 May, 10 July and 10 June). Across all treatments, soil water content was lowest near the dripper (narrow rows), falling below that of other positions under the film after days of irrigation. The wider the mulch width, the greater the area of soil water retention. In Figure 4, under the WFM-220 cm treatment, the soil water content in the bare strip and narrow rows nearly equivalent was lower than that in the wide rows, with this difference decreasing with depth, consistent with observations from the LTP and WFM-40 cm treatments. Figure 5 reveals that SFM-10 cm had the highest bare soil content in the bare strip, followed by LTP, while SFM-90 cm had the lowest bare soil content in the bare strip across the 0–100 cm soil depth. Figure 6 demonstrates that soil water content was highest under the LTP treatment, followed by the TFM-D treatment, and lowest under the ridge tillage (TFM-RT) treatment across the 0–100 cm soil depth.
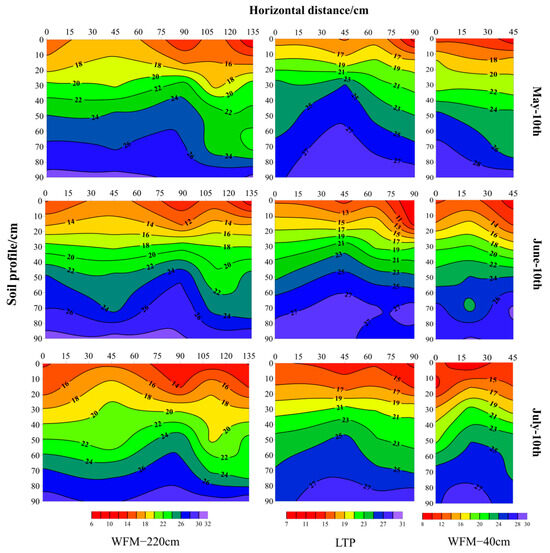
Figure 4.
Vertical distribution of soil moisture (cm3 cm−3) in WFM-220 cm, LTP, and WFM-40 cm during a frequent irrigation period from 10 May to 10 July in 2012.
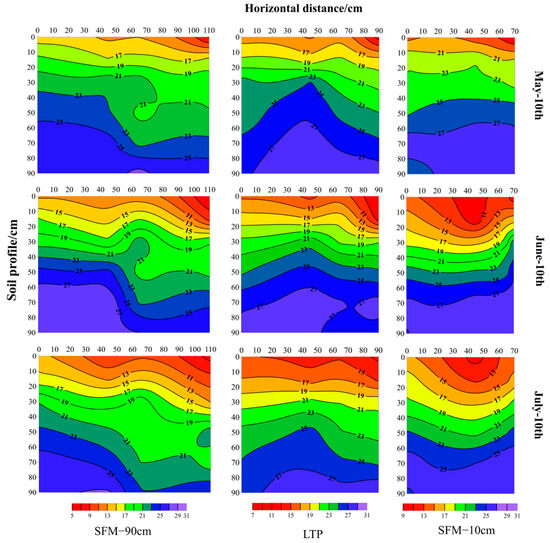
Figure 5.
Vertical distribution of soil moisture (cm3 cm−3) in SFM-90 cm, LTP, and SFM-10 cm during a frequent irrigation period from 10 May to 10 July in 2012.
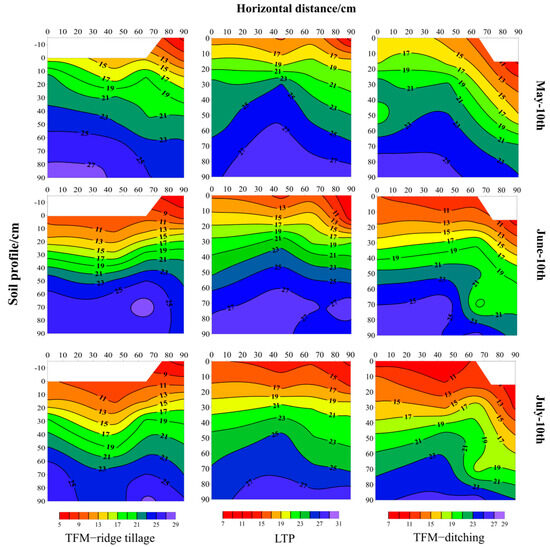
Figure 6.
Vertical distribution of soil moisture (cm3 cm−3) in TFM—ridge, LTP, and TFM—ditching during frequent irrigation period from 10 May to 10 July in 2012.
Figure 7, Figure 8 and Figure 9 depict the vertical distribution of soil salinity across all treatments during periods of high irrigation frequency (10 May, 10 June and 10 July). Notably, soil salinity near the dripper (narrow rows) was lowest, followed by wide rows, and highest in the bare strip. This indicates that high-frequency drip irrigation effectively reduced the salt content of the wetted area. The root water absorption effect only reduced the water under the dripper without bringing salt to the root zone; instead, it accumulated in the middle and lower soil layers under the mulch film and bare strip through water leaching and evaporation.
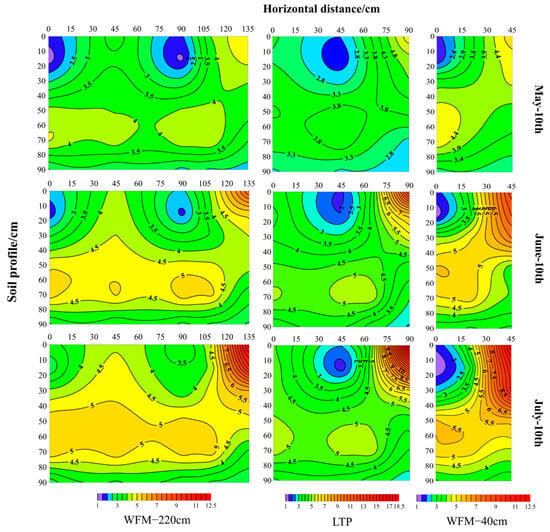
Figure 7.
Vertical distribution of soil salinity (ECe, dS m−1) in WFM-220 cm, LTP, and WFM-40 cm during a frequent irrigation period from 10 May to 10 July in 2012.
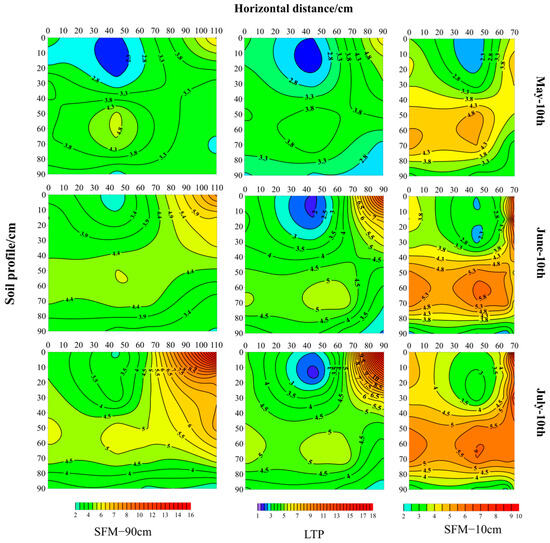
Figure 8.
Vertical distribution of soil salinity (ECe, dS m−1) in SFM-90 cm, LTP, and SFM-10 cm during a frequent irrigation period from 10 May to 10 July in 2012.
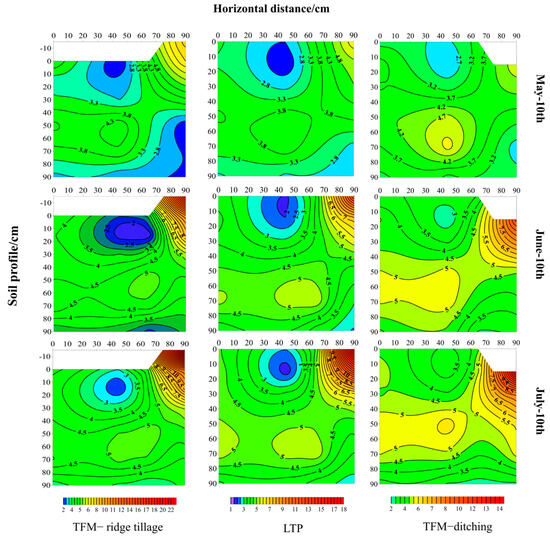
Figure 9.
Vertical distribution of soil salinity (ECe, dS m−1) in TFM—ridge, LTP, and TFM—ditching during a frequent irrigation period from 10 May to 10 July in 2012.
As shown in Figure 7, the WFM-40 cm treatment exhibited poorer salt discharge effects in the bare strip among the three treatments with varying mulch film widths. Salt distribution in the LTP treatment was primarily concentrated in the surface layer of (0–20 cm) of the bare strip, while in the WFM-220 cm and WFM-40 cm treatments, it was more dispersed, mainly in the 0–40 cm layer. This suggests that the range of wetting volume was limited under a specific dripper flow. Figure 8 demonstrates that the LTP treatment had the most significant desalination effect under the drip strip, followed by the SFM-90 cm treatment, with the SFM-10 cm treatment exhibiting the poorest effect. Moreover, salt in the SFM-10 cm treatment was mainly distributed in the middle and lower soil layers. Figure 9 shows that regarding the change of soil salinity with depth direction in narrow rows, the TFM-RT treatment had the most substantial desalination effect, followed by the LTP treatment, with the TFM-D treatment showing the weakest effect. Regarding soil salinity in the bare strip, the lateral salt discharge effect of the surface layer was highest in the TFM-RT treatment, followed by the LTP treatment. In contrast, the TFM-D treatment exhibited the weakest effect.
3.2. Salt Accumulation during the Season
Table 5 presents the effects of salt accumulation under different mulching methods at various soil depths at specific points at the end of the cotton growing period in 2012. All treated narrow rows were desalinated in the 0–40 cm soil layer, with salt concentration reduction ranging from approximately 13% to 38% from the initial values. Particularly noteworthy was the significant desalination effect of the WFM-40 cm treatment, reaching up to 63%, whereas the WFM-220 cm treatment exhibited the least desalination. Conversely, salt accumulation was the most under the LTP under wide rows, with the lateral salt discharge effect in the bare strip being the most effective. The salt accumulation rate was three times higher than the initial value and four times in the 0–10 cm layer. The TFM-RT treatment showed a lateral salt discharge effect comparable to that under the typical planting mode treatment. In contrast, the SFM-10 cm treatment demonstrated the worst lateral salt discharge effect, resulting in very low salt accumulation rates. In the 40–60 cm soil layer, soil salinity at different points under nearly all treatments increased compared to pre-planting levels, indicating a state of salt accumulation. The rate of salt accumulation was several times higher than the initial values. Notably, the SFM-10 cm treatment exhibited the most severe salt deposits under narrow rows and the bare strip, confirming that insufficient spacing in the bare strip could lead to salt accumulation and downward movement due to leaching from adjacent drippers. In the 60–100 cm soil layer, the WFM-220 cm treatment resulted in the highest salt deposits under narrow rows, followed by the SFM-10 cm treatment. In contrast, the differences among other treatments were not significant. This observation supports the notion that the WFM-220 cm treatment retains more water in the deep soil while also retaining salt in the deep soil, as indicated in Figure 4.

Table 5.
Salt accumulation (Mg ha−1) in the soil layers of 0–40, 40–70, and 0–70 cm under different treatments in the growing stages.
3.3. Simulated versus Observed Results
The simulated values for soil water and salt salinity with different treatments were compared graphically with the observed results in Figure 10 and Figure 11. The smaller RMSE and higher coefficient of determination (R2) values showed good agreement between observed and simulated soil water and salt salinity. Calibration periods and validation periods resulted in RMSE and R2 values for soil water and electrical conductivity of soil saturation extract (ECe), as shown in Table 6. These results demonstrate that despite the considerable demands on input data, Hydrus-2D proved to be an effective tool for evaluating water and solute transport and would be acceptable for performing simulations. The calibrated parameters are presented in Table 3 and Table 4.
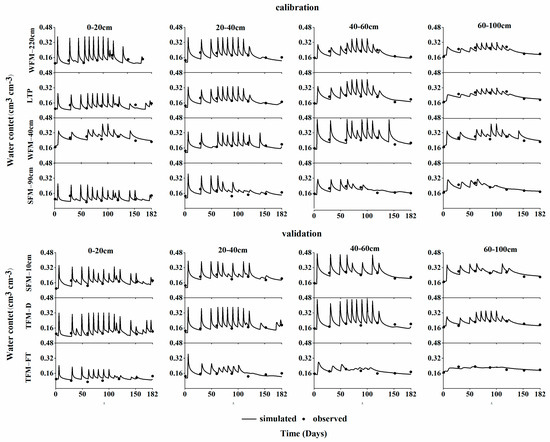
Figure 10.
Comparison of simulated and measured soil water content in different layers (0–20 cm, 20–40 cm, 40–60 cm, and 60–100 cm) under different treatments in 2012.
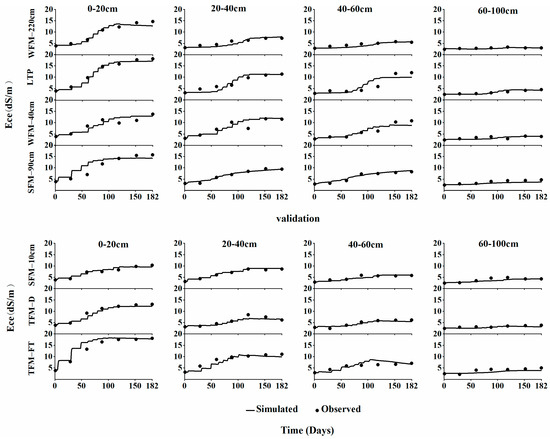
Figure 11.
Comparison of simulated and measured soil salinity content in different layers (0–20 cm, 20–40 cm, 40–60 cm, and 60–100 cm) under different treatments in 2012.

Table 6.
Results of the statistical analysis between measured and simulated soil water and salt salinity.
3.4. Salt Accumulation under Different Soil Layers in Bare Strip
Figure 12 illustrates the trend of soil salinity change horizontally across different soil layers under each treatment. At the end of the entire growth period, significant differences were observed in the trend of soil salinity among different soil layers at various horizontal positions under different treatments. Notably, the salt content in the bare strip was significantly higher than in other positions under mulch film across all treatments. Additionally, the soil layer 0–20 cm in the bare strip of all treatments exhibited salt accumulation compared to the initial levels. TFM-RT demonstrated the most severe accumulation among these treatments. However, the salt accumulation effects in the 0–20 cm soil layer, except for TFM-RT and SFM-90 cm treatments, were less than those in the LTP treatment. There were no significant differences in soil salinity below the dripper position of each treatment in terms of depth. However, significant differences were observed in the soil salinity of the 0–60 cm soil layer in the bare strip position, whereas differences in the 60–100 cm soil layer were less significant. This study analyzed the salt discharge effect in the bare strip under different treatments in the 0–20 cm soil layers based on typical planting patterns. In planting modes with varying widths of mulching, the lateral salt discharge effect of the LTP planting mode was significantly higher than the other two mulching widths, with salt mainly densely distributed in the 0–20 cm soil layer. This discrepancy may be attributed to the larger soil volume under the WFM-220 cm treatment, which retained substantial water under the membrane, reducing lateral water transport. However, the WFM-40 cm treatment, with a limited coverage area, resulted in less water retention under the mulch film, leading to more significant water transport downward under gravity and, consequently, higher salt concentration in the middle layer of the soil. Consequently, under a specific irrigation frequency and fixed dripper flow, there appears to be no clear relationship between mulching width and lateral salt discharge effect. In planting modes with different spacing in the bare strip, although there were no significant differences in the lateral salt discharge effect between LTP and SFM-90 cm planting modes, LTP treatment remained superior. Moreover, the lateral salt discharge effect of these two treatments was significantly higher than that of SFM-10 cm.
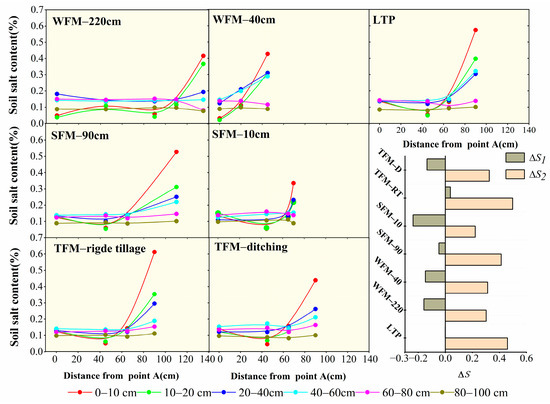
Figure 12.
The trend of soil salinity in the horizontal direction of different soil layers under each treatment and comparison of differences between treatments and initial salt content ( and represent the difference in final salinity between the local classical planting pattern and each treatment and between the final salinity of each treatment and the initial salinity at the 0–20 cm soil layer, respectively).
4. Discussion
4.1. Analysis of Water–Salt Variability in Mulch and Bare Strip
The mulch film acts as a barrier, impeding water exchange between the soil and the atmosphere, thus significantly reducing vertical soil moisture evaporation [43]. Water plays a crucial role in crop growth and development. Meanwhile, the width and agronomic practices in areas without mulch films influence lateral water and salt movement to some extent [9,44,45,46]. Some studies have found that wide films are highly effective in retaining water and increasing temperature, a conclusion we support in this study [47,48]. In treatments with different mulch width films, the WFM-220 cm treatment exhibited better cotton growth than other mulching widths because it retained more water during the growing season. Consequently, more soil moisture was used for transpiration in cotton under the same irrigation volume, resulting in lower soil moisture levels under the dripper. The WFM-40 cm treatment had the highest soil water content, followed by the LTP treatment under the dripper. Meanwhile, the WFM-220 cm treatment showed the highest soil water content in the 0–60 cm soil layer. The difference in soil water content at depths below 60 cm was insignificant. This confirms that wider mulch widths enhance water retention in the soil when the bare strip width remains constant. Additionally, the difference in soil surface moisture in the bare strip was insignificant, with more significant differences observed in the lower and middle layers of the WFM-40 cm treatment compared to the WFM-130 cm and greater than WFM-220 cm treatments. This disparity mainly arose because wider mulch widths allowed for better moisture retention in the mulched zone. Regarding different widths in bare strips, the results indicated that the area of soil moisture content under the film decreased with increasing bare strip width. With each increase in bare strip width, the soil water content in each layer decreased consistently. This phenomenon was caused by the increasing bare land area, which led to a stronger evaporation surface. Regarding different agronomic treatments in bare strips, the LTP treatment demonstrated better water retention than the TFM-FT and TFM-D treatments under the film, a pattern also observed in the bare strip. Moreover, the water content in the TFM-RT treatment was even lower than in the TFM-D treatment. These results may be attributed to ridge and ditching treatments, both of which increase the area of the soil evaporation surface. However, the terrain of ditching is relatively lower compared to ridge treatment, resulting in lower evaporation intensity in the ditching treatment in the bare strip. Related studies have also shown that crop water use efficiency under ridge tillage treatment is higher than under conventional flat tillage [49,50].
Soil moisture is the primary carrier of salinity; the change and distribution of salt in soil are closely linked to soil moisture dynamics. Typically, irrigation, whether with brackish or fresh water, inevitably triggers salt redistribution within the soil profile [51,52]. The irrigation method influences salt distribution [53,54]. For example, salts often accumulate in the shallow wetted soil layer under drip irrigation [55,56]. However, in this study, two main reasons account for soil salinity formation under specific irrigation volumes, consistent with Liu’s [57] findings on increased surface salinity on bare strips under drip irrigation: 1. The vertical movement of salt with water due to gravity and capillary action, and lateral movement due to the influence of matrix potential and capillarity. 2. Soil evaporation occurs in the bare strips [57,58,59,60]. Regarding the results in Figure 7, the lateral salt discharge in bare strips under different covering widths had varying effects. The WFM-220 cm treatment retained more water in the deep soil, allowing salt to accumulate. Conversely, the WFM-40 cm treatment, with a limited coverage area, retained less water under the mulch film, resulting in more lateral movement of both water and salt under gravity and capillary force. As for the findings in Figure 8, several reasons may explain the results. First, when the dripper flow is constant, the range of wetted volume is limited, affecting the lateral transport distance of salt, which is closely related to the wetted soil volume [61]. Second, when the spacing in the bare strip is too long, although the exposed soil evaporation area is sufficient, soil evaporation may only cause salt near the wetter area to accumulate upward due to the limited wetted soil volume, leading to surface salinity aggregation in small bare land areas [57]. Conversely, when the spacing in the bare strip is too small, the leaching of adjacent drippers may cause salts to accumulate in the bare strip and move downward. Regarding the results in Figure 9, a similar study reported by [19,48] indicated that the main reason for differences in lateral salt discharge on the surface layer is the variation in evaporation intensity and area in the bare strip under different treatments.
Generally, soil moisture and salinity analysis at a specific irrigation frequency and fixed drip head flow rate reveal several key findings. First, concerning a specific spacing with flat tillage treatment in no mulch strip, it is observed that the treatment with an extra wide film somewhat enhances soil moisture retention. However, it also leads to more severe salt accumulation under the film, posing a potential salt threat, particularly during prolonged irrigation. Second, in the case of local film width with flat tillage treatment in no mulch strip, both narrower and wider spacing in the absence of mulch is unfavorable for the lateral transport of salts. The lateral salt discharge effect strongly correlates with wetted soil volume under the drip tape. Moreover, the TFM-RT treatment in no mulch strip is more conducive to salt lateral surface accumulation than the TFM-FT and TFM-D treatment methods. Furthermore, the planting pattern involving a film width of 130 cm with 10 cm spacing and flat tillage treatment in no mulch strip demonstrates the best water retention effect. However, it exhibits a poor lateral salt discharge effect, which may not be conducive to actual production. Conversely, the planting pattern with a film width of 130 cm and 50 cm spacing, coupled with flat or ridge tillage treatment in no mulch strip, shows promising results. It retains water effectively and exhibits good lateral salt discharge capacity. Notably, the ridge tillage pattern in no mulch strip exhibits a more substantial surface aggregation capacity for salt. Therefore, the planting pattern of flattening in no mulch strip may be preferable when soil salt is low. Conversely, ridge treatment in no mulch strip may be more suitable when dealing with high soil salt content.
4.2. Characterization of Salt Accumulation in Mulch and Bare Strip
The average soil salinity at the monitoring sites gradually increased at the end of the monitoring period compared to the beginning. Moreover, the salt content removed by the seven mulching modes varied significantly across different parts of the 0–100 cm soil layer, with the most significant salt content observed in the bare strips. This finding is consistent with short-term drip irrigation studies [4,62,63]. However, contrary results were observed in a long-term study spanning 13 years, where the salt content in the bare strips was higher than that in deeper soil, which was significantly lower (only 17%) than previous levels. Some scholars consider this phenomenon as the redistribution and accumulation of salt on the surface, regardless of the irrigation duration [57]. Various factors, such as dripper discharge rates and meteorological conditions, contribute to these contrary conclusions. High dripper discharge rates can lead to faster irrigation than infiltration rates, driving salt accumulation on the bare strip surface [20,64]. Similarly, differences in evaporation and rainfall patterns influence the degree of salt leaching and accumulation [21,65]. This study analyzed the salt discharge effect in bare strips under different treatments based on typical planting patterns. Regarding different mulching widths, the lateral salt discharge effect of the LTP mode was significantly higher than that of other widths, with salt primarily concentrated in the 0–40 cm soil layer. This result may be attributed to the large volume of soil retained under the film in the WFM-220 cm treatment, reducing lateral water transport. Conversely, with limited coverage, the WFM-40 cm treatment facilitated more water transport downward, resulting in higher salt concentrations in the middle soil layer. Thus, there was no clear relationship between mulching width and lateral salt discharge under fixed irrigation frequencies and dripper flows. Concerning different spacing in bare strips, the lateral salt discharge effect did not significantly differ between LTP and SFM-90 cm modes. Still, LTP remained high, exhibiting higher lateral salt discharge than SFM-10 cm. This suggests that the lateral salt discharge effect does not increase with the increase in spacing in the bare strip but reaches the maximum at a certain extent, which indicates that the importance of the lateral water and salt movement is limited under specific irrigation and meteorological conditions, regardless of bare strip area. Similar conclusions have been drawn in previous studies, indicating that surface salinity increases in limited areas [24,66]. Finally, in different treatment modes within bare strips, the lateral salt discharge effect of the ridge tillage (TFM-RT) treatment did not significantly differ from that of LTP at 0–60 cm. However, TFM-RT exhibited significant surface salt accumulation at 0–10 cm, while TFM-D treatment showed the poorest desalination effect. This outcome may be attributed to ditching, which lowers geopotential height and shields the evaporation surface during cotton growth stages, particularly in the middle and late stages [67].
5. Conclusions
This study systematically analyzed and simulated soil water and salt transport characteristics under mulch film and bare strips across various planting patterns. Using the HYDRUS-2D model, we successfully predicted soil water and salt transport dynamics under field conditions, demonstrating the model’s reliability. Specifically, we applied this model to simulate water and salt transport in bare strips across seven planting modes, aligning simulation outcomes with measured values. Our findings revealed distinct patterns of soil salt distribution. Desalination occurred in the 0–40 cm soil layer beneath narrow rows, whereas wide rows and bare strips exhibited salt accumulation, particularly in the 0–60 cm soil layer. Notably, the surface of bare strips exhibited significantly higher salt content than deeper soil layers, often threefold higher than initial levels. Moreover, bare strips with extensive film coverage demonstrated improved soil moisture retention but exacerbated salt accumulation, posing a potential salinity threat. Further analysis showed that the lateral transport of salts in bare strips was not only influenced by the volume of wetted soil beneath drip tape but was also influenced by the space and tillage measure between the two mulches, with specific planting patterns exhibiting varying degrees of lateral salt discharge. For example, TFM-RT facilitated salt lateral surface aggregation more effectively than other treatments like LTP and ditching (TFM-D) (0–10 cm soil layer). Conversely, the SFM-10 cm treatment demonstrated superior water retention but limited lateral salt discharge, making it less conducive to practical production.
Additionally, we observed that the mulch ratio (the ratio between the width of the mulch and the space between the two mulches) and the tillage measure between the two mulches played crucial roles in shaping complex upper boundary conditions, influencing both vertical and horizontal water and salt transport in the soil. However, the interplay between these factors remains incompletely understood and warrants further investigation. Overall, our study sheds light on effective management strategies for mitigating secondary salinization, offering valuable insights for optimizing cropping patterns to maintain soil moisture while promoting surface salt accumulation in bare strips.
Author Contributions
Conceptualization, H.Z.; methodology, Y.S.; software, Y.Y.; validation, Y.Y. and L.Y.; formal analysis, Y.S. and Y.Y.; investigation, Z.Z.; resources, Y.L.; data curation, Y.S.; writing—original draft preparation, Y.S.; writing—review and editing, W.M., Z.Z., Y.L. and L.Y.; visualization, Y.L. and L.Y.; supervision, W.M.; project administration, H.Z.; funding acquisition, W.M. All authors have read and agreed to the published version of the manuscript.
Funding
This research was supported by the National Key R&D Program of China (2022YFE0119400, 2022YFD1900101, 2021YFD1900801-02).
Data Availability Statement
The original contributions presented in the study are included in the article, further inquiries can be directed to the corresponding author.
Conflicts of Interest
The authors declare no conflict of interest.
References
- Tian, F.; Wen, J.; Hu, H.; Ni, G. Review on water and salt transport and regulation in drip irrigated fields in arid regions. J. Hydraul. Eng. 2018, 49, 126–135. [Google Scholar]
- O’hara, S.L. Irrigation and land degradation: Implications for agriculture in Turkmenistan, central Asia. J. Arid. Environ. 1997, 37, 165–179. [Google Scholar] [CrossRef]
- Kang, S.; Hao, X.; Du, T.; Tong, L.; Su, X.; Lu, H.; Li, X.; Huo, Z.; Li, S.; Ding, R. Improving agricultural water productivity to ensure food security in China under changing environment: From research to practice. Agric. Water Manag. 2017, 179, 5–17. [Google Scholar] [CrossRef]
- Zhang, Z.; Hu, H.; Tian, F.; Hu, H.; Yao, X.; Zhong, R. Soil salt distribution under mulched drip irrigation in an arid area of northwestern China. J. Arid. Environ. 2014, 104, 23–33. [Google Scholar] [CrossRef]
- Dong, H.; Kong, X.; Luo, Z.; Li, W.; Xin, C. Unequal salt distribution in the root zone increases growth and yield of cotton. Eur. J. Agron. 2010, 33, 285–292. [Google Scholar] [CrossRef]
- Chen, M.; Kang, Y.; Wan, S.; Liu, S.-P. Drip irrigation with saline water for oleic sunflower (Helianthus annuus L.). Agric. Water Manag. 2009, 96, 1766–1772. [Google Scholar] [CrossRef]
- Kotb, T.H.; Watanabe, T.; Ogino, Y.; Tanji, K.K. Soil salinization in the Nile Delta and related policy issues in Egypt. Agric. Water Manag. 2000, 43, 239–261. [Google Scholar] [CrossRef]
- Rengasamy, P. World salinization with emphasis on Australia. J. Exp. Bot. 2006, 57, 1017–1023. [Google Scholar] [CrossRef] [PubMed]
- Guo, J.; Shi, W.; Li, J. Effects of Intercropping different halophytes in bare strips on soil water content, salt accumulation, and cotton (Gossypium Hirsutum) Yields in mulched drip irrigation. Appl. Ecol. Environ. Res. 2020, 18, 5923–5937. [Google Scholar] [CrossRef]
- Okur, B.; Orcen, N. Soil salinization and climate change. In Climate Change and Soil Interactions; Elsevier: Amsterdam, The Netherlands, 2020; pp. 331–350. [Google Scholar]
- Liang, J.-P.; Shi, W.-J. Cotton/halophytes intercropping decreases salt accumulation and improves soil physicochemical properties and crop productivity in saline-alkali soils under mulched drip irrigation: A three-year field experiment. Field Crops Res. 2021, 262, 108027. [Google Scholar] [CrossRef]
- Fu, Z.; Wang, P.; Sun, J.; Lu, Z.; Yang, H.; Liu, J.; Xia, J.; Li, T. Composition, seasonal variation, and salinization characteristics of soil salinity in the Chenier Island of the Yellow River Delta. Glob. Ecol. Conserv. 2020, 24, e01318. [Google Scholar] [CrossRef]
- Arunrat, N.; Pumijumnong, N.; Hatano, R. Practices sustaining soil organic matter and rice yield in a tropical monsoon region. Soil Sci. Plant Nutr. 2017, 63, 274–287. [Google Scholar] [CrossRef]
- Zakery-Asl, M.A.; Bolandnazar, S.; Oustan, S. Effect of salinity and nitrogen on growth, sodium, potassium accumulation, and osmotic adjustment of halophyte Suaeda aegyptiaca (Hasselq.) Zoh. Arch. Agron. Soil Sci. 2014, 60, 785–792. [Google Scholar] [CrossRef]
- Manousaki, E.; Kalogerakis, N. Halophytes present new opportunities in phytoremediation of heavy metals and saline soils. Ind. Eng. Chem. Res. 2011, 50, 656–660. [Google Scholar] [CrossRef]
- Ashraf, M.Y.; Ashraf, M.; Mahmood, K.; Akhter, J. Phytoremediation of Saline Soils for Sustainable Agricultural Productivity. In Plant Adaptation and Phytoremediation; Springer: Berlin/Heidelberg, Germany, 2010; pp. 335–355. [Google Scholar]
- Tan, S.; Wang, Q.; Xu, D.; Zhang, J.; Shan, Y. Evaluating effects of four controlling methods in bare strips on soil temperature, water, and salt accumulation under film-mulched drip irrigation. Field Crops Res. 2017, 214, 350–358. [Google Scholar] [CrossRef]
- Wang, L.; Wang, X.; Jiang, L.; Zhang, K.; Tanveer, M.; Tian, C.; Zhao, Z. Reclamation of saline soil by planting annual euhalophyte Suaeda salsa with drip irrigation: A three-year field experiment in arid northwestern China. Ecol. Eng. 2021, 159, 106090. [Google Scholar] [CrossRef]
- Qi, Z.; Zhang, T.; Zhou, L.; Feng, H.; Zhao, Y.; Si, B. Combined effects of mulch and tillage on soil hydrothermal conditions under drip irrigation in Hetao Irrigation District, China. Water 2016, 8, 504. [Google Scholar] [CrossRef]
- Zhang, M.; Dong, B.; Qiao, Y.; Yang, H.; Wang, Y.; Liu, M. Effects of sub-soil plastic film mulch on soil water and salt content and water utilization by winter wheat under different soil salinities. Field Crops Res. 2018, 225, 130–140. [Google Scholar] [CrossRef]
- Chen, N.; Li, X.; Šimůnek, J.; Zhang, Y.; Shi, H.; Hu, Q.; Xin, M. Evaluating soil salts dynamics under biodegradable film mulching with different disintegration rates in an arid region with shallow and saline groundwater: Experimental and modeling study. Geoderma 2022, 423, 115969. [Google Scholar] [CrossRef]
- Ning, S.; Zhou, B.; Shi, J.; Wang, Q. Soil water/salt balance and water productivity of typical irrigation schedules for cotton under film mulched drip irrigation in northern Xinjiang. Agric. Water Manag. 2021, 245, 106651. [Google Scholar] [CrossRef]
- Wang, X.; Yang, J.; Yao, R.; Xie, W.; Zhang, X. Manure plus plastic film mulch reduces soil salinity and improves Barley-Maize growth and yield in newly reclaimed coastal land, Eastern China. Water 2022, 14, 2944. [Google Scholar] [CrossRef]
- Liu, M.; Yang, J.; Li, X.; Liu, G.; Yu, M.; Wang, J. Distribution and dynamics of soil water and salt under different drip irrigation regimes in northwest China. Irrig. Sci. 2013, 31, 675–688. [Google Scholar] [CrossRef]
- Seo, B.-S.; Jeong, Y.-J.; Baek, N.-R.; Park, H.-J.; Yang, H.I.; Park, S.-I.; Choi, W.-J. Soil texture affects the conversion factor of electrical conductivity from 1,5 soil-water to saturated paste extracts. Pedosphere 2022, 32, 905–915. [Google Scholar] [CrossRef]
- Zhou, L.; Feng, H.; Zhao, Y.; Qi, Z.; Zhang, T.; He, J.; Dyck, M. Drip irrigation lateral spacing and mulching affects the wetting pattern, shoot-root regulation, and yield of maize in a sand-layered soil. Agric. Water Manag. 2017, 184, 114–123. [Google Scholar] [CrossRef]
- Allen, R.G.; Pereira, L.S.; Raes, D.; Smith, M. Crop Evapotranspiration-Guidelines for Computing Crop Water Requirements-FAO Irrigation and Drainage Paper 56; FAO: Rome, Italy, 1998; Volume 300, p. D05109. [Google Scholar]
- Li, H.; Yi, J.; Zhang, J.; Zhao, Y.; Si, B.; Hill, R.L.; Cui, L.; Liu, X. Modeling of Soil Water and Salt Dynamics and Its Effects on Root Water Uptake in Heihe Arid Wetland, Gansu, China. Water 2015, 7, 2382–2401. [Google Scholar] [CrossRef]
- Gao, Y.; Wu, P.; Zhao, X.; Wang, Z. Growth, yield, and nitrogen use in the wheat/maize intercropping system in an arid region of northwestern China. Field Crops Res. 2019, 167, 19–30. [Google Scholar] [CrossRef]
- Richards, L.A. Capillary conduction of liquids through porous mediums. Physics 1931, 1, 318–333. [Google Scholar] [CrossRef]
- Hanson, B.; Hopmans, J.W.; Simunek, J. Leaching with subsurface drip irrigation under saline, shallow groundwater conditions. Vadose Zone J. 2008, 7, 810–818. [Google Scholar] [CrossRef]
- Van Genuchten, M.T. A closed-form equation for predicting the hydraulic conductivity of unsaturated soils. Soil Sci. Soc. Am. J. 1980, 44, 892–898. [Google Scholar] [CrossRef]
- Simunek, J.; Hopmans, J.W. 1.7 parameter optimization and nonlinear fitting. In Methods of Soil Analysis: Part 4 Physical Methods; Soil Science Society of America, Inc.: Madison, WI, USA, 2002; Volume 5, pp. 139–157. [Google Scholar]
- Mahey, R.K.; Feyen, J.; Wyseure, G. A numerical analysis of irrigation treatments of barley with respect to drainage losses and crop response. Trans. ASAE 1984, 27, 1805–1810. [Google Scholar] [CrossRef]
- Tayir, X.; Hu, Q.; Lu, X.; Zhang, J.; Song, L.; Zhu, Y.; Li, W.; Wang, Z. Analyses of temperature and light characteristics for drip irrigation under plastic film cotton canopy at blossoming and boll-forming stages. J. Shihezi Univ. Nat. Sci. 2006, 24, 671–674. [Google Scholar]
- Feddes, R.A. Simulation of field water use and crop yield. Soil Sci. 1978, 129, 193. [Google Scholar]
- Karandish, F.; Simunek, J. An application of the water footprint assessment to optimize production of crops irrigated with saline water: A scenario assessment with HYDRUS. Agric. Water Manag. 2018, 208, 67–82. [Google Scholar] [CrossRef]
- Vrugt, J.A.; Hopmans, J.W.; Simunek, J. Calibration of a two-dimensional root water uptake model. Fluid Phase Equilibria 2001, 65, 1027–1037. [Google Scholar] [CrossRef]
- Ramos, T.; Šimůnek, J.; Gonçalves, M.; Martins, J.; Prazeres, A.; Pereira, L. Two-dimensional modeling of water and nitrogen fate from sweet sorghum irrigated with fresh and blended saline waters. Agric. Water Manag. 2012, 111, 87–104. [Google Scholar] [CrossRef]
- Radcliffe, D.E.; Simunek, J. Soil Physics with HYDRUS Modeling and Applications; CRC Press, Taylor & Francis Group: Boca Raton, FL, USA, 2010. [Google Scholar]
- Simunek, J.; Hopmans, J.W. Modeling compensated root water and nutrient uptake. Ecol. Model. 2009, 220, 505–521. [Google Scholar] [CrossRef]
- Hopmans, J.W.; Simunek, J.; Romano, N.; Durner, W. 3.6.2. Inverse Methods. In Methods of Soil Analysis: Part 4 Physical Methods; Soil Science Society of America, Inc.: Madison, WI, USA, 2002; Volume 5, pp. 963–1008. [Google Scholar]
- Gao, H.; Yan, C.; Liu, Q.; Ding, W.; Chen, B.; Li, Z. Effects of plastic mulching and plastic residue on agricultural production: A meta-analysis. Sci. Total Environ. 2019, 651, 484–492. [Google Scholar] [CrossRef]
- Jung, K.Y.; Kitchen, N.R.; Sudduth, K.A.; Lee, K.-S.; Chung, S.-O. Soil compaction varies by crop management system over a claypan soil landscape. Soil Tillage Res. 2010, 107, 1–10. [Google Scholar] [CrossRef]
- Nassar, I.N.; Horton, R. Salinity and compaction effects on soil water evaporation and water and solute distributions. Soil Sci. Soc. Am. J. 1999, 63, 752–758. [Google Scholar] [CrossRef]
- Tian, H.; Bo, L.; Mao, X.; Liu, X.; Wang, Y.; Hu, Q. Modelling soil water, salt and heat dynamics under partially mulched conditions with drip irrigation, using HYDRUS-2D. Water 2022, 14, 2791. [Google Scholar] [CrossRef]
- Wang, D.W.; Lv, T.; He, X.L.; Wang, M.M.; Xu, Q.; Bai, M. Effects of different film width on soil moisture and soil temperature of cotton. Water Sav. Irrig. 2018, 12, 33–37. [Google Scholar]
- Qi, Z.; Feng, H.; Zhao, Y.; Zhang, T.; Yang, A.; Zhang, Z. Spatial distribution and simulation of soil moisture and salinity under mulched drip irrigation combined with tillage in an arid saline irrigation district, northwest China. Agric. Water Manag. 2018, 201, 219–231. [Google Scholar] [CrossRef]
- He, J.; Li, H.; Kuhn, N.J.; Wang, Q.; Zhang, X. Effect of ridge tillage, no-tillage, and conventional tillage on soil temperature, water use, and crop performance in cold and semi-arid areas in Northeast China. Soil Res. 2010, 48, 737–744. [Google Scholar] [CrossRef]
- Ren, B.; Dong, S.; Liu, P.; Zhao, B.; Zhang, J. Ridge tillage improves plant growth and grain yield of waterlogged summer maize. Agric. Water Manag. 2016, 177, 392–399. [Google Scholar] [CrossRef]
- Peng, Z.; Wu, J.; Huang, J. Water and salt movement under partial irrigation in Hetao Irrigation district, inner Mongolia. J. Hydraul. Eng. 2016, 47, 110–118. [Google Scholar]
- Wang, Z.; Li, Z.; Zhan, H.; Yang, S. Effect of long-term saline mulched drip irrigation on soil-groundwater environment in arid Northwest China. Sci. Total Environ. 2022, 820, 153222. [Google Scholar] [CrossRef]
- Feng, G.-L.; Meiri, A.; Letey, J. Evaluation of a model for irrigation management under saline conditions: II. Salt distribution and rooting pattern effects. Soil Sci. Soc. Am. J. 2003, 67, 77–80. [Google Scholar] [CrossRef]
- Yuan, C.; Feng, S.; Huo, Z.; Ji, Q. Effects of deficit irrigation with saline water on soil water-salt distribution and water use efficiency of maize for seed production in arid Northwest China. Agric. Water Manag. 2019, 212, 424–432. [Google Scholar] [CrossRef]
- Selim, T.; Berndtsson, R.; Persson, M.; Somaida, M.; El-Kiki, M.; Hamed, Y.; Mirdan, A.; Zhou, Q. Influence of geometric design of alternate partial root-zone subsurface drip irrigation (APRSDI) with brackish water on soil moisture and salinity distribution. Agric. Water Manag. 2013, 117, 159. [Google Scholar] [CrossRef]
- Dou, C.-Y.; Kang, Y.-H.; Wan, S.-Q.; Hu, W. Soil Salinity Changes Under Cropping with Lycium barbarum L. and Irrigation with Saline-Sodic Water. Pedosphere 2011, 21, 539–548. [Google Scholar] [CrossRef]
- Liu, H.; Li, M.; Zheng, X.; Wang, Y.; Anwar, S. Surface salinization of soil under mulched drip irrigation. Water 2020, 12, 3031. [Google Scholar] [CrossRef]
- Huang, Y.; Chen, L.; Fu, B.; Huang, Z.; Gong, J. The wheat yields and water-use efficiency in the Loess Plateau: Straw mulch and irrigation effects. Agric. Water Manag. 2005, 72, 209–222. [Google Scholar] [CrossRef]
- Modaihsh, A.S.; Horton, R.; Kirkham, D. Soil water evaporation suppression by sandy mulches. Soil Sci. 1985, 139, 357–361. [Google Scholar] [CrossRef]
- Gale, W.J. Sandy fields traditional farming for water conservation in China. J. Soil Water Conserv. 1993, 48, 474–477. [Google Scholar]
- Zhang, Q.; Li, G.-Y.; Cai, F.-J. Effect of mulched drip irrigation frequency on soil salt regime and cotton growth. J. Hydraul. Eng. 2004, 9, 123–126. [Google Scholar]
- He, P.; Yu, S.; Zhang, F.; Ma, T.; Ding, J.; Chen, K.; Chen, X.; Dai, Y. Effects of Soil Water Regulation on the Cotton Yield, Fiber Quality and Soil Salt Accumulation under Mulched Drip Irrigation in Southern Xinjiang, China. Agronomy 2022, 12, 1246. [Google Scholar] [CrossRef]
- Wang, Z.; Fan, B.; Guo, L. Soil salinization after long-term mulched drip irrigation poses a potential risk to agricultural sustainability. Eur. J. Soil Sci. 2019, 70, 20–24. [Google Scholar] [CrossRef]
- Ma, L.; Ma, Y.; Liu, F.; Hong, M. Salt Transfer Law for Cotton Field with Drip Irrigation Under the Plastic Mulch in Arid Zone. Int. J. Eng. Manuf. 2011, 1, 31. [Google Scholar] [CrossRef][Green Version]
- Burns, I.G. A model for predicting the redistribution of salts applied to fallow soils after excess rainfall or evaporation. J. Soil Sci. 1974, 25, 165–178. [Google Scholar] [CrossRef]
- Wang, R.; Kang, Y.; Wan, S.; Hu, W.; Liu, S. Effect of Soil Matric Potential on Poplar Growth and Distribution of Soil Salt under Drip Irrigation in Saline-sodic Soil in Arid Regions. Irrig. Drain 2013, 31, 1–6. [Google Scholar]
- Ye, J.; Liu, H.; He, X.; Gong, P.; Aerlaguli, A.; Lu, H. Research on water and temperature change law under ditching and mulched drip irrigation. Water Sav. Irrig. 2017, 3, 1–7. [Google Scholar]
Disclaimer/Publisher’s Note: The statements, opinions and data contained in all publications are solely those of the individual author(s) and contributor(s) and not of MDPI and/or the editor(s). MDPI and/or the editor(s) disclaim responsibility for any injury to people or property resulting from any ideas, methods, instructions or products referred to in the content. |
© 2024 by the authors. Licensee MDPI, Basel, Switzerland. This article is an open access article distributed under the terms and conditions of the Creative Commons Attribution (CC BY) license (https://creativecommons.org/licenses/by/4.0/).