Abstract
Drought may considerably decrease the growth and yield of potatoes. Small tubers may have lower performance and be more sensitive to abiotic stresses than larger tubers. Since an increase in drought areas may be expected, the development of potato varieties with drought tolerance has become necessary. Two-year greenhouse experiments were conducted to test the drought tolerance of potato breeding lines (C103, C107, C20) with great osmotic stress tolerance. Minitubers with diameters of 25–35, 20–24, 15–19 and 10–14 mm were planted. Treatments were the optimal irrigated control (100%) and moderate and severe drought (60% and 20% of optimum water supply). To study the after-effects of drought, tubers from different treatments were planted separately the following year because seed tuber priming may increase drought tolerance. Seed tubers (25–35 mm), two irrigation treatments (control and severe drought), and two control cultivars were used in the second year. We observed the rate of emergence from day-after-planting (DAP) 20 to 30 and flowering from 48 to 54. NDVI measurements were performed on the DAP35-45-75. Plant height and fresh weight of aboveground biomass (AGB) were recorded on DAP76. Harvested tubers were counted, weighed, and size-categorized, and then the number and fresh tuber yield per plant (TN and TY) were calculated. Stress indices (SI) were calculated as percentages of the results of control plots to compare the responses of genotypes to drought stress. We found that each breeding line showed adequate drought tolerance, although only the C103 and C107 breeding lines were stable in in vivo conditions. SI values for tuber number/tuber yield were 103/57; 102/63; 83/52; 80/58 and 55/41 in C103, C107, C20, ‘Boglárka’ and ‘Desiree’ (the last two were control varieties), respectively. The size of the seed tuber significantly affected each character, and usually minitubers larger than 20 mm performed better than smaller ones. No significant after-effect of drought stress on the next generation was found. Although we found a positive correlation (r = 0.83) between NDVI values and yield parameters, the correlations in our study were not consistent in all genotypes and water treatments.
1. Introduction
The potato (Solanum tuberosum L., Solanaceae) is cultivated almost all over the world, and according to the yield amount produced worldwide, potatoes are the fourth most important staple food crop after corn, wheat and rice [1]. Although the largest proportion of nutrients in the tuber is the starch, it also contains other valuable nutrients, including vitamins (C, B1, B2, B6, B9), trace elements, dietary fibers and high-quality protein (approximately 2%) [2,3]. In addition to ascorbic acid, it also contains other important antioxidant compounds, such as carotenoids (lutein, zeaxanthin and violaxanthin). Due to its biologically active compounds, it can also play a significant role as a functional food in the prevention of cardiovascular diseases [4].
Potatoes can suffer from several biotic and abiotic stresses; thus, the impact of climate change on potato production is significant, as increasing temperatures, drought, and ion toxicity pose dangers to the yield of potatoes [5]. However, the main limitation of potato production is its sensitivity to drought [6]. Traditional cultivation techniques are insufficient to mitigate the effects of drought, and thus, the development of potato varieties with increased tolerance to abiotic stresses is crucial for competitive production in sub-optimal environments [7].
The water shortage significantly affects the morphological, physiological, and biochemical properties of the plants [8]. In potatoes, the drought stress may result in delayed or prolonged emergence and may also alter the time and duration of developmental stages (vegetative growth, flowering, tuber initiation, tuber bulking, maturity). Moreover, drought may cause significant tuber loss, with decreased tuber quality [9,10,11].
The negative stress effect of drought combined with heatwaves may hamper the emergence and then the development of the plant, which can result in a large yield loss of up to 50–70% [12,13]. Potato is less sensitive to drought during emergence due to the water content of the seed tuber. Seed tubers can serve as water sources [14], especially seed tubers larger than 50 g, which contain enough water for shoot growth [15]. However, some drought-sensitive potato genotypes responded to drought by delayed emergence [10]. The flowering time and rate may also be affected by drought; most frequently, delayed flowering was observed [9,16,17].
In general, early drought mainly plays a role in inhibiting the growth of stem length [18], and usually, the decreased plant height may be an early visible symptom of drought [6]. Although reduced potato plant heights have been reported most frequently [16,18,19], sometimes the phenomenon was only characteristic of drought-sensitive genotypes [20]. The decrease in shoot length may be accompanied by a decrease in the total aboveground growth; thus, the drought may significantly decrease both the fresh and dry shoot weight [21,22].
Altered physiological processes due to drought (e.g., reduced relative water content of leaves, stomatal conductance, transpiration rate, and finally, reduced net photosynthesis), along with the morphological changes, can all contribute to yield loss [8,23]. Tuber yield characteristics showed greater variability in response to drought than growth parameters [21]. Among yield parameters, the changes in tuber size distribution were found to be the most significant [11].
To ensure the food supply for the next generations, plant breeders should develop genotypes with excellent stress tolerance properties that can withstand extreme environmental factors (e.g., permanent water shortage, extremely high temperatures) [24,25,26,27,28]. Plants try to mitigate and avoid drought stress with extremely diverse adaptation options [29]. The physiological, morphological, cellular, and molecular changes induced by drought together support the most efficient adaptation of the plant to drought stress [30]. These abiotic limits present challenges for potato plants at various stages of their life cycle [31].
Due to its shallow root system, the cultivated potato is sensitive to stress caused by lack of water; however, it is an economical arable plant in terms of water use [32,33]. The sensitivity of the potato is influenced by the growth stage of the plant, and it is mainly observed during the early growth and tuberization periods [21]. Accordingly, the variability found in drought sensitivity between genotypes may partly relate to their maturity group because there are important interactions between the phenological stage of the plant (especially those related to tuberization, e.g., stolon development, tuber initiation, tuber bulking) and the timing of the water deficit [34]. Drought that occurred during the tuber bulking period was found to induce the greatest reduction in yield compared to other growth stages [33]. In addition to the timing of the water deficit, its duration and severity may also play an important role in the responses of genotypes to drought [34].
During potato breeding, once a population with high variability has been produced, the breeding value of the individuals must be tested, and genotypes suitable for further utilization must be selected based on some criteria. In the case of breeding varieties with high abiotic stress tolerance ability, the selection should be based on multi-characteristic evaluation [35]. In traditional breeding work, those morphological and physiological properties have been used as selection criteria, which may be significantly affected by drought [30,36,37]. Some traits may significantly be changed due to drought effects (e.g., effectiveness of light capturing, senescence of leaves, specific leaf area), although their role in the final yield may be less important [34].
Recently, several vegetation indices have been introduced into breeding work to detect the physiological status of plants under different conditions [38,39]. The normalized difference vegetation index (NDVI) is the most frequently used vegetation index in agriculture and provides information on the functioning of the leaves, making it an ideal tool for predicting the yield of tuber crops. Since extended drought conditions can cause plant drying and reduced production, NDVI serves as an indicator of photosynthetic active biomass. This non-invasive method, which involves measuring the NDVI value, is also useful for monitoring the state of potato vegetation under different growing conditions and is a suitable tool for detecting early abiotic stress by drought [40,41]. In the case of potatoes, the NDVI values measured at flowering correlated well (R2 = 0.67) with the number of tubers per plant, whereas the NDVI values measured later (at the yellowing stage) showed a good correlation with the tuber yield (g/m2) [42]. The potato yield prediction model containing NDVI values showed the highest correlation coefficient (R2) compared to models based on leaf area index (LAI) and fraction of photosynthetically active radiation (fPAR) (R2 = 0.84, 0.72 and 0.80, respectively) [43]. Moreover, in field experiments with different potato genotypes, NDVI values were good indicators of early drought stress [44]. This information can contribute to the development of strategies for mitigating the impact of stress on potato production [41]. Additionally, time-series NDVI data collected at different crop-growth stages or throughout the growing season have been proven to be a valuable predictor in crop yield models [45].
Moreover, in subsequent experiments where the same planting material has been studied, some after-effects of drought stress can be detected, which may be advantageous in coping with repeated stress. The phenomenon of “hardening” or “priming” has been known for a long time, which means that as a result of exposure to an abiotic or biotic stress, the stress response of plants may change later on, and the defense mechanism may become faster or stronger [46]. Changes controlled by the stress memory at different levels (organic, cellular, omics) help plants respond more effectively to repeated stress within or between generations [47]. Both the seed and plants can be primed [47], and vegetative organs, such as tubers, also may be primed [48]. In the background of this phenomenon, there are epigenetic changes induced by stress, which can be passed on to the next generation as “transgenerational memory” [49,50]. Different types of priming are used for seeds (hydro-, halo-, osmo-, hormonal-, bio-, solid-matrix, etc., priming) [51], and for vegetative organs or whole plants (drought, heat, cold, waterlogging, etc.) [52,53]. Even in the early 1960s, experiments were carried out with potatoes during which the sprouted tubers were exposed to water stress before planting in order to increase their drought tolerance [54]. Recently, it was proved that induced changes in the methylated region of the R3a resistance gene’s promoter led to modified resistance to late blight (Phytophthora infestans) in potato after its defense priming [55]. However, very few studies reported the in vivo experimental results of potato grown from seed tuber previously exposed to abiotic stress (primed) [56], and it was obvious that the effectiveness of priming was highly genotype-dependent [57]. We would like to find out if there is a positive after-effect of drought stress that can be beneficial by making the offspring of treated plants more tolerant to a water deficit than the offspring of untreated ones.
Our study is part of an ongoing potato breeding program (Figure 1). In our earlier study on in vitro osmotic stress tolerance experiments, we deduced the osmotic stress tolerance from the stress index (SI) value in the case of simple morphological parameters and survival of the shoot cultures of 27 potato breeding lines and two referent lines [58]. Laboratory methods for screening of potato genotypes make these processes easier and faster because there is no time limit. However, in vitro tests, which usually select for osmotic stress tolerance, must be followed by in vivo experiments as well in order to obtain correct information about the drought tolerance of different genotypes. Thus, it remains essential to carry out field selection on breeding lines remaining after in vitro selection [21], even if this has to be performed on fewer breeding lines. C103, C107 and C11 lines were chosen for further testing because they showed high SI values for studied growth characters, whereas the C20 line had a high survival rate under osmotic stress [58,59]. Thus, we continued the in vivo experiments to validate the in vitro results with minitubers in an open greenhouse, where there was only a foil roof to prevent natural precipitation. The first tuber generations of in vitro plantlets, so-called minitubers [60], are usually very small (approx. 10–30 mm), and the size of seed tubers can significantly influence many growth and developmental characteristics of potato plants. We performed these drought experiments using different-sized seed tubers because very few publications on the interaction between these factors have appeared in recent years [61,62] The plant height, the total yield and size distribution of produced tubers, as well as the time required for emergence and ripening, are all traits that may vary with seed tuber size [63]. Moreover, in unfavorable environmental conditions, the differences between minituber size categories may be more pronounced [64]; thus, we studied the drought response of potato breeding lines grown from different-sized seed tubers. Our breeding work combines the traditional methods, including bi-parental crosses and multi-trait selection techniques, to increase drought tolerance [35,65], but the first seedling generation was germinated under in vitro conditions, and then the maintenance of lines was performed using micropropagation [58].
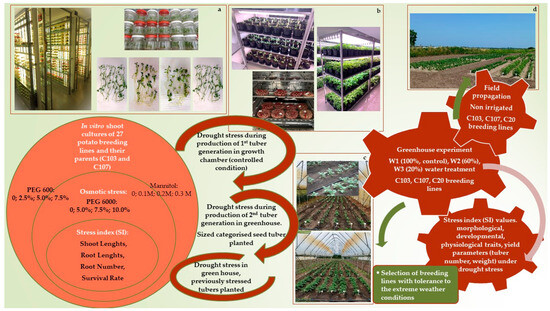
Figure 1.
Different stages of drought stress tolerance experiments during potato breeding work at the Research Institute of Nyíregyháza, Hungary. In vitro tests (a); experiments in growth chamber (b); experiments in greenhouse (c); propagation in field (d).
The primary focus of our research is to study the developmental stages and yield performance of potato genotypes under optimal water supply and drought conditions, and to facilitate the selection and cultivation of breeding lines that are resilient to extreme weather conditions.
Additionally, we have sought the simplest but most effective way to test the potato breeding lines in in vivo conditions to confirm in vitro results, considering the specific attributes of minitubers as the planting material. Based on our previous results, the specific aims and objects of this study were (i) to test the drought tolerance of three potato breeding lines in in vivo circumstances, applying three irrigation levels (optimal water supply, moderate and severe drought) on plots planted with different-sized seed tubers to find out the suitable seed tuber size for drought experiments; (ii) to record the rate of emergence and flowering, the plant height, the NDVI values, fresh and dry weight of aboveground biomass, number and weight of tuber yield of the breeding lines under different treatments to find suitable characters for distinguish genotypes; (iii) to detect the after-effect of drought hardening in the subsequent growing season; (iv) to reveal the breeding values of our breeding lines in comparison with control varieties.
2. Materials and Methods
2.1. Location of Experimental Site
This study was conducted at the Research Institute of Nyíregyháza, Institutes for Agricultural Research and Educational Farm, University of Debrecen, Hungary (47°97745′ N, 21°70446′ E). The in vivo experiments were carried out in two subsequent years. Local meteorological data provided information regarding growing conditions by the µMetos weather station from Pessl Instruments (Table 1). The soil type was humic sandy (1.52% humus; pH 6.32; P2O5: 231 mg kg−1, K2O 131 mg kg−1, NO3 + NO2 8.1 mg kg−1).

Table 1.
Local meteorological data (Hungary, Nyíregyháza).
2.2. Plant Material
In the first year, virus-free seed tubers (minitubers) of the second generation with diameters between 10 and 35 mm after in vitro shoot culture were used [66]. Three potato breeding lines, including C103, C107 and C20 (previously tested in in vitro conditions for their osmotic stress tolerance) were involved in the greenhouse trial (Figure 2). Our traditional breeding work is based on crossing with wild Solanum species with different drought and virus tolerances. Simultaneously, the same minitubers but larger in size (≥25 mm were also propagated and observed on the field. The C20 breeding line (originated from crossings of breeding lines C103 and C107) was selected because it showed a very high survival rate under osmotic stress [58]. The C103 breeding line belongs to the mid-early maturity group; it has a round oval tuber shape, red tuber skin, and yellow tuber flesh. The C107 breeding line is a late genotype with an oblong tuber shape, purple-pink skin, and white tuber flesh. Both are tolerant to late blight (Phytophtora infestans). Seed tubers were size-categorized according to the tuber diameter size: (1): 25–35, (2): 20–24, (3): 15–19, (4): 10–14 mm, before they were planted on 5–6 May 2021. The harvest was carried out on 27 September 2021 (Figure 2e,f).
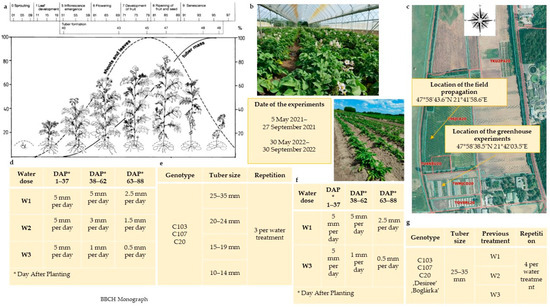
Figure 2.
Development stages of potato [67] (a), potato breeding lines in the flowering stage (b), potato propagation on field and location of the field propagation/greenhouse experiments (c), water treatments of Season1 (2021) (d), breeding line’s seed tuber diameter sizes and repetitions of Season1 (2021) (e) water treatments of Season2 (2022) (f), breeding line’s previous water treatments and repetitions of Season2 (2022) (g).
In the second year (2022), in addition to the breeding lines tested in the previous year (C103, C107 and C20), ‘Boglárka’ and ‘Desiree’ cultivars as reference varieties were involved in the experiment. ‘Desiree’ (registered in 1969) is a Dutch potato breed with red skin, yellow flesh, oval-to-long tuber shape, and moderate drought tolerance [21]. ‘Boglárka’ (registered in 2011) is a Hungarian potato variety with red skin, light yellow flesh, and long oval tuber shape, the peculiarity of which is that it can produce reliably even in non-irrigated conditions. The minitubers (in tuber diameter size of 25–35 mm) were planted on 30 May 2022, and the harvest was carried out on 30 September (Figure 2g).
In the first greenhouse experiment (Season1; 2021), potato minitubers of the breeding lines were planted, and the effect of seed tuber size and three water regime treatments (including optimal water supply control) in three repetitions were studied. In the second greenhouse experiment (Season2; 2022), the potato minitubers (C103, C107 and C20) harvested in the greenhouse experiment in 2021 were grouped according to previous water treatment. Only minitubers in the 25–35 mm size category were used for planting, and two water treatments were applied in four repetitions.
The minitubers were planted in plots of 3.0 m × 0.75 m with 0.25 m plant spacing, using a randomized block design. Twelve minitubers per plot were planted in the previously prepared ridges. Cultivation was carried out according to the regularly applied protocol for potatoes while paying attention to the appropriate plant protection.
2.3. Water Deficit Treatments and Production Methods
Season1: In the early stages of development (sprouting, leaf development; Figure 2a), in order to achieve a developmentally homogenous plant culture, the plants received water in the optimal quantity (5 mm per day) [68]. The water was supplied through a drip water dosing system (drip irrigation tape, flow 1.6 L/h and Conrad water meter, EU), as it was suggested to be the most effective irrigation method for potato [23]. From the 38th day after planting (DAP), we started water deficit treatments. Using a unique water measuring device: 5 mm per day (W1, 100%: control), 3 mm per day (W2, 60%) and 1 mm per day (W3, 20%) of water were added until DAP62. Because the potato is least sensitive to water stress during the tuber ripening stage (BBCH 81) [69], from the DAP63, we further reduced the amount of water by 50% (2.5; 1.5; 0.5 mm per day) to maintain the drought stress effect for an additional 25 days. Minitubers were propagated in the field plots without irrigation, with a plot size of 10 m × 0.75 m and plant spacing of 0.25 m.
Season2: The plots received the optimal amount of water (5 mm per day) until the desired initial development level was reached (DAP37). Then we started the water deficit treatments, 5 mm per day (W1: control) and 1 mm per day (W3). During the tuber repining stage, we further reduced the amount of water by 50% (2.5 and 0.5 mm per day)—the same method as the previous year.
2.4. Observations
The same observations were noted in both Season1 and Season2. We observed the rate of emergence (%) on the DAP20, DAP23, DAP28, and DAP30, and the rate of flowering (%) on the DAP48, DAP51, and DAP54 (%). The physiological state of the plants was assessed by measuring the NDVI value (4 measurements per plot) using the Trimble® GreenSeeker (Trimble Inc., Sunnyvale, CA, USA) handheld crop sensor. The device emits red (RED) and near-infrared (NIR) light onto the surface of the plant and then calculates an NDVI value (between 0.00 and 0.99) depending on the degree of reflection. The measurements were carried out at a distance of 50 cm from the plant foliage at the same time of day. We examined the effect of the water deficit on the photosynthetic activity of plants at a given developmental stage (on the DAP35, DAP45, DAP75). The plant height (cm) was measured on DAP76 (4 measurements per plot), and samples were collected to determine the aboveground biomass, i.e., weighting of fresh and dry weight of aboveground biomass (FwAGB and DwAGB, g per plant, respectively). The remaining foliage was removed by cut, and tuber yield was harvested on DAP102. The number of tubers per plant (TN) and fresh tuber yield (TY, kg per plant) were recorded. Then, stress indices (SI) were calculated as percentages of the results obtained on the control plots (Table 2) to compare the responses of the breeding lines to different levels of drought stress. According to the formula, the stress index (SI) is usually a maximum of 100, and the higher the value, the better the stress tolerance of the variety. Furthermore, we examined the changes in size (based on counting and weighting) of the harvested tubers of breeding lines as a result of the lack of water.
Table 2.
Equations for calculation stress indices (SI).
2.5. Data Analysis
Data collection for emergence rate (%) was performed four times (DAP20, DAP23, DAP28, DAP30) in three repetitions per treatment. Flowering rate data (%) were recorded three times (DAP48, DAP51, DAP54) in three repetitions per treatment, whereas NDVI data were collected three times (DAP35, DAP45, DAP75). The plant height (cm) was measured on DAP 76, and four measurements per plot were performed in three repetitions per treatment (total of 12 measurements). FwAGB and DwAGB (g per plant) were measured on samples in three repetitions per treatment. At harvest (DAP 102), fresh tuber weight was measured, and the number of tubers was counted for each plot (total and size-categorized) in three repetitions per treatment. The statistical analysis was carried out using IBM SPSS for WindowsTM 27 (IBM, New York, NY, USA). SI calculated from the fresh weight of aboveground biomass, the dry weight of aboveground biomass, plant height, tuber number and tuber yield were analyzed statistically by ANOVA followed by the Tukey-b test, which was used to determine significantly different means (p < 0.05%). Spearman’s correlation was performed by looking for the relations between tuber number-NDVI1,2,3 and yield-NDVI1,2,3 because some traits were not linearly correlated with each other.
3. Results
3.1. Results of the First-Year Experiment
In the first year, different-sized seed tubers of three breeding lines (C103, C107 and C20) were planted, and the plots were managed with three levels of water supply (W1, W2 and W3) from DAP 38. We looked for the (i) minituber size suitable for the establishment of a drought tolerance experiment and (ii) a water restriction treatment suitable for testing drought tolerance of potato genotypes under our agro-climatic and soil conditions.
3.1.1. Effect of Seed Tuber Size on the Emergence of Potato Plants
Growth and developmental characters already varied between tuber sizes before the application of the water withdrawn treatment, as well as in the control plots. In general, the shoot emergence from tubers in larger diameter size was faster than those of smaller size (Figure 3, Figure 4 and Figure 5). Even though these differences decreased as time progressed, eventually, there were differences in the degree of emergence, except for C103.
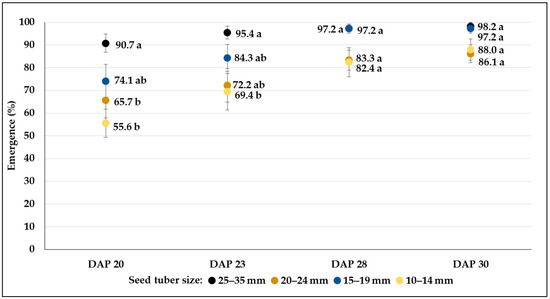
Figure 3.
The rate of emergence (mean% ± SE) from different-sized seed tubers of C103 breeding line, during a 10-day period under greenhouse conditions in control plots. Different letters indicate significant differences between means of plots planted with different seed tuber sizes within the same DAP (Tukey post hoc test; p < 0.05).
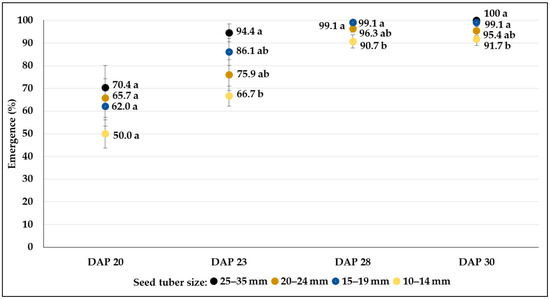
Figure 4.
The rate of emergence (mean% ± SE) from different-sized seed tubers of C107 breeding line during a 10-day period under greenhouse conditions in control plots. Different letters indicate significant differences between means of plots planted with different seed tuber sizes within the same DAP (Tukey post hoc test; p < 0.05).
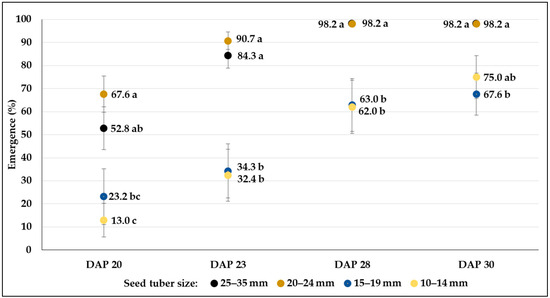
Figure 5.
The rate of emergence (mean% ± SE) from different-sized seed tubers of the C20 breeding line during a 10-day period under greenhouse conditions in control plots. Different letters indicate significant differences between means of plots planted with different seed tuber sizes within the same DAP (Tukey post hoc test; p < 0.05).
The final percentages of emergence were very similar in each genotype both under greenhouse and field conditions. Results varied between 86.1 and 98.2 in C103, whereas the breeding line C107 reached more than 90% in all size categories (Figure 3 and Figure 4). The smallest size category (10–14 mm) of clone C20 showed the weakest emergence (67.6%), which was significantly lower than the emergence rate of larger tubers (98.2%) (Figure 5). In the field conditions, where tubers larger than 25 mm were planted, fast emergence was observed in high percentages for all genotypes (95.3, 99.7 and 98.8% in C103, C107 and C20, respectively) (Table 3).
Table 3.
The rate of emergence from seed tubers larger than 25 mm during a 10 day period in field plots.
3.1.2. Effect of Seed Tuber Size on the Flowering Rate (%) of Potato Plants under Different Water Regimes
The flowering character was also affected by both the size of the seed tuber and the genotype (Figure 6). Except for the C20 breeding line, the plants developed from the tubers with 25–35 mm flowered at a significantly higher rate than the others, whereas plants from the smallest seed tubers (10–14 mm) flowered at the smallest percentage. The most abundant flowering was observed in the C103 (94.4%, 25–35 mm), whereas very few flowers were found in plots planted with seed tubers smaller than 20 mm in C20 (2.8%). Similarly, plants developed from seed tuber smaller than 20 mm produced flowers in a very low percentages in C107 (below 20%) (Figure 6). However, breeding lines produced flowers in the field condition in similar percentages (C103: 85.6%), or much fewer flowers (C107: 18.8%), or higher (C20: 70.3%) compared to greenhouse plants developed from the same seed tuber category (Table 4).
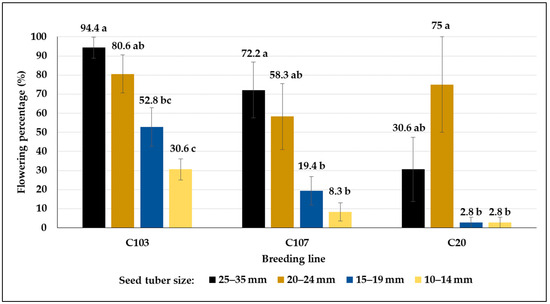
Figure 6.
Flowering percentages (mean% ± SE) of potato plants developed from different-sized tubers in the greenhouse experiments in control plots. Different letters indicate significant differences between means of plots planted with different seed tuber sizes within the same genotype (Tukey post hoc test; p < 0.05).
Table 4.
Flowering percentages (mean% ± SE) of potato plants with different genotypes in the field. Different letters indicate significant differences between means of plots planted with different genotypes within the same DAP (Tukey post hoc test; p < 0.05).
From the 38th day after planting (DAP), water deficit treatments (W2 and W3) were applied to test the responses of potato plants to drought. The drought period may affect the flowering characteristics, especially the date of flowering; in general, delayed flowering may be observed. In our experiments, the rate of flowering was affected by an interaction between the size of the seed tuber and the drought condition and genotype (Figure 7, Figure 8, Figure 9, Figure 10, Figure 11 and Figure 12, Table 5). In most cases, no relationship was found between the drought stress and the flowering rate or time. Although some variability in the flowering rate could be observed, and significant reduction was found in drought-treated plots e.g., when 20–24 mm-sized seed tubers were planted in C103, changes in the flowering rate were not correlated with the water supply in other plots. However, plots planted with the smallest tubers (10–14 mm) had the fewest flowering plants, and this was true for all treatments. Moreover, in the case of C107, no flower was found in W2 and W3 treatments (Figure 10 and Figure 11). The proportion of flowering plants was the highest in the plots planted with the largest seed tubers (25–35 mm) in all treatments, except for the control plots of the C20 breeding line (Table 5).
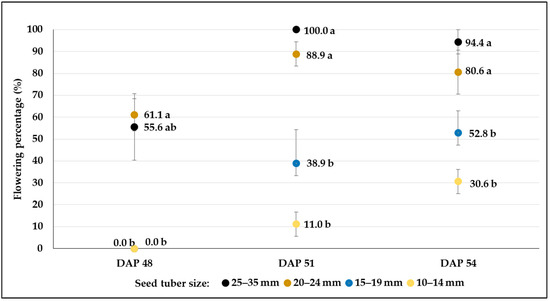
Figure 7.
Flowering percentages (mean% ± SE) of C103 potato breeding line developed from different-sized tubers in control plots (W1). Different letters indicate significant differences between means of plots planted with different seed tuber sizes within the same DAP (Tukey post hoc test; p < 0.05).
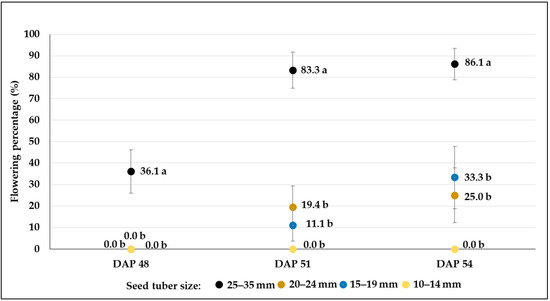
Figure 8.
Flowering percentages (mean% ± SE) of C103 potato breeding line developed from different-sized tubers in plots treated with moderate drought stress (W2). Different letters indicate significant differences between means of plots planted with different seed tuber sizes within the same DAP (Tukey post hoc test; p < 0.05).
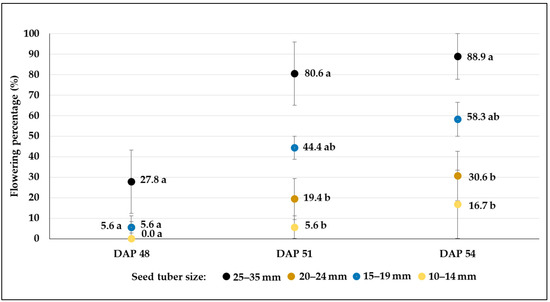
Figure 9.
Flowering percentages (mean% ± SE) of C103 potato breeding line developed from different-sized tubers in plots treated with severe drought stress (W3). Different letters indicate significant differences between means of plots planted with different seed tuber sizes within the same DAP (Tukey post hoc test; p < 0.05).
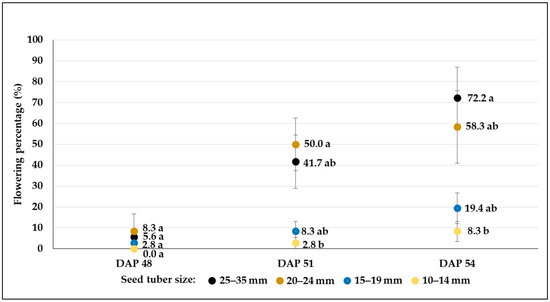
Figure 10.
Flowering percentages (mean% ± SE) of C107 potato breeding line developed from different-sized tubers in control plots (W1). Different letters indicate significant differences between means of plots planted with different seed tuber sizes within the same DAP (Tukey post hoc test; p < 0.05).
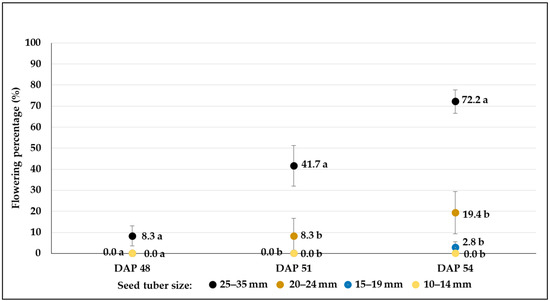
Figure 11.
Flowering percentages (mean% ± SE) of C107 potato breeding line developed from different-sized tubers in plots treated with moderate drought stress (W2). Different letters indicate significant differences between means of plots planted with different seed tuber sizes within the same DAP (Tukey post hoc test; p < 0.05).
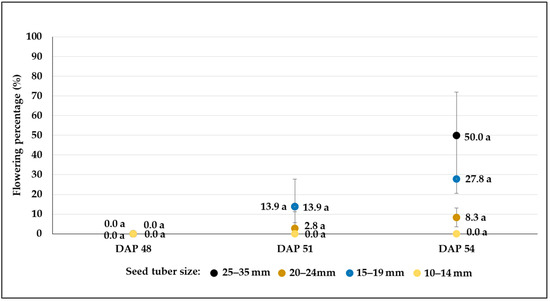
Figure 12.
Flowering percentages (mean% ± SE) of C107 potato breeding line developed from different-sized tubers in plots treated with severe drought stress (W3). Different letters indicate significant differences between means of plots planted with different seed tuber sizes within the same DAP (Tukey post hoc test; p < 0.05).
Table 5.
Flowering percentages (mean% ± SE) of the C20 potato breeding line developed from different-sized tubers in control plots (W1) in moderate drought treatment (W2) and severe drought treatment (W3). Different letters indicate significant differences between means of plots planted with different seed tuber sizes within the same DAP (Tukey post hoc test; p < 0.05). ns = non-significant.
3.1.3. Effect of Seed Tuber Size on the NDVI Results of Potato Plants under Different Water Regimes
NDVI measurements were taken three times (DAP: 35, 45 and 75), and the values increased as time progressed. However, differences could be detected between plants developed from different-sized tubers in the first and second observations in control plots. Results were significantly higher for plants developed from tubers larger than 20 mm compared to those developed from smaller tubers (Figure 13A–C). However, at the third (last) measurement, there were no significant differences in the case of the C103 potato breeding line.
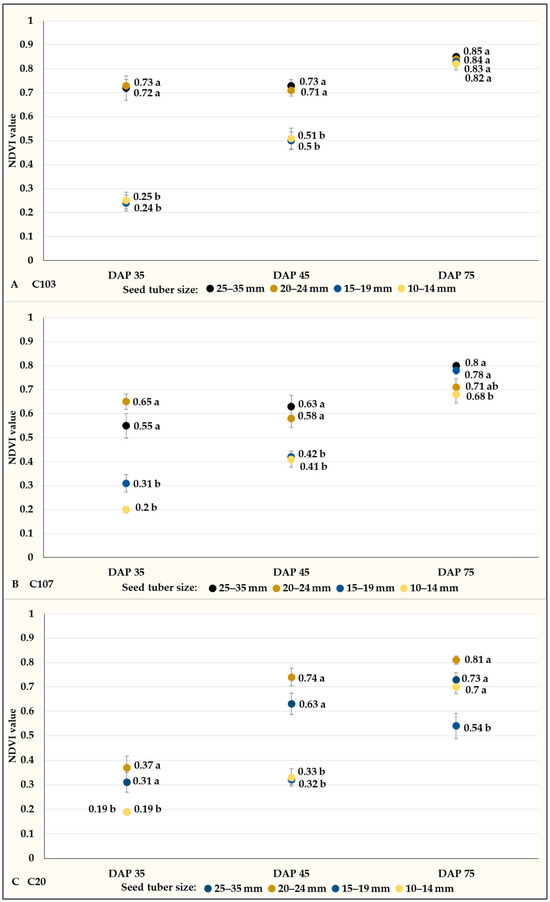
Figure 13.
NDVI values (mean% ± SE) of potato plants grown in the control plots of C103 (A), C107 (B), and C20 (C) potato breeding lines. Different letters indicate significant differences between means of plots planted with different seed tuber sizes within the same DAP (Tukey post hoc test; p < 0.05).
The effect of the water supply on NDVI values could be detected only on plants developed from seed tubers sized between 20 and 24 mm (Figure 14). The NDVI results obtained from the first and second measurements on control plots were significantly higher than those obtained from W2 and W3 treatments (Figure 14B,F,J). The NDVI values measured on plants grown from different-sized tubers (25–35 and 15–19 mm) did not show any variability. However, the NDVI results of potato plants developed from the smallest tuber (10–14 mm) tend to diverge again, although the differences were not proven to be significant.
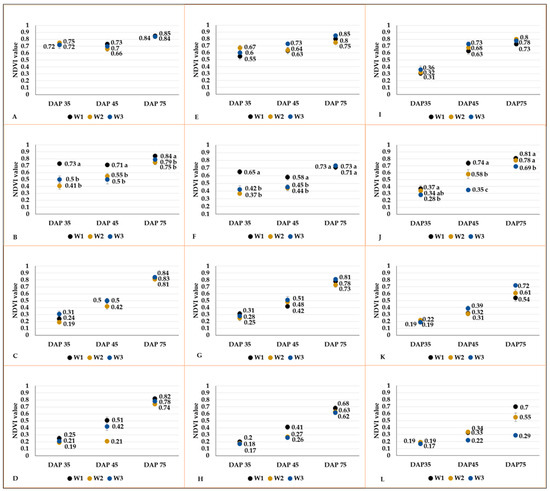
Figure 14.
NDVI values (mean value ± SE) of plants developed from different-sized tubers (25–30 mm: (A,E,I); 20–24 mm: (B,F,J); 15–19 mm: (C,G,K); 10–14 mm: (D,H,L)) under different water regimes in C103 (A–D), and C107 (E–H), and C20 (I–L) breeding lines. When it is relevant, the different letters indicate significant differences between means of plots managed with different water restriction treatments within the same DAP (Tukey post hoc test; p < 0.05).
We sought the relationships between the NDVI results and tuber yield parameters (tuber number and tuber weight). We found significant correlations, mainly in the case of C103 and C107 breeding lines. However, the time of measurement, the genotype and water restriction treatments were also significant factors influencing tuber number (TN) and tuber yield weight (TW) (Table 6). Although NDVI measurements can be promising in predicting tuber yield, the correlations in our study were not consistent in all genotypes and water treatments.
Table 6.
Relationships between NDVI values measured at different times (NDVI1: DAP 35, NDVI2: DAP 45; NDVI3: DAP 75) and tuber number (TN), and tuber yield (TY).
3.1.4. Effect of Seed Tuber Size on the Plant Height of Potato Plants under Different Water Regimes
We observed in our control plots that as the tuber size decreased, the plant height decreased, although the differences were not significant in all cases (Figure 15). However, the plant height of the C20 line developed from 20–35 mm-sized tubers was the same, whereas significantly shorter plants developed from tubers with diameters smaller than 20 mm.
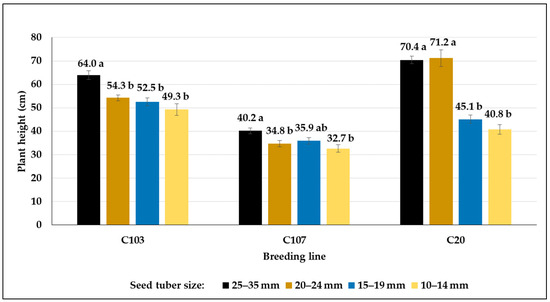
Figure 15.
The heights (mean cm ± SE) of potato plants developed from different-sized seed tubers of various breeding lines in control plots. Different letters indicate significant differences between means of plants grown from different-sized seed tuber within the same genotype (Tukey post hoc test; p < 0.05).
In our experiments, the SI values of plant height showed no significant effect on water deficit (Table 7). Although the C103 line showed slightly smaller plants in plots treated with W2 (SI values varied between 73.9 and 83), plants developed on plots treated with W3 were very similar in height to those grown in control plots (SI values were between 85 and 97.1). However, the growth of all C107 line plants was very similar to the control plants: they showed SI values that varied between 87.7 and 111.6 in the W2 treatment and between 87.2 and 109.6 in the W3 treatment. Moreover, no clear trend was detected in the SI values of plant height of the C20 line, although very low SI values (62.9 and 53.5 in W3 treatment) were obtained in the two size categories (20–24 and 10–14 mm, respectively).
Table 7.
SI values for the height of plants developed from different seed tuber sizes (TS) of breeding lines under water deficit conditions.
3.1.5. Effect of Seed Tuber Size and the Water Supply on the Final Aboveground Biomass and Its Dry Matter Yield
The plants developed from smaller seed tubers showed a tendency to produce less fresh weight of aboveground biomass (FwAGB; g per plant) compared to those developed from larger seed tubers, although statistically significant differences were not revealed (Table 8). Similarly, the total dry weight of AGB (DwAGB) did not show significant differences.
Table 8.
Effects of seed tuber size (TS) on the fresh aboveground biomass (FwAGB) and dry weight of above ground biomass (DwAGB) in control plots. ns = non-significant.
When drought stress occurred (W2 and W3 treatments), the FwAGB decreased in various proportions, as the SI values show (Table 9). In the case of the C107 line, SI values for FwAGB decreased with a decrease in seed tuber size in both W2 and W3 treatments. The other two breeding lines also responded with decreased FwAGB; however, no relationship could be revealed between SI values and seed tuber size. Among genotypes, the C103 breeding line was proven to be more drought-tolerant compared to others, and more inhibition could be detected in the W3 treatment compared to the W2 treatment in the cases of the latter (Table 9). The decreases in DwAGB were similar to changes in FwAGB, but—except for the C20 line—their relationships with the size of the seed tuber were more expressed than in FwAGB. Considering the SI values for DwAGB, the C107 genotype was proven to be more drought tolerant than the C103 and C20 breeding lines in the W3 treatment, whereas their SI values decreased in a similar way in the W2 treatment.
Table 9.
Effects of water deficit and seed tuber size (TS) on the SI values for fresh weight of aboveground biomass (FwAGB) and dry weight of aboveground biomass (DwAGB). Different letters mark the significant differences between SI values of the plants developed from different-sized seed tubers within the same genotypes and treatments. ns = non-significant.
3.1.6. Effect of Seed Tuber Size and the Water Supply on the Tuber Number, Fresh Tuber Yield and Size Distribution of Harvested Tubers
Yield parameters were only influenced by genotype, seed tuber size and drought stress because all planted minitubers were healthy and virus-free. Moreover, no other diseases occurred in plots due to regular plant protection. However, the soil was sandy soil, which may increase the effect of drought. The number of tubers (TN) slightly decreased as seed tuber size decreased (Table 8). The number of tubers was very similar when larger-than-20 mm seed tubers were planted, and they were significantly higher than those produced by plants from smaller seed tubers in the C103 and C107 breeding lines. Very few tubers were harvested from the C20 breeding line and their numbers showed similar decreasing trends. The C20 breeding line also showed the lowest performance considering tuber yield, which was very low (Table 10). The fresh tuber weight per plant also decreased as seed tuber size decreased; however, differences were not significant in all cases.
Table 10.
Effects of seed tuber size (TS) on the tuber number (TN) and fresh tuber yield (TY) of potato breeding lines in control plots (ns = non-significant).
The water restrictions caused a decrease in the number of tubers, but SI values were very varied without any obvious trends. In terms of tuber number, the C20 line was the most sensitive genotype to drought; in the W3 treatment its SI values were below 40.0 for all seed tuber size fractions, and no tuber could be harvested from plants developed from the smallest (10–14 mm) seed tubers (Table 11). When W3 treatment was applied the SI values for fresh tuber yield were lower than those for tuber number.
Table 11.
Effects of water deficit and seed tuber size (TS) on the SI values for tuber number (TN) and fresh tuber yield (TY). Different letters mark the significant differences between SI values of yield parameters of the plants developed from different-sized seed tubers within the same genotypes and treatments, ns = non-significant.
The harvested tubers were grouped into seven size categories (45<; 36–45; 25–35; 20–24; 15–19; 10–14 and <10 mm). We found that the proportion of the number of tubers grouped into different size categories was affected by all factors, including genotype, seed tuber size and water restriction (Table 12).
Table 12.
The proportion (%) of different-sized tubers in the harvested yield after size categorization of tubers was accounted for in each category. Effect of the genotypes, the seed tuber size and water deficit treatments on the size distribution of the harvested yield. Where the color is stronger, the value is higher.
Although most tubers were grouped into the 25–35 mm size category, followed by the 36–45 mm size category, the proportion of the largest (>45 mm) tubers decreased significantly when the W3 treatment was applied in the C103 breeding line compared to the W2 and control results. The fewest tubers were found to be in the smallest size category in all treatments (<10 mm). Very few large (>45 mm) tubers could be harvested in the C107 line plots, independent of the seed tuber size and drought treatment, and it never reached 6%. Most tubers of the harvested yield (in the average of all plots, it was 33.97%) were between 25 and 35 mm in the C107 breeding line. Only tubers smaller than 36 mm were produced by the C20 line; although, there were also very few tubers smaller than 10 mm, and most frequently, it was zero. From these results, we can assume that the size distribution of the tubers changed as a result of the drought in such a way that a proportion of larger tubers decreased, while a proportion of smaller tubers increased. However, only the portion of tubers larger than 45 mm decreased under drought treatments in the case of the C103 line. In contrast, although the number of tubers larger than 45 mm did not change under drought stress in the C107 line, the weight of this size category was decreased, suggesting that the specific weight of these tubers was decreased. No consistent changes could be detected in the C20 line.
When the tubers grouped into different size categories were weighted, a proportion of them was highly influenced by drought (Table 13). The effect of the water deficit could be more easily detected with decreased water supply as the percentage of large tubers in weight decreased in both C103 and C107 breeding lines.
Table 13.
The proportion (%) of different-sized tubers in the harvested yield after size categorization of tubers was weighted in each category. Effect of the genotype, the seed tuber size and water deficit treatments on the size distribution of the harvested yield. Where the color is stronger, the value is higher.
From the average of all the different-sized tubers planted, we found that the number of large tubers slightly decreased as the water deficit increased, and the size distribution of the harvested tubers was highly genotype-dependent (Figure 16).
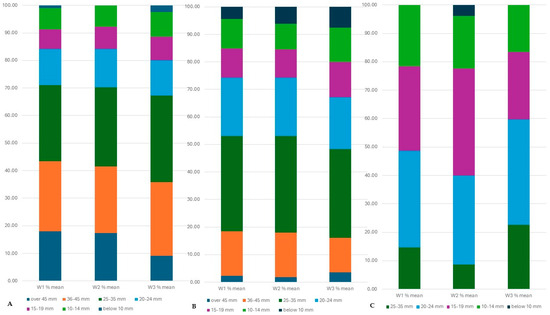
Figure 16.
The percentage of different-sized tubers in the total tuber yield under different water supply (from the average of all seed tuber sizes) in the C103 line (A), in the C107 line (B) and in the C20 breeding line (C). After harvest, the tubers were categorized by their size and tubers were counted in each category.
After harvesting, the tubers were grouped into size categories, and the tubers in each category were counted and weighed. A greater decrease in the proportion of large tubers can be detected due to the drought if we consider not only the number of tubers but also their weight (Figure 17).
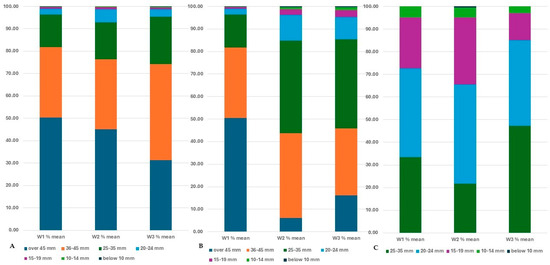
Figure 17.
The percentage of different-sized tubers in the total tuber yield under different water supply (in the average of all seed tuber size), in the C103 line (A), in the C107 line (B) and in the C20 breeding line (C). After harvest tubers were categorized by their size and tubers were weighted in each category.
3.2. Results of the Second-Year Experiment
Based on the results of the first-year experiments, the drought tolerance experiment was continued. The tuber yield of the first year was grouped according to the drought stress treatment they received in the previous year. However, only one seed size category was selected (25–35 mm) to plant, and only one level of drought stress was applied (W3) for the drought stress treatment. We tested (i) the post-effect of drought stress on the growth, development and yield performance of potato plants under control and drought conditions; (ii) the performance of the breeding lines under control and drought conditions compared to control varieties to reveal their real drought stress tolerance ability.
3.2.1. Effect of the Previous Treatment on the Emergence of Potato Plants in the Second-Year Experiment
Until DAP28, there was no significant difference between the emergence percentages of plots planted by seed tubers and those previously treated differently by water restrictions (Table 14). However, the final percentage of the C107 line from the W2 treatment was significantly higher than those from W3, as was observed on DAP 35. Similarly, in the case of the C20 line, the final emergence percentage of shoots from the W2-treated tubers was higher than those of other treatments, although the difference was only significant when compared to the control.
Table 14.
The percentage of emergence of shoots from tubers previously exposed to previous different water restriction treatments. Different letters indicate significant differences between means of plots planted with seed tubers treated differently in the past (within the same DAP (Tukey post hoc test; p < 0.05)).
In contrast, we found significant differences in the emergence rates of different genotypes when the mean breeding line results (in the average of all previous treatments) were compared to the controls (Figure 18). The highest percentages were found in the C107 line, followed by ‘Desiree’ and ‘Boglárka’, whereas the lowest percentages were registered in C20.
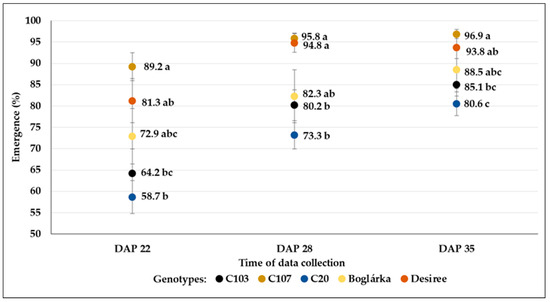
Figure 18.
The percentage of shoot emergence (mean % ± SE) from tubers of different genotypes (in the case of breeding lines, the mean results are in the average of all previous water restriction treatments). Different letters indicate significant differences between means of genotypes within the same DAP (Tukey post hoc test; p < 0.05).
3.2.2. Effect of the Previous Treatments and Drought Stress on the NDVI Results Measured in the Second-Year Experiment
The previous water restriction treatments did not result in any significant changes in the NDVI results, neither in the control (W1) nor in drought stress treatment (W2) (Figure 19 and Figure 20). However, differences could be detected between the NDVI results of potato genotypes in both treatments: we measured significantly higher values in C103 and C107 breeding lines in the control treatment compared to the control varieties. The NDVI results of ‘Boglárka’ and ‘Desiree’ were very similar in the control plots. Although ‘Boglárka’ showed higher NDVI values in drought stress compared to ‘Desiree’, the differences were not significant.
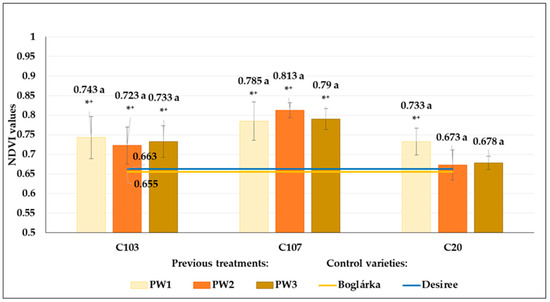
Figure 19.
The NDVI values of breeding lines (C103, C107 and C2) in control (W1) treatment. Plants developed from tubers of different previous water restriction treatments (PW1: optimum irrigated control; PW2: 60% of the optimum level; PW3: 20% of optimum level) compared to the control varieties (‘Boglárka’ and ‘Desiree’). The same letters indicate means belonging to the same homogenous group within a genotype, whereas * and + indicate the significantly different means from ‘Boglárka’ (yellow line) and ‘Desiree’ (blue line), respectively (Tukey post hoc test; p < 0.05). Bars show the means ± SE.
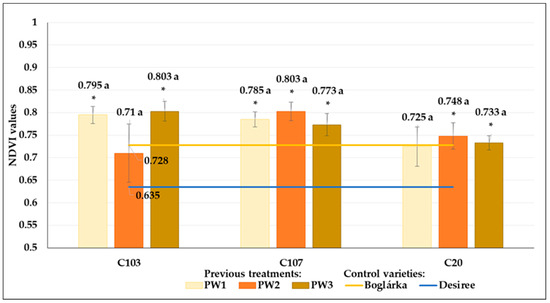
Figure 20.
The NDVI values of breeding lines (C103, C107 and C2) in drought stress (W2) treatment. Plants developed from tubers of different previous water restriction treatments (PW1: optimal irrigated control; PW2: 60% of optimum water supply; PW3: 20% of optimum water supply) compared to the control varieties (‘Boglárka’ and ‘Desiree’). The same letters indicate means belonging to the same homogenous group within a genotype, whereas * indicate the significantly different mean from ‘Boglárka’ (yellow line). Mean of ‘Desiree’ is shown by blue line (Tukey post hoc test; p < 0.05). Bars show the means ± SE.
Moreover, in drought conditions, the NDVI results of C103, C107 and C20 breeding lines (except for C20 seed tubers from previous W1 treatment) were significantly higher than those of ‘Desiree’ but did not differ significantly from ‘Boglárka’ (Figure 20).
3.2.3. Effect of the Previous Treatment and Drought Stress on the Plant Height in the Second-Year Experiment
In control plots, we found the highest plants in the case of the C103 line, whereas the plant heights of the C107 and C20 lines were slightly lower and very similar to each other, as well as the ‘Desiree’ control plants (Figure 21). However, the ‘Boglárka’ control plants were lower than C103 but higher than other genotypes. No post-effect of drought treatments could be detected.
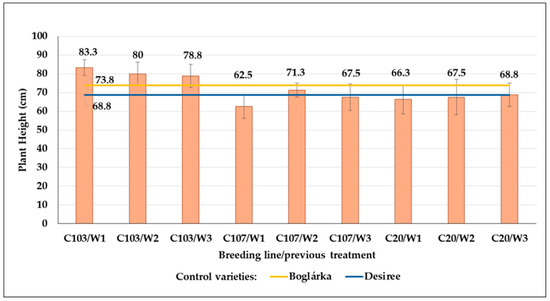
Figure 21.
The plant height (mean cm ± SE) of control plants (‘Boglárka’: yellow line, and ‘Desiree’: blue line) and breeding lines developed on seed tuber from previously treated plots with different drought stress.
High SI values were obtained in all breeding lines, and they were all on average above 80.0, whereas lower SI values were found in ‘Boglárka’ and ‘Desiree’. An increase in SI values of the C103 line could be detected as water stress increased in previous years; however, in the case of the C107 line, the change was just the opposite. The SI values of the C20 breeding line ranged between 87.0 and 90.6 without any substantial variability (Table 15).
Table 15.
The SI values for plant height in breeding lines grown from seed tubers previously treated with different water regimes, and SI values in control varieties (‘Boglárka’ and ‘Desiree’).
3.2.4. Effects of the Previous Treatment and Drought Stress on the FwAGB and DwAGB in the Second-Year Experiment
In the average of all previous treatments, the C103 breeding line produced the most FwAGB (684.3 g per plant), followed by C107 (617.0 g), and lowest FwAGB results were obtained with C20 (439.2 g) in the control plots. Results of the C103 line were higher than those of both control plants. The C107 breeding line performed better than ‘Boglárka’, whereas both control plants surpassed the C20 breeding line (Figure 22). The post-effect of previous drought treatments could be observed in C103 and C107 breeding lines: with an increase in drought stress, the FwAGB decreased. However, seed tubers from W3 treatments produced the highest FwAGB results in the C20 breeding line experimental plots.
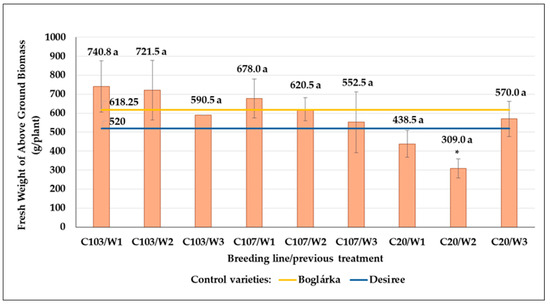
Figure 22.
The weight of fresh aboveground biomass of potato plants developed from tubers exposed to drought stress previously, and the control plants. AGB was harvested from control plots. The same letters indicate means belonging to the same homogenous group within a genotype, whereas * indicates the significantly different means from ‘Boglárka’ (yellow line), (Tukey post hoc test; p < 0.05), ‘Desiree’ (blue line) did not differ significantly from breeding lines. Bars show the means ± SE.
Considering the DwAGB, the ‘Boglárka’ control variety showed significantly higher results than those of other genotypes (Figure 23). Moreover, both C107 and C20 breeding lines show lower DwAGB results (in the average of all previous treatments, they were 88.0 and 74.0 g per plant, respectively) than both controls and the C103 line (in the average of all previous treatments, it was 103.5 g per plant).
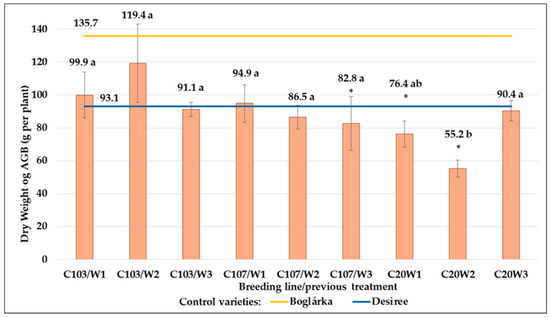
Figure 23.
The dry weight of aboveground biomass of potato plants developed from tubers exposed to drought stress previously, and the control plants. AGB was harvested from control plots. The same letters indicate means belonging to the same homogenous group within a genotype, whereas * indicates the significantly different means from ‘Boglárka’ (yellow line), (Tukey post hoc test; p < 0.05), ‘Desiree’ (blue line) did not show significant differences from the means of the breeding lines. Bars show the means ± SE.
The highest SI values were calculated in the case of the C107 breeding line for both characters, and they increased as previous drought stress increased. In contrast, the SI values decreased as previous drought stress increased in the case of the C20 breeding line. The lowest SI values were found in the ‘Boglárka’ variety’s control treatment for both parameters (FwAGB and DwAGB) (Table 16).
Table 16.
SI values for FwAGB and DwAGB under W3 treatment in breeding lines grown from seed tubers previously treated with different water regimes, and SI values in control varieties (‘Boglárka’ and ‘Desiree’). Different letters indicate significant differences between means of SI values of different genotypes (Tukey post hoc test; p < 0.05). ns = non-significant.
3.2.5. Effect of the Previous Treatment and Drought Stress on the Tuber Number and Tuber Yield in the Second-Year Experiment
Our breeding lines yielded significantly more tubers than control varieties in control plots. In the average of all previous treatments, the most tubers developed on the C20 line, followed by C103, then C107 lines (17.2; 15.1 and 14.7 tubers per plant, respectively). The post-effect of previous drought treatments was found in the number of C20 line’s tubers: it increased when W3 drought stress was applied previously; however, differences were not significant (Figure 24).
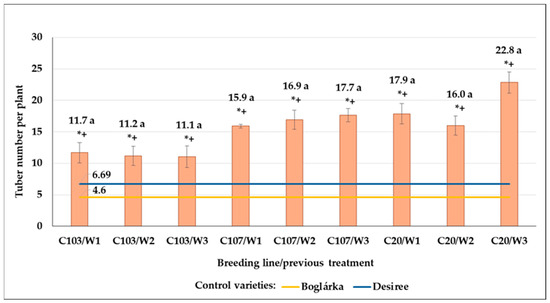
Figure 24.
The number of tubers per plant in control plots compared to the control varieties. Effect of previous drought treatments and genotype on the tuber number. The same letters indicate means belonging to the same homogenous group within a genotype, whereas * and + indicate the significantly different means from ‘Boglárka’ (yellow line) and ‘Desiree’ (blue line), respectively (Tukey post hoc test; p < 0.05). Bars show the means ± SE.
Considering the tuber yield weight, we found that only the C103 and C107 breeding lines produced significantly higher yields compared to both control varieties (723.3 and 586.7 g per plant, respectively). Despite the high number of tubers, the C20 breeding line produced a low tuber yield. Moreover, the stimulating effect of previous drought stress could be detected again, although only in the case of the W3 treatment and without significant differences (Figure 25).
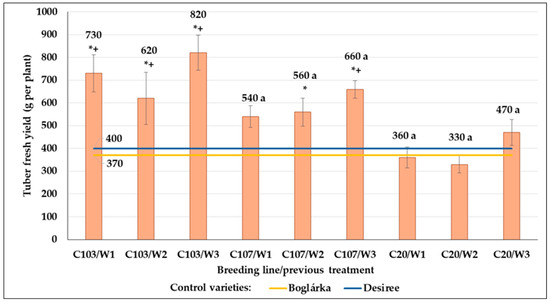
Figure 25.
The tuber yield (g per plant) in control plots compared to the control varieties. Effect of previous drought treatments and genotype on the tuber yield. The same letters indicate means belonging to the same homogenous group within a genotype, whereas * and + indicate the significantly different means from ‘Boglárka’ (yellow line) and ‘Desiree’ (blue line), respectively (Tukey post hoc test; p < 0.05). Bars show the means ± SE.
SI values for tuber number were the highest in C103 and C107 lines (102.8 and 101.6 in the average of all previous drought treatments, respectively). They did not respond to drought by tuber number decrease. The lowest SI value was found in ‘Desirée’. In the case of C107 and C20 lines, SI values of plants developed from tubers that originated from plants previously treated by W3 drought stress were lower than those obtained from other plots (Table 17).
Table 17.
SI values for tuber number and tuber yield weight in breeding lines grown from seed tubers previously treated with different water regimes, and SI values in control varieties (‘Boglárka’ and ‘Desiree’).
SI values for tuber yield weight were lower than those calculated for tuber number. The highest value was obtained in the C107 line, whereas ‘Desiree’ showed the least drought tolerance in this parameter. SI values of C103 and C20 breeding lines were similar to that of the ‘Boglárka’ variety (Table 17).
4. Discussion
In most of the world, the production of seed potato is based on minitubers, which may be the first or second tuber generation of virus-free in vitro plantlets [71,72]. Moreover, the production and maintenance of potato breeding lines also may occur as in vitro cultures, which make their fast multiplication possible [35,73]. Examination of the agronomic properties/values of the breeding lines, such as the response to biotic/abiotic stress, can be carried out both on in vitro shoot cultures and on their subsequent tuber generations [58,62,74,75]. The minitubers are very small, and together with several properties, the total tuber yield and the proportion of larger tubers are also higher if the size of the planted minituber is larger. However, even the smallest (10–14 mm) minitubers can be used for further propagation [76]. We found that all tested factors (genotype, seed tuber size and water supply level) may affect the studied characters, but the size of the seed tuber played very important roles in the growth and development of potato plants. In addition, changes found in some studied characters were not linked to drought consequently. However, SI values for both aboveground biomass and yield parameters of C103 and C107 breeding lines suggest their high drought tolerance compared to control varieties.
4.1. Emergence
Slow emergence is the main problem that may occur during the cultivation of minitubers, which is related to their size [77]. Shoots grow faster from larger tubers, even in the case of traditional seed tubers [63].
In this study, the emergence of potato minitubers was strongly affected by the size of seed tuber, and we observed a generally greater emergence rate for larger tubers (20–35 mm) than for smaller ones (10–19 mm). The higher growth rate of larger tubers may be due to the more metabolizable substances stored in the tubers, which may result in a faster emergence of larger tubers [78]. Moreover, minitubers being small tubers may have an extended dormant period, which also may result in prolonged emergence [79]. Although lighter minitubers showed slower sprout growth during the emergence period, their growth accelerated later [77], and even the final emergence percentages were the same in each size category for ‘Monta’, ‘Prelma’ and ‘Mandaga’ potato varieties [64]. Similarly, we also found that differences in the rate of emergence decreased over time.
Although the lowest emergence ratio was recorded for the C20 breeding line (10–19 mm), and the highest emergence was measured for all tuber sizes of the C107 breeding line, the effect of genotype on emergence was much less significant than the effect of tuber size. Our findings are similar to those reported earlier, when three genotypes (Ostara, Bintje and Elkana) were involved in field experiments. They also observed that the growth of shoots developed on minitubers was largely determined by seed tuber size, but the role of interactions with other factors, e.g., genotype, was of much lesser importance [80].
4.2. Flowering Characters
When the flowers appear and how many is mainly determined by day length and temperature; higher temperature and longer lighting increase the number of flowers [81]. Other factors may also play a role in the flowering performance of potato, such as plant density [82], night temperature [83], nutrient supply, including phosphorus and potassium [84], and genotype [78,85,86] In addition, the effect of seed tuber size was also reported; the larger the tuber size, the shorter the time to flowering [78].
We also found that the rate of flowering was highly affected by an interaction between the seed tuber size, genotype and drought condition. In all genotypes, we observed that the rate of flowering plants decreased with decreasing seed tuber size, although the relationship was linear only for the C103 (R2 = 0.811) line; however, a cubic model could be fitted best for C107 and C20 lines (R2 = 0.702 and 0.668, respectively). Comparing the genotypes, we found that the C103 breeding line showed the most abundant flowering, followed by C107 and C20 lines (65.0%, 39.3% and 27.8% flowering rates in the average of all seed tuber size, respectively). However, the least amount of flowers were observed on the C107 line in the field condition (18.8%).
The effect of water restriction could also be detected. The flowering rate decreased when water supply decreased in the case of C103 and C107 lines when larger than 20 mm seed tubers were planted and in the C20 line developed from 20–24 mm seed tubers. In other cases, no tendency or significant changes could be detected. According to the earlier reports, the length of time until flowering may increase or even decrease as a result of drought due to the interaction of other environmental factors. For example, the flowering occurred earlier by 10–14 days on the sandy soil compared to loamy soil, whereas the drought period resulted in 2–3 day shorter or longer flowering period, depending on the soil type and timing of water restriction [9]. Moreover, increasing the dry period from up to 25 days significantly delayed flowering in the ‘Russet Burbank’ variety, and it was found that some buds, which were previously initiated, died without opening due to the drought [16]. Similarly, drought induced a delayed (by 7 days) flower bud development in ‘Diacol Capiro’ variety but shortened the flowering period by 6 days both in ‘Pastusa Suprema’ and ‘Diacol Capiro’ varieties. However, no changes in flowering characters were observed in the case of ‘Esmeralda’ [17].
4.3. NDVI Results
There are several methods for studying the physiological condition of plants, including different types of vegetation indices. Among the multispectral image analysis, the methods related to the near-infrared (NIR) bands were proven to be the best for categorizing healthy and stressed plants [87]. The normalized vegetation index (NDVI) is one of the most common indices calculated from data collected with remote sensing methods based on differences in reflectance of visible and near-infrared bands from soil and plants [88]. The reason for the difference is primarily related to the chlorophyll content of the plant, as the absorption of chlorophyll radiation is high in the visible range while low in the NIR range [89]. Accordingly, the NDVI can be used to detect the effect of drought [44,90], the appearance of disease [91,92], the nutrient supply problems of plants [44], or the phytotoxicity effect of herbicide [93].
The intensive growth period of potatoes was characterized by an increase in NDVI values over time, and in the case of healthy plants, the maximum NDVI value (0.85) was measured approximately 63 days after planting a in sub-tropical area (Bangladesh) [94]. In our study, the maximum values were obtained 75 days after planting, and they were often under 0.85. The difference of more than 10 days is likely not only attributable to different environmental factors (mainly temperature differences), but slower initial development from smaller tubers may also play a role [64,78]. Results achieved in our experiments showed some variability due to the interactions between all factors existing (genotypes with different maturity, different diameter of seed tuber, different levels of water supply), which all contributed to form the yield. However, the NDVI values can be a useful trait to predict tuber yield since we found high and positive correlation (up to r = 0.83, p < 0.01) between NDVI results and yield parameters (tuber number, fresh tuber weight). However, correlations were not found in all treatments and were mainly limited to C103 and C107, and the strength of correlation was dependent on measurement timing. Thus, the proper timing of measurements should be selected from previous studies.
Similarly, the NDVI results measured in potato drought experiments were related to yield [95]. Even though the NDVI values can be valuable results for detecting the physiological state of plants and the state of stress, they were not sufficient by themselves to accurately predict the yield of potatoes in ‘Agria’ when the effect of calcium (Ca) biofortification was studied [96].
This measurement may be a very important tool for testing the performance of breeding lines under water stress because the yield loss caused by lack of water is mainly due to limited photosynthetic activity [97].
4.4. Plant Height
The plant height may be an interesting characteristic in drought experiments because higher plants may have more nodes with more leaf and leaflets, which means a larger assimilation surface [19]. In control plots, we found that plants grown from larger seed tubers were higher than those developed from smaller tubers, although the genotype also affected the final plant height (in the average of each seed tuber size, the plant height was 55.0, 35.9 and 56.9 cm in the C103, C107 and C20 breeding lines, respectively). The height of the plants increased significantly with the increase in the size of the seed tuber in the case of the ‘Desiree’ potato variety [98] and in ‘Jalene’, ‘Gudeine’ and ‘Kellacho’ varieties too; however, the genotype also significantly affected the final height of the plants [78]. The greater height of potato plants that develop from larger tubers is probably related to the fact that larger tubers store more nutrients than smaller ones [63].
In general, the potato plants may respond to drought stress with decreased plant height [6]. The drought-sensitive cultivar ‘Demon’ showed significantly smaller plants under drought conditions [19]. Similarly, the plant height of the ‘Russet Burbank’ variety was significantly decreased by a water deficit [15]. In our experiment, the breeding lines did not show a significant change in plant height due to the water deficit, which can perhaps be explained by its high drought tolerance resulting from its good osmotic stress tolerance [58]. The height of plants was very variable, which may cause the results to not sufficiently reflect the effect of drought. In general, early drought mainly plays a role in inhibiting the growth of stem length [18]. Similarly, Li et al. [16] also found that potato plants were very different in their height, and even though the negative effect of drought on growth was clearly detectable, they also observed in some cases that the final plant height in the water deficit treatments were larger than in the control plot. Boguszewska-Mańkowska et al. [20] also found that among potato cultivars involved in their experiments, only the most drought-sensitive ‘Lawenda’ variety developed significantly shorter shoots under drought conditions. During the evaluation of Andean potato varieties, it was also revealed that the plant height was more related to the potato genotype than to the extent of water deficit [17].
In the case of potatoes, there may be several strategies to mitigate the adverse effects of drought. These tactics can be implemented at different levels, including changes occurring at molecular (e.g., activation of stress-related genes), biochemical (e.g., accumulation of compatible solutes), and physiological levels (e.g., intensive root development) or even to the whole plant (e.g., water use efficiency) [23]. These strategies may be more effective after a drought priming treatment, which may lead to a reduction in drought symptoms [48]. However, in the second-year experiment, we did not detect any significant differences in plant height, between control plants and drought-treated plants, or between the plants developed from primed and non-primed seed tubers. However, plant height varied between potato genotypes in both experimental years.
4.5. Aboveground Biomass
Potato genotype highly influenced the aboveground biomass, but significantly larger shoot fresh weight was harvested on plots where plants developed from larger seed tubers. The same tendencies were reported for dry shoot weight [78]. In addition, the small seed tubers may contain less nutrients, they have few buds from which the main shoots develop, and all these factors may lead to lower vegetative growth and decreased AGB [63].
We also found that larger seed tubers produced larger aboveground biomass in the case of C103 and C20 potato breeding lines. No relationship between seed tuber size and AGB could be detected in the case of the C107 breeding line, although the highest result was obtained from the seed tubers with the largest size (25–35 mm). Similar decreases were observed in AGB dry weight in C103 and C20 lines, although differences were only significant between seed tuber size below and above 20 mm.
In general, the drought treatment significantly decreased the fresh and dry shoot weight in the field experiments when minitubers were tested including 21 potato cultivars. The fresh shoot weight varied between 101 and 980 g in control plots, whereas much lower results were obtained in the water-deficient (20% soil moisture content) plots (ranging from 16 to 77 g) [21]. We found that the moderate drought (W2) resulted in a comparable decrease in AGB for each genotype; SI values were about 85 in each breeding line in the average of all seed tuber sizes. In contrast, the C20 line responded to the stronger drought stress (W3) with the lowest SI value (64.7), whereas it was higher in the C107 line (73.1). Nevertheless, the SI value of C103 breeding line in W3 treatment results had a very close value to those obtained in W2 (83.7 and 86.5, respectively). The W2 treatment resulted in SI values between 80 and 86 for AGB dry weight in the average of all seed tuber sizes, whereas lower SI values were found in larger variability due to W3 treatment as follows: 72.3, 80 and 66.8 in the case of C103, C107 and C20 lines, respectively. Four potato cultivars with different maturity groups and drought tolerances (‘Désirée’, ‘Nicola’, ‘Monalisa’ and ‘Remarka’) were studied in field and greenhouse experiments, and it was concluded that the dry mass of the leaves decreased very significantly in all cases due to drought stress [22].
In the second-year experiment, the previous drought treatments did not result in tendentious changes in FwAGB or in DwAGB in control plots, but SI values for FwAGB were higher when previous drought stress was applied in C103 and C107 lines. However, only severe drought stress resulted in higher SI values for DwAGB in both breeding lines subsequently under W3 treatment.
Although, in optimal water supply, in the case of potato plants, aboveground development can be inferred from underground development in drought conditions, after the synchrony between aboveground and underground development breaks down, it is not possible to infer from the aboveground development to underground development [9].
4.6. Tuber Yield
Under water-restricted conditions several parameters of vegetative growth and yield of potato plants (including total biomass, tuber yield, dry matter content, tuber size and so on) may be decreased [15]. However, tuber yield traits are very important variables in studies on the response of potato genotypes to drought [21].
We observed that the number of tubers varied highly between genotypes in control plots, and the greatest amount of tubers developed in the C107 line followed by C103 and C20 lines: in the average of all seed tuber sizes, 18.6, 9.4 and 5.1 tubers per plant were produced, respectively. However, the total tuber weight was the highest in the C103 line (378 g per plant), followed by the C107 line (333 g per plant), and a very low yield (45 g per plant was harvested in C20 line’s plots (in the average of all seed tuber sizes). Although, the seed tubers smaller than 20 mm developed significantly fewer tubers than tubers larger than 20 mm; in general, with a decrease in the seed of minituber size, both the tuber yield and the number of tubers decreased, except for the C20 line. Similar results were reported for ‘Bintje’, ‘Ostara’ and ‘Elkana’ minituber performance [80].
Both the number of tubers and tuber weight decreased under drought stress when responses of 21 cultivars were tested in field experiments where minitubers were used as planting material. Under serious drought conditions (20% soil water capacity), responses of cultivars were highly variable, and yield was significantly decreased, whereas, under mild drought conditions (60% soil water capacity), the tuber yield did not decrease significantly in several cultivars [21]. Similar decreasing tendencies were reported considering the effect of drought on the number of tubers; however, in some cultivars an increased total number of tubers was observed, but they were smaller in size [6]. In our experiments, we applied water-restricted treatments during a period, including the tuber initiation phase, which plays an important role in the formation of final tuber yield.
In contrast to AGB, we observed that both the number of tubers and the tuber yield were significantly reduced even by moderate drought. In the average of all seed tuber sizes, the tuber number SI values were 74, 86 and 64.7 in C103, C107 and C20 lines, respectively, and almost the same tuber yield SI values were obtained. However, the SI values for tuber numbers were further decreased only in the C107 and C20 breeding lines under severe drought (W3 treatment), whereas this treatment resulted in increased tuber number (SI value was 84.7) in the C103 breeding line compared to those obtained on W2 treated plots (SI value was 74). Despite the higher number of tubers, the SI value of tuber yield in the C103 line in the W3 treatment was only 67.9, indicating that the size of the tubers was smaller than in the W2 treated plots—a similar phenomenon previously reported by other researchers [6]. In any case, in terms of tuber yield, the C20 breeding line proved to be the most sensitive to drought, showing very low SI values in the W3 treatment as follows: for tuber number, it was 22.6, whereas for tuber yield, it was 23.6.
The reasons for yield loss can be (i) fewer tubers or (ii) smaller tubers, or (iii) both fewer and smaller developed tubers [95]. We found that under moderate drought stress (W2), the number of tubers decreased to the same extent as the tuber weight for all cultivars (Table 18). In contrast, under severe drought conditions, the tuber weight reduction was significantly larger than tuber number reduction in C103 and C107 lines, whereas both yield parameters decreased at the same rate in the C20 breeding line.
Table 18.
SI values for tuber number and tuber weight in the average of all seed tuber sizes. Different letters indicate significant differences between means of SI values of different genotypes (Tukey post hoc test; p < 0.05). ns = non-significant.
Drought stress applied previously (priming or hardening) may affect the response of plants to water deficit in subsequent generations, and plants may be more resistant to stress [46]. This kind of stress memory has been studied also in potato earlier, and it was found that responses to priming were genotype-dependent. Among tested cultivars ‘Desiree’ did not show any differences between plants developed from primed and non-primed tubers in either control or drought stress conditions. However, ‘Unica’ and ‘Sarnav’ varieties produced significantly more tuber yield when developed from primed tubers compared to non-primed seed tubers [57]. We found that previous drought stress treatment showed no significant after-effect on the yield parameters, although in control plots, C107 and C20 lines developed from primed seed tubers tended to produce more tubers. The severe drought stress (W3 treatment) also resulted in slightly (not significantly) increased tuber yield weight compared to the optimal water supply and moderate drought exposure (W1 and W2 treatment). Moreover, under drought stress they do not show any increased tolerance considering their stress indices. When water deficit occurred at planting time, the number of tubers and yield increased in the same growing season in ‘White Rose’ as a result of the after-effects of early drought [56].
4.7. The Size Distribution of the Tubers in the Yield
Drought tolerance of potato breeding lines was first tested in in vitro experiments, and three tolerant lines were chosen for further study under in vivo conditions. When the planting material was minitubers, the most harvested tubers were calibrated in the class of larger than 25 mm, but there were also many tubers above 30 mm in the control (optimum water supply) treatment and in each tested genotype. However, when the water deficit treatment was applied, the highest frequency of tubers was in the size class of 20–25 mm, or 10–15 mm, or 15–20 mm, in the case of GIL19-03-07, ZIL19-02-43 and GIL19-03-29 breeding lines, respectively [62].
Similarly, we found that the size distributions of harvested tubers were highly influenced by genotype, by drought treatment and the size of seed tubers. We found that the proportion of larger tubers (both the number and weight) decreased as the water deficit increased in the C103 and C107 breeding lines. There was not this kind of trend in the C20 breeding line; however, it did not produce tubers larger than 35 mm. The small seed tubers may produce smaller AGB due to decreased vegetative growth, which may result in smaller-sized tubers in a larger proportion of the yield [63].
However, when seed tuber categories larger than 25 mm were compared, the effect of seed tuber size on the size distribution of the yield could no longer be detected, at least in the case of the ‘Jalene’, ‘Gudeine’ and ‘Kellacho’ varieties [78].
Furthermore, the quantity of large (marketable) tubers showed a very good correlation (r = 0.997) with the yield of different varieties under drought stress, so this feature was also recommended as a selection feature in breeding [99].
5. Conclusions
The changed growing conditions, due to climate change, make targeted breeding work against abiotic stressors crucial. Drought-induced physiological, morphological, cellular, and molecular changes facilitate plant adaptation, presenting challenges for potato plants through the growing season due to abiotic limitations. One of our aims of an ongoing breeding work is focused on studying potato genotypes in different developmental stages and the yield performance under drought conditions, aiming to select and then cultivate breeding lines resilient to extreme weather conditions. In addition to obtaining a comprehensive result of the performance of potato breeding lines under different environmental scenarios, our results also show that tuber size plays an important role in influencing various growth and development characteristics of potato plants, which can help farmers optimize tuber selection to increase yield and quality.
The size of the seed tuber played an important role in the observed characteristics, especially in the early development e.g., emergence, but significant differences could be detected in each parameter. The most frequent differences were found between seed tubers larger than 20 mm and smaller ones. Since vegetative propagating materials (such as tubers) are more sensitive to environmental effects than seeds, we assumed that drought treatment might result in a more effective adaptive strategy in the offspring. However, no significant effects of seed tuber priming were found in control plots or in drought-stressed plots. The observed characters, especially morphological, developmental and physiological parameters (plant height, rate of flowering, NDVI values), were more influenced by the size of seed tuber and genotypes than water treatments. The reason for this phenomenon is perhaps that the breeding lines had a very good drought tolerance, as was also seen in the comparison with the reference varieties. Nevertheless, only the C103 and C107 breeding lines proved to be stable in their drought resistance, whereas the performance of the C20 breeding line was not reliable, even if its osmotic stress tolerance was high in in vitro experiments. However, yield parameters, especially the size distribution, of tubers were highly influenced by each factor (genotype, seed tuber size and water restriction). Consequently, further research experiments should include the C103 and C107 lines and should focus on studying specific traits such as tuber yield parameters (number, weight and size) and the NDVI values collected in the proper developmental stages. In the case of potatoes, the timing of the drought treatment has a significant effect, and our experiments confirmed that the timing of the observations also plays a significant role. In order to better understand the potato’s drought tolerance strategy, not only the DAP should be taken into account when choosing the time of measurements in further experiments but the observations should be adjusted to the phenological stage determined in an exact way. Moreover, the size of the seed tubers should be larger than 20 mm and uniform in order to obtain correct and comparable results in terms of drought tolerance of different genotypes.
In the future, we are planning to test more breeding lines (i) using minitubers larger than 20 mm for planting and (ii) inducing severe drought stress (W3: water supply is 20% of well-watered level) on plots. Moreover, observations should only be focused on yield parameters, especially the size distribution of tubers, and on the exact measurements such as NDVI to save time and costs.
Author Contributions
Conceptualization, A.H. and L.Z.; methodology, A.H. and L.Z.; validation, L.Z., N.M.-D. and K.M.-T.; investigation, A.H.; data curation, A.H. and K.M.-T.; writing—original draft preparation, A.H.; writing—review and editing, A.H., L.Z., K.M.-T. and N.M.-D.; visualization, A.H. and N.M.-D.; supervision, L.Z. All authors have read and agreed to the published version of the manuscript.
Funding
This research received no external funding.
Data Availability Statement
Data are contained within the article.
Conflicts of Interest
The authors declare no conflicts of interest.
References
- FAO. World Food and Agriculture—Statistical Yearbook; FAO Statistics: Rome, Italy, 2023; p. 367. [CrossRef]
- Beals, K.A. Potatoes, Nutrition and Health. Am. J. Potato Res. 2019, 96, 102–110. [Google Scholar] [CrossRef]
- Tolessa, E.S. Importance, Nutrient Content and Factors Affecting Nutrient Content of Potato. Am. J. Food Nutr. Health 2018, 3, 37–41. [Google Scholar]
- Khalid, W.; Khalid, M.Z.; Tariq, A.A.A.; Ikram, A.; Rehan, M.; Bashir, S.Y.A.; Fatima, A. Nutritional composition and health benefits of potato. Adv. Food Nutr. Sci. 2020, 5, 7–16. [Google Scholar]
- Handayani, T.; Watanabe, K. The combination of drought and heat stress has a greater effect on potato plants than single stresses. Plant Soil Environ. 2020, 66, 175–182. [Google Scholar] [CrossRef]
- Nasir, M.W.; Toth, Z. Effect of Drought Stress on Potato Production: A Review. Agronomy 2022, 12, 635. [Google Scholar] [CrossRef]
- Handayani, T.; Gilani, S.A.; Watanabe, K.N. Climatic changes and potatoes: How can we cope with the abiotic stresses? Breed. Sci. 2019, 69, 545–563. [Google Scholar] [CrossRef] [PubMed]
- Ansari, W.A.; Atri, N.; Pandey, M.; Singh, A.K.; Singh, B.; Pandey, S. Influence of drought stress on morphological, physiological and biochemical attributes of plants: A review. Biosci. Biotech. Res. Asia 2019, 16, 697–709. [Google Scholar] [CrossRef]
- Hoelle, J.; Khan, A.; Asch, F. Drought affects the synchrony of aboveground and belowground phenology in tropical potato. J. Agron. Crop Sci. 2023, 210, e12675. [Google Scholar] [CrossRef]
- Ibrahim, S.; Naawe, E.K.; Çaliskan, M.E. Effect of Drought Stress on Morphological and Yield Characteristics of Potato (Solanum tuberosum L.) Breeding Lines. Potato Res. 2023, 67, 529–543. [Google Scholar] [CrossRef]
- Martínez, I.; Muñoz, M.; Acuña, I.; Uribe, M. Evaluating the Drought Tolerance of Seven Potato Varieties on Volcanic Ash Soils in a Medium-Term. Trial. Front. Plant Sci. 2021, 12, 693060. [Google Scholar] [CrossRef]
- Boyer, J.S. Plant Productivity and Environment. Science 1982, 218, 443–448. [Google Scholar] [CrossRef] [PubMed]
- Mittler, R. Abiotic stress, the field environment and stress combination. Trends Plant Sci. 2006, 11, 15–19. [Google Scholar] [CrossRef] [PubMed]
- Huntenburg, K.; Pflugfelder, D.; Koller, R. Diurnal water fluxes and growth patterns in potato tubers under drought stress. Plant Soil 2023, 14. [Google Scholar] [CrossRef]
- Ridwan, I.; Lisson, S.; Brown, P.; Padjung, R. Changes in planting environment due to climate change likely to affect the pre-emergent growth of potato (Solanum tuberosum L.) having different seed tubers physiological ages. IOP Conf. Ser. Earth Environ. Sci. 2019, 235, 012076. [Google Scholar] [CrossRef]
- Li, S.; Kupriyanovich, Y.; Wagg, C.; Zheng, F.; Hann, S. Water Deficit Duration Affects Potato Plant Growth, Yield and Tuber Quality. Agriculture 2023, 13, 2007. [Google Scholar] [CrossRef]
- Rodríguez, P.L.; Sanjuanelo, C.D.; Ñústez, L.C.E.; Moreno-Fonseca, L.P. Growth and phenology of three Andean potato varieties (Solanum tuberosum L.) under water stress. Agron. Colomb. 2016, 34, 141–154. [Google Scholar] [CrossRef]
- Hill, D.; Nelson, D.; Hammond, J.; Bell, L. Morphophysiology of Potato (Solanum tuberosum) in Response to Drought Stress: Paving the Way Forward. Front. Plant Sci. 2021, 11, 597554. [Google Scholar] [CrossRef] [PubMed]
- Nasir, M.W.; Toth, Z. Effect of drought stress on morphology, yield, and chlorophyll concentration of Hungarian potato genotypes. J. Environ. Agric. Sci. 2021, 23, 8–16. [Google Scholar]
- Boguszewska-Mańkowska, D.; Zarzyńska, K.; Wasilewska Nascimento, B. Potato (Solanum tuberosum L.) Plant Shoot and Root Changes under Abiotic Stresses—Yield Response. Plants 2022, 11, 3568. [Google Scholar] [CrossRef]
- Zaki, H.E.M.; Radwan, K.S.A. Response of potato (Solanum tuberosum L.) cultivars to drought stress under in vitro and field conditions. Chem. Biol. Technol. Agric. 2022, 9, 19. [Google Scholar] [CrossRef]
- Lahlou, O.; Ouattar, S.; Ledent, J.-F. The effect of drought and cultivar on growth parameters, yield and yield components of potato. Agronomy 2003, 23, 257–268. [Google Scholar] [CrossRef]
- Al-Taey, D.K.A.A.; Hussain, A.J. 4th International Conference of Modern Technologies in Agricultural Sciences. IOP Conf. Ser. Earth Environ. Sci. 2023, 1262, 042070. [Google Scholar] [CrossRef]
- Muthoni, J.; Shimelis, H. Heat and drought stress and their implications on potato production under dry African tropics. Aus. J. Crop Sci. 2020, 14, 1405–1414. [Google Scholar] [CrossRef]
- Gopal, J.; Iwama, K. In vitro screening of potato against water-stress mediated through sorbitol and polyethylene glycol. Plant Cell Rep. 2007, 26, 693–700. [Google Scholar] [CrossRef] [PubMed]
- Impa, S.M.; Nadaradjan, S.; Jagadish, S.V.K. Drought Stress Induced Reactive Oxygen Species and Anti-oxidants in Plants. In Abiotic Stress Responses in Plants; Ahmad, P., Prasad, M., Eds.; Springer: New York, NY, USA, 2012; pp. 131–147. [Google Scholar] [CrossRef]
- Monneveux, P.; Ramírez, D.A.; Pino, M.-T. Drought Tolerance in Potato (Solanum tuberosum L.): Can We Learn from Drought Tolerance Research in Cereals? Plant Sci. 2013, 205, 76–86. [Google Scholar] [CrossRef]
- Harkness, C.; Semenov, M.A.; Areal, F.; Senapati, N.; Trnka, M.; Balek, J.; Bishop, J. Adverse Weather Conditions for UK Wheat Production under Climate Change. Agric. For. Meteorol. 2020, 282, 107862. [Google Scholar] [CrossRef] [PubMed]
- Stark, J.C.; Love, S.L.; King, B.A.; Marshall, J.M.; Bohl, W.H.; Salaiz, T. Potato cultivar response to seasonal drought patterns. Am. J. Potato Res. 2013, 90, 207–216. [Google Scholar] [CrossRef]
- Obidiegwu, J.E.; Bryan, G.J.; Jones, H.G.; Prashar, A. Coping with drought: Stress and adaptive responses in potato and perspectives for improvement. Front. Plant Sci. 2015, 6, 542. [Google Scholar] [CrossRef] [PubMed]
- George, T.S.; Taylor, M.A.; Dodd, I.C. Climate Change and Consequences for Potato Production: A Review of Tolerance to Emerging Abiotic Stress. Potato Res. 2017, 60, 239–268. [Google Scholar] [CrossRef]
- Schafleitner, R.; Gutierrez, R.; Legay, S.; Evers, D.; Bonierbale, M. Drought Stress Tolerance Traits of Potato. In Proceedings of the 15th International Symposium of the International Society for Tropical Root Crops (ISTRC), Lima, Peru, 2–7 November 2009. [Google Scholar]
- van Loon, C.D. The effect of water stress on potato growth, development, and yield. Am. Pot. J. 1981, 58, 51–69. [Google Scholar] [CrossRef]
- Vos, J.; Haverkort, A.J. Chapter 16—Water Availability and Potato Crop Performance. In Potato Biology and Biotechnology: Advances and Perspectives; Vreugdenhil, D., Bradshaw, J., Gebhardt, C., Govers, F., Mackerron, D.K.L., Taylor, M.A., Ross, H.A., Eds.; Elsevier Science B.V.: Holland, Amsterdam, 2007; pp. 333–351. ISBN 9780444510181. [Google Scholar] [CrossRef]
- Bonierbale, M.W.; Amoros, W.R.; Salas, E.; de Jong, W. Chapter 6: Potato Breeding. In The Potato Crop Its Agricultural, Nutritional and Social Contribution to Humankind; Campos, H., Ortiz, O., Eds.; Springer: Cham, Switzeland, 2020; pp. 163–217. ISBN 978-3-030-28683-5. [Google Scholar] [CrossRef]
- Muthoni, J.; Kabira, J.N. Potato production under drought conditions: Identification of adaptive traits. Int. J. Hortic. 2016, 6, 12. [Google Scholar] [CrossRef]
- Qin, J.; Bian, C.; Liu, J.; Zhang, J.; Jin, L. An efficient greenhouse method to screen potato genotypes for drought tolerance. Sci. Hortic. 2019, 253, 61–69. [Google Scholar] [CrossRef]
- Gonzalez-Dugo, V.; Hernandez, P.; Solis, I.; Zarco-Tejada, P.J. Using High-Resolution Hyperspectral and Thermal Airborne Imagery to Assess Physiological Condition in the Context of Wheat Phenotyping. Remote Sens. 2015, 7, 13586–13605. [Google Scholar] [CrossRef]
- Romero, A.P.; Alarcón, A.; Valbuena, R.I.; Galeano, C.H. Physiological Assessment of Water Stress in Potato Using Spectral Information. Front. Plant Sci. 2017, 8, 1608. [Google Scholar] [CrossRef]
- Puiu, I.; Olteanu, G.; Morar, G.; Ianoşi, M. Monitoring the vegetation status of potato. Agric. Sci. Pract. 2012, 1, 81–82. [Google Scholar]
- Hermeziu, M.; Sorina, N.I.Ț.U. Efficiency And Suitability Of Non-Invasive Measurements For Potato Plants Grown in Greenhouse. AgroLife Sci. J. 2022, 11, 2. [Google Scholar] [CrossRef]
- Tanabe, D.; Ichiura, S.; Nakatsubo, A.; Kobayashi, T.; Katahira, M. Yield prediction of potato by unmanned aerial vehicle. In Proceedings of the 2019 International Conference on Trends in Agricultural Engineering, Prague, Czech Republic, 17–20 September 2019; pp. 540–546. [Google Scholar]
- Bala, S.K.; Islam, A.S. Correlation between potato yield and MODIS-derived vegetation indices. Int. J. Remote Sens. 2009, 30, 2491–2507. [Google Scholar] [CrossRef]
- Saravia, D.; Farfán-Vignolo, E.R.; Gutiérrez, R.; De Mendiburu, F.; Schafleitner, R.; Bonierbale, M.; Khan, M.A. Yield and Physiological Response of Potatoes Indicate Different Strategies to Cope with Drought Stress and Nitrogen Fertilization. Am. J. Potato Res. 2016, 93, 288–295. [Google Scholar] [CrossRef]
- Li, B.; Xu, X.; Zhang, L.; Han, J.; Bian, C.; Li, G.; Liu, J.; Jin, L. Above-ground biomass estimation and yield prediction in potato by using UAV-based RGB and hyperspectral imaging. ISPRS J. Photogramm. Remote Sens. 2020, 162, 161–172. [Google Scholar] [CrossRef]
- Bruce, T.J.A.; Matthes, M.C.; Napier, J.A.; Pickett, J.A. Stressful “memories” of plants: Evidence and possible mechanisms. Plant Sci. 2007, 173, 603–608. [Google Scholar] [CrossRef]
- Liu, H.; Able, A.J.; Able, J.A. Priming crops for the future: Rewiring stress memory. Trends Plant Sci. 2022, 7, 699–716. [Google Scholar] [CrossRef]
- Pissolato, M.D.; Martins, T.S.; Fajardo, Y.C.G. Stress memory in crops: What we have learned so far. Theor. Exp. Plant Physiol. 2024, 1–31. [Google Scholar] [CrossRef]
- Shanker, A.K.; Bhanu, D.; Maheswari, M. Epigenetics and transgenerational memory in plants under heat stress. Plant Physiol. Rep. 2020, 25, 583–593. [Google Scholar] [CrossRef]
- Bhar, A.; Chakraborty, A.; Roy, A. Plant Responses to Biotic Stress: Old Memories Matter. Plants 2022, 11, 84. [Google Scholar] [CrossRef] [PubMed]
- Rhaman, M.S.; Rauf, F.; Tania, S.S.; Khatun, M. Seed Priming Methods: Application in Field Crops and Future Perspectives. Asian J. Res. Crop Sci. 2020, 5, 8–19. [Google Scholar] [CrossRef]
- Liu, S.; Li, X.; Larsen, D.H.; Zhu, X.; Song, F.; Liu, F. Drought Priming at Vegetative Growth Stage Enhances Nitrogen-Use Efficiency Under Post-Anthesis Drought and Heat Stress in Wheat. J. Agron. Crop Sci. 2017, 203, 29–40. [Google Scholar] [CrossRef]
- Wang, X.; Liu, F.; Jiang, D. Priming: A promising strategy for crop production in response to future climate. J. Integr. Agric. 2017, 16, 2709–2716. [Google Scholar] [CrossRef]
- May, L.H.; Milthorpe, E.J.; Milthorpe, F.L. Pre-sowing hardening of plants to drought. An appraisal of the contributions by Genkel, A. Field Crop Abstr. 1962, 15, 93–98. [Google Scholar]
- Kuźnicki, D.; Meller, B.; Arasimowicz-Jelonek, M.; Braszewska-Zalewska, A.; Drozda, A.; Floryszak-Wieczorek, J. BABA-Induced DNA Methylome Adjustment to intergenerational Defense Priming in Potato to Phytophthora infestans. Front. Plant Sci. 2019, 10, 650. [Google Scholar] [CrossRef] [PubMed]
- Cavagnaro, J.B.; De Lis, B.R.; Tizio, R.M. Drought hardening of the potato plant as an after-effect of soil drought conditions at planting. Potato Res. 1971, 14, 181–192. [Google Scholar] [CrossRef]
- Ramírez, D.A.; Rolando, J.L.; Yactayo, W.; Monneveux, P.; Mares, V.; Quiroz, R. Improving potato drought tolerance through the induction of long-term water stress memory. Plant Sci. 2015, 238, 26–32. [Google Scholar] [CrossRef]
- Hanász, A.; Dobránszki, J.; Mendlerné Drienyovszki, N.; Zsombik, L.; Magyarné Tábori, K. Responses of Potato (Solanum tuberosum L.) Breeding Lines to Osmotic Stress Induced in In Vitro Shoot Culture. Horticulturae 2022, 8, 591. [Google Scholar] [CrossRef]
- Hanász, A.; Dobránszki, J.; Zsombik, L. Testing of primary and secondary tubers of potato parent and breeding lines with different osmotic stress tolerance in an isolated and greenhouse cropping system. Eltérő ozmotikus stressztoleranciájú burgonya szülő és nemesítési vonalak primer és szekunder gumóinak tesztelése izolált és fóliasátras termesztési közegben. Növénytermelés 2023, 72, 37–61. [Google Scholar]
- Kawakami, J.; Iwama, K. Effect of Potato Microtuber Size on the Growth and Yield Performance of Field Grown Plants. Plant Prod. Sci. 2012, 15, 144–148. [Google Scholar] [CrossRef]
- Kawakami, J.; Iwama, K.; Jitsuyama, Y. Soil water stress and the growth and yield of potato plants grown from microtubers and conventional seed tubers. Field Crops Res. 2006, 95, 89–96. [Google Scholar] [CrossRef]
- Cioloca, M.; Tican, A.; Bădărău, C.L.; Popa, M. Production of high-quality seed potatoes in protected area for true seed progenies, who showed tolerance to in vitro induced water stress. Sci. Pap. Ser. A Agron. 2022, 65, 235–244. [Google Scholar]
- Asnake, D.; Alemayehu, M.; Asredie, S. Growth and tuber yield responses of potato (Solanum tuberosum L.) varieties to seed tuber size in northwest highlands of Ethiopia. Heliyon 2023, 9, e14586. [Google Scholar] [CrossRef] [PubMed]
- Dimante, I.; Gaile, Z. Assessment of potato plant development from minitubers. Agron. Res. 2018, 16, 1630–1641. [Google Scholar]
- Jansky, S.H.; Spooner, D.M. The Evolution of Potato Breeding. Plant Breed. Rev. 2018, 41, 169–214. [Google Scholar] [CrossRef]
- Li, X.; Ramírez, D.A.; Qin, J.; Dormatey, R.; Bi, Z.; Sun, C.; Wang, H.; Bai, J. Water restriction scenarios and their effects on traits in potato with different degrees of drought tolerance. Sci. Hortic. 2019, 256, 108525. [Google Scholar] [CrossRef]
- Hack, V.H.; Gall, H.; Klemke, T.; Klose, R.; Meier, U.; Stauß, R.; Witzenberger, A. Phänologische Entwicklungsstadien der Kartoffel (Solanum tuberosum L.). Nachrichtenbl. Deut. Pflanzenschutzd. 1993, 45, 11–19. [Google Scholar]
- Haverkort, A.J. Water management in potato production. In Technical Information Bulletin 15; International Potato Center (CIP): Lima, Peru, 1982; pp. 1–22. [Google Scholar]
- Iqbal, M.M.; Shah, S.M.; Mohammad, W.; Nawaz, H. Field response of potato subjected to water stress at different growth stages. In Crop Yield Response to Deficit Irrigation; Kirda, C., Moutonnet, P., Hera, C., Nielsen, D.R., Eds.; Springer: Dordrecht, The Netherlands, 1999; pp. 213–223. [Google Scholar]
- Kpoghomou, B.K.; Sapra, V.T.; Beyl, C.A. Sensitivity to drought stress of three soybean cultivars during different growth stages. J. Agron. Crop Sci. 1990, 164, 104–109. [Google Scholar] [CrossRef]
- Hajiaghaei Kamrani, M.; Rahimi Chegeni, A.; Hosseinniya, H. Effects of Different Growing Media on Yield and Growth Parameters of Potato Minitubers (Solanum tuberosum L.). Commun. Soil. Sci. Plant Anal. 2019, 50, 1838–1853. [Google Scholar] [CrossRef]
- Buckseth, T.; Tiwari, J.K.; Singh, R.K.; Kumar, V.; Sharma, A.K.; Dalamu, D.; Bhardwaj, V.; Sood, S.; Kumar, M.; Sadawarti, M.; et al. Advances in innovative seed potato production systems in India. Front. Agron. 2022, 4, 956667. [Google Scholar] [CrossRef]
- Nahirñak, V.; Almasia, N.I.; González, M.N.; Massa, G.A.; Décima Oneto, C.A.; Feingold, S.E.; Hopp, H.E.; Vazquez Rovere, C. State of the Art of Genetic Engineering in Potato: From the First Report to Its Future Potential. Front. Plant Sci. 2022, 12, 768233. [Google Scholar] [CrossRef] [PubMed]
- Lindqvist-Kreuze, H.; Bonierbale, M.; Grüneberg, W.J. Potato and sweetpotato breeding at the International Potato Center: Approaches, outcomes and the way forward. Theor. Appl. Genet. 2024, 137, 12. [Google Scholar] [CrossRef] [PubMed]
- Hassanpanah, D. Evaluation of Potato Advanced Cultivars Against Water Deficit Stress Under in vitro and in vivo Condition. Biotechnology 2010, 9, 164–169. [Google Scholar] [CrossRef]
- Barry, P.; Clancy, P.C.; Molloy, M. The Effect of Seed Size and Planting Depth on the Yield of Seed Potatoes Grown from Minitubers. Ir. J. Agric. Food Res. 2001, 40, 71–81. [Google Scholar]
- Lommen, W.J.M. Effect of weight of potato minitubers on sprout growth, emergence and plant characteristics at emergence. Potato Res. 1994, 37, 315–322. [Google Scholar] [CrossRef]
- Ebrahim, S.; Mohammed, H.; Ayalew, T. Effects of seed tuber size on growth and yield performance of potato (Solanum tuberosum L.) varieties under field conditions. Afr. J. Agric. Res. 2018, 13, 2077–2086. [Google Scholar] [CrossRef]
- Dobránszki, J.; Magyarné Tábori, K.; Hudák, I. In Vitro Tuberization in Hormone-Free Systems on Solidified Medium and Dormancy of Potato Microtubers. Fruit. Veg. Cereal Sci. Biotechn. 2008, 2, 82–94. [Google Scholar]
- Lommen, W.J.M.; Struik, P.C. Field performance of potato minitubers with different fresh weights and conventional seed tubers: Crop establishment and yield formation. Potato Res. 1994, 37, 301–313. [Google Scholar] [CrossRef]
- Almekinders, C.J.M.; Struik, P.C. Shoot development and flowering in potato (Solanum tuberosum L.). Potato Res. 1996, 39, 581–607. [Google Scholar] [CrossRef]
- Almekinders, C.J.M. Flowering and true seed production in potato (Solanum tuberosum L.). 2. Effects of stem density and pruning of lateral stems. Potato Res. 1991, 34, 379–388. [Google Scholar] [CrossRef]
- Markarov, A.M. Causes of Flowering of Long-Day Potato Species under Short-Day and Cold-Night Conditions. Russ. J. Plant Physiol. 2002, 49, 465–469. [Google Scholar] [CrossRef]
- Zelalem, A.; Tekalign, T.; Nigussie, D. Response of potato (Solanum tuberosum L.) to different rates of nitrogen and phosphorus fertilization on vertisols at Debre Berhan, in the central highlands of Ethiopia. Afr. J. Plant Sci. 2009, 3, 16–24. [Google Scholar]
- Almekinders, C.J.M.; Wiersema, S.G. Flowering and true seed production in potato (Solanum tuberosum L.). 1. Effects of inflorescence position, nitrogen treatment, and harvest date of berries. Potato Res. 1991, 34, 365–377. [Google Scholar] [CrossRef]
- Tekalign, T.; Hammes, P.S. Growth and productivity of potato as influenced by cultivar and reproductive growth: I. Stomatal conductance, rate of transpiration, net photosynthesis, and dry matter production and allocation. Sci. Hortic. 2005, 105, 13–27. [Google Scholar] [CrossRef]
- Rahman, A.S.B.A.; Sebastian, P.; Izhar, L.I. Potato Crop Health Assessment Using Multispectral Image Analysis. In Proceedings of the 2022 International Conference on Future Trends in Smart Communities (ICFTSC), Kuching, Sarawak, Malaysia, 1–2 December 2022; pp. 151–157. [Google Scholar] [CrossRef]
- Huang, S.; Tang, L.; Hupy, J.P. A commentary review on the use of normalized difference vegetation index (NDVI) in the era of popular remote sensing. J. For. Res. 2021, 32, 1–6. [Google Scholar] [CrossRef]
- Knipling, E.B. Physical and physiological basis for the reflectance of visible and near-infrared radiation from vegetation. Remote Sens. Environ. 1970, 1, 155–159. [Google Scholar] [CrossRef]
- Maestrini, B.; Brouwer, M.; Been, T.; Lotz, L.A.P. Can We Use the Relationship Between Within-Field Elevation and NDVI as an Indicator of Drought-Stress? In IFIP Advances in Information and Communication Technology; Environmental Software Systems. Data Science in Action. ISESS 2020; Athanasiadis, I., Frysinger, S., Schimak, G., Knibbe, W., Eds.; Springer: Cham, Switzerland, 2020; Volume 554, pp. 122–131. [Google Scholar] [CrossRef]
- Atherton, D.; Choudhary, R.; Watson, D. Hyperspectral remote sensing for advanced detection of early blight (Alternaria solani) disease in potato (Solanum tuberosum) plants prior to visual disease symptoms. In Proceedings of the 2017 ASABE Annual International Meeting, Washington, DC, USA, 16–19 July 2017; pp. 1–10. [Google Scholar]
- Kundu, R.; Dutta, D.; Nanda, M.K.; Chakrabarty, A. Near Real Time Monitoring of Potato Late Blight Disease Severity using Field Based Hyperspectral Observation. Smart Agric. Technol. 2021, 1, 100019. [Google Scholar] [CrossRef]
- Andidi, H.M. High-Throughput Phenotyping to Evaluate Metribuzin Sensitivity of Potato (Solanum tuberosum L.). Master’s Thesis, Graduate Faculty of the North Dakota State University of Agriculture and Applied Science, Fargo, ND, USA, 2023. [Google Scholar]
- Islam, A.S.; Bala, S.K. Assessment of Potato Phenological Characteristics Using MODIS-Derived NDVI and LAI Information. GIScience Remote Sens. 2008, 45, 454–470. [Google Scholar] [CrossRef]
- Schafleitner, R.; Gutierrez, R.; Espino, R. Field Screening for Variation of Drought Tolerance in Solanum tuberosum L. by Agronomical, Physiological and Genetic Analysis. Potato Res. 2007, 50, 71–85. [Google Scholar] [CrossRef]
- Coelho, A.R.F.; Daccak, D.; Luís, I.C.; Marques, A.C.; Pessoa, C.C.; Brito, M.; Kullberg, J.; Simões, M.; Silva, M.M.; Pessoa, M.F. Can the Normalized Difference Vegetation Index Be Used for Yield Prediction in Solanum tuberosum L. Plants Biofortified with Calcium? Biol. Life Sci. Forum 2023, 27, 13. [Google Scholar] [CrossRef]
- Plich, J.; Boguszewska-Mańkowska, D.; Marczewski, W. Relations Between Photosynthetic Parameters and Drought-Induced Tuber Yield Decrease in Katahdin-Derived Potato Cultivars. Potato Res. 2020, 63, 463–477. [Google Scholar] [CrossRef]
- Adhikari, R.C. Performance of Different Size True Potato Seed Seedling Tubers at Khumaltar. Nep. Agric. Res. J. 2005, 6, 28–34. [Google Scholar] [CrossRef]
- Kebede, Z.; Mekbib, F.; Abebe, T.; Asfaw, A. Morpho-Physiological Traits of Potato (Solanum tuberosum L.) for Post-Flowering Drought Resistance. Agric. Sci. Dig. 2020, 40, 19–26. [Google Scholar] [CrossRef]


Disclaimer/Publisher’s Note: The statements, opinions and data contained in all publications are solely those of the individual author(s) and contributor(s) and not of MDPI and/or the editor(s). MDPI and/or the editor(s) disclaim responsibility for any injury to people or property resulting from any ideas, methods, instructions or products referred to in the content. |
© 2024 by the authors. Licensee MDPI, Basel, Switzerland. This article is an open access article distributed under the terms and conditions of the Creative Commons Attribution (CC BY) license (https://creativecommons.org/licenses/by/4.0/).