Abstract
The accurate assessment of the rise in nitrous oxide (N2O) under global changes in grasslands has been hindered because of inadequate annual observations. To measure the seasonal response of N2O emissions to increased water and nitrogen (N) deposition, one year round N2O emissions were investigated by chamber weekly in the growing season and every two weeks in the non-growing season in semi-arid temperate grasslands northern China. The results showed the temperate semi-arid grassland to be a source of N2O with greater variability and contribution during the non-growing season. The individual effects of water or N addition increased N2O emissions during the growing season, while the effects of water or N addition depended on the N application rates during the non-growing season. Soil properties, particularly soil temperature and water-filled pore space (WFPS), played key roles in regulating N2O emissions. Structural equation modeling revealed that these factors explained 71% and 35% of the variation in N2O fluxes during the growing and non-growing season, respectively. This study suggested that without observations during the non-growing season it is possible to misestimate the annual N2O emissions and the risk of N2O emissions increasing under global change. This would provide insights for future management strategies for mitigating greenhouse gas emissions.
1. Introduction
Over the past century, the dramatic increase in greenhouse gases has led to a series of climate changes [1]. As the third most important greenhouse gas, nitrous oxide (N2O) is a radiation-active trace gas with a global warming potential 273 times that of carbon dioxide. Its concentration increased from 270 ppb in 1750 to 316 ppb in 2018 [2]. Soil was generally agreed to be the major source of N2O [3,4]. Due to their large coverage, grasslands play an important role in global N2O emissions [5,6]. Moreover, it was reported that precipitation and nitrogen (N) deposition would accelerate nitrogen cycling, leading to increased production of soil N2O. Therefore, it is crucial for accurately assessing future greenhouse gas budgets by clarifying the response of N2O emissions to increasing precipitation and N deposition, along with the potential driving factors.
The effects of additional N on N2O emissions in grasslands during growing seasons have been widely examined [7,8]. Global scale meta-analyses showed that the averaged N2O emissions with N-fertilization was 5.16-fold that without additional N in grasslands [7]. The observation from previous growing seasons reported a linear correlation between N2O emissions and N application rates [9], though it was below the default N2O emission factor (EF, 0.5–1.6%) according to the IPCC [10]. The positive effects of increased N deposition on soil N2O emissions was suggested to result from the accelerated N cycling process. Previous studies reported positive and neutral effect of additional water supply on soil N2O emissions [11,12,13,14,15]. This varied response of N2O emissions to additional water was suggested to depend on the types of grassland and the quantity of treatments [16]. Rewetting was widely agreed to be one of the hot moments for microbial-driven N2O emissions, since water supply was one predominant factor for microbial activities [11,12]. Moreover, increased water would lift the availability of soil nutrients and activity of microorganisms, resulting in higher sensitivity of N2O emissions to additional N [9,16]. These results suggested a high risk of N2O emissions increasing during growing season under global change. However, the dynamics and contribution of N2O emissions during the non-growing season remain neglected [17,18,19].
Recent research has increasingly emphasized the contribution of soil N2O emissions during non-growing season, especially the contribution of freeze–thaw cycles to soil N2O emissions when temperatures are below 0 °C [18,20]. Some studies have also reported higher N2O emissions in spring, attributing to the recovery of microbial activity from low temperatures [17,21,22]. However, the temporal variation of non-growing season soil N2O emissions and their contribution to annual budget remain controversial due to the uncertainty of the microbial environmental tolerance and weather-driven hot moments, the impact of increased water and N deposition on N2O emissions during the non-growing season in semi-arid grassland remains unclear, though agricultural water and nitrogen management showed positive effects on soil N2O emissions in winter.
Temperate semi-arid grassland in Inner Mongolia, located in the central part of the Eurasian steppes, is constrained by limited water and N availabilities [23,24,25]. Due to global climate change and human activities, there has been an increase in precipitation and N deposition in the semi-arid grasslands of Inner Mongolia. However, inadequate annual observations hindered the accurate assessment of N2O under global changes in grasslands. Therefore, we investigated one year round N2O observations with long-term water and N addition treatments to (1) quantify the seasonal soil N2O emissions; (2) clarify the differences individual and interactive effects of water and N addition on growing/non-growing seasonal N2O emission budget; and (3) clarify the relationship between meteorological factors and soil properties.
2. Materials and Methods
2.1. Study Site
The experiment was carried out in a temperate semi-arid grassland in Inner Mongolia (43°34′ N, 116°41′ E; 1225 m.a.s.l.), northern China (Figure 1A). This site is characterized as a continental semi-arid temperate climate where the mean annual temperature was 2.3 °C with the lowest monthly temperature as −21.2 °C in January and highest monthly temperature as 19.3 °C in August, and the mean annual precipitation was 350 mm, primarily occurring from June to September. The constructive species plants were mainly Leymus chinensis and Stipa grandis. The soil in this site was classified as a dark chestnut soil (Chinese classification) or Calcic-Orthic Aridisol (Calcic Chernozem according to ISSS Working Group RB 1998), which is characterized by a particle size distribution of 21% clay, 19% silt and 60% sand.
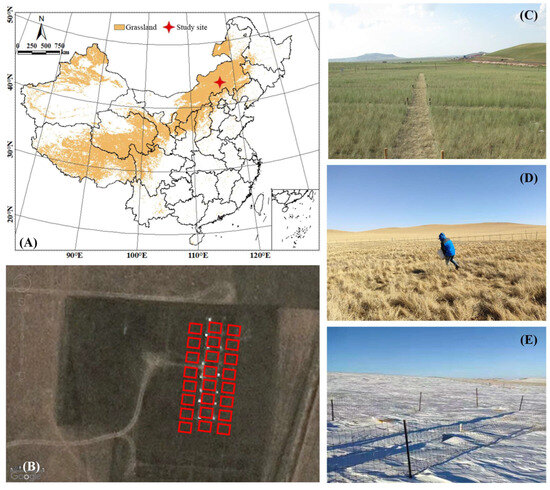
Figure 1.
Location of study site marked by red star (A), land cover based on MCD12Q1 in September (B), and the plots in growing (C) and non-growing (D,E) seasons at the study site.
2.2. Experimental Design
This study has adopted a randomized complete block design with three blocks as replicates since 2014 (Figure 1B). Three duplicate blocks were set independently. For each block, eight treatments combined with four levels of N treatment and two levels of precipitation treatment were established randomly in 8 m × 8 m plots separated by 1 m buffers. The levels of N treatment were 0, 2.5, 5 and 10 g N m−2 year−1, representing one, two and four times the estimated natural N deposition, utilizing ammonium nitrate (NH4NO3) as the nitrogen source. The extra N was applied in late June and July by spreading over the plots, with half of the annual total N applied each time. The levels of precipitation were ambient precipitation and 15% increase (equivalent 50 mm year−1), based on the predicted increase in precipitation in northern China under the SRES A2 scenario. The extra water was manually added by sprayers seven times from June to September with 15 to 17 days’ interval avoiding the natural precipitation events. The detailed description of water and N treatments is in Yan et al. [26].
2.3. Sampling and Measurement
N2O was sampled from September 2018 to September 2019 2 times per month during the non-growing season (September to April) and 4 times per month during the growing season (May to September) randomly with stable intervals. N2O samples were collected by a static opaque chamber with inner dimensions of 50 × 40 × 30 cm3 between 9:00 and 11:00 a.m. at 7 min intervals in the growing season and at 10 min intervals in the non-growing season. The chambers were capped on a permanently settled frame with 2 cm grooves, which was inserted into the soil to a depth of 5 cm. The chambers were covered by white heat insulation board and reflecting tin foil to prevent rapid temperature changes. The internal chamber temperature (CT) was monitored by temperature sensors JM624 (Jinming Instrument Co., Ltd., Tianjin, China) simultaneously with gas sampling. Four gas samples were conserve in airbags and analyzed by electron capture detector (ECD, HP-5890; Santa Clara, CA, USA) within 24 h. The change rates of N2O were determined according to Keller and Reiners [27]. An observation was rejected if there was no significant correlation between the N2O concentrations and the enclosure time of the chamber (p < 0.05) [21]. The cumulative N2O emissions were calculated according to the successive linear interpolation of sampling days. The N2O emission factors (EFs) were estimated by the default equation given in the IPCC report [1].
Soil properties at a depth of 0–10 cm were sampled using a soil auger simultaneously with N2O sampling. Soil samples were sieved through a 2 mm mesh before analyses. Soil water-filled pore space (WFPS) was determined by drying the soil at 105 °C. Soil pH was measured by the potentiometric method with 10 g of air-dried soil. The ammonium (NH4+) and nitrate (NO3−) were extracted by 2 M KCl solution and determined using an automatic nitrogen analyzer AA3 (BRAN & Lubbe, Norderstedt, Germany). The dissolved organic carbon (DOC) was extracted with deionized water and the microbial biomass carbon (MBC) was extracted by 0.5 M K2SO4 solution after 24 h chloroform fumigation. The soil DOC and MBC were assessed using a TOC analyzer (Elementar Corporation, Langenselbold, Germany). The total carbon (TC) and total nitrogen (TN) were determined by combustion method (Elementar Corporation, Germany). The bulk density was measured once a month.
Daily mean air temperature, open pan evaporation data and precipitation data were obtained from the Inner Mongolia Grassland Ecosystem Research Station of the Chinese Academy of Sciences. The air temperature (AT) was additionally measured by a DHM2 mechanical ventilated thermometer during N2O sampling. The soil temperatures (ST) at depths of 0 and 5 cm were measured by temperature sensors XGN-1000T (Yezhiheng Science and Technology Corporation, Beijing, China) at each N2O sampling time.
2.4. Statistical Analyses
Repeated measure analysis of variance (ANOVA) was used to test the effects of treatments and time on temporal variation of N2O flux. The T test was used to analysis the difference of N2O between treatment and CK at each sampling time. ANOVA with a Tukey’s Honestly Significant Difference (HSD) test (p < 0.05) was employed to determine the differences of distribution in seasonal N2O flux and seasonal cumulative N2O emissions among treatments. Pearson correlation analysis was used to analyze the correlations between soil properties. Regression analysis was used to analyze the correlations between N2O flux and soil properties. Structural equation models (SEMs) were used to explore the driving factors of soil properties on N2O flux. A random forest model was used to quantify the importance of soil properties to regular N2O flux. All the statistical analyses mentioned above were conducted using the R statistical software package (version 3.2.0, Core Team 2009).
3. Results
3.1. Meteorological Factors and Soil Properties
The meteorological factors during the study period (from September 2018 to September 2019) were consistent with the previous long-term climate (Figure 2). The daily mean air temperature ranged from −29.1 °C on 12 December 2018 to 27.5 °C on July 28th 2019. The annual cumulative precipitation was 312.9 mm, of which 83.5% occurred during the growing season (May to September). The annual cumulative evaporation was 1460.9 mm. of which less than 7.0% occurred during the frozen winter (November to February).
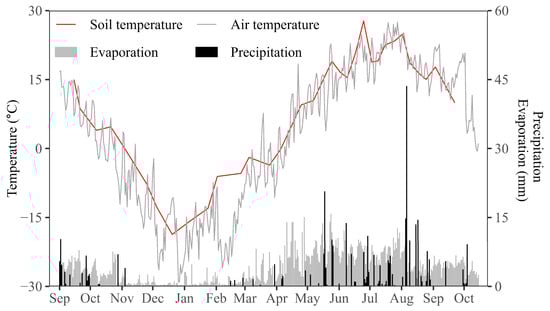
Figure 2.
The daily mean air temperature (gray line), soil temperature at 5 cm (red line), precipitation (black bar) and evaporation (gray bar) during the study period (15 September 2018 to 15 September 2019).
The dynamic of ST was generally consistent with the fluctuation of AT during this study period (Figure 2). Seasonal differences were observed in soil WFPS, NH4+, NO3−, DOC and MBC (Table 1). The effects of water and nitrogen addition on the soil properties exhibited significant seasonal variations (Table 1). The individual effect of water addition was significant on soil pH and DOC in the growing season, and significant on soil pH, WFPS and TN in the non-growing season, while the individual effect of N addition was significant on soil pH, NH4+, NO3−, TN and TC in the growing season, but was only significant on soil pH and NO3−. The interactive effects were consistent for soil pH and TC, but different for soil MBC and NO3− in the growing and non-growing seasons.

Table 1.
Soil properties in control (mean ± se) and the ANOVA results for the effects of treatments on soil properties for the growing season and non-growing season (Water, N and Water:N mean the significance of water addition, N addition and interactive of water and N addition according to two-way ANOVA. * means the effect was significant at p < 0.05 level, and ** means the effect was significant at p < 0.01 level).
3.2. Effects of Water and N Addition on Soil N2O Emissions
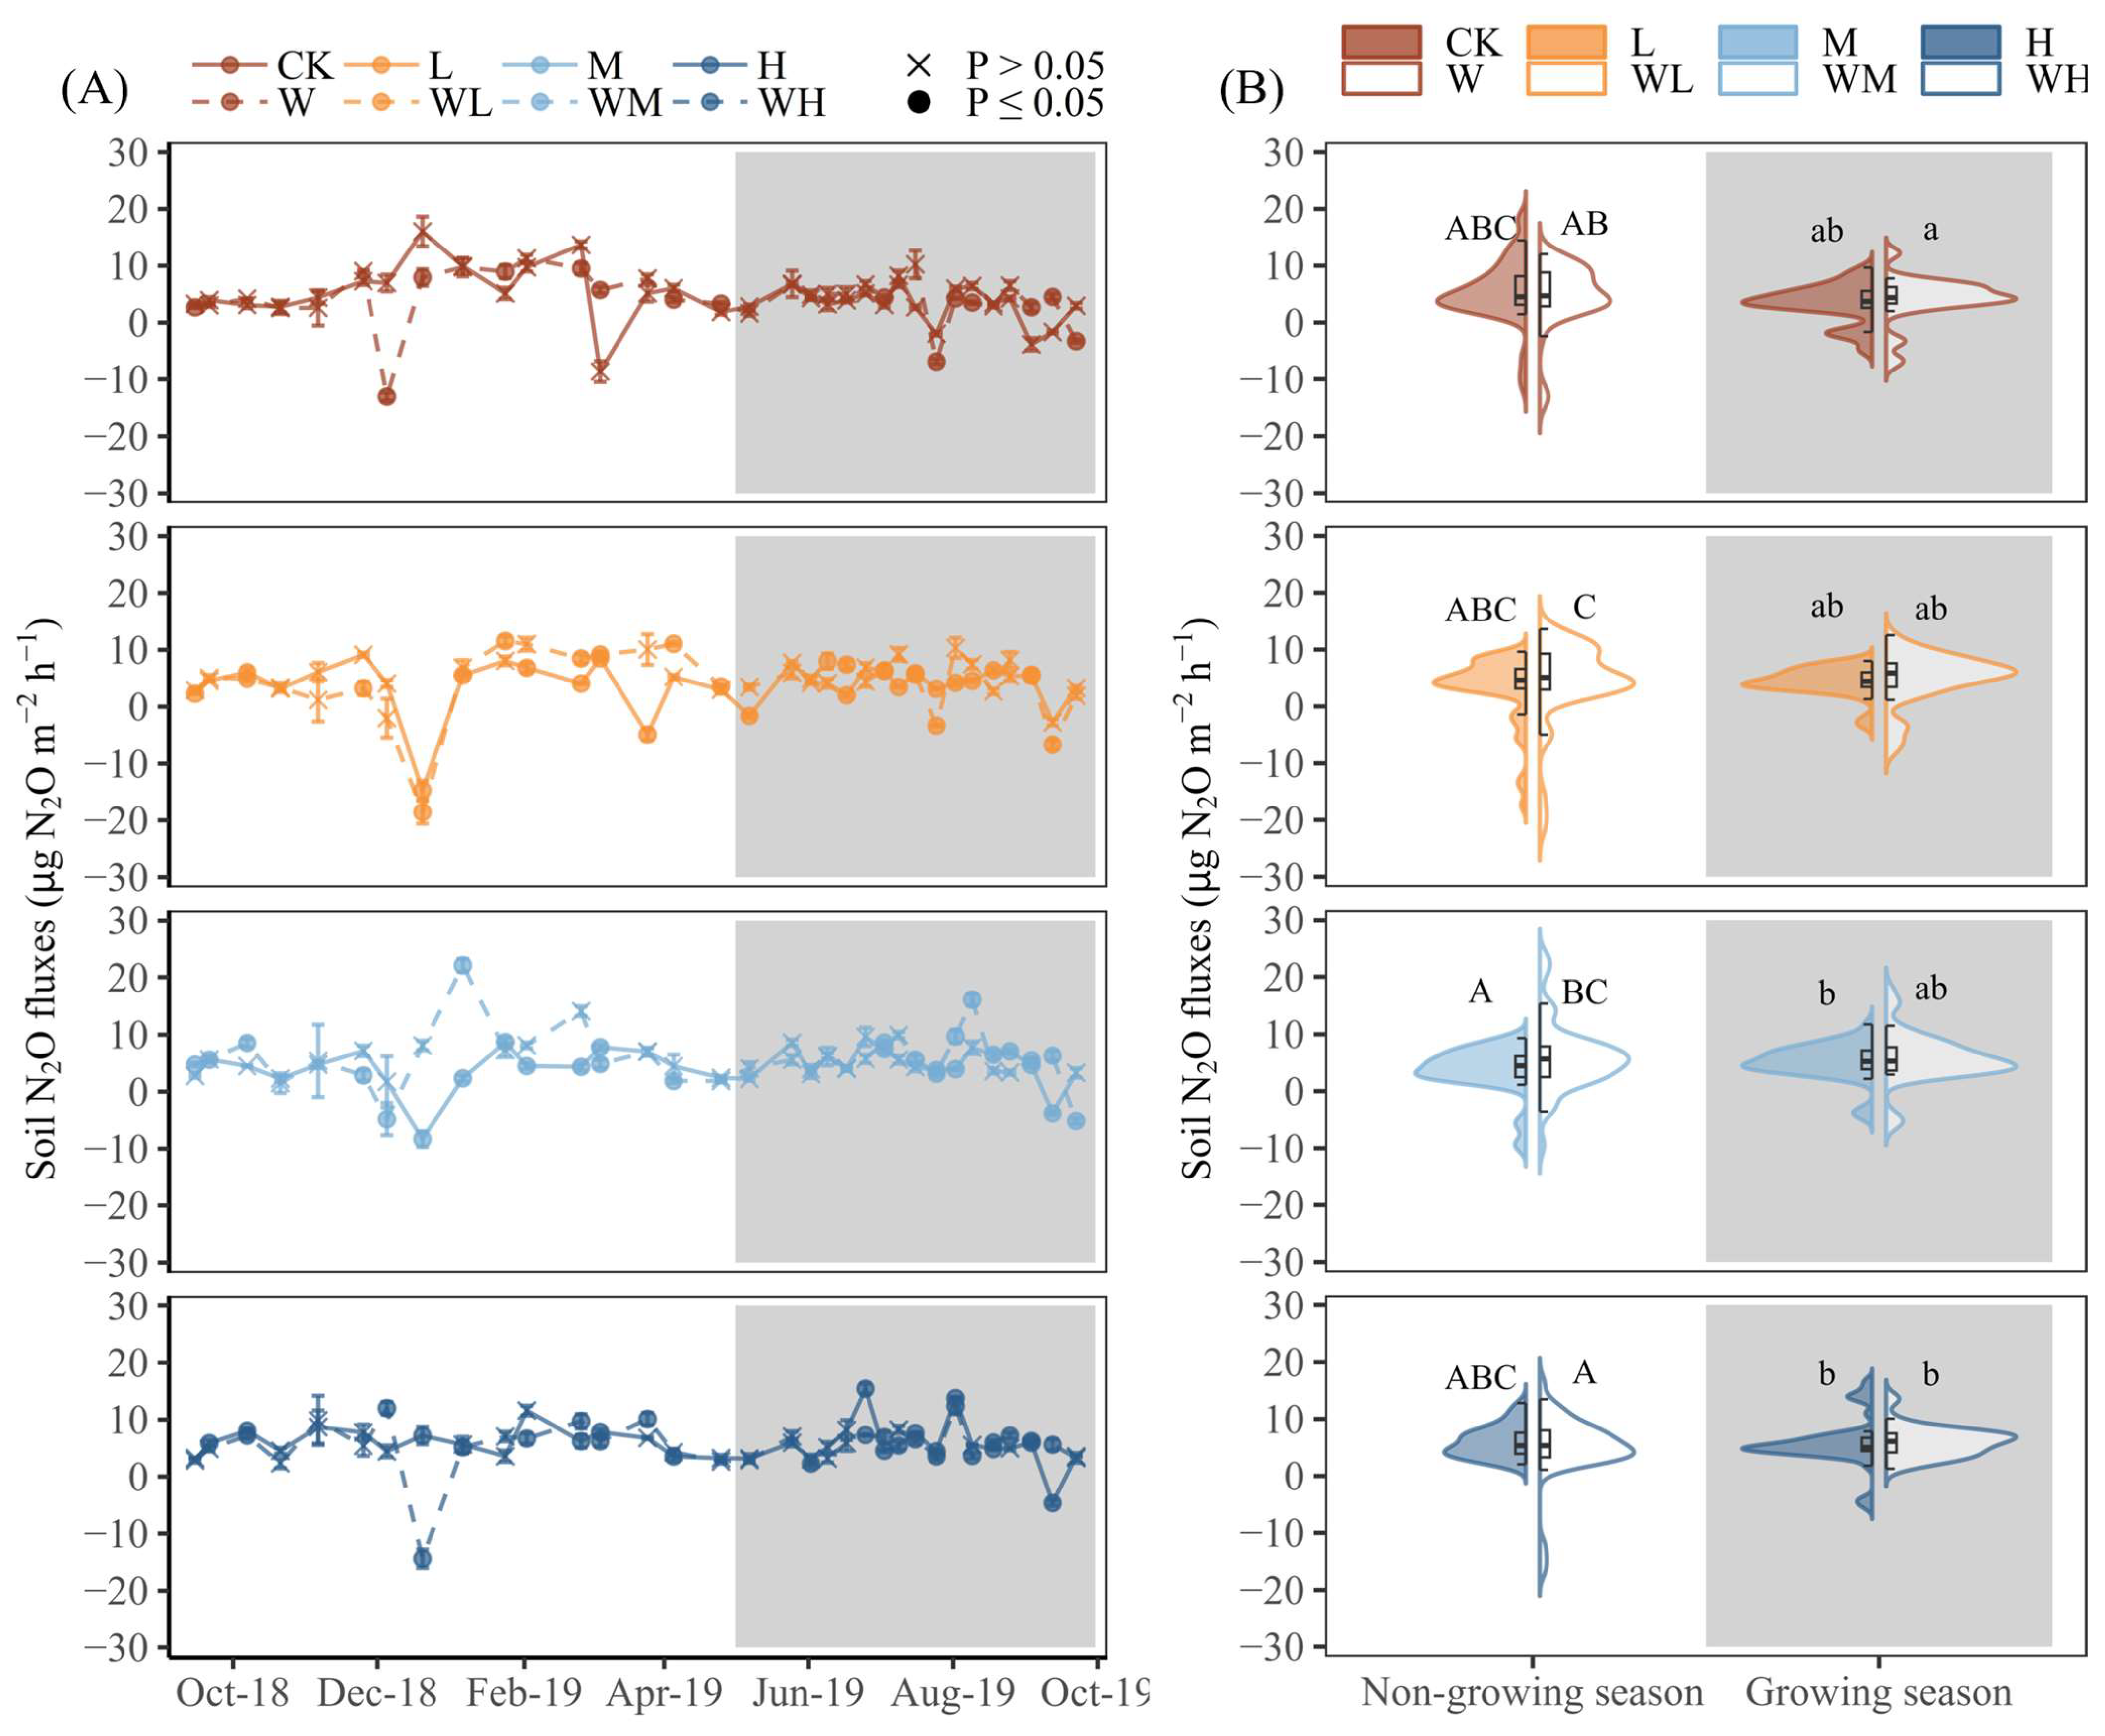
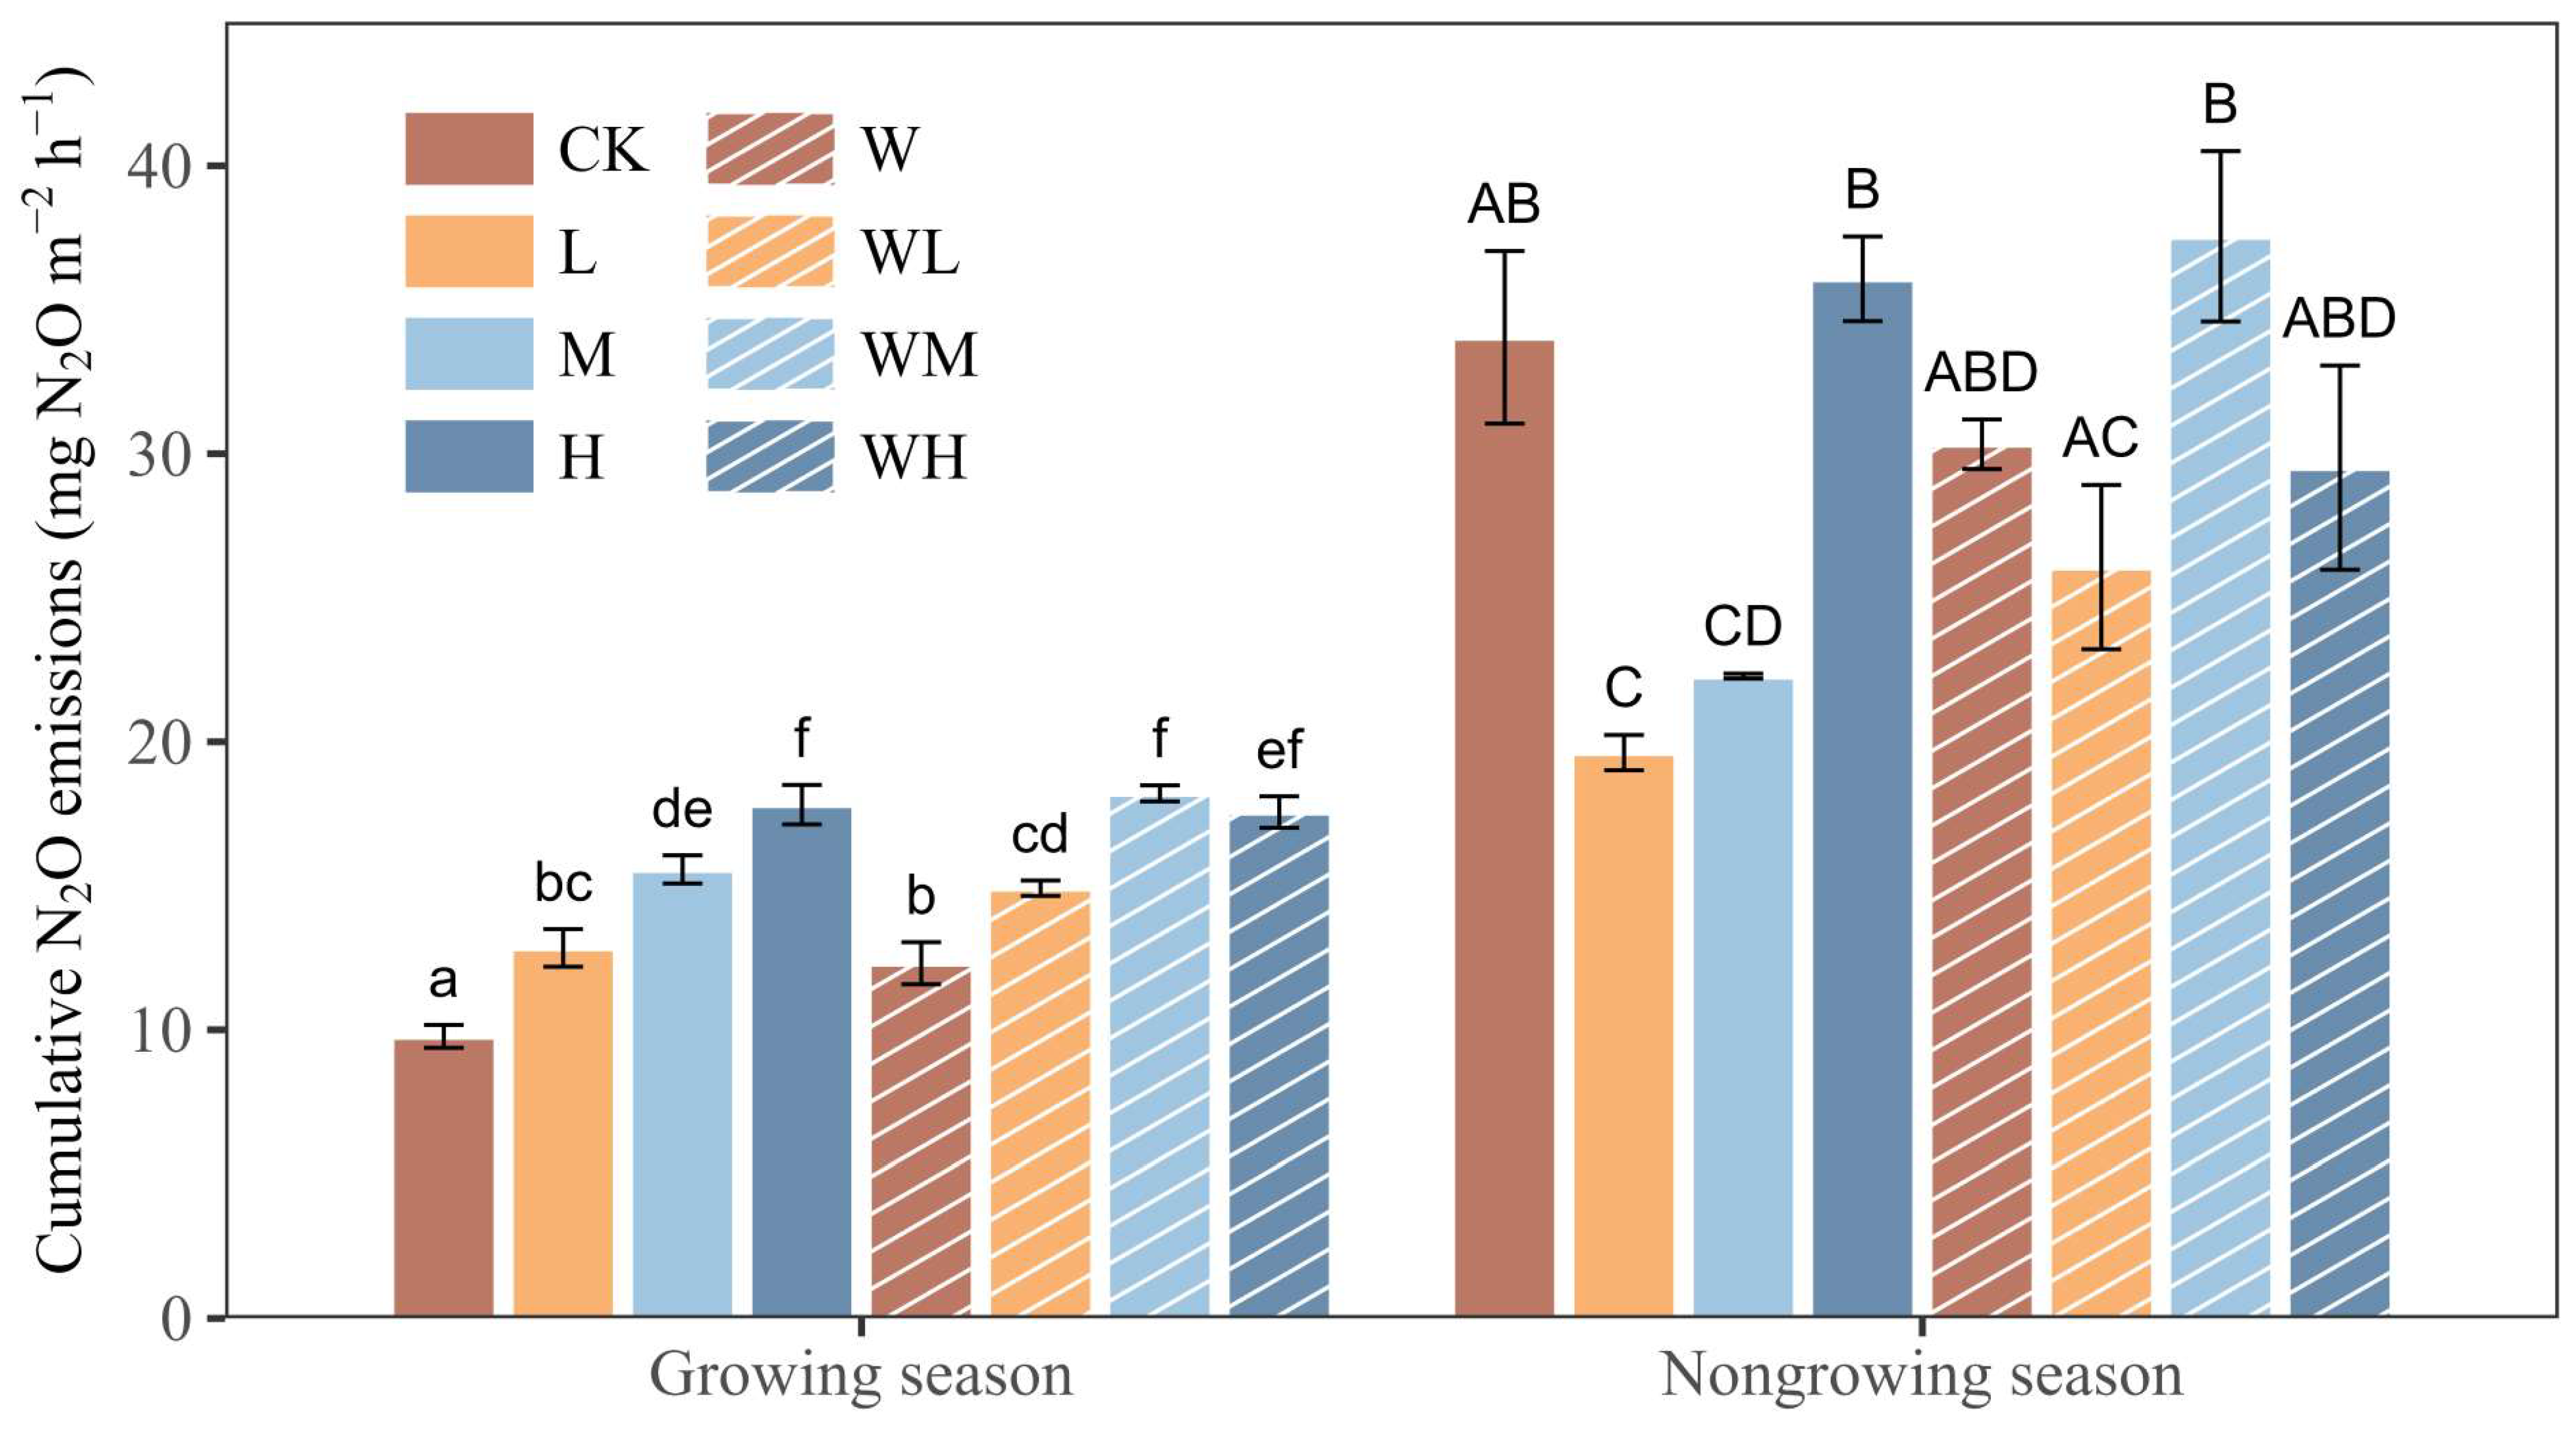
The annual N2O flux was 4.46 ± 0.47 μg N2O m−2 h−1 with observations ranged from −11.12 μg N2O m−2 h−1 to 18.47 μg N2O m−2 h−1. The N2O flux during the non-growing season exhibited greater variability and average flux (with a 95% confidence interval of 3.98 to 7.04 μg N2O m−2 h−1 and an average of 5.39 ± 0.31 μg N2O m−2 h−1) than those during the growing season (with a 95% confidence interval of 2.38 to 4.33 μg N2O m−2 h−1 and an average of 2.92 ± 0.04 μg N2O m−2 h−1) (Figure 3). This resulted in cumulative emissions of 9.77 ± 0.40 mg N2O m−2 for the growing season and 34.04 ± 2.99 mg N2O m−2 for the non-growing season, respectively (Figure 4).
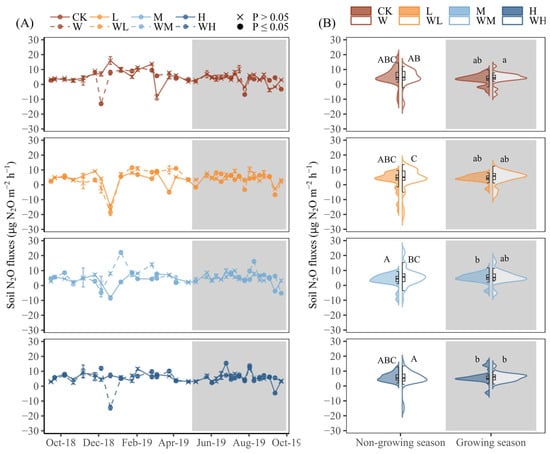
Figure 3.
The dynamic (A) and the distribution (B) of N2O flux for each treatment. The labels CK, L, M and H refer to the four nitrogen addition rates of 0, 2.5, 5 and 10 g N m−2 year−1 without water addition, and W, WL, WM and WH refer to the four nitrogen addition rates with water addition of 15% of precipitation, respectively. The flux is expressed as mean ± se for the dynamic, and the shape of the point indicates the significance of the effect of treatments on N2O fluxes at 0.05 level of each time. The three lines box portion and line extending from the box showed the upper quartile, mean, down quartile and 95% confidence interval of N2O fluxes for each treatment. The width of the violin plot indicates the central tendency of seasonal N2O fluxes for each treatment. The lowercase and capital letters represented the differences in N2O fluxes among treatments during the growing and non-growing seasons, respectively, as determined by Tukey’s HSD analysis at 0.05 level. The assignment of letters is typically based on the order of the group means from lowest to highest. Treatments labeled with the same letter indicate no significant difference between them, while treatments labeled with different letters indicate a significant difference between them.
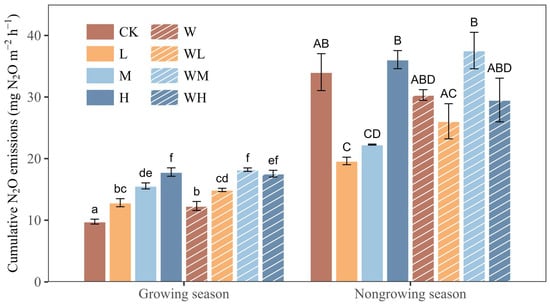
Figure 4.
The cumulative N2O emissions in the growing and non-growing seasons. CK, L, M and H refer to the four nitrogen addition rates of 0, 2.5, 5 and 10 g N m−2 year−1 without water addition, and W, WL, WM and WH refer to the four nitrogen addition rates with water addition of 15% of precipitation, respectively. The cumulative N2O emissions are expressed as mean ± se. The lowercase and capital letters represented the differences of cumulative N2O emissions among treatments by Tukey’s HSD analysis at 0.05 level in growing and non-growing season, respectively. The letters are typically assigned based on the order of the group means from lower to higher. Treatments labeled with the same letter indicate no significant difference between them, while treatments labeled with different letters indicate a significant difference between them.
Repeated measure ANOVA results showed that the individual effect of water or N addition on N2O flux was significant during the growing season (Table 2). N addition led the distribution of N2O flux to higher values and increased cumulative N2O emissions linearly with the N application rate (R2 = 0.938, p = 0.03) with an EF of 0.07%. Water addition also shifted the distribution of N2O flux during, resulting in an increase of 2.54 mg N2O m−2 in cumulative emissions during the growing season. The interactive effect of water and N addition was not significant (p = 0.415), though water addition slight lowered the increased N2O emissions in high N application rates in the growing season (Figure 4).
Table 2.
ANOVA results of the effects of treatments on N2O fluxes and cumulative N2O emissions for the growing season and non-growing season (Water, N and Time represented the effect of water addition, N addition and the sampling time, respectively. ×: represented the interactive effect between water addition, N addition and sampling time. P-flux represents the repeated measure ANOVA results for N2O fluxes, P-emission represents the two-factor ANOVA for cumulative N2O emissions, * means the effect was significant at p < 0.05 level and ** means the effect was significant at p < 0.01 level).
Sampling time was the major factor affectingof N2O fluxes during the non-growing season (Table 2, p < 0.001). Neither individual nor interactive effects of water and N addition were significant for the total non-growing season based on repeated measure ANOVA results (Table 2). However, the t-test for each sampling time showed significant effects of water and N addition from December 2018 to April 2019 (Figure 3A). This period exhibited negative effects of N addition on cumulative N2O emissions were related to the N addition rates (Figure 4, (R2 = 0.938, p < 0.001)). However, the interactive effects of water and N addition were very complex.
3.3. Controlling Factors on Soil N2O Emissions
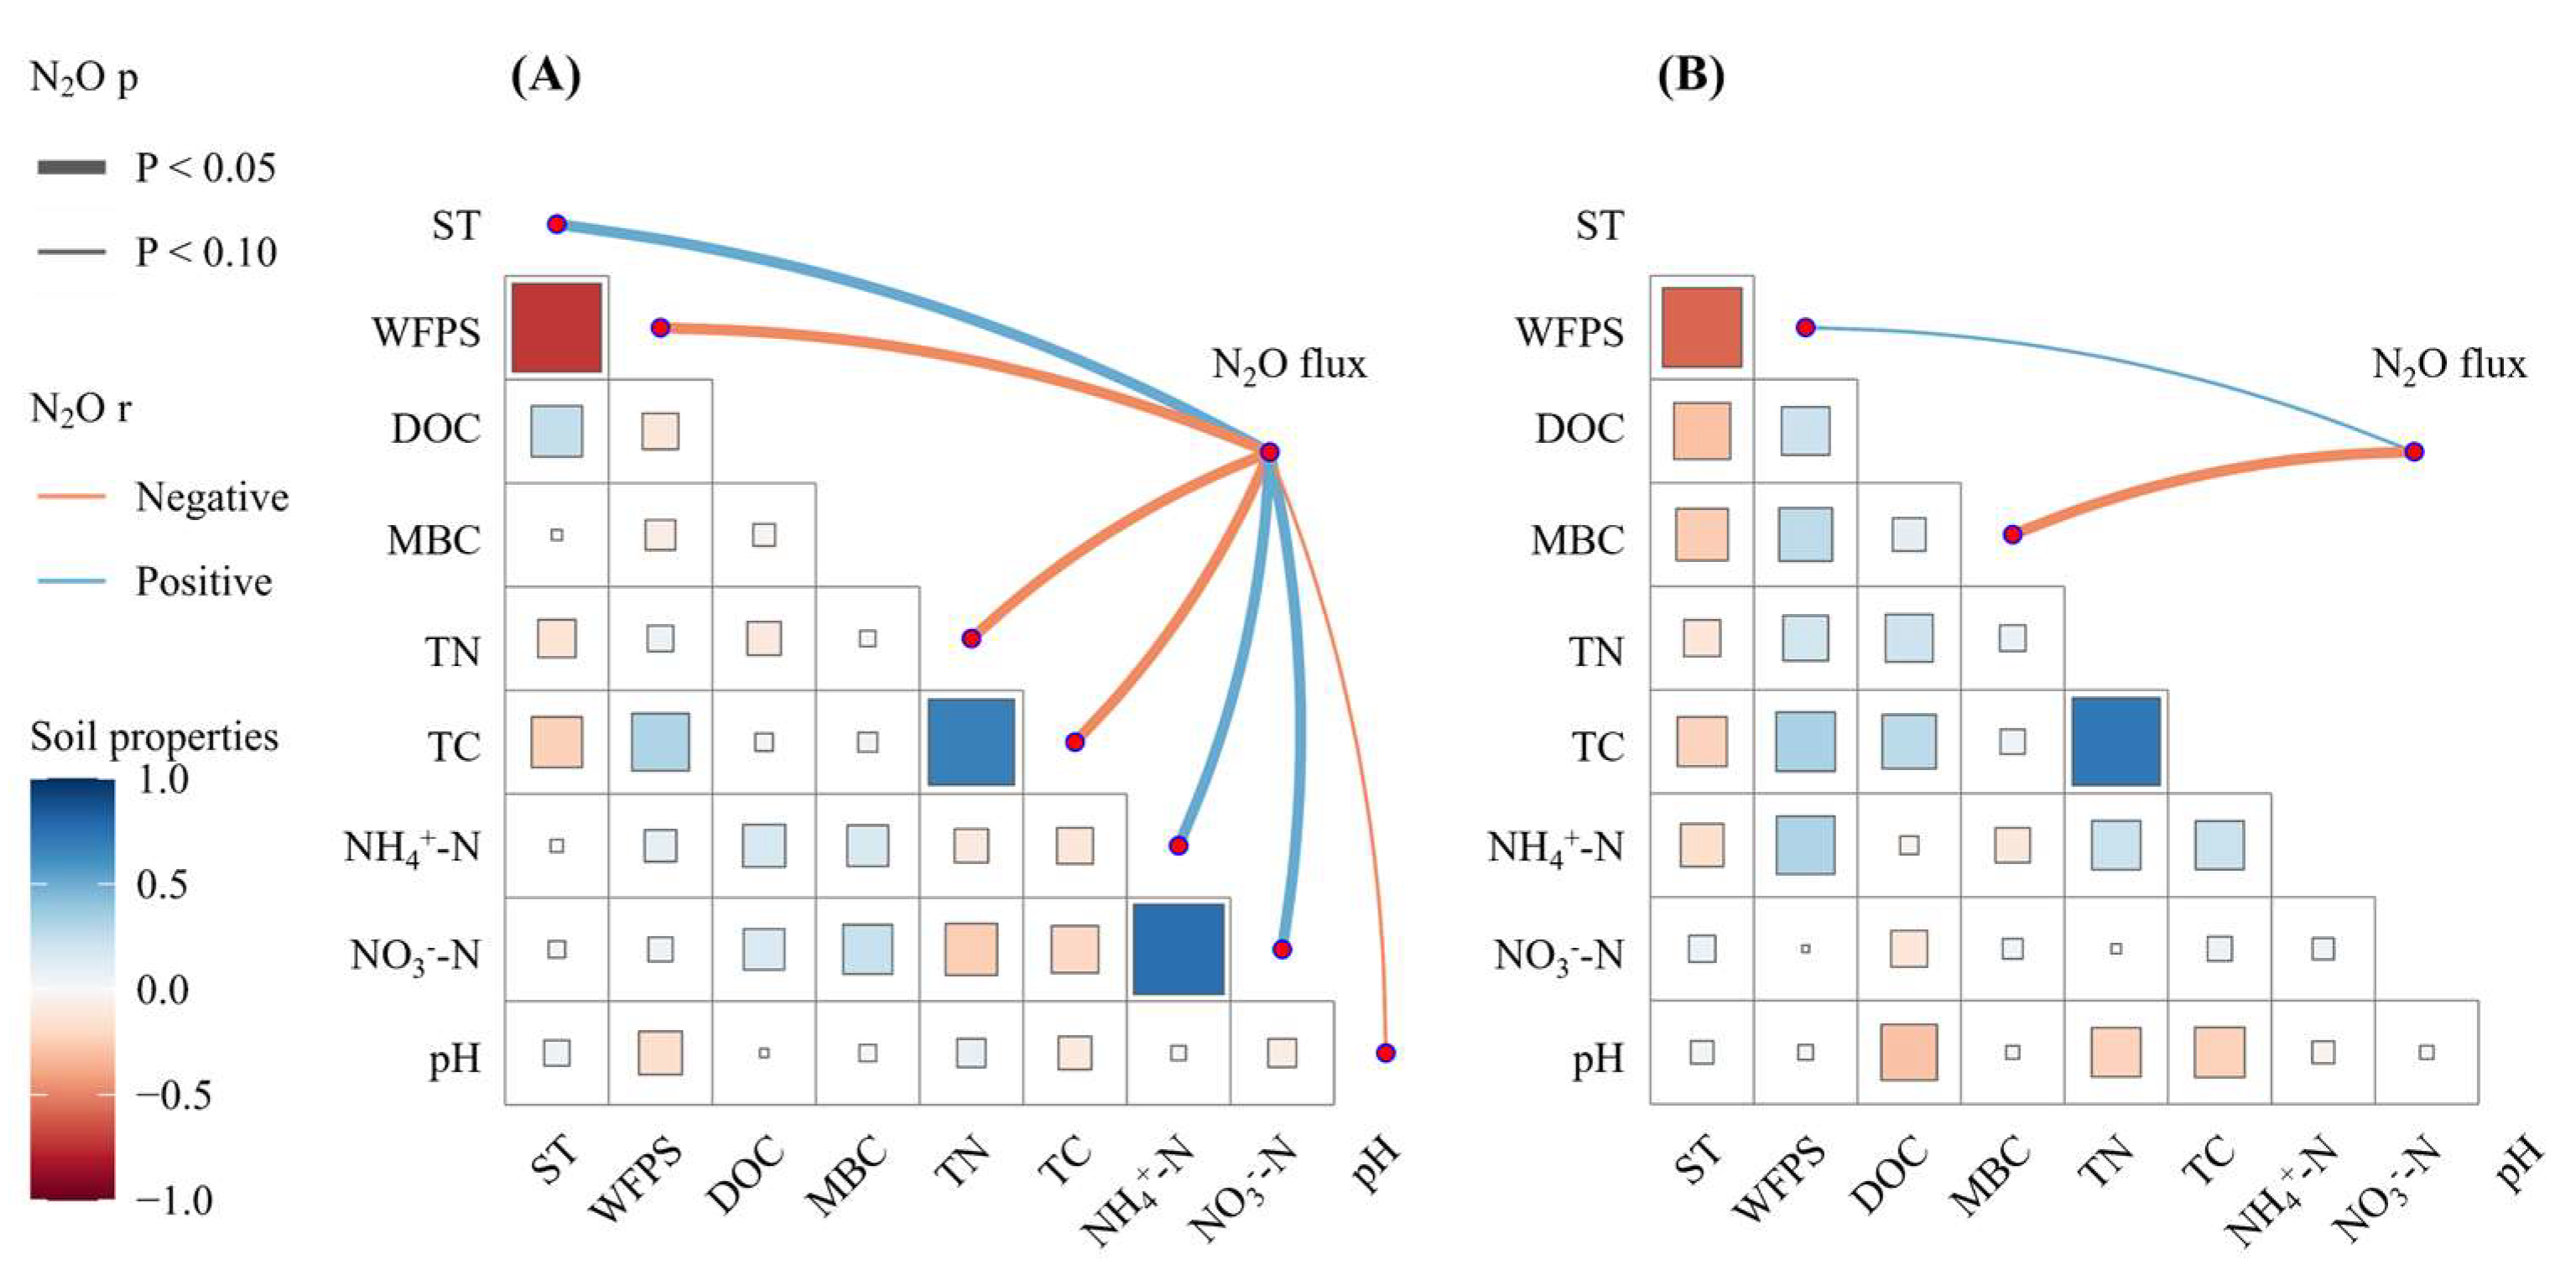
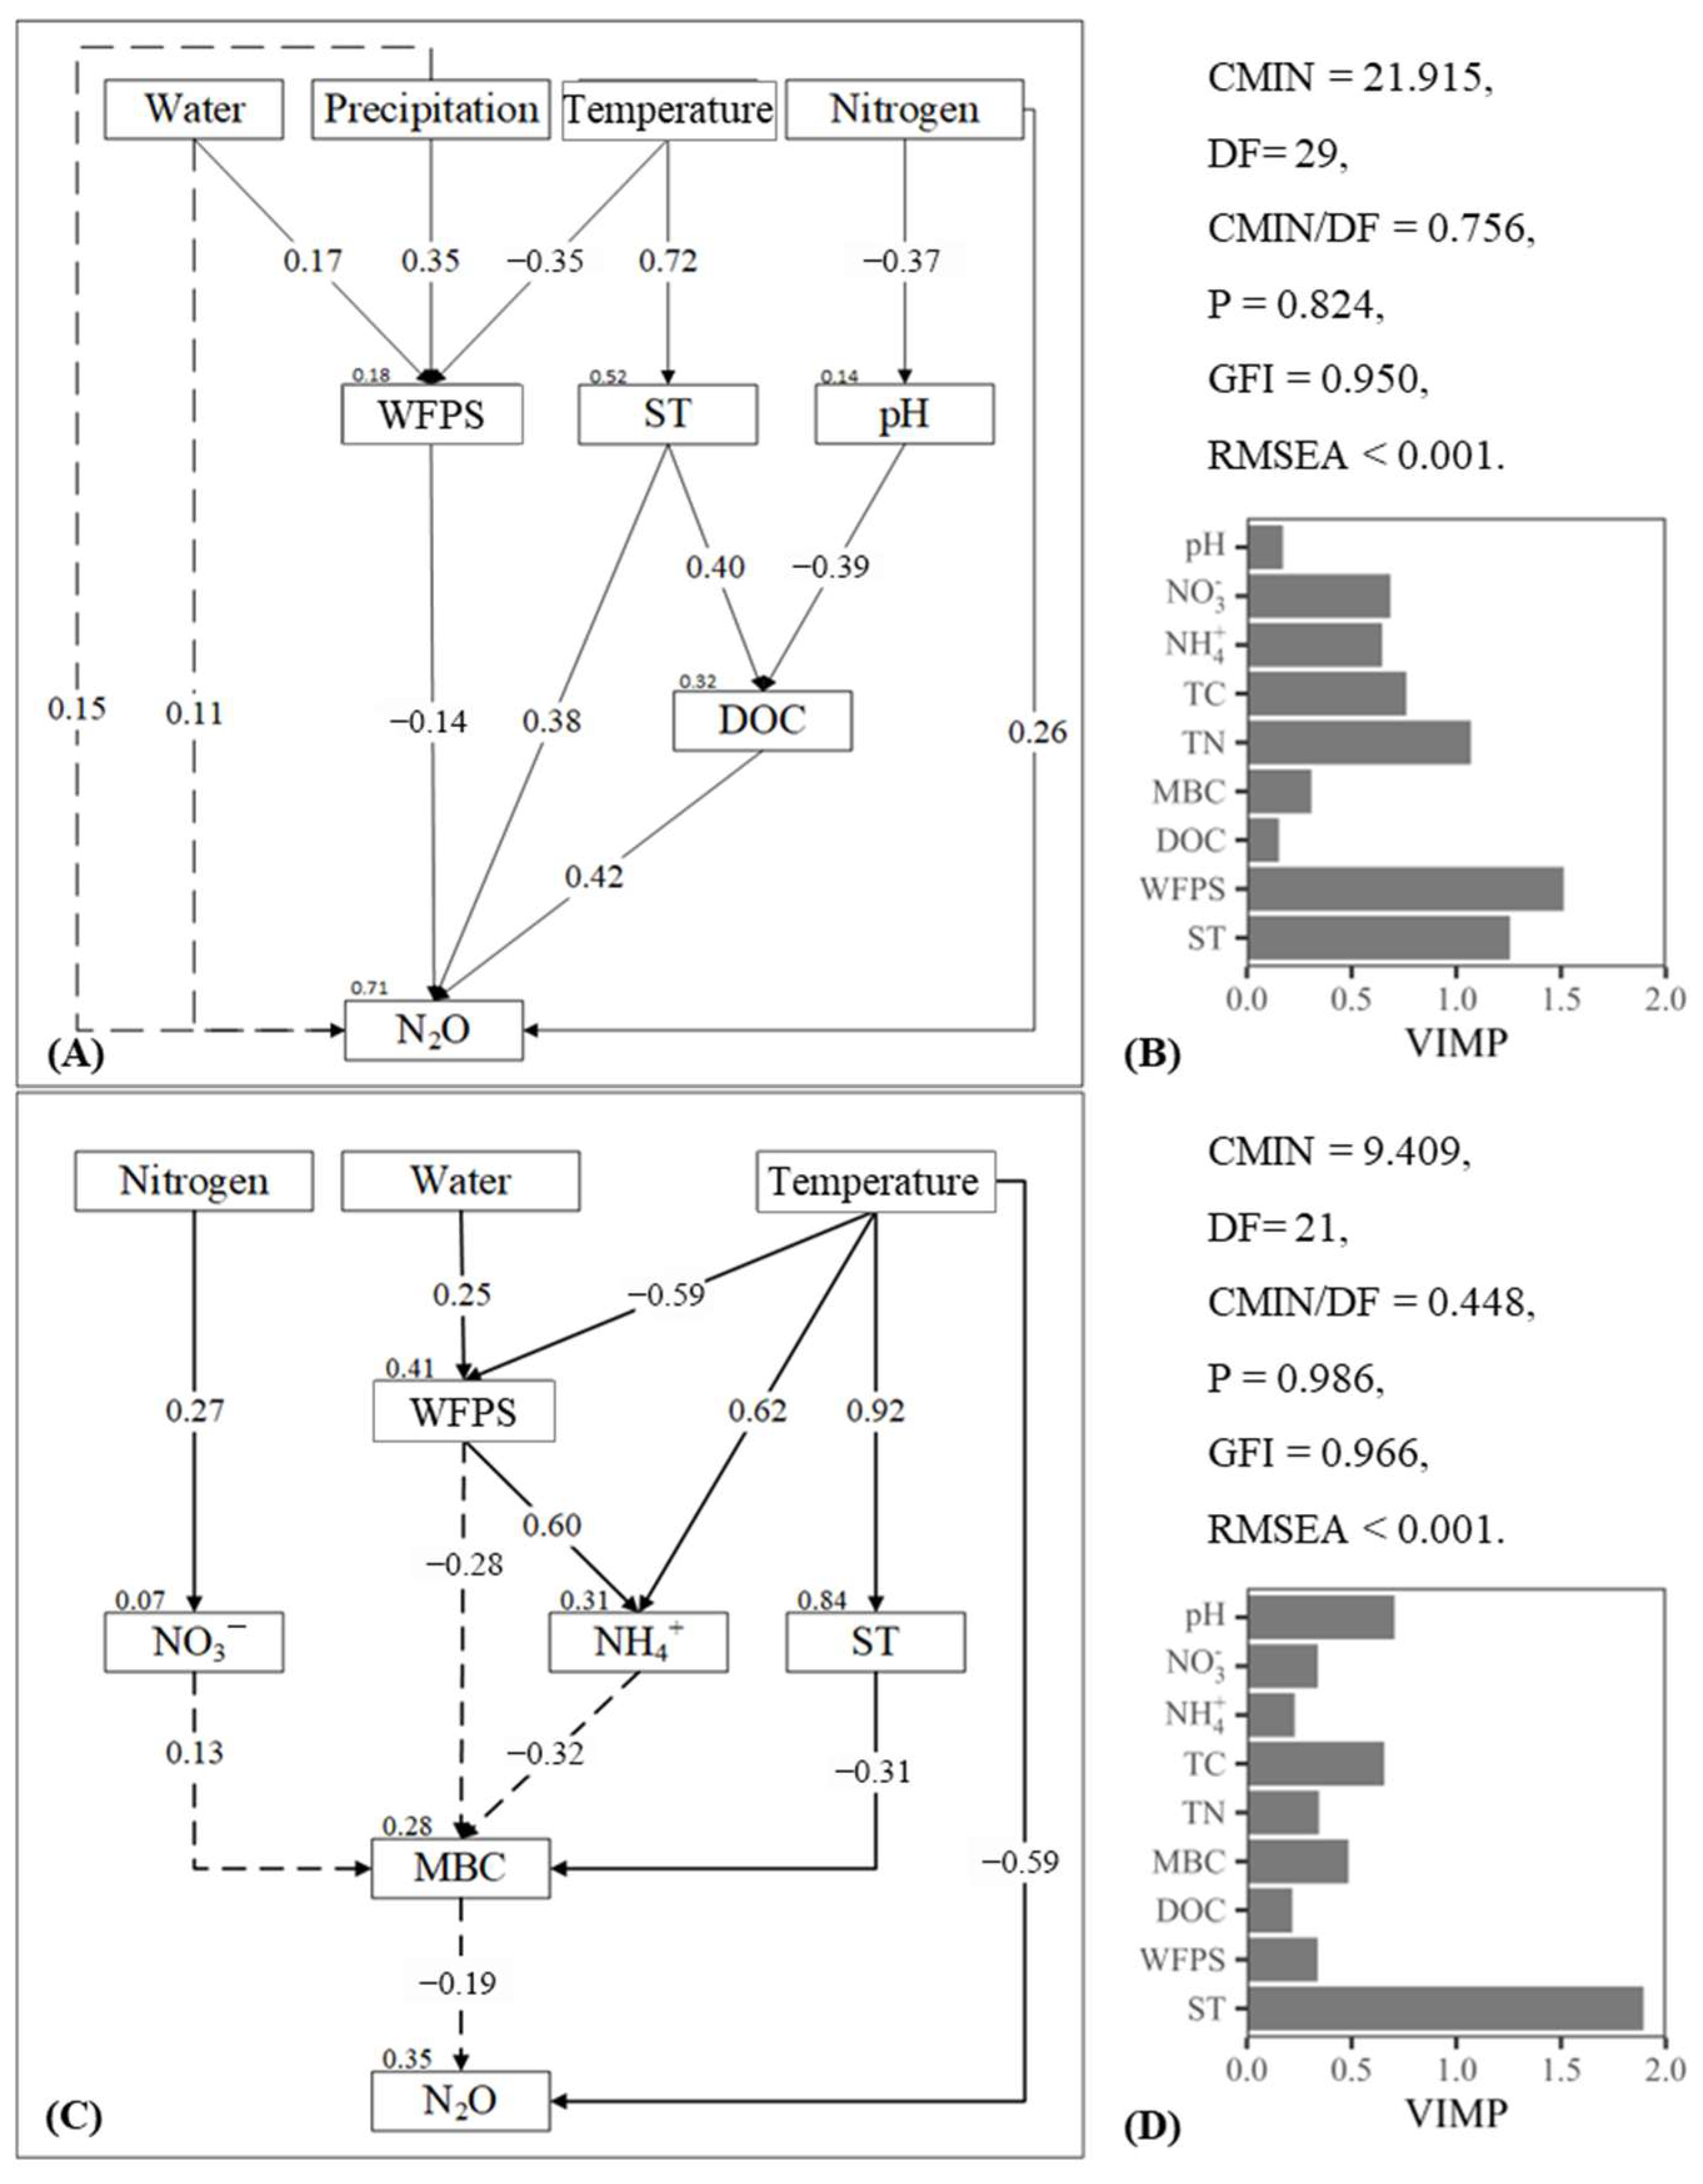
The correlations among soil properties were more significant during the non-growing season than during the growing season. The regression analysis results showed that the N2O flux values during the growing season were significantly positively correlated with the ST, soil NO3−-N content and soil NH4+-N content, and significantly negatively correlated with the WFPS, soil TC and TN content (Figure 5A). The SEM results also confirmed ST and WFPS as the basic factors for the growing season (Figure 6A). In contrast, N2O flux during the non-growing season exhibited a significant negative correlation with soil MBC at the 0.05 significance level and with WFPS at the 0.10 significance level (Figure 5B). Among all the soil properties investigated, MBC was identified as the sole direct factor regulating N2O flux during the non-growing season (Figure 6C). According to the random forest model, WFPS was the most important factor in the growing season, followed by ST and soil nutrients, while ST was the most important factor during the non-growing season (Figure 6B,D). All the measured meteorological factors and soil properties could explain approximately 71% of the variations in N2O flux during the growing season (Figure 6A) and approximately 35% of the variations in N2O flux during the non-growing season (Figure 6C).
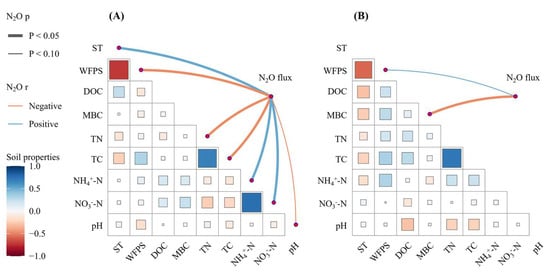
Figure 5.
Pearson correlations among ST (soil temperature at 5 cm depth), WFPS (water-filled pore space), DOC (dissolved organic carbon), MBC (microbial biomass carbon), TN (total nitrogen content), TC (total carbon content), NH4+-N, NO3−-N and pH at 0–10 cm, and their regression with N2O flux in the growing (A) and non-growing season (B). The lower triangle shows the Pearson correlations, where the darker and lager square represents a greater correlation between two soil properties. The curve line shows the relation between N2O flux and soil properties, where the color represents the trend of regression, and the linewidth represents the significance of regression.
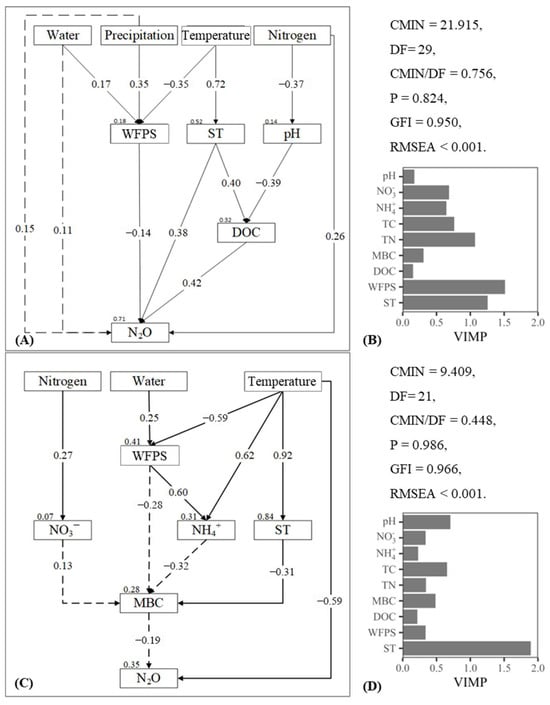
Figure 6.
The impact and importance on N2O flux of treatments (Water: water addition, Nitrogen: N addition), meteorological factors (Temperature: air temperature, Precipitation: ambient precipitation on preceding two days) and soil properties (ST: soil temperature at 5 cm depth, WFPS: water filled pore space, DOC: dissolved organic carbon, MBC: microbial biomass carbon, NH4+-N, NO3−-N and pH) for the growing (A,B) and non-growing season (C,D), respectively. The solid line indicates that the pathway was significant at p < 0.05, and the dotted line indicates that the pathway was significant at p < 0.10. The insignificant effects (p > 0.1) are not shown. Values associated with arrows represent standardized path coefficients. The superscripts of soil properties indicate the proportion of variation explained by the relationships with other variables. The parameters of the SEM are listed beside the charts, where CMIN means chi-square of model fit, DF means the degrees of freedom, p is the p value of model fit, GFI is the goodness of fit index and RMSEA is the root mean square error of approximation of the SEM results. VIMP is the variable importance of the random forest model.
4. Discussion
With the increase in precipitation and N deposition due to global changes, the risk of rising N2O emissions in semi-arid grassland has become a concern [7,8,28]. However, previous studies on N2O flux in semi-arid grasslands’ N2O flux have mostly focused on the growing seasons and weather-driven hot moments [7,14]. This limitation would hinder accurate estimates of N2O emissions under global changes. In this study, we investigated year-round N2O flux at stable intervals with a chamber to reflect the temporal variation and contribution of seasonal N2O emissions. Furthermore, we sampled the meteorological factors and soil properties at the same time to quantify the controlling factors of N2O flux in the growing and non-growing seasons.
4.1. Seasonal Variation and Contribution of N2O
The year-round observations confirmed the temperate semi-arid grassland as a small resource of N2O with a 95% confidence interval of 2.38 to 4.33 μg N2O m−2 h−1 and 9.77 ± 0.40 mg N2O m−2 for the growing season (Figure 3), which was consistent with the previous reports in grassland [6]. Moreover, both the variation and contribution of N2O flux during the non-growing season were greater than those during the growing season in this study, which was supported by some of the studies [22,29]. The N2O flux during the non-growing season showed a unimodal trend, which was negatively correlated with AT in this study, which was controversial in previous reports [20,30]. In addition, the temperature was the only observed direct driving factor in this study in the SEM. The temporal and spatial uncertainty in N2O emissions were generally attributed to the sensitivity in microbial activity induced by environmental disturbances [17,19]. N2O absorption was occasionally observed by the soil in this study, as reported in situ and in incubations [31]. The heterotrophic denitrifying by microbes carrying nosZ genes was confirmed as the main pathway of N2O consumption, controlled by a combination of hydrological factors, soil carbon and available nitrogen content [32,33,34]. The denitrifying N2O reducers were facultative anaerobes that prefer using O2 as the electron acceptor over N2O [35,36]. Therefore, increasing soil moisture content, which reduces O2 availability, might have resulted in the negative N2O flux. This is consistent with the higher frequency and greater magnitude of negative flux observed in the watering treatments in this study. However, the mechanism of N2O consumption in temperate semi-arid grassland has not been elucidated yet.
4.2. Effect of Water and N Addition on N2O Flux during the Growing Season
N addition increased N2O flux significantly during the growing season, as has been reported in previous in situ and laboratory studies. The cumulative N2O emissions increased linearly with the N application rate with an average of 0.79 mg N2O g−1 N. This trend was equivalent to an EF of 0.06%, which is much lower than the default value (0.5%) for an arid environment according to the IPCC [1]. These increased cumulative N2O emissions were dominated by the N2O pulses during July and August after N amendment, as with the management-driven hot moment of N2O fluxes previously reported [37,38], which was evidenced by the importance of the direct effect of N addition in the SEM, but the temporal variations after N addition were not as significant as in previous years [9,26]. The reduced temporal variations might result from the weaker disturbance due to accumulated NO3− legacy after 5 years’ treatment [39,40]. Furthermore, soil DOC was observed as one of the direct driving factors for N2O flux during the growing season according to the SEM results in this study. Previous studies pointed out that soil DOC was related to denitrification [41]. With DOC enrichment, the consumption as well as production of N2O by denitrification were both stimulated, resulting in controversial correlations between DOC and N2O flux [42,43,44]. Overall, increasing DOC could elevate the risk of N2O emissions, in addition to the direct increase in N2O emissions from accelerated nitrogen cycling under increasing N deposition. Also, it suggests different temporal mechanisms of N2O emissions after long-term N addition, which need further investigation.
Both positive and negative influences of water addition on soil N2O emissions have been reported [26,45,46]. Studies have confirmed that water amendment in water-limited grasslands has a positive effect on microbial activities, thereby accelerating microbial-driven nitrification and denitrification processes [16,47]. Moreover, rewetting-induced N2O pulses formed significant proportions of the annual emissions in drought ecosystems [46]. Water addition enlarged the variation of N2O flux during the growing season. The N2O flux was enlarged directly by ambient and artificial water input, and decreased by increased WFPS. The trade-off of the opposite effects resulted in an approximately 2.54 mg N2O m−2 increase in seasonal cumulative emissions. The effect of water addition on N2O emissions was not consistent for different N application levels, but the interactive effects were not significant, which was different from the previous year [9]. It indicated a changed sensitivity of water addition under N amendment, though the WFPS condition and MBC content were not significantly changed. The N2O-related microbial community structure needs further investigation for more accurate assessment of the changes in soil N2O emission potential under long-term water and nitrogen changes.
4.3. Effect of Water and N Addition on N2O Flux during the Non-Growing Season
Soil WFPS and nutrients were pointed out as the limiting factors influencing the N2O emissions during thawing in grasslands. Also, the amendment of water and N increased N2O emissions of soil cores in incubation studies [48,49]. However, the effects of water and N addition were associated with temperature in this study. The significant positive effects of water and N addition, as reported previously, were observed during the spring thaw in March and April when the temperature was above 0 °C. When the temperature was below 0 °C, water and N addition decreased the N2O flux. This negative effect might be caused by the changes of microbes in the topsoil, considering MBC as the direct controlling factor for N2O fluxes during the non-growing season, but it requires further evidence. Water and N additions, with their opposing effects at different time periods, led to a more concentrated distribution of N2O flux during the non-growing season. The contribution of these opposite effects was regulated by N application rates, shown as a significant decrease in seasonal cumulative N2O emissions in the low and medium N application rates, and insignificant changes in other treatments.
Snow cover was considered as one of the essential meteorological factors for N2O flux during the non-growing season. Snow cover preserves soil temperature and replenishes soil water, thereby increasing microbial activity [29,50,51]. By mitigating the low-temperature constraints on microbial activity during the non-growing season, snow cover accelerates nitrogen cycling processes driven by microbes, which enhances the potential for N2O production and emission. The snow cover alleviated the low-temperature tolerance of microbial activity during the non-growing season, accelerating microbial-driven nitrogen cycling processes and increasing the potential for N2O production and emission. Unfortunately, snow occurred occasionally when temperatures were above 0 °C in this study, which might have confounded the effect of snow cover and the effect of water and N addition. Hence, multi-year winter observations are needed to extract the effects of water and N addition.
5. Conclusions
This study investigated the seasonal dynamics and influencing factors of soil N2O emissions with different water and N additions in semi-arid temperate grasslands in northern China. The results confirmed semi-arid temperate grasslands as a N2O resource with the annual N2O flux as 4.46 ± 0.47 μg N2O m−2 h−1. The variation and contribution of N2O emissions during the non-growing season was greater than those during the gro wing season. The response of N2O emissions to increased water or N deposition was different for the growing and non-growing seasons. During the growing season, N2O emissions were linearly correlated with N application with an EF of 0.06%. The effect of water addition increased N2O emissions by 2.54 mg N2O m−2. In addition, the effects of water and N addition were additive rather than interactive. In contrast, during the non-growing season, the effects of water and nitrogen additions were related to sampling time and resulting in negative effects on seasonal cumulative N2O emissions. The explanatory power of meteorological factors and soil properties for the variation in soil N2O emissions was 71% during the growing season, higher than the 35% during the non-growing season. The importance of soil properties varied seasonally. The WFPS was the most important regulator during the growing season, while the temperature was the most important factor during the non-growing season. The variation in seasonal major driving factors was considered the reason for the different responses of N2O emissions to water and N additions. Our findings suggest an underestimation in annual N2O emissions and an overestimation in the risk of N2O emissions increasing under global changes when observations during the non-growing season are not included. The meteorological factors and soil properties were able to estimate the N2O emissions in the growing season but their predictive value was weak for N₂O emissions during the non-growing season. Other potential driving mechanisms and factors need further exploration. Our findings could provide evidence for developing more effective land management strategies to reduce greenhouse gas emissions and preserve ecosystem health in semi-arid grasslands.
Author Contributions
Conceptualization, Q.P., Y.Q., Y.D., X.L. and Y.G.; methodology, Y.D. and Y.G.; investigation, Y.G. and X.Y.; writing, Y.G.; visualization, Y.G.; project administration, Q.P., Y.Q., F.Y. and N.L.; Funding acquisition, Q.P., Y.Q., Y.D., F.Y. and N.L. All authors have read and agreed to the published version of the manuscript.
Funding
This research was funded by National Natural Science Foundation of China, grant numbers 42277241, 42177224 and 41673086; Strategic Research and Consulting Project, Chinese Academy of Engineering, grant number 2023-XY-64; XPCC Science and Technology Innovation Talent Program, grant number 2022CB028; and Third Comprehensive Scientific Investigation Project of Xinjiang, grant number 2022xjkk1002.
Data Availability Statement
Dataset available on request from the authors.
Acknowledgments
We are grateful to the Inner Mongolia Grassland Ecosystem Research Station of the Chinese Academy of Sciences for their assistance with accommodation.
Conflicts of Interest
The authors declare no conflicts of interest.
References
- IPCC (The Intergovernmental Panel on Climate Change). 2019 Refinement to the 2006 IPCC Guidelines for National Greenhouse Gas Inventories; Working Group III contribution to the Sixth Assessment Report of the Intergovernmental Panel on Climate Change; IPCC: Geneva, Switzerland, 2019. [Google Scholar]
- IPCC (The Intergovernmental Panel on Climate Change). Climate Change 2022: Mitigation of Climate Change; Working Group III contribution to the Sixth Assessment Report of the Intergovernmental Panel on Climate Change; IPCC: Geneva, Switzerland, 2022. [Google Scholar]
- Qiu, Q.; Wu, L.; Ouyang, Z.; Li, B.; Xu, Y.; Wu, S.; Gregorich, E.G. Effects of Plant-Derived Dissolved Organic Matter (DOM) on Soil CO2 and N2O Emissions and Soil Carbon and Nitrogen Sequestrations. Appl. Soil Ecol. 2015, 96, 122–130. [Google Scholar] [CrossRef]
- Li, W.; Wang, Y.; Xu, Q.; Cao, G.; Guo, X.; Zhou, H.; Du, Y. Global Analysis of Nitrification Inhibitors on Grasslands Nitrous Oxide Emission Rates. Biochem. Syst. Ecol. 2021, 97, 104289. [Google Scholar] [CrossRef]
- Liu, X.; Qi, Y.; Dong, Y.; Peng, Q.; He, Y.; Sun, L.; Jia, J.; Cao, C. Response of Soil N2O Emissions to Precipitation Pulses under Different Nitrogen Availabilities in a Semiarid Temperate Steppe of Inner Mongolia, China. J. Arid Land 2014, 6, 410–422. [Google Scholar] [CrossRef]
- Chen, W.; Zheng, X.; Wolf, B.; Yao, Z.; Liu, C.; Butterbach-Bahl, K.; Brüggemann, N. Long-Term Grazing Effects on Soil-Atmosphere Exchanges of CO2, CH4 and N2O at Different Grasslands in Inner Mongolia: A Soil Core Study. Ecol. Indic. 2019, 105, 316–328. [Google Scholar] [CrossRef]
- Du, Y.; Ke, X.; Li, J.; Wang, Y.; Cao, G.; Guo, X.; Chen, K. Nitrogen Deposition Increases Global Grassland N2O Emission Rates Steeply: A Meta-Analysis. Catena 2021, 199, 105105. [Google Scholar] [CrossRef]
- You, L.; Ros, G.H.; Chen, Y.; Yang, X.; Cui, Z.; Liu, X.; Jiang, R.; Zhang, F.; de Vries, W. Global Meta-Analysis of Terrestrial Nitrous Oxide Emissions and Associated Functional Genes under Nitrogen Addition. Soil Biol. Biochem. 2022, 165, 108523. [Google Scholar] [CrossRef]
- Guo, Y.; Dong, Y.; Peng, Q.; Li, Z.; He, Y.; Yan, Z.; Qin, S. Effects of Nitrogen and Water Addition on N2O Emissions in Temperate Grasslands, Northern China. Appl. Soil Ecol. 2022, 177, 104548. [Google Scholar] [CrossRef]
- Hergoualc’h, K.; Mueller, N.; Bernoux, M.; Kasimir, Ä.; van der Weerden, T.J.; Ogle, S.M. Improved Accuracy and Reduced Uncertainty in Greenhouse Gas Inventories by Refining the IPCC Emission Factor for Direct N2O Emissions from Nitrogen Inputs to Managed Soils. Glob. Chang. Biol. 2021, 27, 6536–6550. [Google Scholar] [CrossRef]
- Cai, Y.; Chang, S.X.; Ma, B.; Bork, E.W. Watering Increased DOC Concentration but Decreased N2O Emission from a Mixed Grassland Soil under Different Defoliation Regimes. Biol. Fertil. Soils 2016, 52, 987–996. [Google Scholar] [CrossRef]
- Long, X.-E.; Shen, J.-P.; Wang, J.-T.; Zhang, L.-M.; Di, H.; He, J.-Z. Contrasting Response of Two Grassland Soils to N Addition and Moisture Levels: N2O Emission and Functional Gene Abundance. J. Soils Sediments 2017, 17, 384–392. [Google Scholar] [CrossRef]
- Horváth, L.; Grosz, B.; Machon, A.; Tuba, Z.; Nagy, Z.; Czóbel, S.Z.; Balogh, J.; Péli, E.; Fóti, S.Z.; Weidinger, T.; et al. Estimation of Nitrous Oxide Emission from Hungarian Semi-Arid Sandy and Loess Grasslands; Effect of Soil Parameters, Grazing, Irrigation and Use of Fertilizer. Agric. Ecosyst. Environ. 2010, 139, 255–263. [Google Scholar] [CrossRef]
- Wagner-Riddle, C.; Baggs, E.M.; Clough, T.J.; Fuchs, K.; Petersen, S.O. Mitigation of Nitrous Oxide Emissions in the Context of Nitrogen Loss Reduction from Agroecosystems: Managing Hot Spots and Hot Moments. Curr. Opin. Environ. Sustain. 2020, 47, 46–53. [Google Scholar] [CrossRef]
- Yue, P.; Zuo, X.; Li, K.; Li, X.; Wang, S.; Misselbrook, T. No Significant Change Noted in Annual Nitrous Oxide Flux under Precipitation Changes in a Temperate Desert Steppe. Land Degrad. Dev. 2022, 33, 94–103. [Google Scholar] [CrossRef]
- Liu, W.; Lü, X.-T.; Yang, Y.; Hou, L.; Shao, C.; Yuan, W.; Pan, Q.; Li, L. Hot Moments of N2O Emission Under Water and Nitrogen Management in Three Types of Steppe. J. Geophys. Res. Biogeosci. 2022, 127, e2022JG006877. [Google Scholar] [CrossRef]
- Li, K.; Gong, Y.; Song, W.; Lv, J.; Chang, Y.; Hu, Y.; Tian, C.; Christie, P.; Liu, X. No Significant Nitrous Oxide Emissions during Spring Thaw under Grazing and Nitrogen Addition in an Alpine Grassland. Glob. Chang. Biol. 2012, 18, 2546–2554. [Google Scholar] [CrossRef]
- Wang, L.; Qi, Y.; Dong, Y.; Peng, Q.; Guo, S.; He, Y.; Li, Z. Effects and Mechanism of Freeze-Thawing Cycles on the Soil N2O Fluxes in the Temperate Semi-Arid Steppe. J. Environ. Sci. 2017, 56, 192–201. [Google Scholar] [CrossRef] [PubMed]
- Perez, M.G.; Romaniuk, R.I.; Cosentino, V.R.N.; Busto, M.; Gonzalez, F.A.; Taboada, M.A.; Alves, B.J.R.; Costantini, A.O. Winter Soil N2O Emissions from a Meat Production System under Direct Grazing of Argentine Pampa. Anim. Prod. Sci. 2021, 61, 156–162. [Google Scholar] [CrossRef]
- Li, Y.; Shen, Y.; Wang, T. Freezing and Thawing Cycles Affect Nitrous Oxide Emissions in Rain-Fed Lucerne (Medicago Sativa) Grasslands of Different Ages. PeerJ 2021, 9, e12216. [Google Scholar] [CrossRef] [PubMed]
- Du, R.; Lu, D.; Wang, G. Diurnal, Seasonal, and Inter-Annual Variations of N2O Fluxes from Native Semi-Arid Grassland Soils of Inner Mongolia. Soil Biol. Biochem. 2006, 38, 3474–3482. [Google Scholar] [CrossRef]
- Merbold, L.; Steinlin, C.; Hagedorn, F. Winter Greenhouse Gas Fluxes (CO2, CH4 and N2O) from a Subalpine Grassland. Biogeosciences 2013, 10, 3185–3203. [Google Scholar] [CrossRef]
- Fay, P.A.; Prober, S.M.; Harpole, W.S.; Knops, J.M.H.; Bakker, J.D.; Borer, E.T.; Lind, E.M.; MacDougall, A.S.; Seabloom, E.W.; Wragg, P.D.; et al. Grassland Productivity Limited by Multiple Nutrients. Nat. Plants 2015, 1, 15080. [Google Scholar] [CrossRef]
- Zhang, K.; Zhu, Q.; Liu, J.; Wang, M.; Zhou, X.; Li, M.; Wang, K.; Ding, J.; Peng, C. Spatial and Temporal Variations of N2O Emissions from Global Forest and Grassland Ecosystems. Agric. For. Meteorol. 2019, 266–267, 129–139. [Google Scholar] [CrossRef]
- Kong, L.; Song, J.; Ru, J.; Feng, J.; Hou, J.; Wang, X.; Zhang, Q.; Wang, H.; Yue, X.; Zhou, Z.; et al. Nitrogen Addition Does Not Alter Symmetric Responses of Soil Respiration to Changing Precipitation in a Semi-Arid Grassland. Sci. Total Environ. 2024, 921, 171170. [Google Scholar] [CrossRef]
- Yan, Z.; Qi, Y.; Dong, Y.; Peng, Q.; Guo, S.; He, Y.; Li, Z. Precipitation and Nitrogen Deposition Alter Litter Decomposition Dynamics in Semiarid Temperate Steppe in Inner Mongolia, China. Rangel. Ecol. Manag. 2018, 71, 220–227. [Google Scholar] [CrossRef]
- Keller, M.; Reiners, W.A. Soil-Atmosphere Exchange of Nitrous Oxide, Nitric Oxide, and Methane under Secondary Succession of Pasture to Forest in the Atlantic Lowlands of Costa Rica. Glob. Biogeochem. Cycles 1994, 8, 399–409. [Google Scholar] [CrossRef]
- Qiu, J. A Global Synthesis of the Effects of Biological Invasions on Greenhouse Gas Emissions. Glob. Ecol. Biogeogr. 2015, 24, 1351–1362. [Google Scholar] [CrossRef]
- Brin, L.D.; Goyer, C.; Zebarth, B.J.; Burton, D.L.; Chantigny, M.H. Changes in Snow Cover Alter Nitrogen Cycling and Gaseous Emissions in Agricultural Soils. Agric. Ecosyst. Environ. 2018, 258, 91–103. [Google Scholar] [CrossRef]
- Li, J.; Yao, N.; Li, X.; Zhao, Y.; Zhang, A.; Lan, Z.-L.; Fan, T. Dynamics of CO2 and N2O in Seasonal Frozen Soil Profiles for a Typical Steppe in Inner Mongolia. Environ. Sci. 2018, 39, 2330–2338. [Google Scholar] [CrossRef]
- Liu, H.; Li, Y.; Pan, B.; Zheng, X.; Yu, J.; Ding, H.; Zhang, Y. Pathways of Soil N2O Uptake, Consumption, and Its Driving Factors: A Review. Environ. Sci. Pollut. Res. 2022, 29, 30850–30864. [Google Scholar] [CrossRef]
- Frasier, R.; Ullah, S.; Moore, T.R. Nitrous Oxide Consumption Potentials of Well-Drained Forest Soils in Southern Québec, Canada. Geomicrobiol. J. 2010, 27, 53–60. [Google Scholar] [CrossRef]
- Hu, J.; Inglett, K.S.; Clark, M.W.; Inglett, P.W.; Reddy, K.R. Nitrous Oxide Production and Consumption by Denitrification in a Grassland: Effects of Grazing and Hydrology. Sci. Total Environ. 2015, 532, 702–710. [Google Scholar] [CrossRef] [PubMed]
- Stuchiner, E.R.; von Fischer, J.C. Using Isotope Pool Dilution to Understand How Organic Carbon Additions Affect N2O Consumption in Diverse Soils. Glob. Chang. Biol. 2022, 28, 4163–4179. [Google Scholar] [CrossRef] [PubMed]
- Gao, Y.; Mania, D.; Mousavi, S.A.; Lycus, P.; Arntzen, M.Ø.; Woliy, K.; Lindström, K.; Shapleigh, J.P.; Bakken, L.R.; Frostegård, Å. Competition for Electrons Favours N2O Reduction in Denitrifying Bradyrhizobium Isolates. Environ. Microbiol. 2021, 23, 2244–2259. [Google Scholar] [CrossRef] [PubMed]
- Kim, D.D.; Han, H.; Yun, T.; Song, M.J.; Terada, A.; Laureni, M.; Yoon, S. Identification of nosZ-Expressing Microorganisms Consuming Trace N2O in Microaerobic Chemostat Consortia Dominated by an Uncultured Burkholderiales. ISME J. 2022, 16, 2087–2098. [Google Scholar] [CrossRef] [PubMed]
- Li, D.; Watson, C.J.; Yan, M.J.; Lalor, S.; Rafique, R.; Hyde, B.; Lanigan, G.; Richards, K.G.; Holden, N.M.; Humphreys, J. A Review of Nitrous Oxide Mitigation by Farm Nitrogen Management in Temperate Grassland-Based Agriculture. J. Environ. Manag. 2013, 128, 893–903. [Google Scholar] [CrossRef] [PubMed]
- Wang, C.; Amon, B.; Schulz, K.; Mehdi, B. Factors That Influence Nitrous Oxide Emissions from Agricultural Soils as Well as Their Representation in Simulation Models: A Review. Agronomy 2021, 11, 770. [Google Scholar] [CrossRef]
- Espinoza, N.; Franklin, D.H.; Cabrera, M.; Hinkle, N.C.; Stewart, L.; Subedi, A. Interaction of Filth Flies and Epigeal Arthropods with Soil Nitrogen and Gas Emissions in Grazing Systems under a Legacy of Low Fertilization. Sustainability 2023, 15, 12572. [Google Scholar] [CrossRef]
- Li, W.; Zhang, Y.; Wang, H.; Fan, B.; Bashir, M.A.; Jin, K.; Liu, H. Legacy Effect of Long-Term Rice–Crab Co-Culture on NO Emissions in Paddy Soils. Appl. Soil Ecol. 2024, 196, 105251. [Google Scholar] [CrossRef]
- Qin, S.; Hu, C.; Clough, T.J.; Luo, J.; Oenema, O.; Zhou, S. Irrigation of DOC-Rich Liquid Promotes Potential Denitrification Rate and Decreases N2O/(N2O + N2) Product Ratio in a 0–2 m Soil Profile. Soil Biol. Biochem. 2017, 106, 1–8. [Google Scholar] [CrossRef]
- Thuan, N.C.; Koba, K.; Yano, M.; Makabe, A.; Kinh, C.T.; Terada, A.; Toyoda, S.; Yoshida, N.; Tanaka, Y.; Katsuyama, M.; et al. N2O Production by Denitrification in an Urban River: Evidence from Isotopes, Functional Genes, and Dissolved Organic Matter. Limnology 2018, 19, 115–126. [Google Scholar] [CrossRef]
- Lee, J.-M.; Park, D.-G.; Kang, S.-S.; Choi, E.-J.; Gwon, H.-S.; Lee, H.-S.; Lee, S.-I. Short-Term Effect of Biochar on Soil Organic Carbon Improvement and Nitrous Oxide Emission Reduction According to Different Soil Characteristics in Agricultural Land: A Laboratory Experiment. Agronomy 2022, 12, 1879. [Google Scholar] [CrossRef]
- Li, H.; Song, X.; Wu, D.; Wei, D.; Li, Y.; Ju, X. Partial Substitution of Manure Increases N2O Emissions in the Alkaline Soil but Not Acidic Soils. J. Environ. Manag. 2024, 359, 120993. [Google Scholar] [CrossRef] [PubMed]
- Brown, J.R.; Blankinship, J.C.; Niboyet, A.; van Groenigen, K.J.; Dijkstra, P.; Le Roux, X.; Leadley, P.W.; Hungate, B.A. Effects of Multiple Global Change Treatments on Soil N2O Fluxes. Biogeochemistry 2012, 109, 85–100. [Google Scholar] [CrossRef]
- Barrat, H.A.; Evans, J.; Chadwick, D.R.; Clark, I.M.; Le Cocq, K.; Cardenas, L.M. The Impact of Drought and Rewetting on N2O Emissions from Soil in Temperate and Mediterranean Climates. Eur. J Soil Sci. 2021, 72, 2504–2516. [Google Scholar] [CrossRef]
- Liu, X.; Dong, Y.; Qi, Y.; Peng, Q.; He, Y.; Sun, L.; Jia, J.; Guo, S.; Cao, C.; Yan, Z.; et al. Response of N2O Emission to Water and Nitrogen Addition in Temperate Typical Steppe Soil in Inner Mongolia, China. Soil Tillage Res. 2015, 151, 9–17. [Google Scholar] [CrossRef]
- Koponen, H.T.; Martikainen, P.J. Soil Water Content and Freezing Temperature Affect Freeze–Thaw Related N2O Production in Organic Soil. Nutr. Cycl. Agroecosystems 2004, 69, 213–219. [Google Scholar] [CrossRef]
- Wu, X.; Li, T.; Wang, D.; Wang, F.; Fu, B.; Liu, G.; Lv, Y. Soil Properties Mediate the Freeze-Thaw-Related Soil N2O and CO2 Emissions from Temperate Grasslands. Catena 2020, 195, 104797. [Google Scholar] [CrossRef]
- Holst, J.; Liu, C.; Yao, Z.; Brueggemann, N.; Zheng, X.; Giese, M.; Butterbach-Bahl, K. Fluxes of Nitrous Oxide, Methane and Carbon Dioxide during Freezing-Thawing Cycles in an Inner Mongolian Steppe. Plant Soil 2008, 308, 105–117. [Google Scholar] [CrossRef]
- Jia, Z.; Li, P.; Wu, Y.; Yang, S.; Wang, C.; Wang, B.; Yang, L.; Wang, X.; Li, J.; Peng, Z.; et al. Deepened Snow Cover Alters Biotic and Abiotic Controls on Nitrogen Loss during Non-Growing Season in Temperate Grasslands. Biol. Fertil. Soils 2021, 57, 165–177. [Google Scholar] [CrossRef]


Disclaimer/Publisher’s Note: The statements, opinions and data contained in all publications are solely those of the individual author(s) and contributor(s) and not of MDPI and/or the editor(s). MDPI and/or the editor(s) disclaim responsibility for any injury to people or property resulting from any ideas, methods, instructions or products referred to in the content. |
© 2024 by the authors. Licensee MDPI, Basel, Switzerland. This article is an open access article distributed under the terms and conditions of the Creative Commons Attribution (CC BY) license (https://creativecommons.org/licenses/by/4.0/).