Article

Cereal-Legume Mixed Residue Addition Increases Yield and Reduces Soil Greenhouse Gas Emissions from Fertilized Winter Wheat in the North China Plain

1
Key Laboratory of Agricultural Water Resources, Hebei Key Laboratory of Soil Ecology, Center for Agricultural Resources Research, Institute of Genetics and Developmental Biology, Chinese Academy of Sciences, 286 Huaizhong Road, Shijiazhuang 050021, China
2
University of Chinese Academy of Sciences, 19A Yuquan Road, Beijing 100049, China
3
Hebei Key Laboratory of Water-Saving Agriculture, Center for Agricultural Resources Research, Institute of Genetics and Developmental Biology, Chinese Academy of Sciences, 286 Huaizhong Road, Shijiazhuang 050021, China
*
Authors to whom correspondence should be addressed.
Agronomy 2024, 14(6), 1167; https://doi.org/10.3390/agronomy14061167
Submission received: 18 April 2024 / Revised: 15 May 2024 / Accepted: 28 May 2024 / Published: 29 May 2024
(This article belongs to the Special Issue Nutrient Cycling and Environmental Effects on Farmland Ecosystems)

Abstract

:
Incorporating crop residues into the soil is an effective method for improving soil carbon sequestration, fertility, and crop productivity. Such potential benefits, however, may be offset if residue addition leads to a substantial increase in soil greenhouse gas (GHG) emissions. This study aimed to quantify the effect of different crop residues with varying C/N ratios and different nitrogen (N) fertilizers on GHG emissions, yield, and yield-scaled emissions (GHGI) in winter wheat. The field experiment was conducted during the 2018–2019 winter wheat season, comprising of four residue treatments (no residue, maize residue, soybean residue, and maize-soybean mixed residue) and four fertilizer treatments (control, urea, manure, and manure + urea). The experiment followed a randomized split-plot design, with N treatments as the main plot factor and crop residue treatments as the sub-plot factor. Except for the control, all N treatments received 150 kg N ha−1 season−1. The results showed that soils from all treatments acted as a net source of N2O and CO2 fluxes but as a net sink of CH4 fluxes. Soybean residue significantly increased soil N2O emissions, while mixed residue had the lowest N2O emissions among the three residues. However, all residue amendments significantly increased soil CO2 emissions. Furthermore, soybean and mixed residues significantly increased grain yield by 24% and 21%, respectively, compared to no residue amendment. Both soybean and mixed residues reduced GHGI by 25% compared to maize residue. Additionally, the urea and manure + urea treatments exhibited higher N2O emissions among the N treatments, but they contributed to significantly higher grain yields and resulted in lower GHGI. Moreover, crop residue incorporation significantly altered soil N dynamics. In soybean residue-amended soil, both NH4+ and NO3 concentrations were significantly higher (p < 0.05). Conversely, soil NO3 content was notably lower in the maize-soybean mixed residue amendment. Overall, our findings contribute to a comprehensive understanding of how different residue additions from different cropping systems influence soil N dynamics and GHG emissions, offering valuable insights into effective agroecosystems management for long-term food security and soil sustainability while mitigating GHG emissions.

1. Introduction

Global agriculture is confronted with the dual challenge of increasing crop productivity and sustainability to meet growing demands for food production while mitigating environmental impacts. Crop residue management, particularly the incorporation of residues from preceding crops into agricultural soils, has been widely accepted as a way to improve soil fertility and crop yield [1], increase soil carbon (C) sequestration, and offset greenhouse gas (GHG) emissions in agriculture [2]. The carbon stored in residues can either be retained in the soil as organic matter or released back into the atmosphere through microbial decomposition [3], affecting the overall carbon budget of agricultural ecosystems. It has been estimated that global soil C sequestration could reach approximately 0.3 billion tons per year with crop residue amendment [4]. This potential of soil C sequestration, however, can be offset if crop residue amendment substantially increases soil GHG emissions, particularly nitrous oxide (N2O), carbon dioxide (CO2), and methane (CH4).
China, as the world’s largest crop residue producer, contributes approximately 20% of the total global production, with an estimated national crop residue production of 737 × 106 tons [5]. Traditionally, crop residues were often burned or left in/around the fields. Currently, around 30% of total crop residues in China are being incorporated into the soil [6,7]. The Chinese government has also implemented subsidies and supportive policies to encourage farmers to adopt residue incorporation into the soil in recent years [6]. Consequently, managing these crop residues has become a significant concern for scientists and policymakers [8].
Several studies have reported that incorporating crop residues into the soil substantially enhances soil microbial biomass and activity, accelerates organic matter decomposition rates, and promotes nutrient cycling processes [9,10], resulting in a significant increase in CO2 and N2O emissions from the soil [11]. Moreover, crop residue incorporation can induce changes in various soil parameters, including soil mineral N (NH4+ and NO3) concentration, dissolved organic carbon (DOC), pH levels, C/N ratio, soil moisture, and temperature, which collectively dictate the magnitude and direction of these emissions. The rate of CO2 and N2O emissions after residue incorporation primarily depends on the quality and quantity of residues [10,12,13]. Among residue characteristics, the most important properties are the C and N concentrations of the residues as well as the C/N ratio, which determines the dynamics of organic N and C in the soil [14]. A meta-analysis of existing literature also revealed that the emission factor (EFN2O) of crop residues varies widely among cereal and legume residues due to their varying C/N ratios [4]. Notably, crop residues with low C/N ratios, such as legumes, tend to result in higher N2O emissions due to rapid mineralization [15,16,17]. Conversely, residues with high C/N ratios may lead to net N immobilization during decomposition, thereby reducing N2O emissions [4,18].
The dominant biological processes contributing to N2O emissions include nitrification, denitrification, and nitrifier denitrification [19]. Specific soil physicochemical properties also play a crucial role in enhancing microbial formation of N2O. For instance, the presence of soil mineral N (NH4+ and NO3) and a carbon (C) source in the soil create favorable conditions for N2O production through nitrification and denitrification processes [11,20]. Additionally, the introduction of a labile C source, such as cereal crop residue or root exudates, can stimulate microbial activities, leading to increased CO2 emissions. Crop residues serve as organic C substrates for microbial growth, thereby promoting microbial N assimilation. Consequently, strong competition for NH4+ between autotrophic nitrifiers and heterotrophic microorganisms results in N immobilization and reduced N2O production [12,21]. Furthermore, crop residues provide energy for denitrifiers, thereby enhancing denitrification and N2O production under anaerobic conditions [4]. Overall, soil moisture significantly influences nitrification and denitrification activities by regulating soil oxygen availability and redox potential [22]. It has been observed that nitrification dominates soil N2O production when the soil has 30–60% water-filled pore space (WFPS), while denitrification rates rapidly increase when the WFPS exceeds 60% [4,22].
Among the crop residues, cereal (e.g., maize) and legume (e.g., soybean) residues, varying in biochemical composition, lignocellulosic content, and decomposition rates, exert significant influence on soil physicochemical properties, microbial dynamics, nutrient cycling, and subsequent soil GHG emissions. Maize residues are typically characterized by higher lignocellulosic content, a higher C/N ratio, and slower decomposition rates [23]. Conversely, soybean residues, with relatively lower lignin content, higher N concentration, and a lower C/N ratio, tend to decompose faster, offering immediate nutrient availability, resulting in higher nitrification and denitrification in the soil compared to maize residues [24]. The incorporation of a mixed residue involving maize and soybean residues, often observed in intercropping or sequential cropping systems, represents a confluence of contrasting residue characteristics. The synergistic effects of carbon-rich maize and nitrogen-rich soybean residues could alter soil microbial activity, C and N cycling, and nutrient availability [9], potentially affecting crop growth, productivity and soil GHG emissions differently than single-crop residue incorporation practices. While the effect of cereal and legume residue retention on soil nutrient dynamics and GHG emissions has been extensively studied before [3,12,13,16], the impact of cereal-legume mixed residue, especially maize-soybean mixed residue amendment, on soil nutrient dynamics and GHG emissions remains unknown. Thus, understanding the specific impacts of maize, soybean, and their mixed residue incorporation on soil GHG emissions is essential for devising sustainable agricultural practices that minimize environmental impacts while maintaining soil fertility and productivity.
Another crucial agricultural practice, alongside crop residue incorporation, is the application of N fertilizer. N fertilizers are commonly applied to foster straw mineralization and ensure sufficient available N for crop growth. However, N addition not only promotes residue mineralization and crop yield but also significantly increases soil GHG emissions [25,26]. Urea, due to its rapid denitrification in the soil, has the highest potential for field-scale GHG emissions among synthetic N fertilizers [27]. Mairura et al. [28] reported that combined applications of manure and synthetic fertilizers can substantially reduce global warming potential and yield-scaled GHG emissions without compromising yield. Based on this evidence, we can hypothesize that substituting a part of urea with manure could effectively reduce GHG emissions from agricultural fields.
While the effects of residue incorporation on soil N2O emissions have been extensively studied [12,29,30], the net GHG emissions, including N2O, CO2, and CH4, from crop residue, particularly from maize-soybean mixed residue amendment, have not been thoroughly investigated. Furthermore, the synergistic effects of crop residue amendment and types of N fertilizer on soil GHG emissions from winter wheat are unknown and need further research. The objective of the present study was (1) to investigate the effects of incorporating different crop residues on N2O, CO2, and CH4 emissions, as well as global warming potential, under different types of N fertilizer treatments; (2) to investigate the effect of crop residue and N fertilizer on winter wheat yield and yield-scaled GHG emissions (GHGI); and (3) to analyze the effect of crop residue amendment and N fertilizer type on various soil properties and their relationship with N2O, CO2, and CH4 emissions from the soil.

2. Materials and Methods

2.1. Site Description

The field experiment spanned the 2018–2019 winter wheat growing season and was conducted at the Luancheng Agro-Ecosystem Experimental Station (37°89′ N, 114°68′ E; elevation 50 m above sea level), part of the Chinese Academy of Sciences in the North China Plain (NCP) region of Hebei province. Initially, our field experiment was designed to span two growing seasons (2018–2019 and 2019–2020). However, due to the lockdown during the COVID-19 pandemic in China, data collection was halted for the second half of the 2019–2020 growing season. This NCP region features a temperate, semi-arid monsoon climate typified by cold winters and scorching summers. The annual average temperature in 2018 and 2019 was 14 °C, while the annual average precipitation was 368 mm, with the majority falling in July, August, and September. The average, maximum, and minimum air temperatures during the growing season were 8 °C, 38 °C, and −17 °C, respectively. Figure 1 depicts the daily mean, maximum, and minimum air temperatures, alongside precipitation levels during the experimental period. All meteorological data were obtained from the Luancheng Meteorological Station, which is located within the Luancheng Experimental Station. The soil in this location is classified as a silt loam Haplic Cambisol [31]. Within the top 0–20 cm soil layer, the soil contains 15 g kg−1 of organic matter, 1.1 g kg−1 of total nitrogen, 15 mg kg−1 of available phosphorus (P-Olsen), and 95 mg kg−1 of exchangeable potassium.
The NCP serves as a pivotal grain-producing region in China, contributing 75% and 35% to the nation’s wheat and maize production, respectively [32]. The prevalent cropping system in this region is the winter wheat-summer maize (or soybean) double-cropping system. Both wheat and maize are irrigated via flooding irrigation using groundwater. Summer maize (or soybean) is planted around mid-June and harvested in early October, while winter wheat is sown in mid-October and harvested in early June.

2.2. Experimental Design

The field experiment was initiated in October 2018, encompassing four crop residue and four nitrogen (N) treatments. The crop residue treatments included (i) no residue (R0), (ii) maize residue (MR), (iii) soybean residue (SR), and (iv) maize-soybean mixed residue (MSR). Concurrently, the N treatments encompassed (i) control (no nitrogen), (ii) urea, (iii) manure, and (iv) a combination of manure and urea. The residues used in this experiment were obtained from a maize-soybean intercrop study conducted in the respective plot during the summer season, employing the same N treatments. This means that the maize-soybean mixed residue comes from the maize-soybean intercrop, while the maize and soybean sole residues come from their respective monocultures. On average, maize residue amounted to 9.1 t ha−1, soybean residue amounted to 3.04 t ha−1, and maize-soybean mixed residue amounted to 8.2 t ha−1 (with maize residue contributing 7.1 t ha−1 and soybean residue contributing 1.1 t ha−1) were incorporated into the soil. The average C/N ratios of maize residue, soybean residue, and maize-soybean mixed residue were 62, 16, and 46, respectively. In plots designated for the no residue treatment, maize cultivation took place during the summer season, and residues were manually removed post-harvest. Subsequently, all crop residues were shredded into small pieces (<10 cm fragments) using a mechanical shredder.
All N treatments, excluding the control, received 150 kg N ha−1 season−1, applied either entirely as a basal application or split equally into two applications. Details regarding the N, P, and K applications are presented in Table S1. The composted poultry manure utilized (obtained from Shijiazhuang Ikos Agricultural Technology Co., Ltd., Shijiazhuang, China) contained 40% organic matter, 0.7% mineral N, 2.1% total N, 1.9% P2O5, and 1.1% K2O. The manure treatment received the full N dose as a basal application, while the urea and manure + urea treatments received half of the N (75 kg N ha−1) as a basal application, with the remaining half applied as top dressing. Additionally, all treatments received 75 kg P2O5 ha−1 as calcium superphosphate and 100 kg K2O ha−1 as potassium chloride before planting. Manure and fertilizer along with crop residues were uniformly incorporated into the soil to a depth of 15 cm using a rototiller within 3 h of application.
The experiment followed a randomized split-plot design, where the main plot factor consisted of the N treatment, and the subplot factor encompassed the crop residue treatment, each replicated three times. Each sub-plot was 160 m2 (16 m × 10 m) in size and was separated by a 1 m buffer. Winter wheat (Triticum aestivum cv. Shiluan02-1) was planted in a north-south orientation, with rows spaced 15 cm apart and a seeding rate of 170 kg ha−1. To ensure adequate soil moisture for seed germination, one irrigation was administered one week before planting, complementing the three irrigation cycles during the growing season. The management regimen included herbicide and insecticide applications, weed control, and other standard agricultural practices aligned with local farming norms. Further details regarding management activities are available in Table S2. Harvesting of the wheat crop took place using mechanical harvesters on 9 June 2019. Subsequently, all crop residues were reintegrated into the plots, receiving identical N treatments as before, and incorporated into the soil using a rototiller to prepare for the subsequent summer crop.

2.3. Gas Flux Measurements

The gas samples were collected using non-steady-state static chambers. Immediately after sowing, in each plot, an open-ended base collar made of polymethyl methacrylate (60 cm length, 20 cm width, and 7 cm height) was placed into the soil at a depth of approximately 5 cm. To minimize edge effects, these collars were positioned 3–4 m inside the plot and remained in place from planting to harvesting. The gas sampling chambers, also constructed from temperature-isolated polymethyl methacrylate (PMMA) measuring 60 cm × 20 cm × 40 cm (length × width × height), were equipped with an internal fan powered by a battery. This fan ensured uniform gas concentration and air temperature within the chamber. Additionally, each chamber featured a built-in thermometer to monitor internal temperature and a sampling tube with a three-way stopcock, securely attached to prevent any leakage.
Gas sampling occurred in the morning between 8 a.m. and 11 a.m., a period often considered representative of average daily flux emissions [33]. Sampling frequency varied throughout the cropping season: before and after winter, it was weekly; during peak winter (December–February), it was monthly due to low emissions resulting from frost conditions in the topsoil. However, after fertilizer application, gas samples were collected twice a week for two weeks, totaling 22 sampling events during the cropping season. During each sampling event, the chamber was positioned on the base collar for 60 min, and gas samples were drawn at 0, 20, 40, and 60 min intervals via the three-way stopcock. A water seal was employed between the base collar and chamber to prevent gas leakage during sampling. Each collection involved drawing 60 mL of gas using a polypropylene syringe connected to stopcocks and transferring it into pre-evacuated 100 mL gas sampling bags (Delin, Dalian, China) with a 25-gauge needle. Two additional thermometers were placed within the chamber during gas sampling, one at ground level and another at a 5 cm soil depth, to record ground and soil temperatures. To avoid potential GHG contributions from plant respiration, any weeds within the chamber base were clipped and removed before each sampling event.
The concentrations of N2O, CO2, and CH4 were quantified using gas chromatography (Agilent GC-6820, Agilent Technologies Inc., Santa Clara, CA, USA) equipped with a 63Ni Electron Capture Detector (ECD), a Flame Ionization Detector (FID), and a Thermal Conductivity Detector (TCD) for the detection of N2O, CO2, and CH4, respectively. Calibration was performed using standard gases. Soil GHG fluxes were calculated as the rate of change in gas concentration within the chamber headspace over the 60 min collection period. Gas flux rate F (µg m−2 h−1) was calculated using the following formula:
F = d c d t × M V 0 × V A × 273 273 + T × P P 0 × 60
where dc/dt is the slope of the changes of gas concentration over time in the chamber (ppbv min−1); M is the relative molecular mass of N2O (44 g mol−1), CO2 (44 g mol−1), and CH4 (16 g mol−1); V0 is the volume of an ideal gas (22.41 g mol−1); V is the volume of the chamber (m3); A is the soil surface area occupied by the chamber base (m2); T is the temperature (°C) inside the chamber; P is the atmospheric pressure (hPa) during gas sampling; P0 is the standard atmospheric pressure (hPa); and 60 is the conversion factor for minutes to hour.
Seasonal cumulative emissions of N2O, CO2, and CH4 (kg ha−1 season−1) from planting to harvesting were estimated by linear interpolation between successive sampling days, as described by Zhai et al. [34]:
S e a s o n a l   e m i s s i o n s = F i + 1 + F i 2 × t i + 1 t i × 24 × 1 100,000
where Fi and Fi+1 are the fluxes of N2O, CO2, and CH4 (µg m−2 h−1) at the previous and current gas sampling dates; ti and ti+1 are the previous and the current gas sampling dates; 24 is used to convert fluxes from h−1 to d−1; and 1/100,000 is used to convert fluxes from µg m−2 to kg ha−1.
The net global warming potential (Kg CO2-eq ha−1 season−1) was calculated using the warming potential coefficient (CO2 equivalent) of 298 for N2O, 34 for CH4 and 1 for soil CO2 emissions, based on a 100-year time scale of IPCC AR6 [35].
Yield-scaled GHG emissions (GHGI) were calculated using the following formula:
G H G I = G W P G Y
where GWP is the global warming potential (Kg CO2-eq ha−1 season−1), and GY is the grain yield (kg ha−1).

2.4. Soil and Plant Sampling and Analysis

2.4.1. Soil Sampling

Soil samples were collected at two-week intervals from the furrow slice depth of 0–15 cm, coinciding with the gas sampling schedule. The top 0–15 cm depth of soil was chosen as the focus of our study, as it encompasses near-surface soil processes that significantly influence nutrient dynamics and GHG emissions. Previous studies have indicated that crucial soil processes often occur within the 0–10 or 0–15 cm soil depths, which play a substantial role in soil nutrient dynamics and GHG emissions [36,37]. However, no soil sampling occurred during winter (from December to February) due to frost conditions of the soil surface. Each sample, obtained using a 4 cm diameter augur, represented an amalgamation from 4–5 random locations within each plot. Post collection, the soils from each plot were thoroughly mixed and refrigerated at 4 °C until further analysis.

2.4.2. Analysis of Soil Physical and Chemical Properties

The determination of gravimetric soil moisture content involved oven drying 60–70 g of field-moist soil at 105 °C for 48 h. Soil NO3 and exchangeable NH4+ content were evaluated by extracting 10 g of fresh soil with 50 mL of 1 M KCl solution (using a 1:5 w/v extraction ratio), followed by agitation for 60 min and filtration through Q5 filter paper, as previously described by Liu et al. [38]. Soil NO3 content was assessed using a dual-wavelength ultraviolet spectrophotometer (UV-2450, Shimadzu Corporation, Kyoto, Japan). The measurement of soil exchangeable NH4+ content was conducted using the Smartchem 140 discrete chemistry analyzer (AMS Alliance, Frepillon, France).
For the determination of soil C/N ratio, air-dried soil was ground and sieved through a 0.2 mm sieve. Subsequently, 150 mg of soil was used to prepare a capsule with tin foil and analyzed via dry combustion using a macro elemental analyzer (vario MACRO cube, Elementar, Hanau, Germany). Soil pH was assessed in a suspension containing 10 g of dry soil and 25 mL of distilled water (at a 1:2.5 w/v ratio) following 30 min of shaking. Analysis of soil dissolved organic carbon (DOC) involved extracting 10 g of soil with 50 mL of distilled water (using a 1:5 w/v ratio) and shaking for 60 min. The resulting solution underwent filtration through Q5 filter paper, followed by centrifugation at 8000 rpm for 5 min. The supernatant was further filtered through a 0.45 µm filter membrane and analyzed using a vario TOC cube auto-analyzer (Elementar, Hanau, Germany).

2.4.3. Yield and Biomass Analysis

To assess the impact of crop residue and N treatments on biomass production at different growth stages, above-ground plant biomass was collected from 0.45 m2 (3 rows for 1 m) at five distinct growth stages. The specific sampling dates were 24 March, 13 April, 29 April, 12 May, and 7 June, corresponding to the seedling, jointing, heading and booting, flowering, and maturity stages, respectively. Following collection, the plant samples were oven-dried at 65 °C until reaching a constant weight to determine the dry weight.
During physiological maturity, wheat samples were manually harvested from a 4 m2 area (2 m × 2 m) in each plot. The samples were then threshed using a mechanical thresher, sun-dried to achieve the standard 13% moisture content, and subsequently weighed to determine the grain yield.

2.5. Statistical Analysis

Data for all parameters were subjected to a normality assessment using the Shapiro–Wilk test, revealing non-normal distributions (p < 0.05), even following data transformation attempts. The impact of cropping systems and N treatments on various parameters (cumulative seasonal N2O, CO2, and CH4 emissions; grain yield; net global warming potential; and yield-scaled emissions) was assessed using analysis of variance (ANOVA). ANOVA was calculated using a general linear model, and when the main effects were significant (p ≤ 0.05), pairwise comparisons were analyzed using a post hoc least significant difference (LSD) test. To analyze the effect of cropping systems and N treatments on soil properties and environmental factors, data were analyzed by a non-parametric Kruskal–Wallis test. Significant main effects (p ≤ 0.05) underwent post hoc Mann–Whitney tests for pairwise comparisons.
The relationships between GHG fluxes (N2O, CO2, and CH4), soil properties (NH4+, NO3, soil C/N ratio, pH, and DOC concentrations), and environmental factors (soil moisture content and ground temperature, soil temperature at 5 cm depth) were performed using Spearman’s rho rank correlation coefficient analysis (p < 0.05; two-tailed test). ANOVA and non-parametric tests were performed by Minitab® 17 Statistical software (Minitab Inc., State College, PA, USA), while correlation analysis was performed by OriginPro 2021 software (OriginLab, Northampton, MA, USA).

3. Results

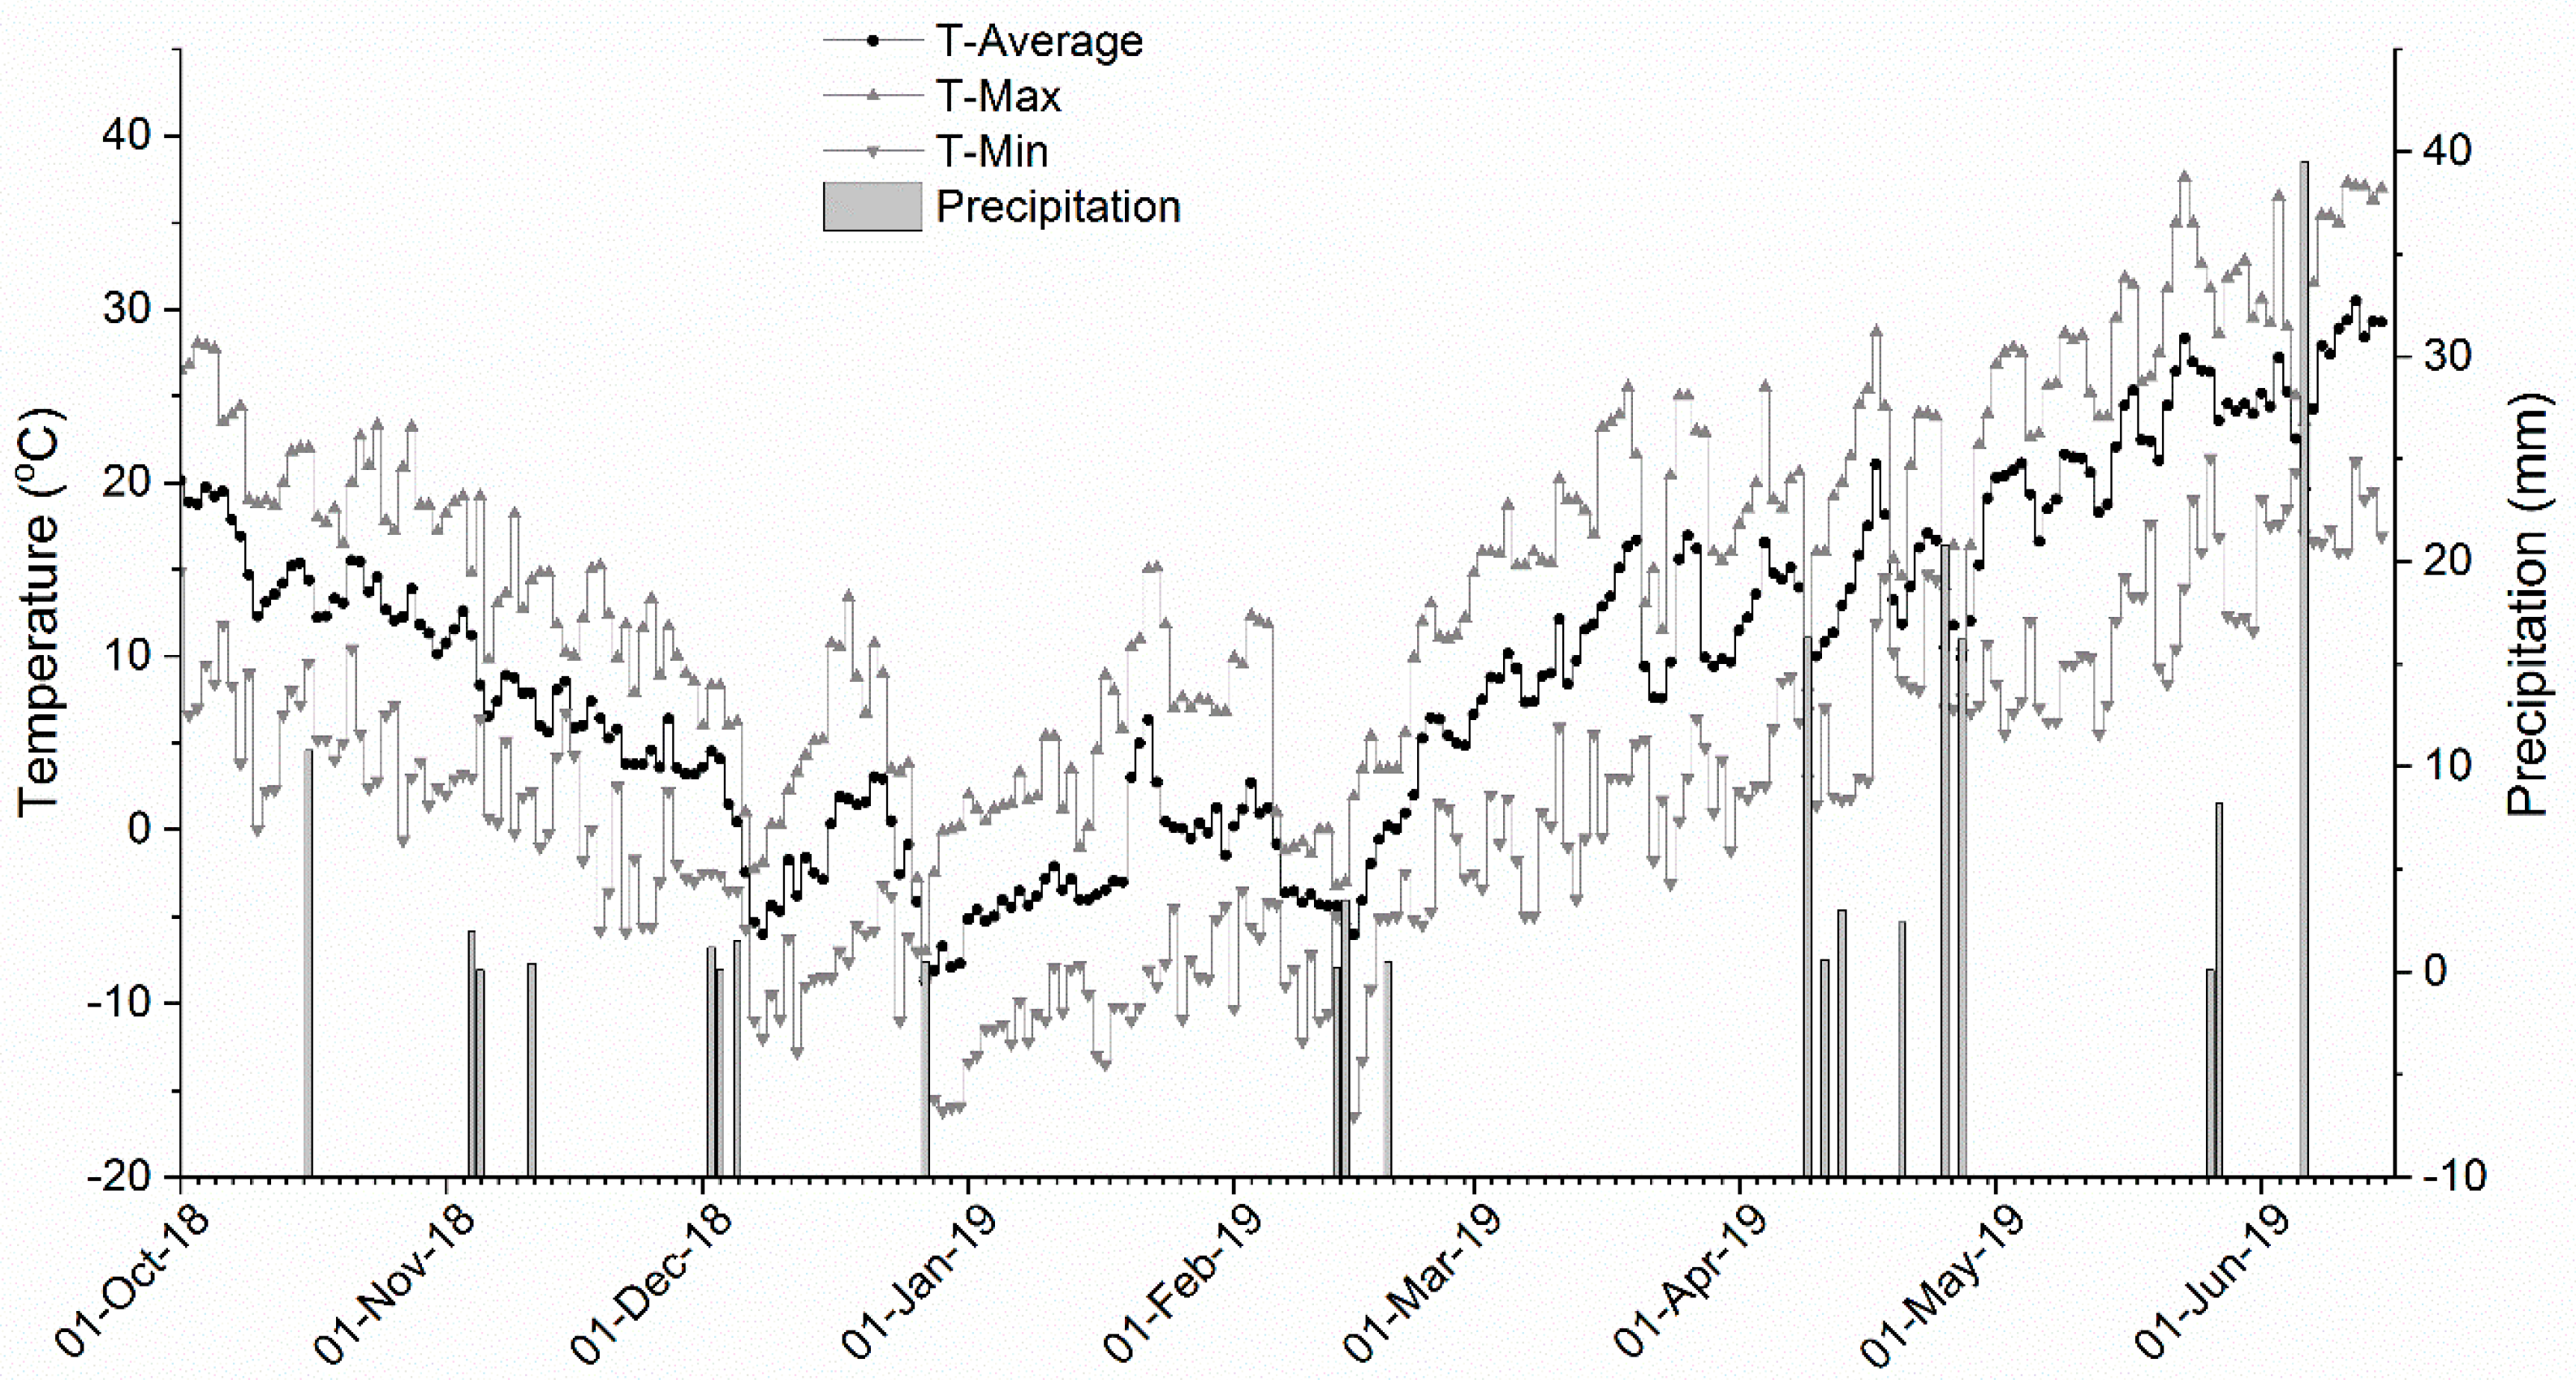
3.1. Weather Conditions

During the winter period (from December to February), the topsoil was in frost condition, with average air and soil (5 cm depth) temperatures of −1.5 °C, and −0.5 °C, respectively. The total precipitation during the growing season was 88 mm, significantly below the crop water requirements. To address moisture deficits in the soil, a series of three irrigations were administered in each plot (160 m2), totaling 60 mm, 65 mm, and 70 mm. As the growing season progressed, particularly during the flowering and maturity stages, daytime temperatures increased noticeably (Figure 1), reaching an average daily temperature of 23 °C.

3.2. Grain Yield and Biomass Dry Matter Production

Our ANOVA results showed that the incorporation of crop residues and nitrogen fertilizers, as well as their interactions, significantly affected winter wheat grain yield (Table 1). Both soybean and maize-soybean mixed residue amendments resulted in significantly higher yields (p < 0.05) compared to no residue, exhibiting increases of 24% and 21%, respectively (Table 2). Although not statistically significant, soybean and mixed residue amendments yielded 17% and 14% more grain, respectively, compared to maize residue amendment. Correspondingly, soybean and mixed residue treatments also notably impacted biomass production at various growth stages (Figure 2a). By the maturity stage, both treatments produced significantly higher biomass than the no-residue treatment. Additionally, incorporation of maize residue showed a significantly lower impact on wheat biomass production compared to the soybean residue treatment.
Regarding the nitrogen treatments, wheat yield showed significant increases in the urea and manure + urea treatments in contrast to the manure and control (Figure 2b). Consistently, throughout the growing season, urea and manure + urea amendments demonstrated a robust impact on biomass yield, culminating in significantly higher biomass at the maturity stage compared to the manure and control treatments.

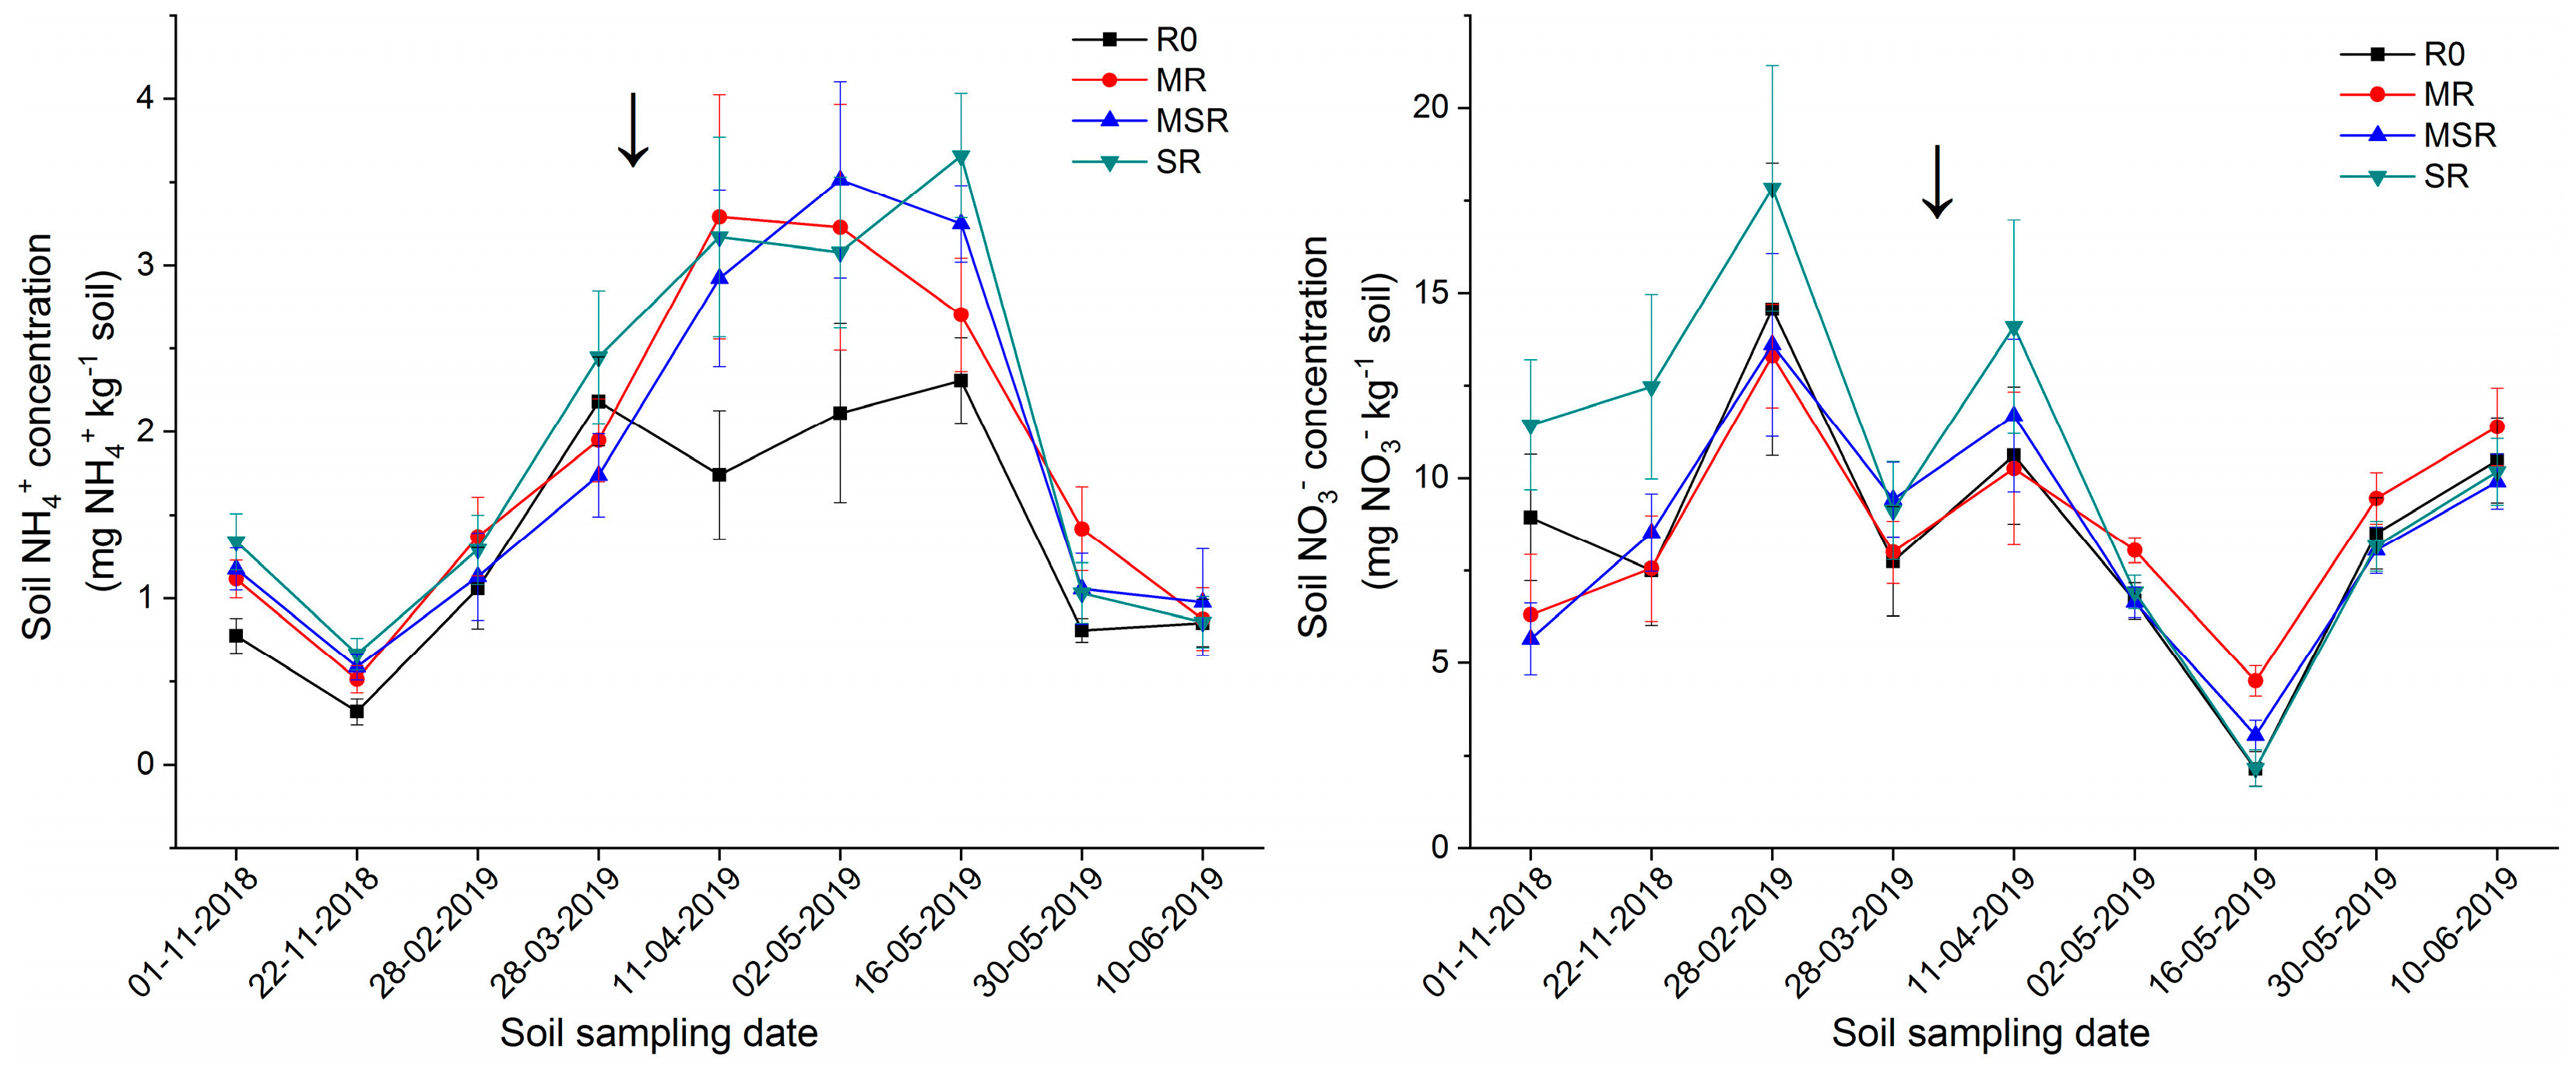
3.3. Crop Residue Effect on Soil Mineral N Concentration

The dynamics of mineral N (NH4+ and NO3) concentration in the soil are illustrated in Figure 3. The effect of crop residue on soil mineral N concentration varied throughout the growing season. Following the incorporation of crop residues, the NH4+ concentration in the soil was relatively lower until the end of winter, then gradually increased until the heading and booting stage, and subsequently decreased until harvesting. In contrast, the NO3 concentration in the soil was higher during the first half of the growing season, gradually declining until the flowering stage, and then increasing again until harvesting. Crop residue incorporation also showed a notable effect on soil mineral N concentration across different treatments. Our results indicate that NH4+ and NO3 concentrations were higher in the soils with soybean residue amendment during the initial stages of the growing season, suggesting rapid mineralization of soybean residue. Conversely, the NH4+ concentration in the no-residue treatment was consistently lower in most soil sampling events.

3.4. Soil N2O Emissions

Our ANOVA results indicate that the incorporation of crop residues, N fertilizers, and their interactions significantly influenced seasonal N2O emissions from the soil (Table 1). However, N2O fluxes from residue amended soils and N treatments varied across the gas sampling events. Throughout the growing season, N2O fluxes ranged from a minimum value of 2.5 µg m−2 h−1 to a maximum value of 600 µg m−2 h−1 in crop residue treatments, while in N treatments, fluxes ranged from −2 to 950 µg m−2 h−1 (Figure 4). Notably, N2O fluxes in the soybean residue amendment were consistently higher in most daily flux measurements, reaching a peak of 600.3 µg m−2 h−1 after top dressing. Consequently, soybean residue exhibited higher N2O emissions under all N treatments (Figure 5) and significantly increased cumulative N2O emissions by 36%, 27%, and 29% compared to no residue, maize residue, and maize-soybean mixed residue amendment, respectively (Table 2). However, total N2O emission from maize residue and maize-soybean mixed residue did not significantly differ from that of the no-residue treatment.
Additionally, N fertilizers significantly affected soil N2O emissions. Peak N2O fluxes occurred shortly after nitrogen fertilizer application during basal application and top dressing, coinciding with rainfall or irrigation events, and lasted for 1–2 weeks before returning to background emissions (Figure 4). Notably, the highest emissions occurred during top dressing rather than basal application of fertilizer. Consequently, both urea and manure + urea treatments produced significantly higher cumulative N2O emissions, which were 71% and 64% higher than manure amended soil, respectively, despite the same amount of N applied.
Furthermore, our correlation analysis revealed that soil N2O fluxes had a significant positive correlation with soil moisture content (r = 0.45; p < 0.01) (Figure 6), supporting our observations of higher N2O fluxes during irrigation and rainfall events. N2O fluxes also showed a significant positive correlation with soil temperature (r = 0.32; p < 0.01). Throughout the growing season, N2O emissions were positively correlated with soil NH4+ (r = 0.41; p < 0.01) and NO3 contents (r = 0.36; p < 0.01) but negatively associated with soil pH (r = −0.3; p < 0.05).

3.5. Soil CO2 Emissions

Crop residue amendments and their interactions with N treatments had a significant effect on soil CO2 emissions (p < 0.01) (Table 1). Following the incorporation of crop residues, soil CO2 fluxes were initially high but gradually decreased thereafter. These fluxes remained lower during the winter season and returned to their initial levels during the spring season (Figure 7). In most gas sampling events, maize residue exhibited higher soil CO2 fluxes compared to other residue treatments (Figure 7). However, all crop residue amendments significantly increased cumulative soil CO2 emissions (Table 2). Compared to no-residue amendment, maize residue, soybean residue, and maize-soybean mixed residue amendment led to a significant increase of 27%, 14%, and 16%, respectively, in soil CO2 emissions throughout the growing season. While there was no significant difference among the three crop residues, seasonal CO2 emissions were 10% and 9% lower in the soybean and maize-soybean mixed residue treatments, respectively, compared to maize residue. Nevertheless, maize residue exhibited lower soil CO2 emissions in the non-fertilized treatment but consistently emitted higher CO2 in the fertilized treatments (Figure 5), indicating the significant role of N in soil CO2 emissions from maize residue-amended soils.
In addition, the application of N fertilizers showed no significant effect on soil CO2 emissions (Table 1). However, among fertilized treatments, manure resulted in the highest cumulative CO2 emissions (Table 2), while maize residue under manure treatment producing the highest emissions of 8428 kg ha−1 CO2 (Figure 5). In our field study, we observed peak CO2 fluxes following irrigation events when soil moisture was high. Consequently, a strong positive correlation was found between soil moisture and CO2 fluxes (r = 0.31; p < 0.05) (Figure 6). Moreover, during the winter season, when the soil temperature was low, daily CO2 fluxes were minimal, while emissions were high during autumn and spring seasons, resulting in a highly significant positive correlation between soil temperature and CO2 fluxes throughout the study period (r = 0.79; p < 0.01). CO2 fluxes were also strongly correlated with N2O fluxes (r = 0.51; p < 0.01), soil NH4+ (r = 0.48; p < 0.01), and DOC concentration (r = 0.30; p < 0.05).

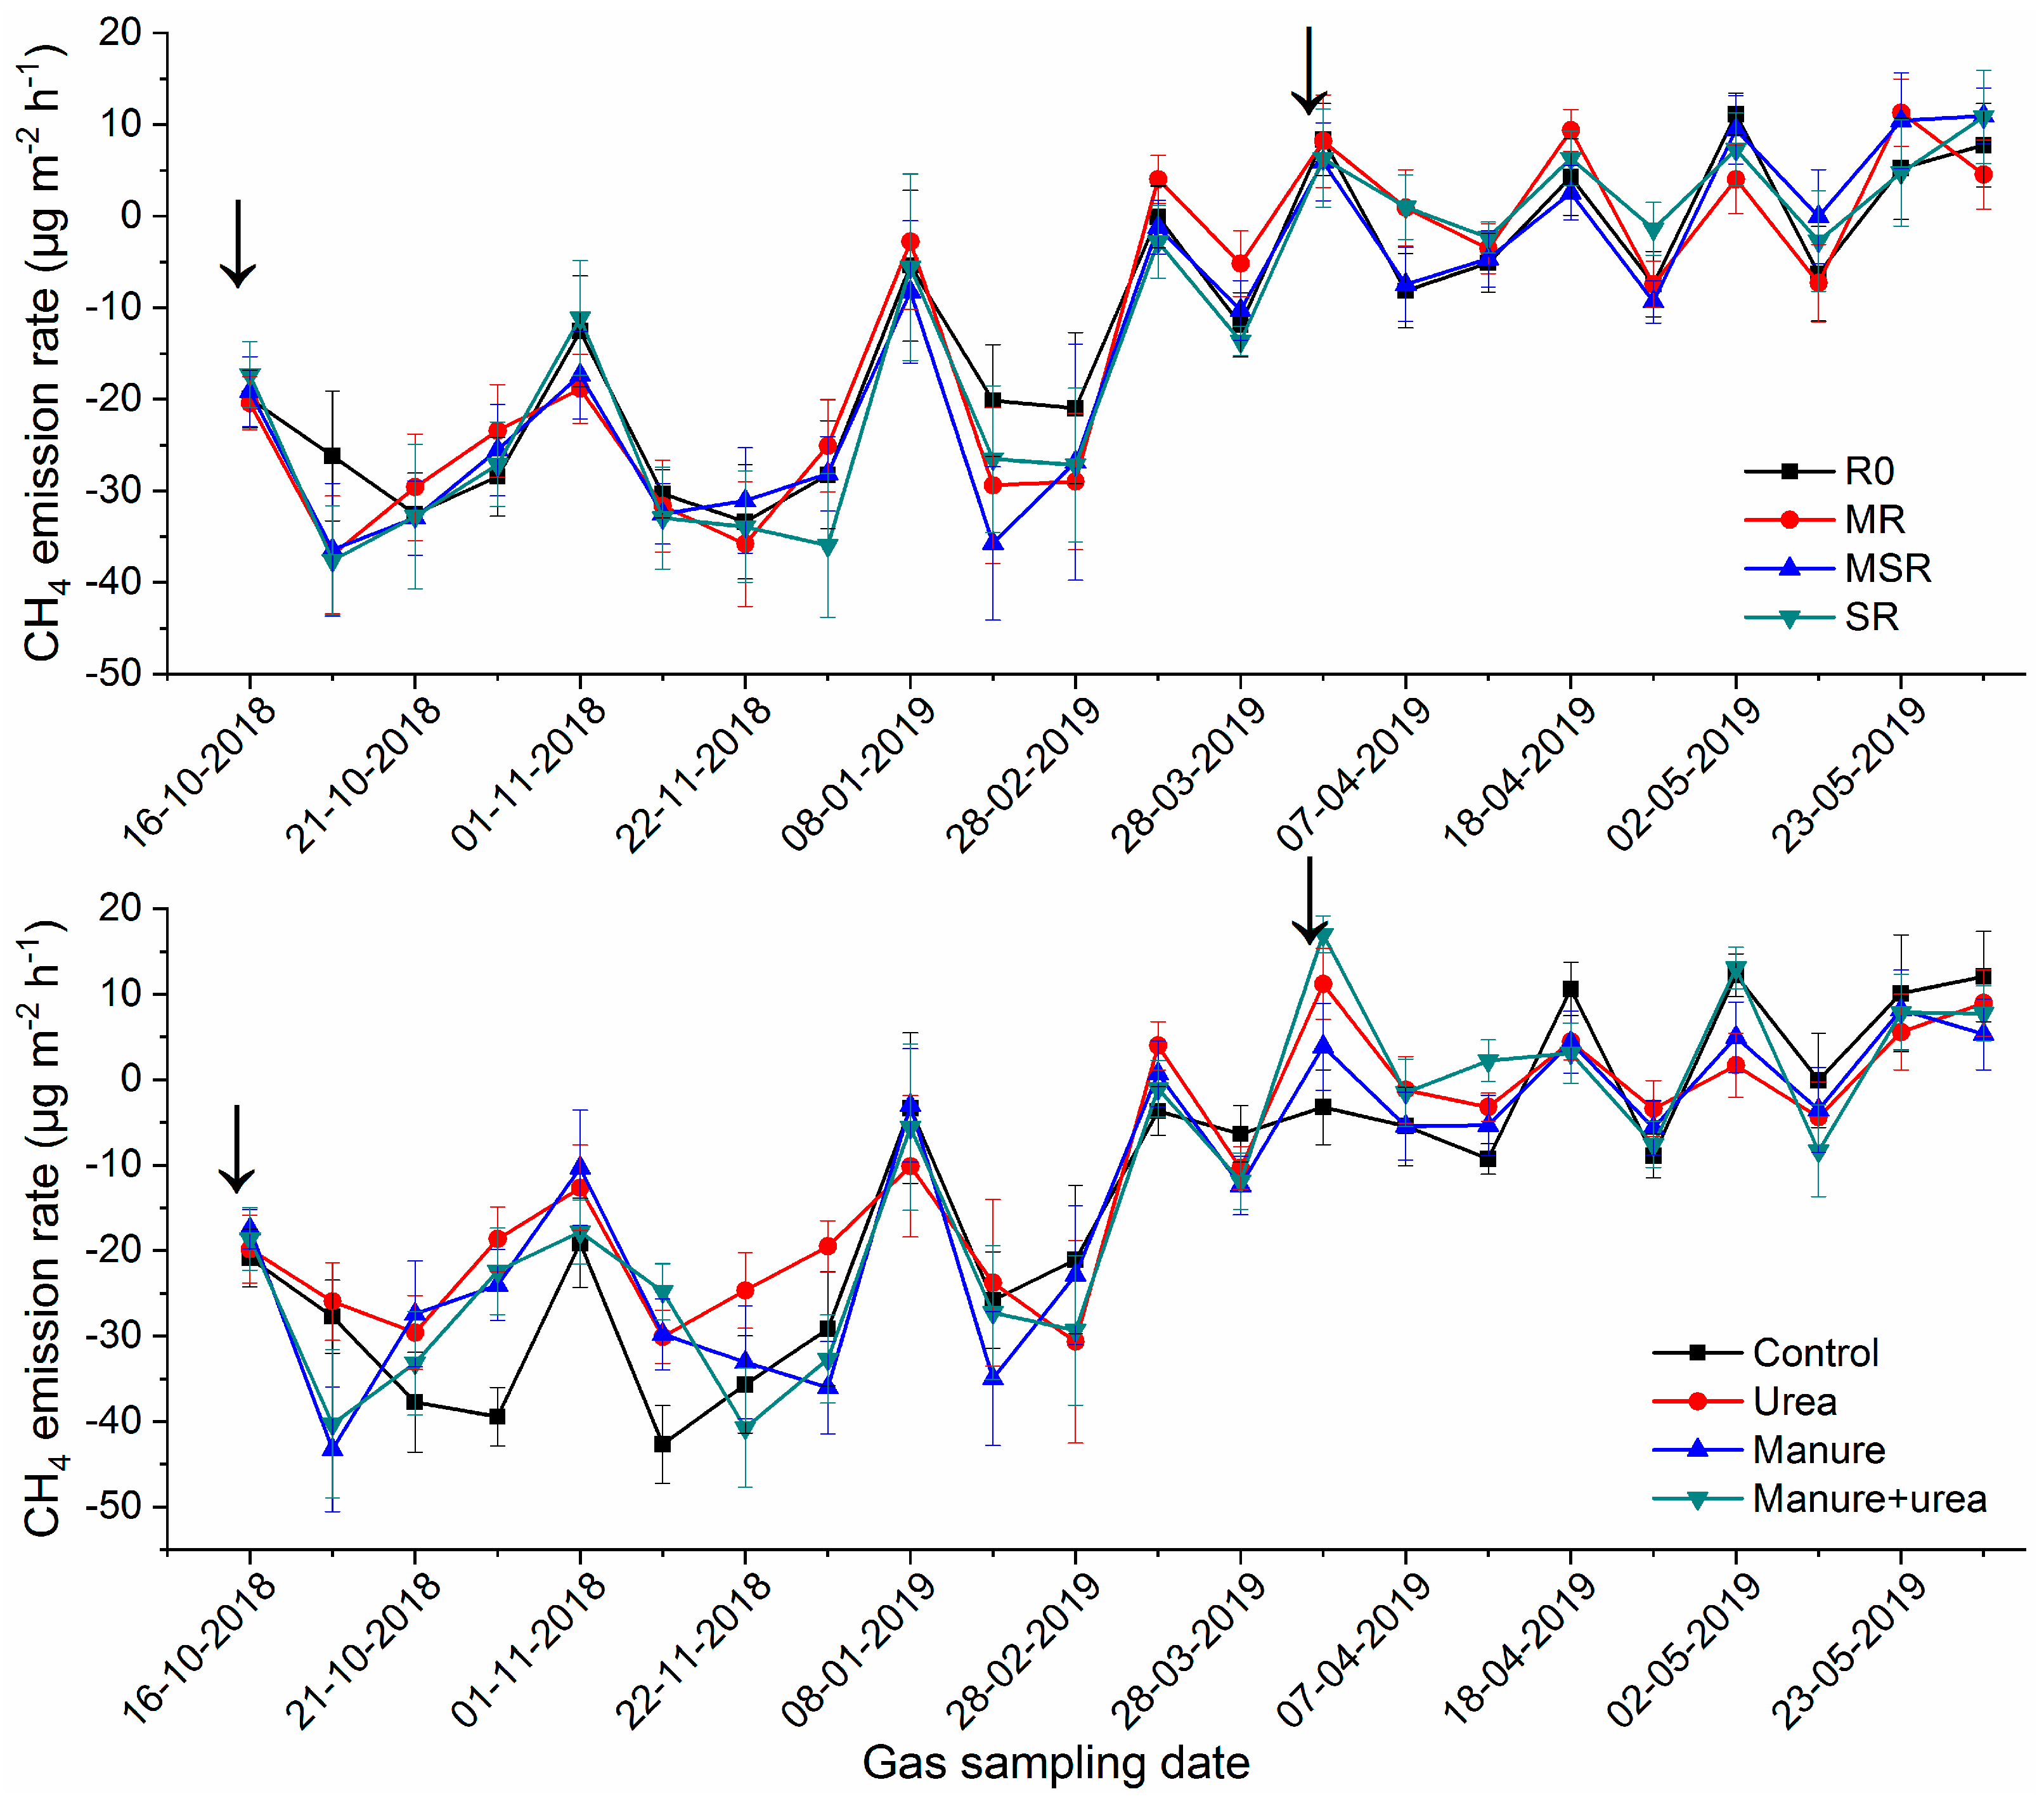
3.6. Soil CH4 Emissions

In our study, soils from all treatments acted as a net sink of CH4 fluxes (Figure 5). However, both positive and negative CH4 fluxes were recorded in daily measurements. CH4 fluxes in crop residue amendments ranged from −37.6 to 11.3 µg m−2 h−1, while in N treatments, they ranged from −43.3 to 17 µg m−2 h−1 throughout the growing season (Figure 8). However, crop residues, N treatments, and their interactions had no significant effect on cumulative CH4 uptake (Table 1). Nevertheless, among the N treatments, higher CH4 uptake was observed in manure amended soils (Table 2). Manure and manure + urea amended soils’ uptake 22% and 21% more CH4, respectively, compared to urea treatment. Among the residue amendments, soils treated with maize-soybean mixed residue showed the highest CH4 uptake, which was 10% and 16% higher than maize and no-residue treatment, respectively.
In our study, during the winter when the soil temperature was very low, CH4 fluxes were negative, indicating soil uptake of CH4 from the atmosphere. However, after winter, CH4 uptake by the soil gradually decreased with the increasing temperature, and occasionally, fluxes became positive until harvesting (Figure 8). Consequently, a significant positive correlation was found between CH4 fluxes and soil temperature during the study period (r = 0.50; p < 0.01) (Figure 6). CH4 fluxes also had a strong positive correlation with soil moisture content (r = 0.37; p < 0.01), soil pH (r = 0.38; p < 0.01), soil NH4+ (r = 0.33; p < 0.01), and DOC concentrations (r = 0.25; p < 0.05) in the soil.

3.7. Global Warming Potential and Yield-Scaled GHG Emissions

In our results, crop residue incorporation into the soil significantly increased the global warming potential (GWP) (Table 2). Among the three crop residues, maize residue amendment showed the highest warming potential, being 25%, 9%, and 8% higher than no residue, mixed residue, and soybean residue, respectively. While all crop residue amendments led to significantly higher GWP, soybean residue and maize-soybean mixed residue exhibited significantly lower yield-scale emissions (GHGI) due to their higher grain yield. In contrast, maize residue incorporation significantly increased GHGI compared to other residue treatments, showing a 27%, 34%, and 35% higher value than no residue, mixed residue, and soybean residue, respectively.
Furthermore, in our study, there was no significant difference among the N treatments in terms of GWP. However, due to the higher grain yield, all fertilized treatments significantly reduced GHGI compared to the non-fertilized control. Among the fertilized treatments, both urea and manure + urea treatments showed similar GHGI values and were significantly lower than the sole manure treatment.

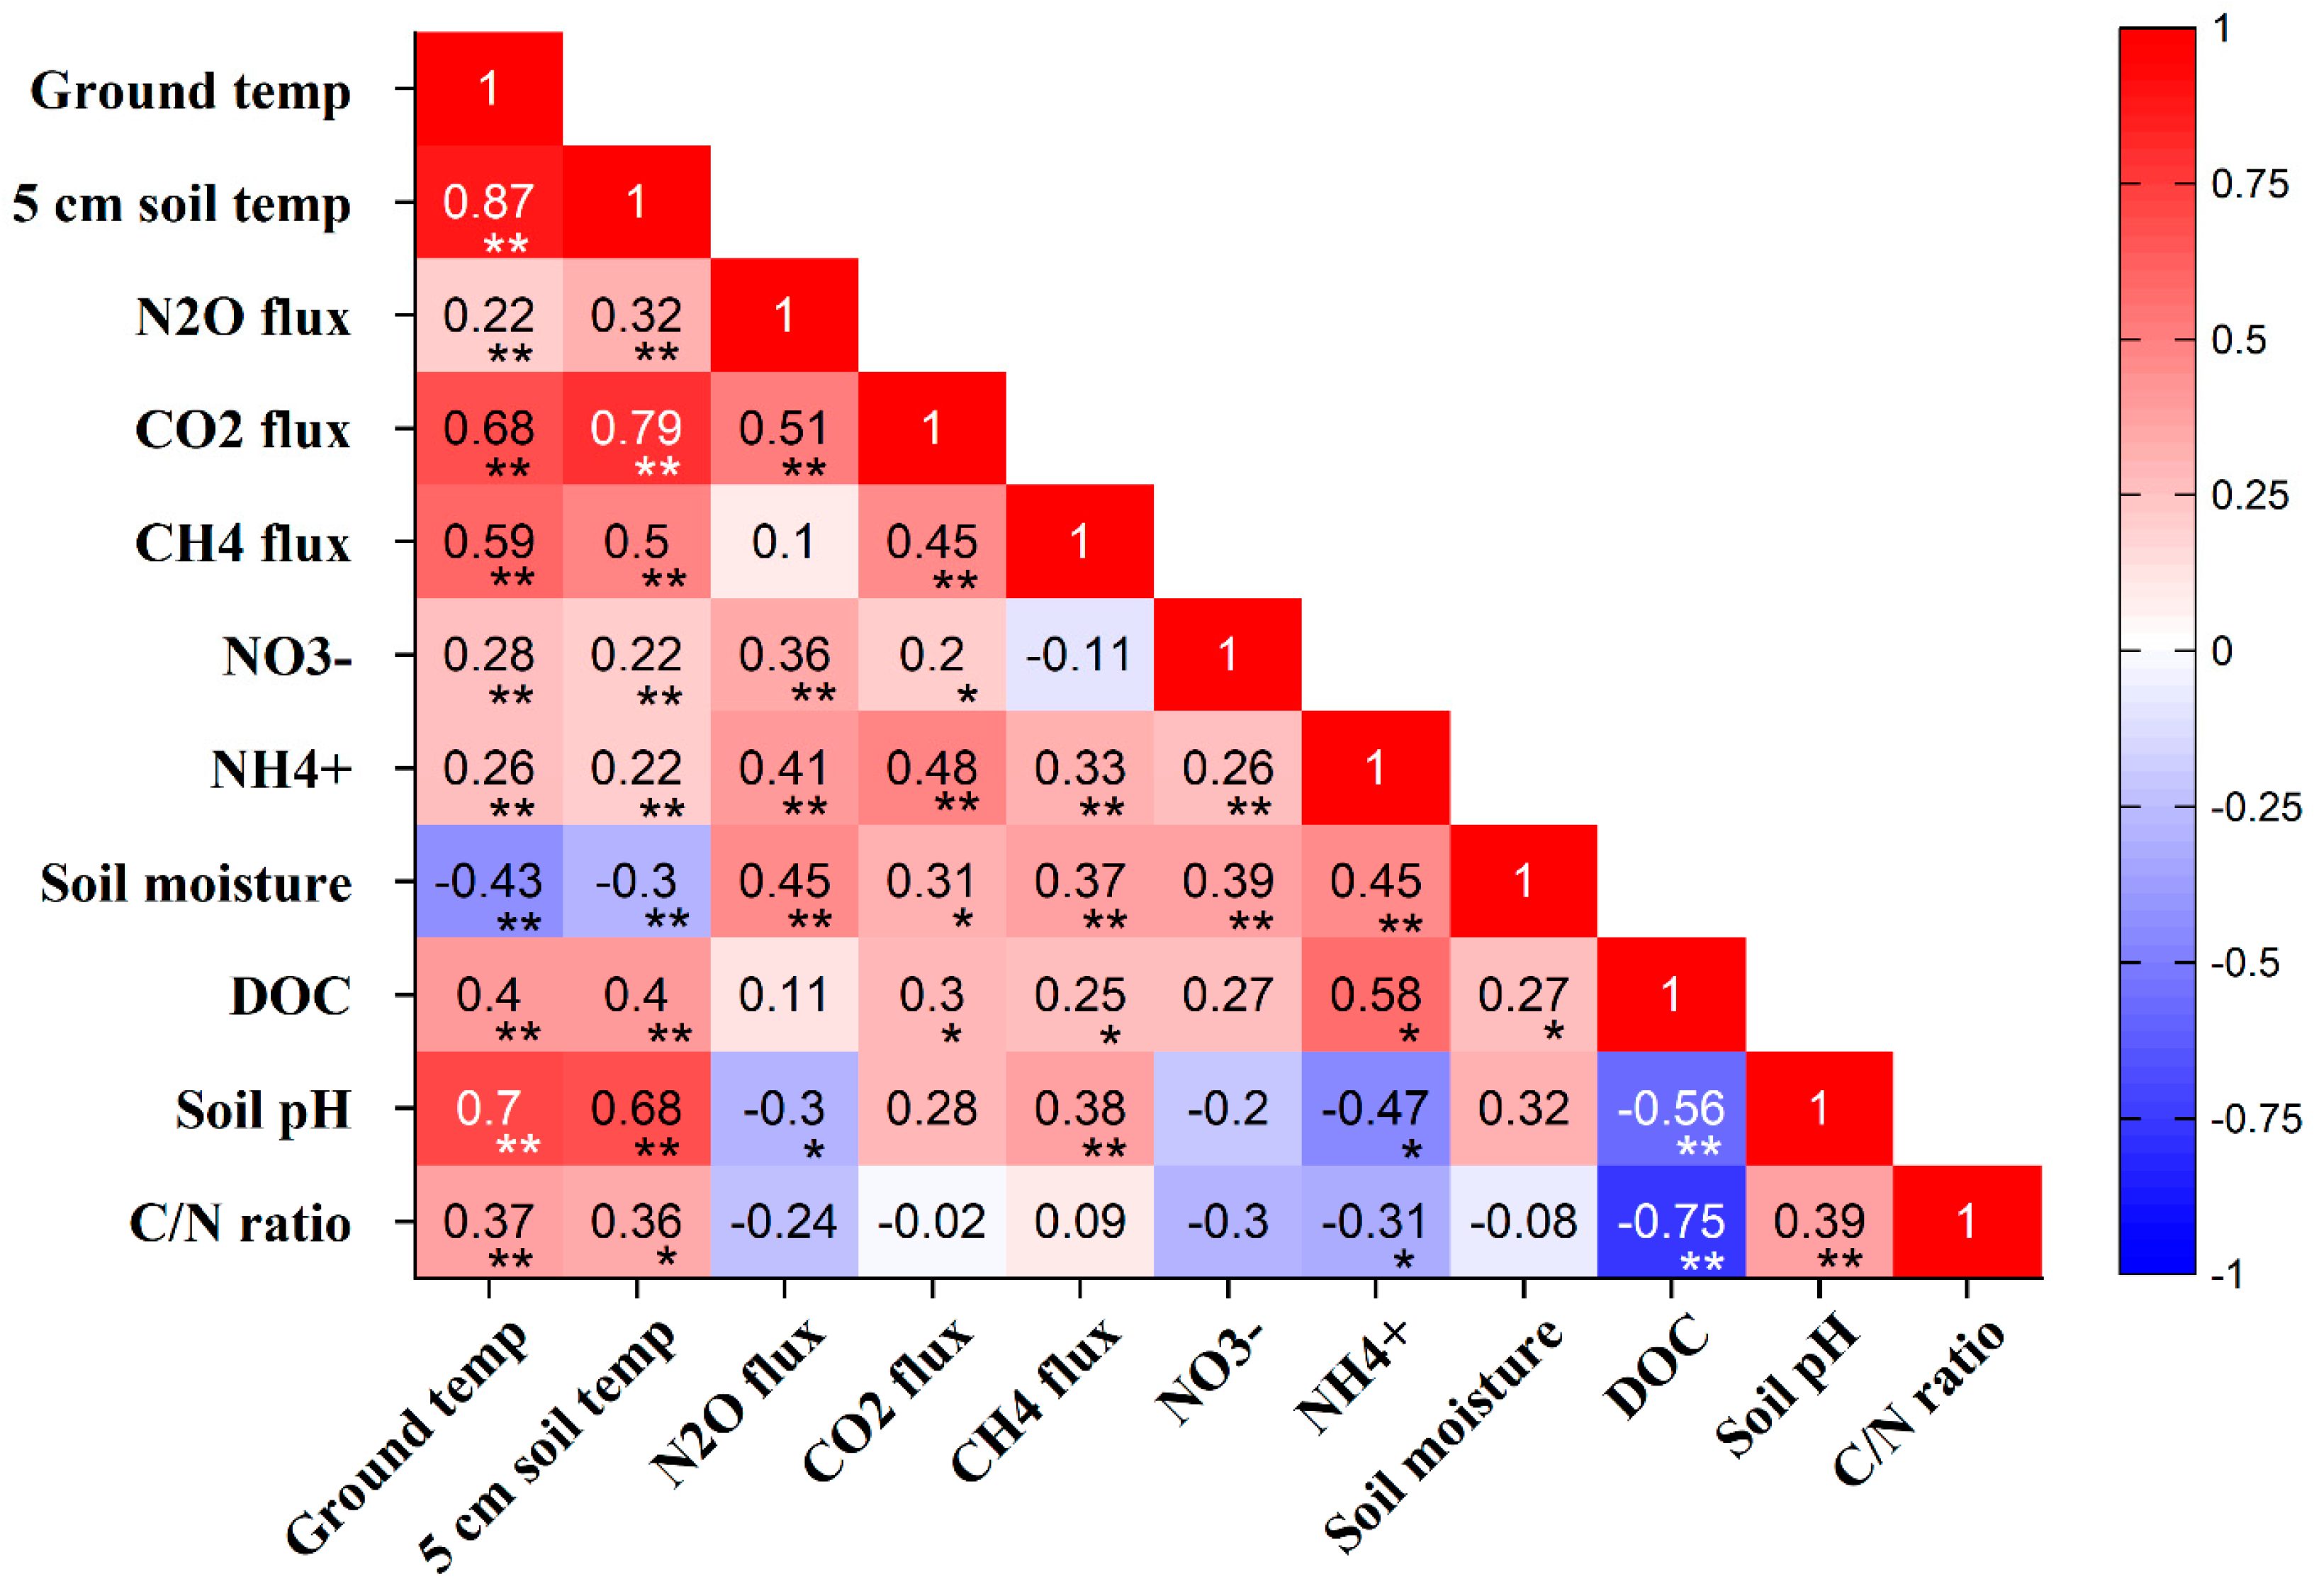
3.8. Crop Residue and N Fertilizer Effect on Soil Physicochemical Properties

In our study, crop residue addition to the soil significantly influenced soil parameters, which strongly regulated soil GHG emissions. Both NH4+ and NO3 concentrations were significantly higher (p < 0.05) in soil amended with soybean residue throughout the growing season (Figure 9a,b). On average, soybean residue amendment increased soil NH4+ concentration by 29%, 16%, and 13% compared to no-residue, maize residue, and mixed residue amendment, respectively. As expected, soils with maize and no-residue amendments showed significantly lower NH4+ content. The soil NH4+ content in the maize-soybean mixed residue treatment was intermediate and did not significantly differ from other residue amendments. Surprisingly, the average soil NO3 concentration in the mixed residue treatment (7.83 mg kg−1) was the lowest among all treatments, significantly lower than the soybean residue amendment (10.26 mg kg−1) (Figure 9b). Although the soil NO3 content in the soybean and maize residue amendments did not differ statistically, the average NO3 content was 27% higher in the soybean residue-amended soil compared to the maize residue amendment.
Moreover, in our study, the application of N fertilizers also increased soil NH4+ concentration, but the difference was not significant compared to the non-fertilized control (Figure 10a). However, all fertilized treatments significantly enhanced soil NO3 concentration (Figure 10b). Average NO3 concentration was highest in the urea fertilized soil, which was 38% and 48% higher than manure and manure + urea treated soil, respectively.
Soil DOC concentration was also influenced by both crop residue and N fertilizer treatments. Throughout the growing season, soil DOC concentration was significantly higher in maize residue-amended soil (Figure 9d). While all N fertilizers increased soil DOC concentration, the increment was notably higher in the manure-treated soil (Figure 10d). Soil temperature, moisture, C/N ratio, and pH content were not significantly changed by the crop residue incorporation. However, all N fertilizers significantly reduced soil pH content (Figure 10h), while the soil C/N ratio was significantly lower in the manure-treated soil throughout the study period (Figure 10c).

4. Discussions

4.1. Crop Residue and Fertilizer Effect on Soil N Dynamics and N2O Emissions

In our study, crop residue incorporation into the soil notably increased soil N2O emissions. However, the quality of the residue determined the magnitude of N2O emissions and soil N dynamics. Particularly, the incorporation of soybean residue significantly increased the soil mineral N concentration, with soil NH4+ and NO3 concentrations being 16% and 27% higher, respectively, compared to maize residue-amended soil (Figure 9a,b). Such an increment in NH4+ and NO3 concentrations in the soil could be attributed to the low C/N ratio and rapid mineralization of biologically fixed N in the soybean residue and root nodules [39]. This observation of high mineral N in the soybean residue-amended soil is consistent with previous findings indicating that incorporating easily degradable residues with a low C/N ratio increases soil mineral N content more than applying residues with a high C/N ratio [11,40,41]. Consequently, the availability of NH4+ and NO3 concentrations enhanced nitrification and denitrification in the soil, leading to higher N2O emissions from soybean residue-amended soil.
Conversely, the incorporation of maize residue and maize-soybean mixed residue reduced both NH4+ and NO3 concentrations in the soil. This reduction could be attributed to the slower decomposition and slower N mineralization processes in the soil due to the high C/N ratio and high lignin content of the maize residue [42]. Another possible reason is that, due to its low N content, maize residue cannot meet the N requirement of microbial growth. As a result, heterotrophic microorganisms assimilate indigenous soil N to decompose organic C in maize residue, causing net N immobilization [4,41,43,44]. Consequently, both maize residue and maize-soybean mixed residue-amended soil showed lower NH4+ and NO3 concentrations (Figure 9a,b) and subsequently lower soil N2O emissions. Previous studies have also reported a significant negative correlation between crop residue C/N ratio and soil N2O emissions [14,45,46]. A meta-analysis by Chen et al. [4] indicated that incorporating crop residue with a C/N ratio < 45 significantly increases soil N2O emissions. When crop residue has a lower C/N ratio, it decomposes faster after incorporation into the soil, providing sufficient N to support the growth and proliferation of the soil microbial community, leading to higher N availability for nitrification and denitrification [46,47]. Therefore, soil amended with soybean residue had 27% higher N2O emissions than soil amended with maize residue. However, in our study, despite the presence of soybean residue, N2O emissions were lower in the mixed residue-amended soil. This could be because large volume of maize residue in the mixture resulted in an overall high C/N ratio.
In our experiment, seasonal temperature variation also notably affected soil N dynamics. A few weeks after the residue incorporation, soil NH4+ decreased but NO3 content increased (Figure 3). This change may have occurred due to the nitrification of NH4+ and reduced decomposition rate, as well as the slower mineralization of organic N during winter [48]. However, during spring, with the increasing soil temperature, soil NH4+ concentration sharply increased until the maturity stage, indicating the temperature effect on residue decomposition and organic N mineralization. In our experiment, both soil NH4+ and NO3 concentrations were significantly and positively correlated with soil temperature (r = 0.22; p < 0.01). Many incubation studies have shown that soil N mineralization exponentially increases with the increasing soil temperature [48,49,50]. This increase in N mineralization can be explained by the rapid consumption of readily mineralizable organic matter [51] or as a result of greater depolymerization of organic matter due to the more intense activity of exocellular enzymes at elevated temperatures [52]. During the maturity stage of winter wheat, soil NH4+ concentration decreased again with an increase in NO3 content, possibly due to the low N requirement of the plants during maturity stage but the continuous nitrification as well as recycling of N with microbial death [53], leading to an increase in soil NO3 content at the maturity stage.
Elevated temperatures also enhance soil nitrification and denitrification rates, subsequently increasing soil N2O emissions [54,55]. In our study, N2O emissions also demonstrated a significant positive correlation with soil temperature (r = 0.32; p < 0.01) (Figure 6). Under elevated temperature, soil nitrification rates increase due to an increase in the abundance of ammonia-oxidizing archaea (AOA) or ammonia-oxidizing bacteria (AOB) amoA genes [56]. Furthermore, elevated soil temperature increases the abundance of the denitrifying gene nirK, thereby influencing soil denitrification [55,56]. In addition, an increase in soil temperature increases soil microbial respiration, leading to a depletion of oxygen concentrations in the soil and creating anaerobic microsites, which favor denitrification and N2O emissions [12,57] Therefore, a significant positive correlation (r = 0.51; p < 0.01) was observed between soil CO2 and N2O emissions in this study. Similar correlations have also been recorded in some previous studies when plant materials were incorporated into the soil [11,55,58]. This is because, in addition to N, crop residue incorporation increases available organic C, which stimulates soil heterotrophic respiration and the oxidation of labile organic C fractions to CO2, lowering oxygen pressures in soils and creating anaerobic conditions favorable for denitrifiers [59,60].
Although N fertilizer application in agricultural soils boosts grain yield, it is also known to cause a notable rise in soil N2O emissions [61]. In our study, all N fertilizers significantly increased soil N2O emissions, with the highest N2O emissions observed in urea-fertilized soil (Table 2). In a field experiment, Mairura et al. [28] showed that substituting urea with manure could reduce soil N2O emissions. Similarly, in our study, the manure + urea treatment had lower N2O emissions than the sole urea amendment. However, both the urea and manure + urea treatments had significantly higher N2O emissions than the sole manure treatment. This is because, compared to manure, urea has a high denitrification potential [27]. Moreover, urea application improves N availability to the microbial community, speeds up the decomposition of plant materials, enhances the NH4+ and NO3 concentrations in the soil, and subsequently increases N2O emissions [62]. Reduced N2O emissions from manure-treated soil are attributed to the gradual release of plant-accessible N throughout the growing season from the manure [63]. Consequently, once the plants’ N needs are met, there remains a lesser amount of mineral N accessible in the soil. Therefore, throughout the growing season, both manure and manure + urea amended soil had significantly lower NO3 content than urea amended soil (Figure 10b), resulting in lower N2O emissions in both manure-treated soils.

4.2. Crop Residue and N Fertilizer Effect on Soil CO2 Emissions

Our results showed that crop residue incorporation significantly increased soil CO2 emissions compared to no residue amendment. Similar results were also observed in previous studies on CO2 emissions from residue-amended soils [11,13,53]. This is because crop residue serves as a significant source of external carbon (C) input, which alters soil microbial activity and subsequently affects native SOC mineralization (priming effect) [64,65]. Crop residue often enhances the positive priming effect through processes like the “co-metabolism” or “microbial nutrient mining” of native soil organic matter, consequently increasing soil CO2 emissions [66]. Additionally, the incorporation of crop residue triggers microbial activity in the soil, accelerating internal microbial metabolism and increasing respiratory activity immediately upon residue incorporation [58].
However, the magnitude of soil CO2 emissions from maize residue-amended soil varied under different N treatments. Specifically, soil CO2 emissions were relatively low when maize residue was incorporated into non-fertilized soil but increased dramatically compared to other residues when incorporated into N-fertilized soils (Figure 5). This suggests that lower microbial activity occurs in maize residue-amended soil compared to soybean and maize-soybean mixed residue when there is a shortage of inorganic N in the soil, indicating that soil available N is a limiting factor for microbial biomass, activity, and residue decomposition [43,67,68]. It has been reported that a shortage of N, rather than a shortage of C, in residue-amended soils would limit microbial activity during the decomposition process [69,70]. Moreover, when plenty of fresh organic materials with a high C/N ratio are incorporated into N-limited soil, microbial N demand cannot be met from either source, resulting in lower microbial activity and CO2 emissions [71]. Therefore, during the basal fertilization period when N uptake by plants is negligible, the applied N fertilizer provides adequate nutrients to microorganisms for residue decomposition, resulting in high CO2 fluxes in residue-amended soils and N-fertilized treatments during the first two weeks (Figure 7). Similar results were also observed during the top-dressing period.
Overall, the C priming effect is generally higher in low C/N residue-amended soil than in residue with a high C/N ratio in the early stage of incorporation [72]. However, Brenzinger et al. [73] noted that the magnitude of soil CO2 emissions mostly depends on the amount of organic residue added. Chen et al. [13] found that soil CO2 emissions were significantly and positively correlated with the amount of residue added to the soil. Similarly, Liang et al. [74] reported that the soil priming effect positively correlated with the amount of residue incorporation. In our field study, the quantity of crop residue played a crucial role in terms of soil CO2 emissions. Specifically, the amounts of incorporated maize residue (9.1 t ha−1) and maize-soybean mixed residue (7.1 t ha−1) were much higher than that of soybean residue (3.04 t ha−1). With the increase in crop residue, enzyme activity and labile organic carbon fraction (e.g., DOC) content increased in the soil [13]. In our study, the DOC content in maize residue-amended soil was significantly higher than in other residue amendments (Figure 9d) and had a strong positive correlation (r = 0.30; p < 0.05) with soil CO2 emissions (Figure 6), resulting in 11% more soil CO2 emissions from maize residue than from soybean residue. Similarly, significantly higher DOC content was found in manure-amended soils in our study, leading to high CO2 emissions in this treatment. Manure application likely provides potentially more soluble carbon for microbial activity than urea fertilizer, thus leading to greater soil CO2 emissions [75].
Temperature variation exerted a significant effect on soil CO2 emissions in our field study. During autumn, as temperature decreased, CO2 emissions gradually decreased, remained low during winter, and increased again during spring with rising soil temperature, resulting in a significant positive correlation (r = 0.79; p < 0.01) between soil temperature and soil CO2 emissions. This temperature effect on soil CO2 emissions aligns with findings from previous studies [54,65,76]. Generally, soil temperature strongly regulates microbial functioning in the soil. Elevated soil temperatures accelerate soil microbial respiration and DOC concentration but lower microbial biomass C [55]. The positive correlation between soil temperature and DOC concentration (r = 0.40; p < 0.01) (Figure 6) in our study may partly explain the temperature effect on higher soil CO2 emissions. It has been reported that at a temperature of 25 °C, soil microbial activity is high, with a greater amount of mineralizable (labile) C in the soil [76,77]. Irina et al. [78] also reported that microbial decomposition of residue and soil CO2 emissions significantly increased with increasing temperature up to 25 °C, supporting our results of increased CO2 emissions during spring.
Throughout our study period, soil CO2 fluxes were high after irrigation or sudden rainfall events. Thus, soil CO2 fluxes showed a strong positive correlation with soil moisture content (r = 0.31; p < 0.05). Soil moisture content also had a positive association with soil DOC content (r = 0.27; p < 0.05). There is a trend of increasing DOC content following re-wetting after dry spells [79]. In upland agriculture, soils often experience periodic dry periods and accumulate microbial products due to reduced decomposition rates. When irrigation is applied or rainfall occurs, soil DOC concentration rises, subsequently consumed by soil microbes as substrates, leading to increased soil CO2 emissions [80,81]. Moreover, when soil moisture is limited, microbial activity is very low, or microorganisms die due to water scarcity [82]. Conversely, when soils have sufficient moisture, residue decomposition and SOC mineralization rates increase with increased microbial activity, resulting in high CO2 emissions.

4.3. Crop Residue and N Fertilizer Effect on CH4 Emissions

In our study, soils across all treatments acted as a net CH4 sink. Perhaps this was because our experiment was conducted in an upland field that was mostly aerobic, and the crop residue incorporation further increased soil aeration [83,84]. Despite this, neither crop residue amendments nor N fertilizers significantly impacted the cumulative soil CH4 uptake. However, CH4 fluxes varied among sampling events throughout the growing seasons, largely influenced by environmental factors. Factors such as soil temperature, moisture content, NH4+, and DOC concentrations likely contributed to the observed variation in net CH4 fluxes (Figure 6).
Compared to the basal fertilizer application period, the highest CH4 emissions occurred during the top dressing of fertilizer, coinciding with the irrigation events. Positive CH4 fluxes or lower CH4 uptake were also observed during other irrigation or rainfall events or periods of high soil moisture content, indicating that soil moisture was the instrumental factor for CH4 fluxes. Additionally, during spring, two irrigation events of 65 mm and 70 mm were applied, with comparatively more rainfall occurring during this period. This likely contributed to lower CH4 consumption or even CH4 emissions during the second half of the growing season compared to the first half. Our correlation analysis also revealed a significant positive correlation between CH4 emissions and soil moisture content (r = 0.37; p < 0.01). Elevated soil moisture content during irrigation and rainfall restricts oxygen diffusion into the soil, creating an anaerobic environment that inhibits methanotrophic activities (the oxidation of CH4) while promoting methanogenic activities responsible for CH4 production [85].
In our study, manure application enhanced CH4 uptake compared to urea fertilizer. A similar trend was also observed in previous studies, where manure amendment significantly increased CH4 uptake in upland soils [86,87]. Manure application generally increases soil dissolved carbon, which could facilitate the activity of methane-oxidizing bacteria and thus CH4 oxidation [88,89].
Furthermore, soil temperature exerted a significant negative effect (p < 0.01) on soil CH4 consumption in our study. With the increasing temperature during spring, soil CH4 consumption dramatically decreased, and even occasionally, CH4 emissions were positive when coinciding with elevated soil moisture. The optimum temperature for methanogenesis is typically between 30 and 40 °C, while methanotrophy is less sensitive to temperature than methanogenesis [90]. Low soil temperatures reduce CH4 production by decreasing soil methanogenic bacterial activities, whereas methanogenic activities increase several fold with increasing temperatures from 5 to 35 °C [91,92]. A recent study by Fan et al. [93] also showed that the rates of CH4 oxidation and methanogenesis increased exponentially with temperature, but the CH4 oxidation rate was significantly lower than methanogenesis when temperature reached 35 °C, resulting in more CH4 production compared to CH4 oxidation.

4.4. Yield-Scaled Emissions and Potentials of Maize-Soybean Mixed Residue

In our study, we observed that soybean residue amendment significantly increased soil N2O emissions, while maize residue had the highest soil CO2 emissions. However, the higher N2O emissions from soybean residue and the higher CO2 emissions from maize residue could be mitigated using maize-soybean mixed residue. Our results indicated that maize-soybean mixed residue could reduce soil N2O emissions by 23% compared to soybean residue and soil CO2 emissions by 10% compared to maize residue. Additionally, mixed residue amendment also contributed to a significantly higher grain yield compared to no residue addition.
Previous studies have reported numerous advantages of cereal-legume intercropping systems, mainly higher grain yield [94,95,96] and lower GHG emissions due to the low N requirement in the system [97,98,99], suggesting intercropping as a promising cropping system for sustainable agroecosystems. However, concerns have been raised regarding higher GHG emissions, particularly N2O emissions, after residue incorporation into the soil due to the presence of legume residue in the mixture, as legume residue significantly increases soil N2O emissions [100,101]. In our study, however, maize-soybean mixed residue produced significantly lower N2O emissions compared to soybean residue and exhibited the lowest GWP among all the residues. Most importantly, with the increasing yield, mixed residue significantly reduced yield-scaled emissions in the winter wheat (Table 2). While previous studies have primarily focused on area-scaled GHG emissions, considering the GHG efficiency of crop production suggests that yield-scaled GHG emissions from agro-ecosystems are likely to provide a more accurate measurement of GHG emissions [25]. In our study, maize-soybean mixed residue significantly reduced yield-scaled emissions by 25% compared to maize residue amendment. This reduction of GHGI from cereal-legume mixed residue could encourage policymakers to promote diversified cropping systems like intercropping over current high-fertilized monocropping systems.

5. Conclusions

Results from our study showed that crop residue addition significantly influenced soil GHG emissions, particularly soil N2O and CO2 emissions, depending on the type and quantity of residue biomass added to the soil. Comparing three different crop residues with varying C/N ratios, we found that as soil inorganic N (NH4+ and NO3) content increased, soybean residue led to significantly higher N2O emissions, while maize residue was responsible for the highest CO2 emissions. In contrast, maize-soybean mixed residue, derived from an intercropping system, exhibited the lowest N2O emissions among the three residues and notably lower CO2 emissions compared to maize residue, resulting in the lowest GWP. Additionally, mixed residue amendment contributed to higher grain yield and significantly reduced GHGI by 25% compared to maize residue amendment. Overall, our findings contribute to a comprehensive understanding of how different residue additions, from monocrops and cereal-legume intercrops, influence soil N dynamics and GHG emissions, providing valuable insights into effective agroecosystem management for long-term food security and soil sustainability while mitigating GHG emissions. Moreover, using manure instead of synthetic N fertilizer also reduced soil N2O emissions. However, the strategic application of N fertilizer, particularly urea as a top dressing during the tillering stage, remains crucial for achieving higher wheat grain yields. In our study, the manure + urea treatment exhibited a lower GWP but produced the highest grain yield and subsequently the lowest GHGI among the treatments. Therefore, partially substituting urea with manure as a basal application could effectively reduce soil GHG emissions while maintaining productivity.

Supplementary Materials

The following supporting information can be downloaded at: https://www.mdpi.com/article/10.3390/agronomy14061167/s1, Table S1: N, P, K management in different N treatments during the study period; Table S2: Date of different management activities during the study period at the Luancheng Agro-Ecosystem Experimental Station.

Author Contributions

Conceptualization, M.R. and C.H.; methodology, M.R.; software, M.R.; Validation, C.H.; formal analysis, M.R., A.T. and G.G.; investigation, M.R.; resources, X.L.; writing—original draft preparation, M.R.; writing—review and editing, M.R., G.G., M.R.A., A.T., F.B., S.O.A., X.L., Y.Z. and C.H.; visualization, M.R. and M.R.A.; supervision, C.H.; project administration, C.H.; funding acquisition, C.H. All authors have read and agreed to the published version of the manuscript.

Funding

This study was funded by National Key Research and Development Program of China (2023YFC3707401, 2022YFD1900300, 2023YFD1900103), Strategic Priority Research Program of the Chinese Academy of Sciences (XDA0440000), the Natural Science Foundation of Hebei Province (C2022503009), the Key Research and Development Program of Hebei Province (No. 21323601D), and National Key Research and Development Program of China (2021YFD1901002-2). The first author was financially supported by Chinese Academy of Sciences-The World Academy of Sciences (CAS-TWAS) fellowship.

Data Availability Statement

The data presented in this study are available on request.

Conflicts of Interest

The authors declare no conflicts of interest.

References

  1. Tao, Z.; Li, C.; Li, J.; Ding, Z.; Xu, J.; Sun, X.; Zhou, P.; Zhao, M. Tillage and straw mulching impacts on grain yield and water use efficiency of spring maize in Northern Huang–Huai–Hai Valley. Crop J. 2015, 3, 445–450. [Google Scholar] [CrossRef]
  2. Lugato, E.; Bampa, F.; Panagos, P.; Montanarella, L.; Jones, A. Potential carbon sequestration of European arable soils estimated by modelling a comprehensive set of management practices. Glob. Chang. Biol. 2014, 20, 3557–3567. [Google Scholar] [CrossRef] [PubMed]
  3. Rakesh, S.; Sarkar, D.; Sinha, A.K.; Shikha; Mukhopadhyay, P.; Danish, S.; Fahad, S.; Datta, R. Carbon mineralization rates and kinetics of surface-applied and incorporated rice and maize residues in Entisol and Inceptisol soil types. Sustainability 2021, 13, 7212. [Google Scholar] [CrossRef]
  4. Chen, H.; Li, X.; Hu, F.; Shi, W. Soil nitrous oxide emissions following crop residue addition: A meta-analysis. Glob. Chang. Biol. 2013, 19, 2956–2964. [Google Scholar] [CrossRef] [PubMed]
  5. Zhao, X.; Li, R.; Liu, W.; Liu, W.; Xue, Y.; Sun, R.; Wei, Y.; Chen, Z.; Lal, R.; Dang, Y.P.; et al. Estimation of crop residue production and its contribution to carbon neutrality in China. Resour. Conserv. Recycl. 2024, 203, 107450. [Google Scholar] [CrossRef]
  6. Chen, J.; Gong, Y.; Wang, S.; Guan, B.; Balkovic, J.; Kraxner, F. To burn or retain crop residues on croplands? An integrated analysis of crop residue management in China. Sci. Total Environ. 2019, 662, 141–150. [Google Scholar] [CrossRef] [PubMed]
  7. Yu, Y.; Huang, Y.; Zhang, W. Projected changes in soil organic carbon stocks of China’s croplands under different agricultural managements, 2011–2050. Agric. Ecosyst. Environ. 2013, 178, 109–120. [Google Scholar] [CrossRef]
  8. Sun, H.; Wang, E.; Li, X.; Cui, X.; Guo, J.; Dong, R. Potential biomethane production from crop residues in China: Contributions to carbon neutrality. Renew. Sustain. Energy Rev. 2021, 148, 111360. [Google Scholar] [CrossRef]
  9. Shu, X.; Zou, Y.; Shaw, L.J.; Todman, L.; Tibbett, M.; Sizmur, T. Applying cover crop residues as diverse mixtures increases initial microbial assimilation of crop residue-derived carbon. Eur. J. Soil Sci. 2022, 73, e13232. [Google Scholar] [CrossRef]
  10. Surey, R.; Schimpf, C.M.; Sauheitl, L.; Mueller, C.W.; Rummel, P.S.; Dittert, K.; Kaiser, K.; Böttcher, J.; Mikutta, R. Potential denitrification stimulated by water-soluble organic carbon from plant residues during initial decomposition. Soil Biol. Biochem. 2020, 147, 107841. [Google Scholar] [CrossRef]
  11. Basalirwa, D.; Sudo, S.; Wacal, C.; Akae, F.; Oo, A.Z.; Koyama, S.; Sasagawa, D.; Yamamoto, S.; Masunaga, T.; Nishihara, E. Assessment of crop residue and palm shell biochar incorporation on greenhouse gas emissions during the fallow and crop growing seasons of broccoli (Brassica oleracea var. Italics). Soil Tillage Res. 2020, 196, 104435. [Google Scholar] [CrossRef]
  12. Li, J.; Yang, H.; Zhou, F.; Zhang, X.; Luo, J.; Li, Y.; Lindsey, S.; Shi, Y.; He, H.; Zhang, X. Effects of maize residue return rate on nitrogen transformations and gaseous losses in an arable soil. Agric. Water Manag. 2019, 211, 132–141. [Google Scholar] [CrossRef]
  13. Chen, S.; Wang, Y.; Hu, Z.; Gao, H. CO2 emissions from a forest soil as influenced by amendments of different crop straws: Implications for priming effects. Catena 2015, 131, 56–63. [Google Scholar] [CrossRef]
  14. Hu, N.; Chen, Q.; Zhu, L. The Responses of Soil N2O Emissions to Residue Returning Systems: A Meta-Analysis. Sustainability 2019, 11, 748. [Google Scholar] [CrossRef]
  15. Akiyama, H.; Yamamoto, A.; Uchida, Y.; Hoshino, Y.T.; Tago, K.; Wang, Y.; Hayatsu, M. Effect of low C/N crop residue input on N2O, NO, and CH4 fluxes from Andosol and Fluvisol fields. Sci. Total Environ. 2020, 713, 136677. [Google Scholar] [CrossRef]
  16. Li, F.; Sørensen, P.; Li, X.; Olesen, J.E. Carbon and nitrogen mineralization differ between incorporated shoots and roots of legume versus non-legume based cover crops. Plant Soil 2020, 446, 243–257. [Google Scholar] [CrossRef]
  17. Raiesi, F. Carbon and N mineralization as affected by soil cultivation and crop residue in a calcareous wetland ecosystem in Central Iran. Agric. Ecosyst. Environ. 2006, 112, 13–20. [Google Scholar] [CrossRef]
  18. Köbke, S.; Senbayram, M.; Pfeiffer, B.; Nacke, H.; Dittert, K. Post-harvest N2O and CO2 emissions related to plant residue incorporation of oilseed rape and barley straw depend on soil NO3 content. Soil Tillage Res. 2018, 179, 105–113. [Google Scholar] [CrossRef]
  19. Wrage, N.; Velthof, G.; Van Beusichem, M.; Oenema, O. Role of nitrifier denitrification in the production of nitrous oxide. Soil Biol. Biochem. 2001, 33, 1723–1732. [Google Scholar] [CrossRef]
  20. García-Marco, S.; Ravella, S.R.; Chadwick, D.; Vallejo, A.; Gregory, A.S.; Cárdenas, L.M. Ranking factors affecting emissions of GHG from incubated agricultural soils. Eur. J. Soil Sci. 2014, 65, 573–583. [Google Scholar] [CrossRef]
  21. Dong, W.; Yang, Q.; George, T.S.; Yin, H.; Wang, S.; Bi, J.; Zhang, J.; Liu, X.; Song, A.; Fan, F. Investigating bacterial coupled assimilation of fertilizer-nitrogen and crop residue-carbon in upland soils by DNA-qSIP. Sci. Total Environ. 2022, 845, 157279. [Google Scholar] [CrossRef] [PubMed]
  22. Ning, D.; Zhang, Y.; Qin, A.; Gao, Y.; Duan, A.; Zhang, J.; Liu, Z.; Zhao, B.; Liu, Z. Interactive effects of irrigation system and level on grain yield, crop water use, and greenhouse gas emissions of summer maize in North China Plain. Sci. Total Environ. 2023, 864, 161165. [Google Scholar] [CrossRef] [PubMed]
  23. Frimpong, K.A.; Yawson, D.O.; Baggs, E.M.; Agyarko, K. Does incorporation of cowpea-maize residue mixes influence nitrous oxide emission and mineral nitrogen release in a tropical luvisol? Nutr. Cycl. Agroecosyst. 2011, 91, 281–292. [Google Scholar] [CrossRef]
  24. Uchida, Y.; Akiyama, H. Mitigation of postharvest nitrous oxide emissions from soybean ecosystems: A review. Soil Sci. Plant Nutr. 2013, 59, 477–487. [Google Scholar] [CrossRef]
  25. Wang, X.; He, C.; Cheng, H.; Liu, B.; Li, S.; Wang, Q.; Liu, Y.; Zhao, X.; Zhang, H. Responses of greenhouse gas emissions to residue returning in China’s croplands and influential factors: A meta-analysis. J. Environ. Manag. 2021, 289, 112486. [Google Scholar] [CrossRef] [PubMed]
  26. Charles, A.; Rochette, P.; Whalen, J.K.; Angers, D.A.; Chantigny, M.H.; Bertrand, N. Global nitrous oxide emission factors from agricultural soils after addition of organic amendments: A meta-analysis. Agric. Ecosyst. Environ. 2017, 236, 88–98. [Google Scholar] [CrossRef]
  27. Wu, H.; MacDonald, G.K.; Galloway, J.N.; Zhang, L.; Gao, L.; Yang, L.; Yang, J.; Li, X.; Li, H.; Yang, T. The influence of crop and chemical fertilizer combinations on greenhouse gas emissions: A partial life-cycle assessment of fertilizer production and use in China. Resour. Conserv. Recycl. 2021, 168, 105303. [Google Scholar] [CrossRef]
  28. Mairura, F.S.; Musafiri, C.M.; Macharia, J.M.; Kiboi, M.N.; Ng’etich, O.K.; Shisanya, C.A.; Okeyo, J.M.; Okwuosa, E.A.; Ngetich, F.K. Yield-scaled and area-scaled greenhouse gas emissions from common soil fertility management practices under smallholder maize fields in Kenya. Sustain. Prod. Consum. 2023, 36, 292–307. [Google Scholar] [CrossRef]
  29. Janz, B.; Havermann, F.; Lashermes, G.; Zuazo, P.; Engelsberger, F.; Torabi, S.M.; Butterbach-Bahl, K. Effects of crop residue incorporation and properties on combined soil gaseous N2O, NO, and NH3 emissions—A laboratory-based measurement approach. Sci. Total Environ. 2022, 807, 151051. [Google Scholar] [CrossRef]
  30. Bichel, A.; Oelbermann, M.; Echarte, L. Impact of residue addition on soil nitrogen dynamics in intercrop and sole crop agroecosystems. Geoderma 2017, 304, 12–18. [Google Scholar] [CrossRef]
  31. Qin, S.; Hu, C.; Clough, T.J.; Luo, J.; Oenema, O.; Zhou, S. Irrigation of DOC-rich liquid promotes potential denitrification rate and decreases N2O/(N2O + N2) product ratio in a 0–2 m soil profile. Soil Biol. Biochem. 2017, 106, 1–8. [Google Scholar] [CrossRef]
  32. Wang, S.; Zhen, L.; Hu, Y. Crop Production and Security in Ningjin County of the North China Plain. Foods 2023, 12, 2196. [Google Scholar] [CrossRef] [PubMed]
  33. Cosentino, N.; Rosa, V.; Fernandez, P.L.; Figueiro Aureggi, S.A.; Taboada, M.A. N2O emissions from a cultivated mollisol: Optimal time of day for sampling and the role of soil temperature. Rev. Bras. Ciênc. Solo 2012, 36, 1814–1819. [Google Scholar] [CrossRef]
  34. Zhai, L.M.; Liu, H.B.; Zhang, J.Z.; Huang, J.; Wang, B.R. Long-term application of organic manure and mineral fertilizer on N2O and CO2 emissions in a red soil from cultivated maize-wheat rotation in China. Agric. Sci. China 2011, 10, 1748–1757. [Google Scholar] [CrossRef]
  35. IPCC. Climate Change 2021: The Physical Science Basis. Contribution of Working Group I to the Sixth Assessment Report of the Intergovernmental Panel on Climate Change; Cambridge University Press: Cambridge, UK; New York, NY, USA, 2023. [Google Scholar] [CrossRef]
  36. Ghimire, R.; Norton, U.; Bista, P.; Obour, A.K.; Norton, J.B. Soil organic matter, greenhouse gases and net global warming potential of irrigated conventional, reduced-tillage and organic cropping systems. Nutr. Cycl. Agroecosyst. 2017, 107, 49–62. [Google Scholar] [CrossRef]
  37. Hurisso, T.T.; Norton, U.; Norton, J.B.; Odhiambo, J.; Del Grosso, S.J.; Hergert, G.W.; Lyon, D.J. Dryland Soil Greenhouse Gases and Yield-Scaled Emissions in No-Till and Organic Winter Wheat–Fallow Systems. Soil Sci. Soc. Am. J. 2016, 80, 178–192. [Google Scholar] [CrossRef]
  38. Liu, L.; Hu, C.; Yang, P.; Ju, Z.; Olesen, J.E.; Tang, J. Experimental warming-driven soil drying reduced N2O emissions from fertilized crop rotations of winter wheat–soybean/fallow, 2009–2014. Agric. Ecosyst. Environ. 2016, 219, 71–82. [Google Scholar] [CrossRef]
  39. Li, L.J.; Han, X.Z.; You, M.Y.; Yuan, Y.R.; Ding, X.L.; Qiao, Y.F. Carbon and nitrogen mineralization patterns of two contrasting crop residues in a Mollisol: Effects of residue type and placement in soils. Eur. J. Soil Biol. 2013, 54, 1–6. [Google Scholar] [CrossRef]
  40. Nguyen, T.T.; Marschner, P. Soil respiration, microbial biomass and nutrient availability in soil after repeated addition of low and high C/N plant residues. Biol. Fertil. Soils 2016, 52, 165–176. [Google Scholar] [CrossRef]
  41. Muhammad, W.; Vaughan, S.M.; Dalal, R.C.; Menzies, N.W. Crop residues and fertilizer nitrogen influence residue decomposition and nitrous oxide emission from a Vertisol. Biol. Fertil. Soils 2011, 47, 15–23. [Google Scholar] [CrossRef]
  42. Schmatz, R.; Recous, S.; Aita, C.; Tahir, M.M.; Schu, A.L.; Chaves, B.; Giacomini, S.J. Crop residue quality and soil type influence the priming effect but not the fate of crop residue C. Plant Soil 2017, 414, 229–245. [Google Scholar] [CrossRef]
  43. Xu, C.; Han, X.; Ru, S.; Cardenas, L.; Rees, R.M.; Wu, D.; Wu, W.; Meng, F. Crop straw incorporation interacts with N fertilizer on N2O emissions in an intensively cropped farmland. Geoderma 2019, 341, 129–137. [Google Scholar] [CrossRef]
  44. Badagliacca, G.; Ruisi, P.; Rees, R.M.; Saia, S. An assessment of factors controlling N2O and CO2 emissions from crop residues using different measurement approaches. Biol. Fertil. Soils 2017, 53, 547–561. [Google Scholar] [CrossRef] [PubMed]
  45. Abalos, D.; Rittl, T.F.; Recous, S.; Thiébeau, P.; Topp, C.F.; van Groenigen, K.J.; Butterbach-Bahl, K.; Thorman, R.E.; Smith, K.E.; Ahuja, I.; et al. Predicting field N2O emissions from crop residues based on their biochemical composition: A meta-analytical approach. Sci. Total Environ. 2022, 812, 152532. [Google Scholar] [CrossRef] [PubMed]
  46. Xia, L.; Lam, S.K.; Wolf, B.; Kiese, R.; Chen, D.; Butterbach-Bahl, K. Trade-offs between soil carbon sequestration and reactive nitrogen losses under straw return in global agroecosystems. Glob. Chang. Biol. 2018, 24, 5919–5932. [Google Scholar] [CrossRef] [PubMed]
  47. Frimpong, K.A.; Baggs, E.M. Do combined applications of crop residues and inorganic fertilizer lower emission of N2O from soil? Soil Use Manag. 2010, 26, 412–424. [Google Scholar] [CrossRef]
  48. Knoepp, J.D.; Swank, W.T. Using soil temperature and moisture to predict forest soil nitrogen mineralization. Biol. Fertil. Soils 2002, 36, 177–182. [Google Scholar] [CrossRef]
  49. Thapa, R.; Tully, K.L.; Cabrera, M.L.; Dann, C.; Schomberg, H.H.; Timlin, D.; Reberg-Horton, C.; Gaskin, J.; Davis, B.W.; Mirsky, S.B. Effects of moisture and temperature on C and N mineralization from surface-applied cover crop residues. Biol. Fertil. Soils 2021, 57, 485–498. [Google Scholar] [CrossRef]
  50. Miller, K.S.; Geisseler, D. Temperature sensitivity of nitrogen mineralization in agricultural soils. Biol. Fertil. Soils 2018, 54, 853–860. [Google Scholar] [CrossRef]
  51. Heumann, S.; Böttcher, J. Temperature functions of the rate coefficients of net N mineralization in sandy arable soils. Part I. Derivation from laboratory incubations. J. Plant Nutr. Soil Sci. 2004, 167, 381–389. [Google Scholar] [CrossRef]
  52. Schimel, J.P.; Bennett, J. Nitrogen mineralization: Challenges of a changing paradigm. Ecology 2004, 85, 591–602. [Google Scholar] [CrossRef]
  53. Lashermes, G.; Recous, S.; Alavoine, G.; Janz, B.; Butterbach-Bahl, K.; Ernfors, M.; Laville, P. N2O emissions from decomposing crop residues are strongly linked to their initial soluble fraction and early C mineralization. Sci. Total Environ. 2022, 806, 150883. [Google Scholar] [CrossRef]
  54. Song, Y.; Cheng, X.; Song, C.; Li, M.; Gao, S.; Liu, Z.; Gao, J.; Wang, X. Soil CO2 and N2O emissions and microbial abundances altered by temperature rise and nitrogen addition in active-layer soils of permafrost peatland. Front. Microbiol. 2022, 13, 1093487. [Google Scholar] [CrossRef]
  55. Dai, Z.; Yu, M.; Chen, H.; Zhao, H.; Huang, Y.; Su, W.; Xia, F.; Chang, S.X.; Brookes, P.C.; Dahlgren, R.A.; et al. Elevated temperature shifts soil N cycling from microbial immobilization to enhanced mineralization, nitrification and denitrification across global terrestrial ecosystems. Glob. Chang. Biol. 2020, 26, 5267–5276. [Google Scholar] [CrossRef]
  56. Xue, K.; Yuan, M.M.; Shi, Z.J.; Qin, Y.; Deng, Y.; Cheng, L.; Wu, L.; He, Z.; Van Nostrand, J.D.; Bracho, R.; et al. Tundra soil carbon is vulnerable to rapid microbial decomposition under climate warming. Nat. Clim. Chang. 2016, 6, 595–600. [Google Scholar] [CrossRef]
  57. Butterbach-Bahl, K.; Baggs, E.M.; Dannenmann, M.; Kiese, R.; Zechmeister-Boltenstern, S. Nitrous oxide emissions from soils: How well do we understand the processes and their controls? Philos. Trans. R. Soc. B Biol. Sci. 2013, 368, 20130122. [Google Scholar] [CrossRef]
  58. Thangarajan, R.; Bolan, N.S.; Tian, G.; Naidu, R.; Kunhikrishnan, A. Role of organic amendment application on greenhouse gas emission from soil. Sci. Total Environ. 2013, 465, 72–96. [Google Scholar] [CrossRef]
  59. Hassan, W.; Bashir, S.; Ahmed, N.; Tanveer, M.; Shah, A.N.; Bano, R.; David, J. Labile Organic Carbon Fractions, Regulator of CO2 Emission: Effect of Plant Residues and Water Regimes. Clean-Soil Air Water 2016, 44, 1358–1367. [Google Scholar] [CrossRef]
  60. Zou, X.; Ruan, H.; Fu, Y.; Yang, X.; Sha, L. Estimating soil labile organic carbon and potential turnover rates using a sequential fumigation–incubation procedure. Soil Biol. Biochem. 2005, 37, 1923–1928. [Google Scholar] [CrossRef]
  61. Ma, R.; Yu, K.; Xiao, S.; Liu, S.; Ciais, P.; Zou, J. Data-driven estimates of fertilizer-induced soil NH3, NO and N2O emissions from croplands in China and their climate change impacts. Glob. Chang. Biol. 2022, 28, 1008–1022. [Google Scholar] [CrossRef]
  62. Tanahashi, T.; Murase, J.; Matsuya, K.; Asakawa, S.; Kimura, M. Microbial communities responsible for the decomposition of rice straw compost in a Japanese rice paddy field determined by phospholipid fatty acid (PLFA) analysis. Soil Sci. Plant Nutr. 2004, 50, 1229–1236. [Google Scholar] [CrossRef]
  63. Lehrsch, G.A.; Brown, B.; Lentz, R.D.; Johnson-Maynard, J.L.; Leytem, A.B. Winter and growing season nitrogen mineralization from fall-applied composted or stockpiled solid dairy manure. Nutr. Cycl. Agroecosyst. 2016, 104, 125–142. [Google Scholar] [CrossRef]
  64. Gaudel, G.; Xing, L.; Raseduzzaman, M.; Poudel, M.; Dong, W.; Hu, C. Soil microbes, carbon, nitrogen, and the carbon to nitrogen ratio indicate priming effects across terrestrial ecosystems. J. Soils Sediments 2024, 24, 307–322. [Google Scholar] [CrossRef]
  65. Lenka, S.; Trivedi, P.; Singh, B.; Singh, B.P.; Pendall, E.; Bass, A.; Lenka, N.K. Effect of crop residue addition on soil organic carbon priming as influenced by temperature and soil properties. Geoderma 2019, 347, 70–79. [Google Scholar] [CrossRef]
  66. Fang, Y.; Nazaries, L.; Singh, B.K.; Singh, B.P. Microbial mechanisms of carbon priming effects revealed during the interaction of crop residue and nutrient inputs in contrasting soils. Glob. Chang. Biol. 2018, 24, 2775–2790. [Google Scholar] [CrossRef]
  67. Gaudel, G.; Xing, L.; Shrestha, S.; Poudel, M.; Sherpa, P.; Raseduzzaman, M.; Zhang, X. Microbial mechanisms regulate soil organic carbon mineralization under carbon with varying levels of nitrogen addition in the above-treeline ecosystem. Sci. Total Environ. 2024, 917, 170497. [Google Scholar] [CrossRef]
  68. Chen, B.; Liu, E.; Tian, Q.; Yan, C.; Zhang, Y. Soil nitrogen dynamics and crop residues. A review. Agron. Sustain. Dev. 2014, 34, 429–442. [Google Scholar] [CrossRef]
  69. Xie, Z.; Yu, Z.; Li, Y.; Wang, G.; Liu, X.; Tang, C.; Lian, T.; Adams, J.; Liu, J.; Liu, J.; et al. Soil microbial metabolism on carbon and nitrogen transformation links the crop-residue contribution to soil organic carbon. NPJ Biofilms Microbiomes 2022, 8, 14. [Google Scholar] [CrossRef]
  70. Almagro, M.; Ruiz-Navarro, A.; Díaz-Pereira, E.; Albaladejo, J.; Martínez-Mena, M. Plant residue chemical quality modulates the soil microbial response related to decomposition and soil organic carbon and nitrogen stabilization in a rainfed Mediterranean agroecosystem. Soil Biol. Biochem. 2021, 156, 108198. [Google Scholar] [CrossRef]
  71. Muhammad, I.; Sainju, U.M.; Zhao, F.; Khan, A.; Ghimire, R.; Fu, X.; Wang, J. Regulation of soil CO2 and N2O emissions by cover crops: A meta-analysis. Soil Tillage Res. 2019, 192, 103–112. [Google Scholar] [CrossRef]
  72. Aye, N.S.; Butterly, C.R.; Sale, P.W.; Tang, C. Residue addition and liming history interactively enhance mineralization of native organic carbon in acid soils. Biol. Fertil. Soils 2017, 53, 61–75. [Google Scholar] [CrossRef]
  73. Brenzinger, K.; Drost, S.M.; Korthals, G.; Bodelier, P.L. Organic residue amendments to modulate greenhouse gas emissions from agricultural soils. Front. Microbiol. 2018, 9, 3035. [Google Scholar] [CrossRef]
  74. Liang, Z.; Rasmussen, J.; Poeplau, C.; Elsgaard, L. Priming effects decrease with the quantity of cover crop residues—Potential implications for soil carbon sequestration. Soil Biol. Biochem. 2023, 184, 109110. [Google Scholar] [CrossRef]
  75. Li, L.; You, M.; Shi, H.; Ding, X.; Qiao, Y.; Han, X. Soil CO2 emissions from a cultivated Mollisol: Effects of organic amendments, soil temperature, and moisture. Eur. J. Soil Biol. 2013, 55, 83–90. [Google Scholar] [CrossRef]
  76. Al-Kaisi, M.M.; Kwaw-Mensah, D.; Ci, E. Effect of nitrogen fertilizer application on corn residue decomposition in Iowa. Agron. J. 2017, 109, 2415–2427. [Google Scholar] [CrossRef]
  77. Xu, X.; Yin, L.; Duan, C.; Jing, Y. Effect of N addition, moisture, and temperature on soil microbial respiration and microbial biomass in forest soil at different stages of litter decomposition. J. Soils Sediments 2016, 16, 1421–1439. [Google Scholar] [CrossRef]
  78. Irina, K.K.; Ekaterina, N.T.; Ruzalia, V.U.; Ekaterina, V.M.; Marina, V.S. Effect of temperature on litter decomposition, soil microbial community structure and biomass in a mixed-wood forest in European Russia. Curr. Sci. 2019, 116, 765–772. [Google Scholar] [CrossRef]
  79. Dong, H.; Zhang, S.; Lin, J.; Zhu, B. Responses of soil microbial biomass carbon and dissolved organic carbon to drying-rewetting cycles: A meta-analysis. Catena 2021, 207, 105610. [Google Scholar] [CrossRef]
  80. Marzaioli, R.; Trifuoggi, M.; Rutigliano, F. Soil microbial biomass, activities and diversity in Southern Italy areas chronically exposed to trace element input from industrial and agricultural activities. Appl. Soil Ecol. 2022, 174, 104392. [Google Scholar] [CrossRef]
  81. Shaaban, M.; Khalid, M.S.; Hu, R.; Zhou, M. Effects of water regimes on soil N2O, CH4 and CO2 emissions following addition of dicyandiamide and N fertilizer. Environ. Res. 2022, 212, 113544. [Google Scholar] [CrossRef]
  82. Wu, X.; Yao, Z.; Brüggemann, N.; Shen, Z.; Wolf, B.; Dannenmann, M.; Zheng, X.; Butterbach-Bahl, K. Effects of soil moisture and temperature on CO2 and CH4 soil–atmosphere exchange of various land use/cover types in a semi-arid grassland in Inner Mongolia, China. Soil Biol. Biochem. 2010, 42, 773–787. [Google Scholar] [CrossRef]
  83. Fu, B.; Chen, L.; Huang, H.; Qu, P.; Wei, Z. Impacts of crop residues on soil health: A review. Environ. Pollut. Bioavailab. 2021, 33, 164–173. [Google Scholar] [CrossRef]
  84. Lu, X. A meta-analysis of the effects of crop residue return on crop yields and water use efficiency. PLoS ONE 2020, 15, e0231740. [Google Scholar] [CrossRef]
  85. Meng, H.N.; Song, C.C.; Miao, Y.Q.; Mao, R.; Wang, X.W. Response of CH4 emissions to moss removal and N addition in boreal peatland of northeast China. Biogeosciences 2014, 11, 4809–4816. [Google Scholar] [CrossRef]
  86. Ren, F.; Zhang, X.; Liu, J.; Sun, N.; Wu, L.; Li, Z.; Xu, M. A synthetic analysis of greenhouse gas emissions from manure amended agricultural soils in China. Sci. Rep. 2017, 7, 8123. [Google Scholar] [CrossRef]
  87. Zhang, X.; Zhang, J.; Zheng, C.; Guan, D.; Li, S.; Xie, F.; Chen, J.; Hang, X.; Jiang, Y.; Deng, A.; et al. Significant residual effects of wheat fertilization on greenhouse gas emissions in succeeding soybean growing season. Soil Tillage Res. 2017, 169, 7–15. [Google Scholar] [CrossRef]
  88. Sullivan, B.W.; Selmants, P.C.; Hart, S.C. Does dissolved organic carbon regulate biological methane oxidation in semiarid soils? Glob. Chang. Biol. 2013, 19, 2149–2157. [Google Scholar] [CrossRef]
  89. Liu, E.; Yan, C.; Mei, X.; Zhang, Y.; Fan, T. Long-Term Effect of Manure and Fertilizer on Soil Organic Carbon Pools in Dryland Farming in Northwest China. PLoS ONE 2013, 8, e56536. [Google Scholar] [CrossRef]
  90. Le Mer, J.; Roger, P. Production, oxidation, emission and consumption of methane by soils: A review. Eur. J. Soil Biol. 2001, 37, 25–50. [Google Scholar] [CrossRef]
  91. Gao, J.; Ouyang, H.; Lei, G.; Xu, X.; Zhang, M. Effects of temperature, soil moisture, soil type and their interactions on soil carbon mineralization in Zoigê alpine wetland, Qinghai-Tibet Plateau. Chin. Geogr. Sci. 2011, 21, 27–35. [Google Scholar] [CrossRef]
  92. Van Hulzen, J.; Segers, R.; Van Bodegom, P.; Leffelaar, P. Temperature effects on soil methane production: An explanation for observed variability. Soil Biol. Biochem. 1999, 31, 1919–1929. [Google Scholar] [CrossRef]
  93. Fan, L.; Dippold, M.A.; Thiel, V.; Ge, T.; Wu, J.; Kuzyakov, Y.; Dorodnikov, M. Temperature sensitivity of anaerobic methane oxidation versus methanogenesis in paddy soil: Implications for the CH4 balance under global warming. Glob. Chang. Biol. 2022, 28, 654–664. [Google Scholar] [CrossRef]
  94. Te, X.; Din, A.M.U.; Cui, K.; Raza, M.A.; Ali, M.F.; Xiao, J.; Yang, W. Inter-specific root interactions and water use efficiency of maize/soybean relay strip intercropping. Field Crops Res. 2023, 291, 108793. [Google Scholar] [CrossRef]
  95. Raza, M.A.; Zhiqi, W.; Yasin, H.S.; Gul, H.; Qin, R.; Rehman, S.U.; Mahmood, A.; Iqbal, Z.; Ahmed, Z.; Luo, S.; et al. Effect of crop combination on yield performance, nutrient uptake, and land use advantage of cereal/legume intercropping systems. Field Crops Res. 2023, 304, 109144. [Google Scholar] [CrossRef]
  96. Wang, Y.; Zhang, Y.; Zhang, H.; Yang, Z.; Zhu, Q.; Yan, B.; Fei, J.; Rong, X.; Peng, J.; Luo, G. Intercropping-driven nitrogen trade-off enhances maize productivity in a long-term experiment. Field Crops Res. 2022, 287, 108671. [Google Scholar] [CrossRef]
  97. Gui, D.; Zhang, Y.; Lv, J.; Guo, J.; Sha, Z. Effects of intercropping on soil greenhouse gas emissions—A global meta-analysis. Sci. Total Environ. 2024, 918, 170632. [Google Scholar] [CrossRef]
  98. Han, F.; Javed, T.; Hussain, S.; Guo, S.; Guo, R.; Yang, L.; Liu, X.; Cai, T.; Zhang, P.; Jia, Z.; et al. Maize/peanut rotation intercropping improves ecosystem carbon budget and economic benefits in the dry farming regions of China. J. Environ. Manag. 2024, 353, 120090. [Google Scholar] [CrossRef]
  99. Zhang, M.; Gao, X.; Chen, G.; Afzal, M.R.; Wei, T.; Zeng, H.; Subbarao, G.V.; Wei, Z.; Zhu, Y. Intercropping with BNI-sorghum benefits neighbouring maize productivity and mitigates soil nitrification and N2O emission. Agric. Ecosyst. Environ. 2023, 352, 108510. [Google Scholar] [CrossRef]
  100. Sant’Anna, S.; Martins, M.; Goulart, J.; Araújo, S.; Araújo, E.; Zaman, M.; Jantalia, C.; Alves, B.; Boddey, R.M.; Urquiaga, S. Biological nitrogen fixation and soil N2O emissions from legume residues in an Acrisol in SE Brazil. Geoderma Reg. 2018, 15, e00196. [Google Scholar] [CrossRef]
  101. Pimentel, L.G.; Weiler, D.A.; Pedroso, G.M.; Bayer, C. Soil N2O emissions following cover-crop residues application under two soil moisture conditions. J. Plant Nutr. Soil Sci. 2015, 178, 631–640. [Google Scholar] [CrossRef]
Figure 1. Daily precipitation (mm), daily maximum, minimum, and average air temperature (°C) during the winter wheat growing season (2018–2019) at the Luancheng Agro-Ecosystem Experimental Station.
Agronomy 14 01167 g001
Figure 2. Effect of crop residues (a) and N fertilizer treatments (b) on wheat biomass dry weight (t ha−1) at different growth stages. R0: no residue; MR: maize residue; MSR: maize-soybean mixed residue; SR: soybean residues. Data are means ± SE (n = 12). Different lowercase letters indicate significant differences (p < 0.05) among the treatments.
Agronomy 14 01167 g002
Figure 3. Variation in soil NH4+ and NO3 concentration among the crop residue amendments throughout the study period. R0: no residue; MR: maize residue; MSR: maize-soybean mixed residue; SR: soybean residues. Data are means ± SE (n = 12). The downward arrow indicate the time of fertilizer top dressing.
Agronomy 14 01167 g003
Figure 4. Daily soil N2O fluxes from crop residue amendments and N treatments during the study period. R0: no residue; MR: maize residue; MSR: maize-soybean mixed residue; SR: soybean residue. Data are means ± SE (n = 12). The downward arrows indicate the time of N application.
Agronomy 14 01167 g004
Figure 5. Effect of crop residue amendments on seasonal N2O, CO2, and CH4 emissions; global warming potentials (GWP); grain yield; and yield-scaled GHG emissions (GHGI) under different N treatments during the study period.
Agronomy 14 01167 g005
Figure 6. Spearman’s rho rank correlation coefficient analysis between N2O, CO2, CH4 fluxes, soil properties, and environmental factors in different treatments during the study period at the Luancheng Agro-Ecosystem Experimental Station. The data level indicates the r values. The asterisk under r values denote significant correlation at the 0.05 level (*) or the 0.01 level (**) based on a 2-tailed test.
Agronomy 14 01167 g006
Figure 7. Daily soil CO2 fluxes from crop residue amendments and N treatments during the study period. R0: no residue; MR: maize residue; MSR: maize-soybean mixed residue; SR: soybean residue. Data are means ± SE (n = 12). The downward arrows indicate the time of N application.
Agronomy 14 01167 g007
Figure 8. Daily soil CH4 fluxes from crop residue amendments and N treatments during the study period. R0: no residue; MR: maize residue; MSR: maize-soybean mixed residue; SR: soybean residue. Data are means ± SE (n = 12). The downward arrows indicating the time of N application.
Agronomy 14 01167 g008
Figure 9. Box plot analysis for different soil properties and environmental factors in different crop residue amendments throughout the growing season at the Luancheng Agro-Ecosystem Experimental Station. (a) soil NH4+ content, (b) soil NO3 content, (c) soil C/N ratio, (d) soil DOC content, (e) soil moisture content, (f) ground temperature, (g) soil temperature at 5 cm depth, (h) soil pH. R0: no residue; MR: maize residue; MSR: maize-soybean mixed residue; SR: soybean residues. The boxes represent data between the 25th and 75th percentiles; solid lines and dotted lines inside the boxes represent the median and mean values, respectively, for each parameter. The error bars represent whiskers based on the 1.5 IQR value. The diamond-shaped black points outside the boundary of the whiskers are outliers. Different lowercase letters indicate significant difference (p < 0.05) among the crop residue amendments.
Agronomy 14 01167 g009
Figure 10. Box plot analysis for different soil properties and environmental factors in different N treatment plots throughout the growing season at the Luancheng Agro-Ecosystem Experimental Station. (a) soil NH4+ content, (b) soil NO3 content, (c) soil C/N ratio, (d) soil DOC content, (e) soil moisture content, (f) ground temperature, (g) soil temperature at 5 cm depth, (h) soil pH. The boxes represent data between the 25th and 75th percentiles; solid lines and dotted lines inside the boxes represent the median and mean values, respectively, for each parameter. The error bars represent whiskers based on the 1.5 IQR value. The diamond-shaped black points outside the boundary of the whiskers are outliers. Different lowercase letters indicate significant difference (p < 0.05) among the N treatments.
Agronomy 14 01167 g010
Table 1. ANOVA (Pr > F) of N2O, CO2, and CH4 emissions; global warming potential; grain yield; and yield-scaled emissions (GHGI) as affected by crop residue incorporation and N treatments.
Variable Sourced.f.N2O EmissionsCO2 EmissionsCH4 EmissionsGlobal Warming PotentialGrain YieldGHGI
Crop residue30.0310.0010.8910.0020.0380.031
N treatment30.0000.6360.7960.3680.0000.000
Crop residue × N treatment90.0460.0060.9240.0300.0080.048
d.f. is degree of freedom.
Table 2. Seasonal N2O, CO2, and CH4 emissions (expressed as kg ha−1 season−1); grain yield (kg ha−1), global warming potential (GWP) (expressed as Kg CO2-eq ha−1 season−1); and yield-scaled emissions (GHGI) (Kg CO2-eq kg−1 grain) from different crop residue amendments and N treatments during study period at the Luancheng Agro-Ecosystem Experimental Station.
TreatmentN2O EmissionsCO2 EmissionsCH4 EmissionsGWP (kg CO2-eq ha−1 season−1)Grain Yield
(kg ha−1)
GHGI (kg CO2-eq kg−1 grain)
kg ha−1 season−1
R01.55 ± 0.26 b6032 ± 214 b−0.76 ± 0.08 a6468 ± 264 b4003 ± 470 b1.81 ± 0.16 b
MR1.69 ± 0.30 b7640 ± 335 a−0.80 ± 0.10 a8116 ± 336 a4231 ± 504 ab2.29 ± 0.30 a
MSR1.63 ± 0.25 b6969 ± 249 a−0.88 ± 0.12 a7424 ± 211 a4843 ± 449 a1.71 ± 0.19 b
SR2.11 ± 0.28 a6884 ± 263 a−0.87 ± 0.15 a7484 ± 278 a4946 ± 425 a1.70 ± 0.23 b
Control0.75 ± 0.10 c6751 ± 322 a−0.83 ± 0.13 a6947 ± 337 a2818 ± 306 c2.71 ± 0.27 a
Urea2.45 ± 0.22 a6905 ± 252 a−0.73 ± 0.11 a7612 ± 281 a5565 ± 352 a1.43 ± 0.10 c
Manure1.43 ± 0.11 b7152 ± 313 a−0.89 ± 0.12 a7547 ± 312 a3942 ± 249 b1.96 ± 0.12 b
Manure + urea2.35 ± 0.26 a6717 ± 332 a−0.88 ± 0.09 a7387 ± 315 a5699 ± 340 a1.34 ± 0.12 c
Values are the means (n = 12) ± standard error (SE). Means with different lowercase letters in a column indicate significant differences (p < 0.05) among the treatments.
Disclaimer/Publisher’s Note: The statements, opinions and data contained in all publications are solely those of the individual author(s) and contributor(s) and not of MDPI and/or the editor(s). MDPI and/or the editor(s) disclaim responsibility for any injury to people or property resulting from any ideas, methods, instructions or products referred to in the content.

