

Replacing Chemical Fertilizer with Separated Biogas Slurry to Reduce Soil Nitrogen Loss and Increase Crop Yield—A Two-Year Field Study

Abstract
1. Introduction
- Substituting chemical fertilizers with biogas slurry would increase both crop yield and nitrogen utilization efficiency, contributing to sustainable agricultural practices.
- Substituting chemical fertilizers with biogas slurry would reduce nitrogen loss.
2. Materials and Methods
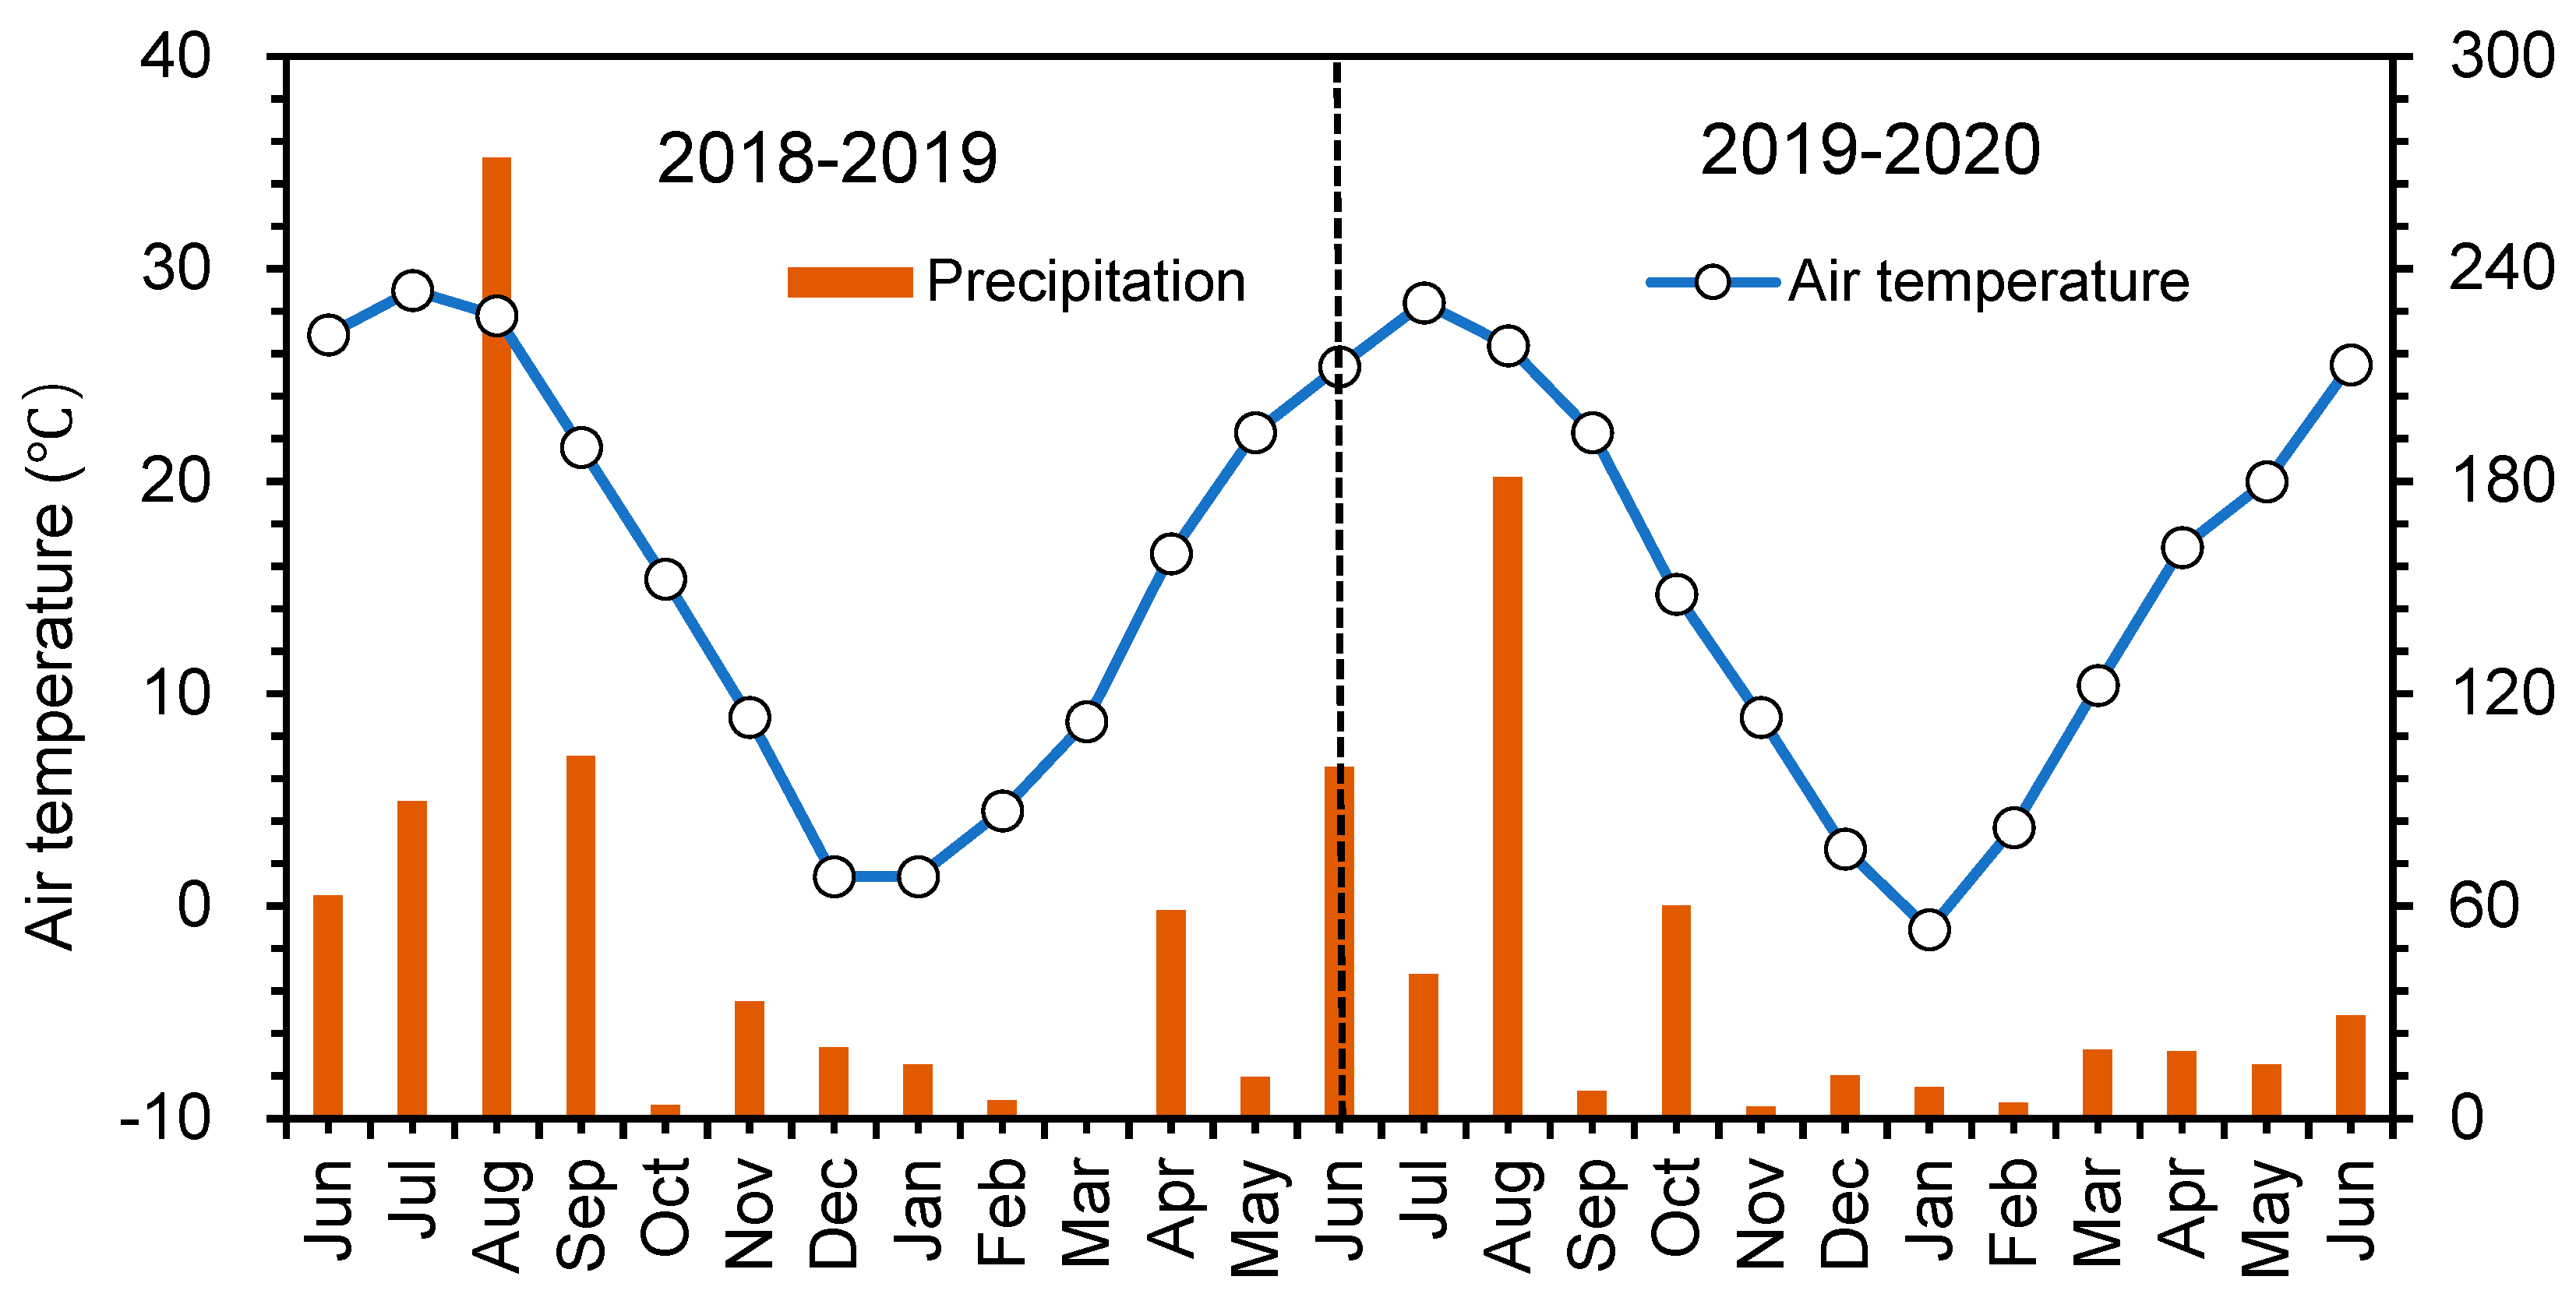
2.1. Site Description and Experimental Design
2.2. Sampling and Analyses
2.2.1. NH3 Emissions
2.2.2. Nitrogen Leaching
2.2.3. Crop Yield and Plant Nitrogen Content
2.2.4. Soil NO3−-N and NH4+-N
2.3. Calculations
2.3.1. NH3 Emissions
2.3.2. Nitrogen Leaching
2.3.3. Nitrogen Use Efficiency
2.3.4. Nitrogen Balance
2.4. Statistical Analyses
3. Results
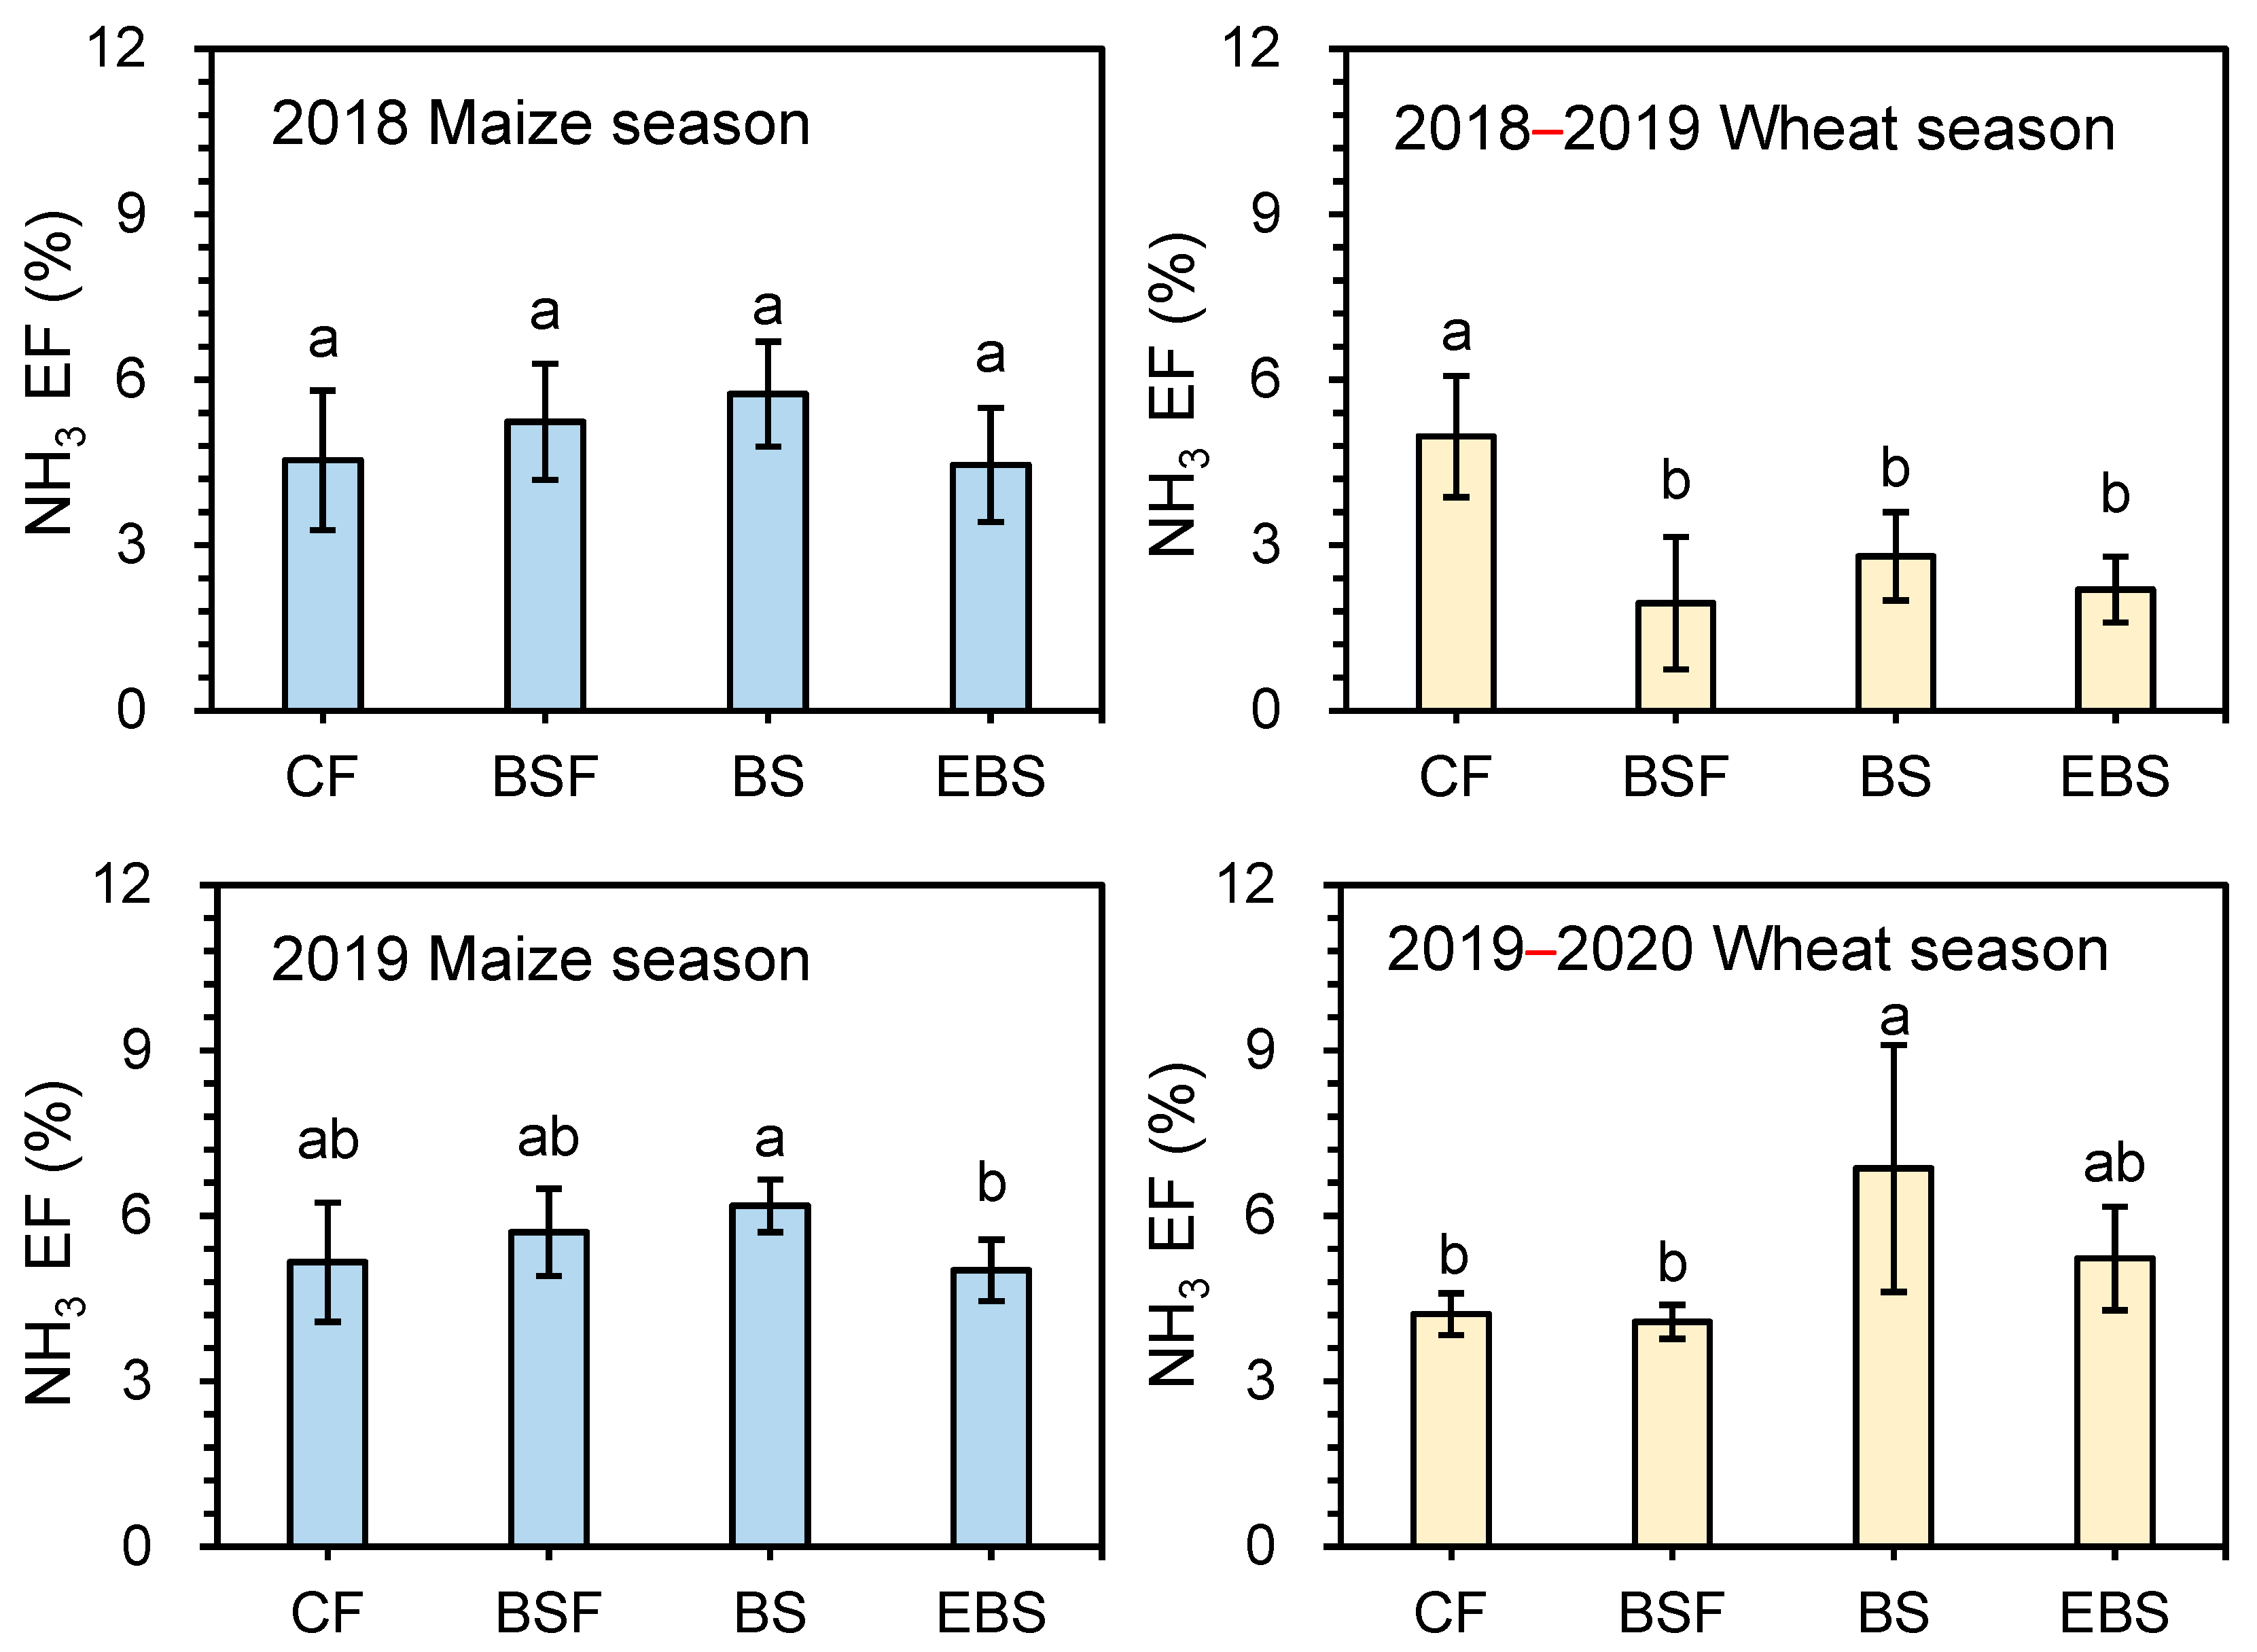
3.1. NH3 Emissions
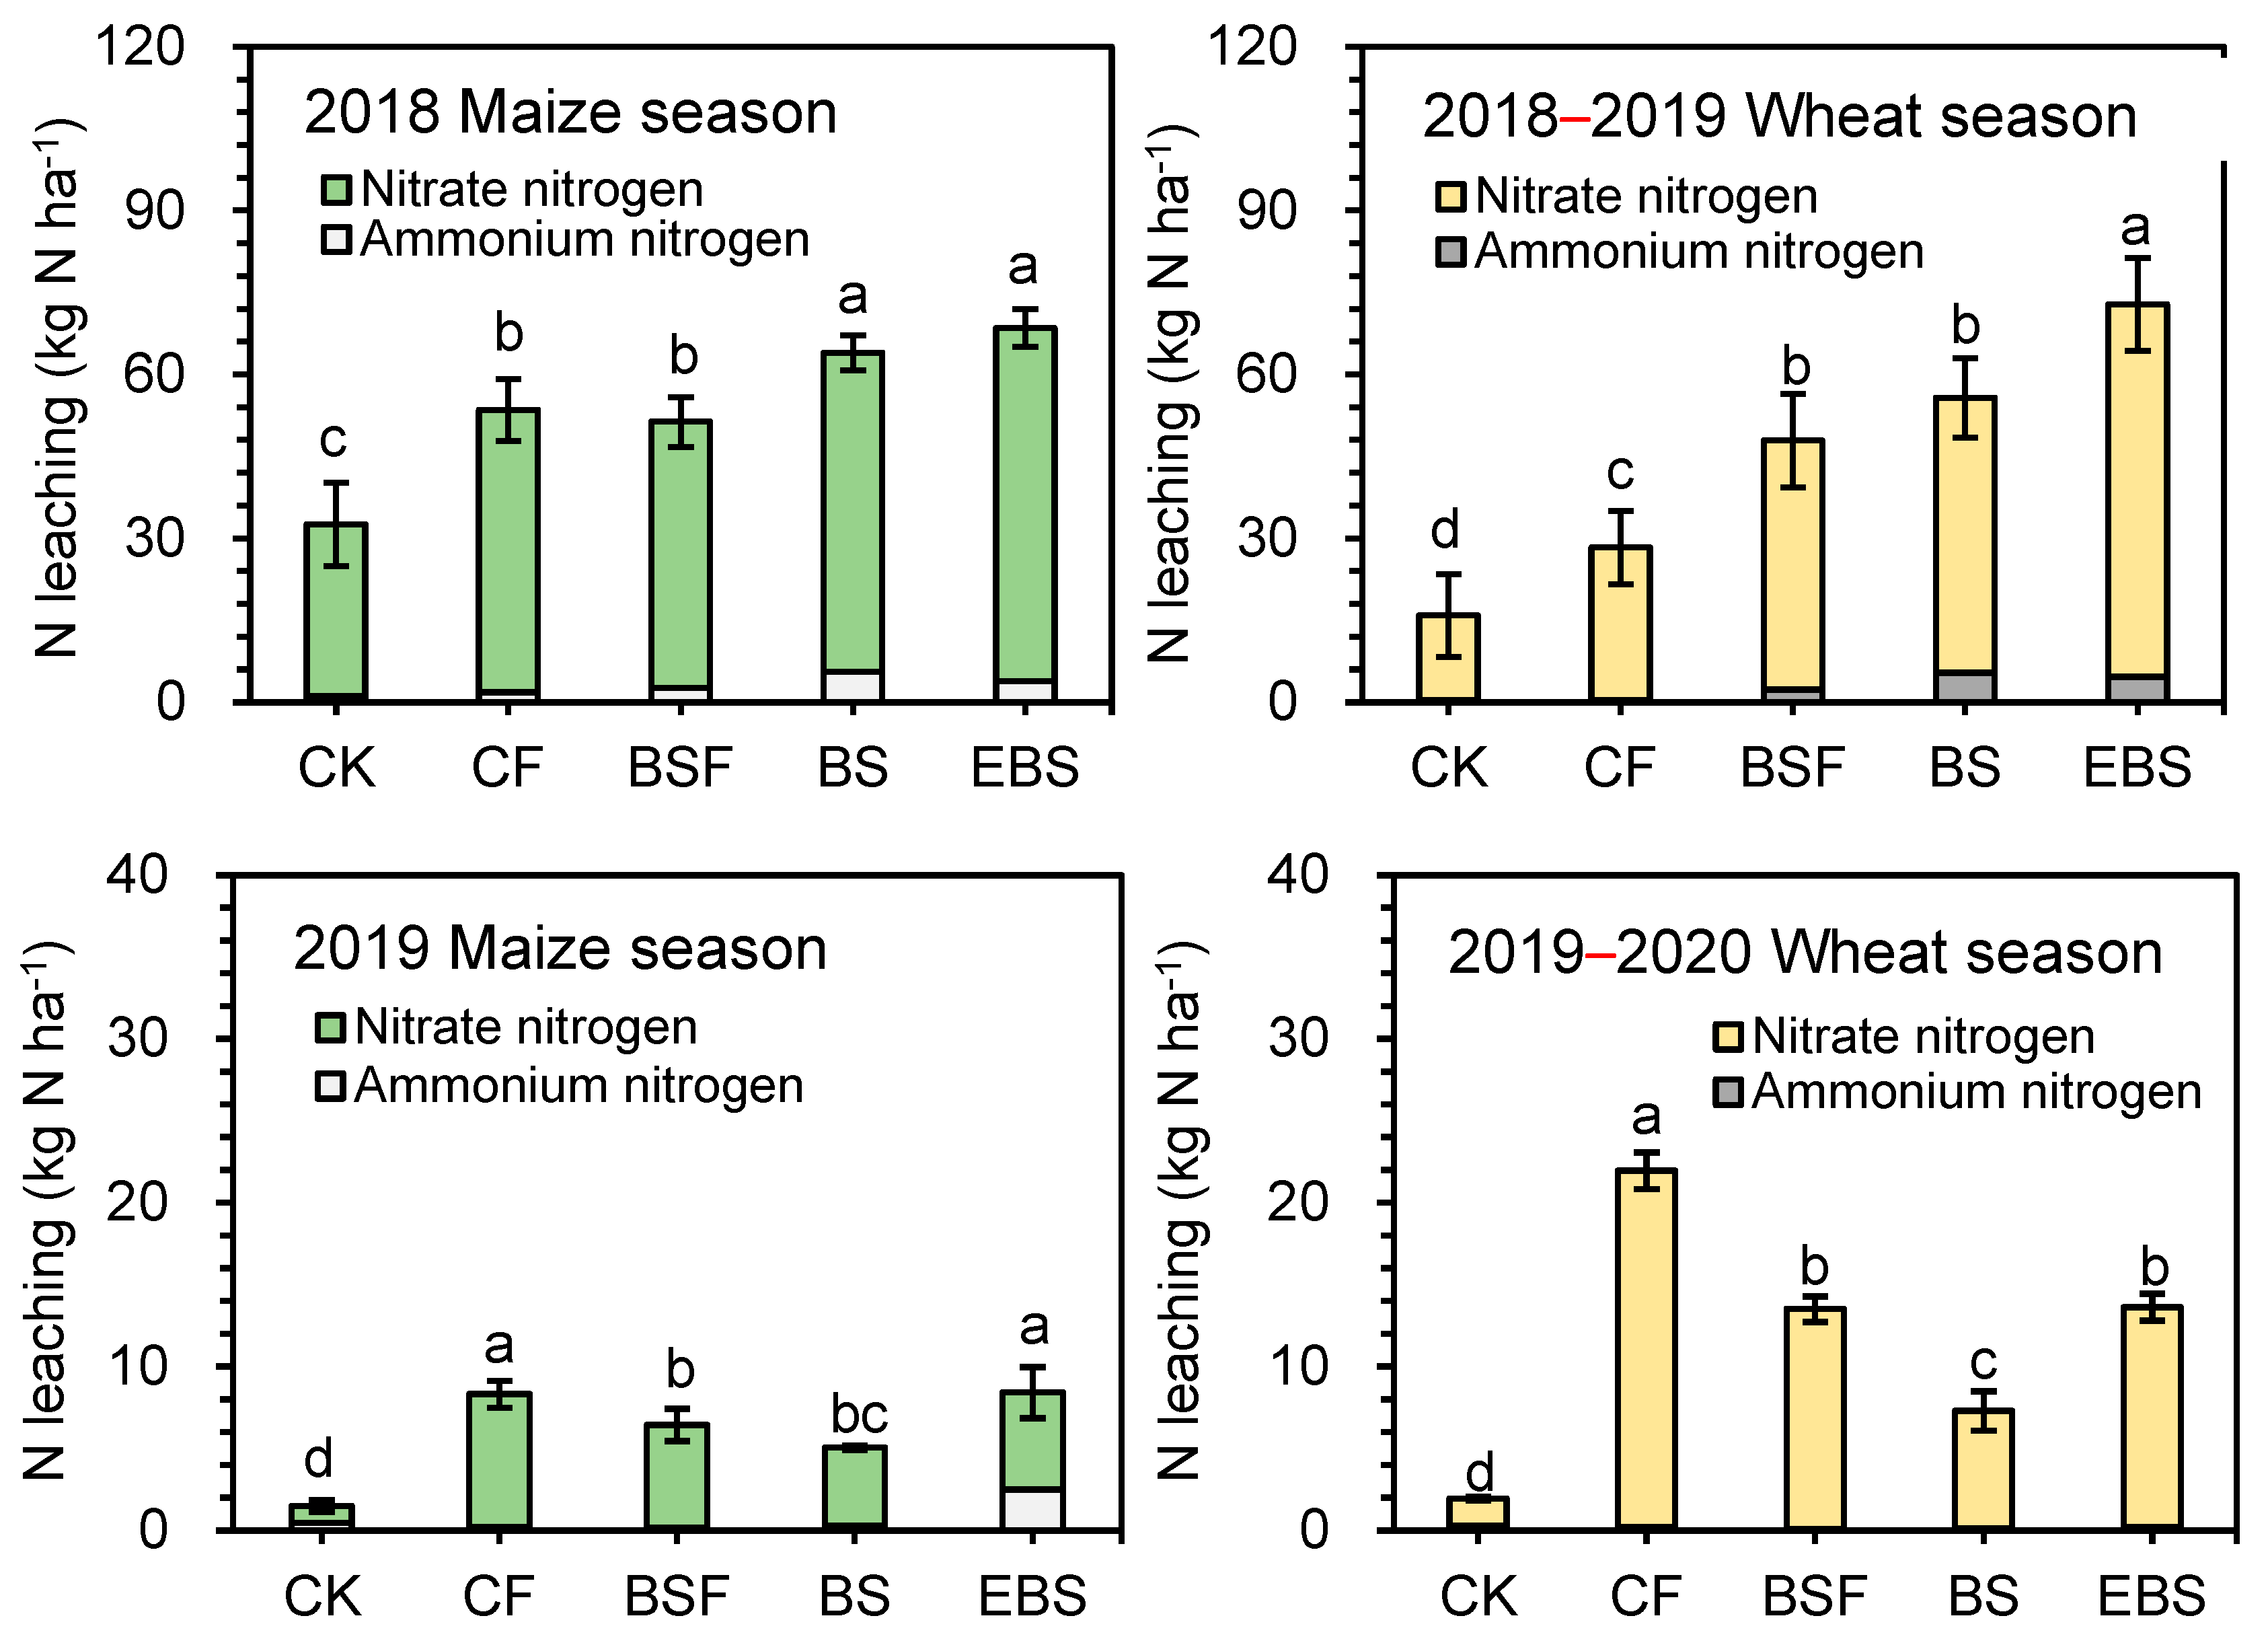
3.2. Nitrogen Leaching
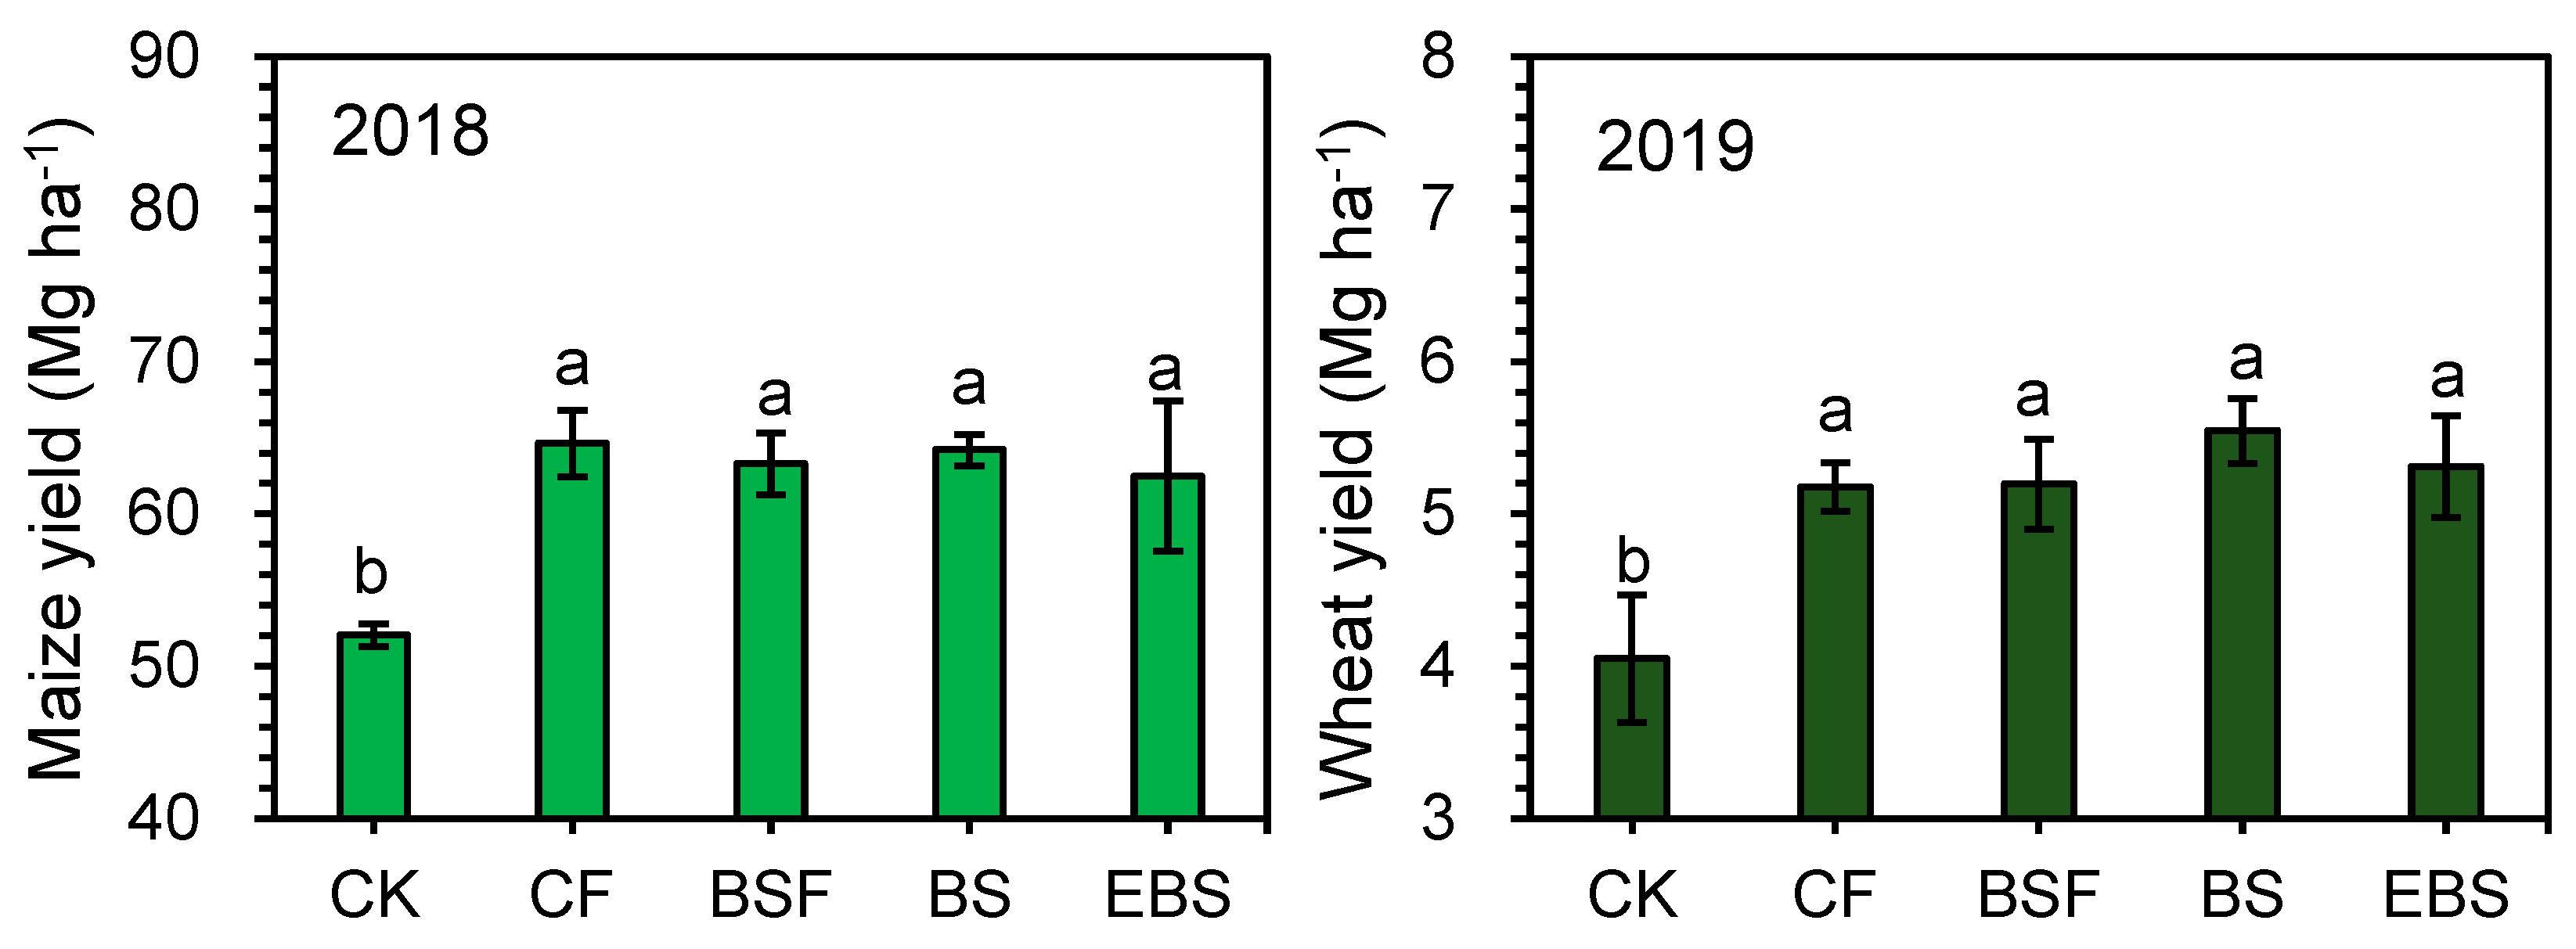
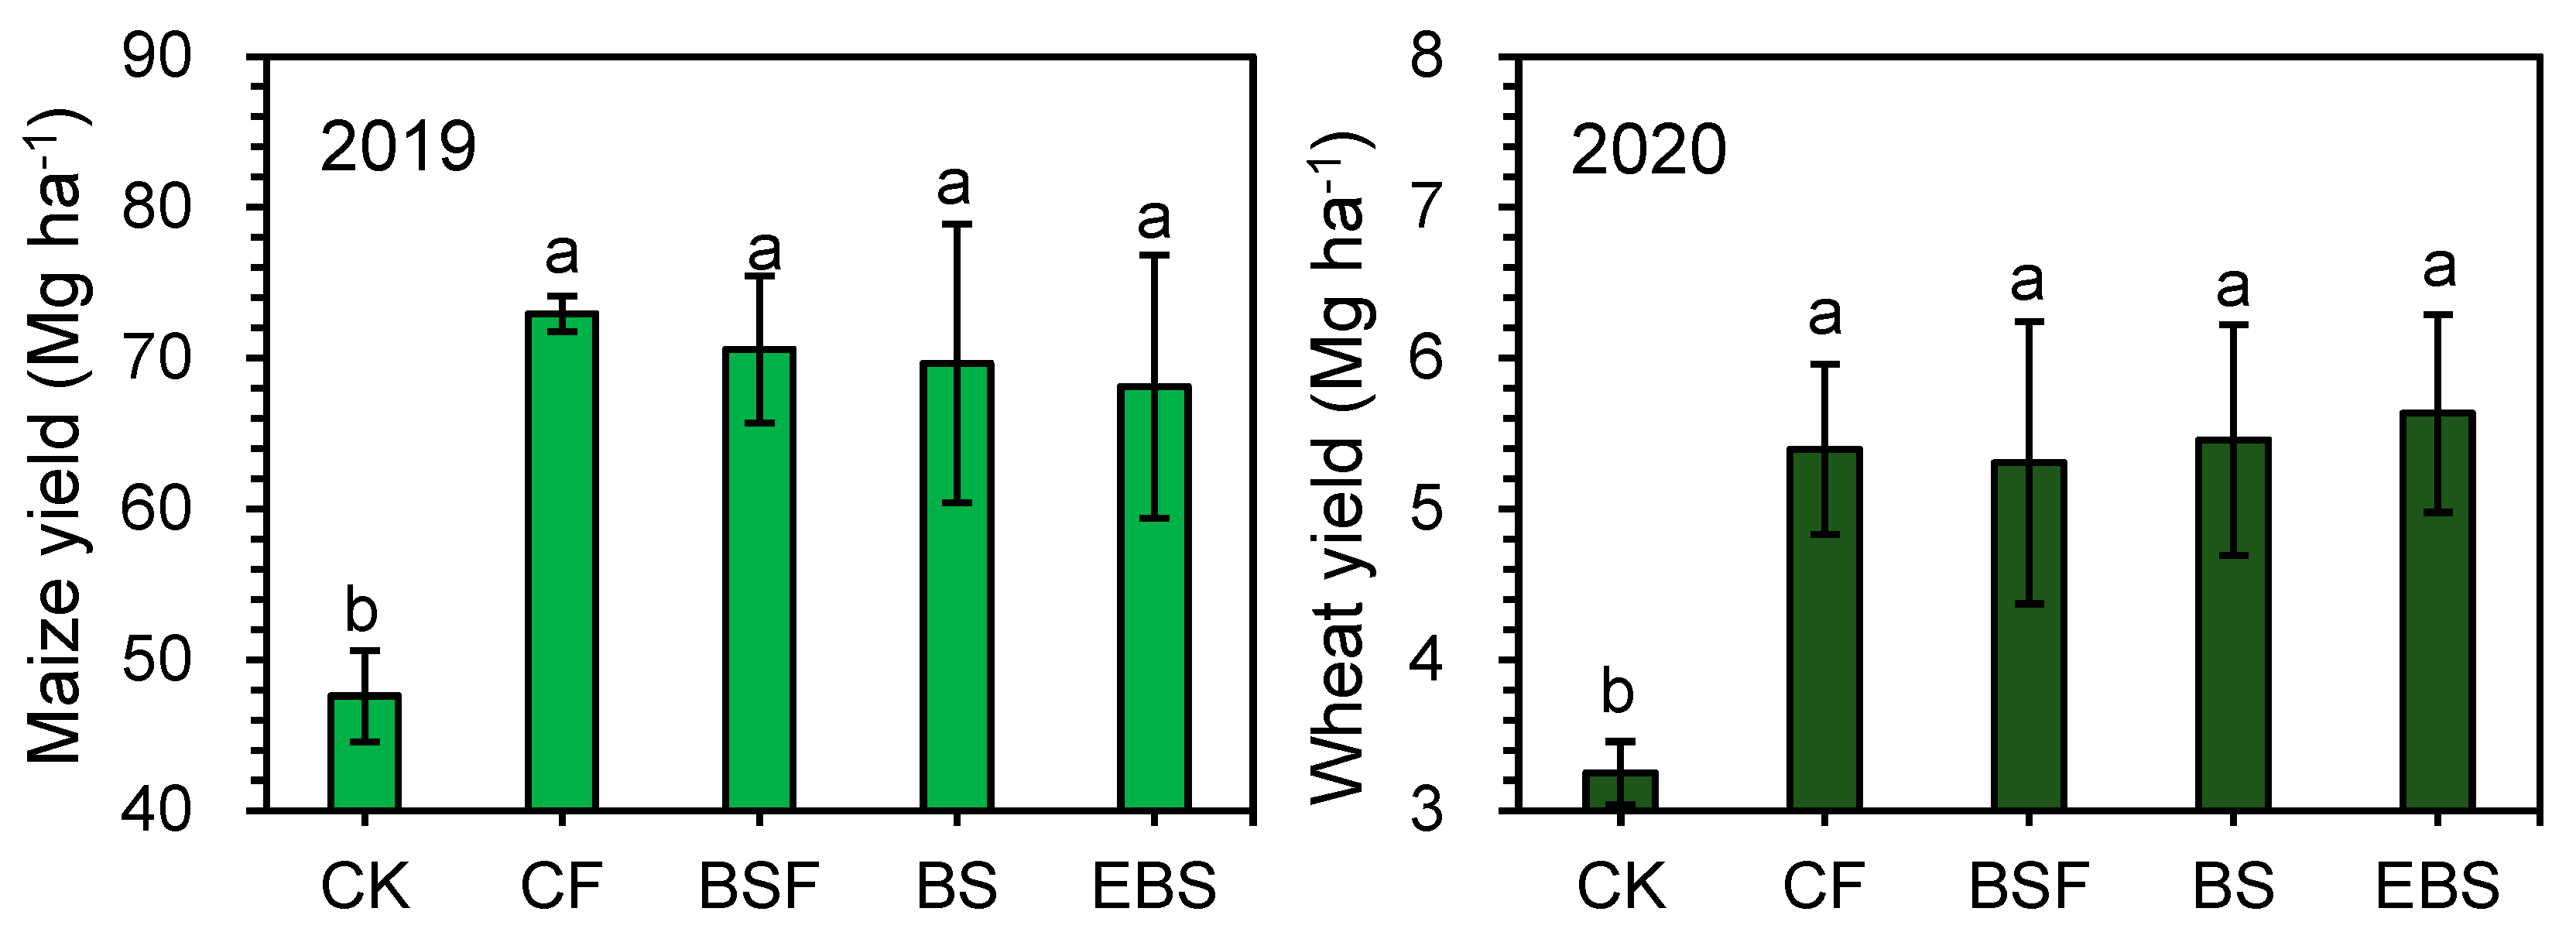
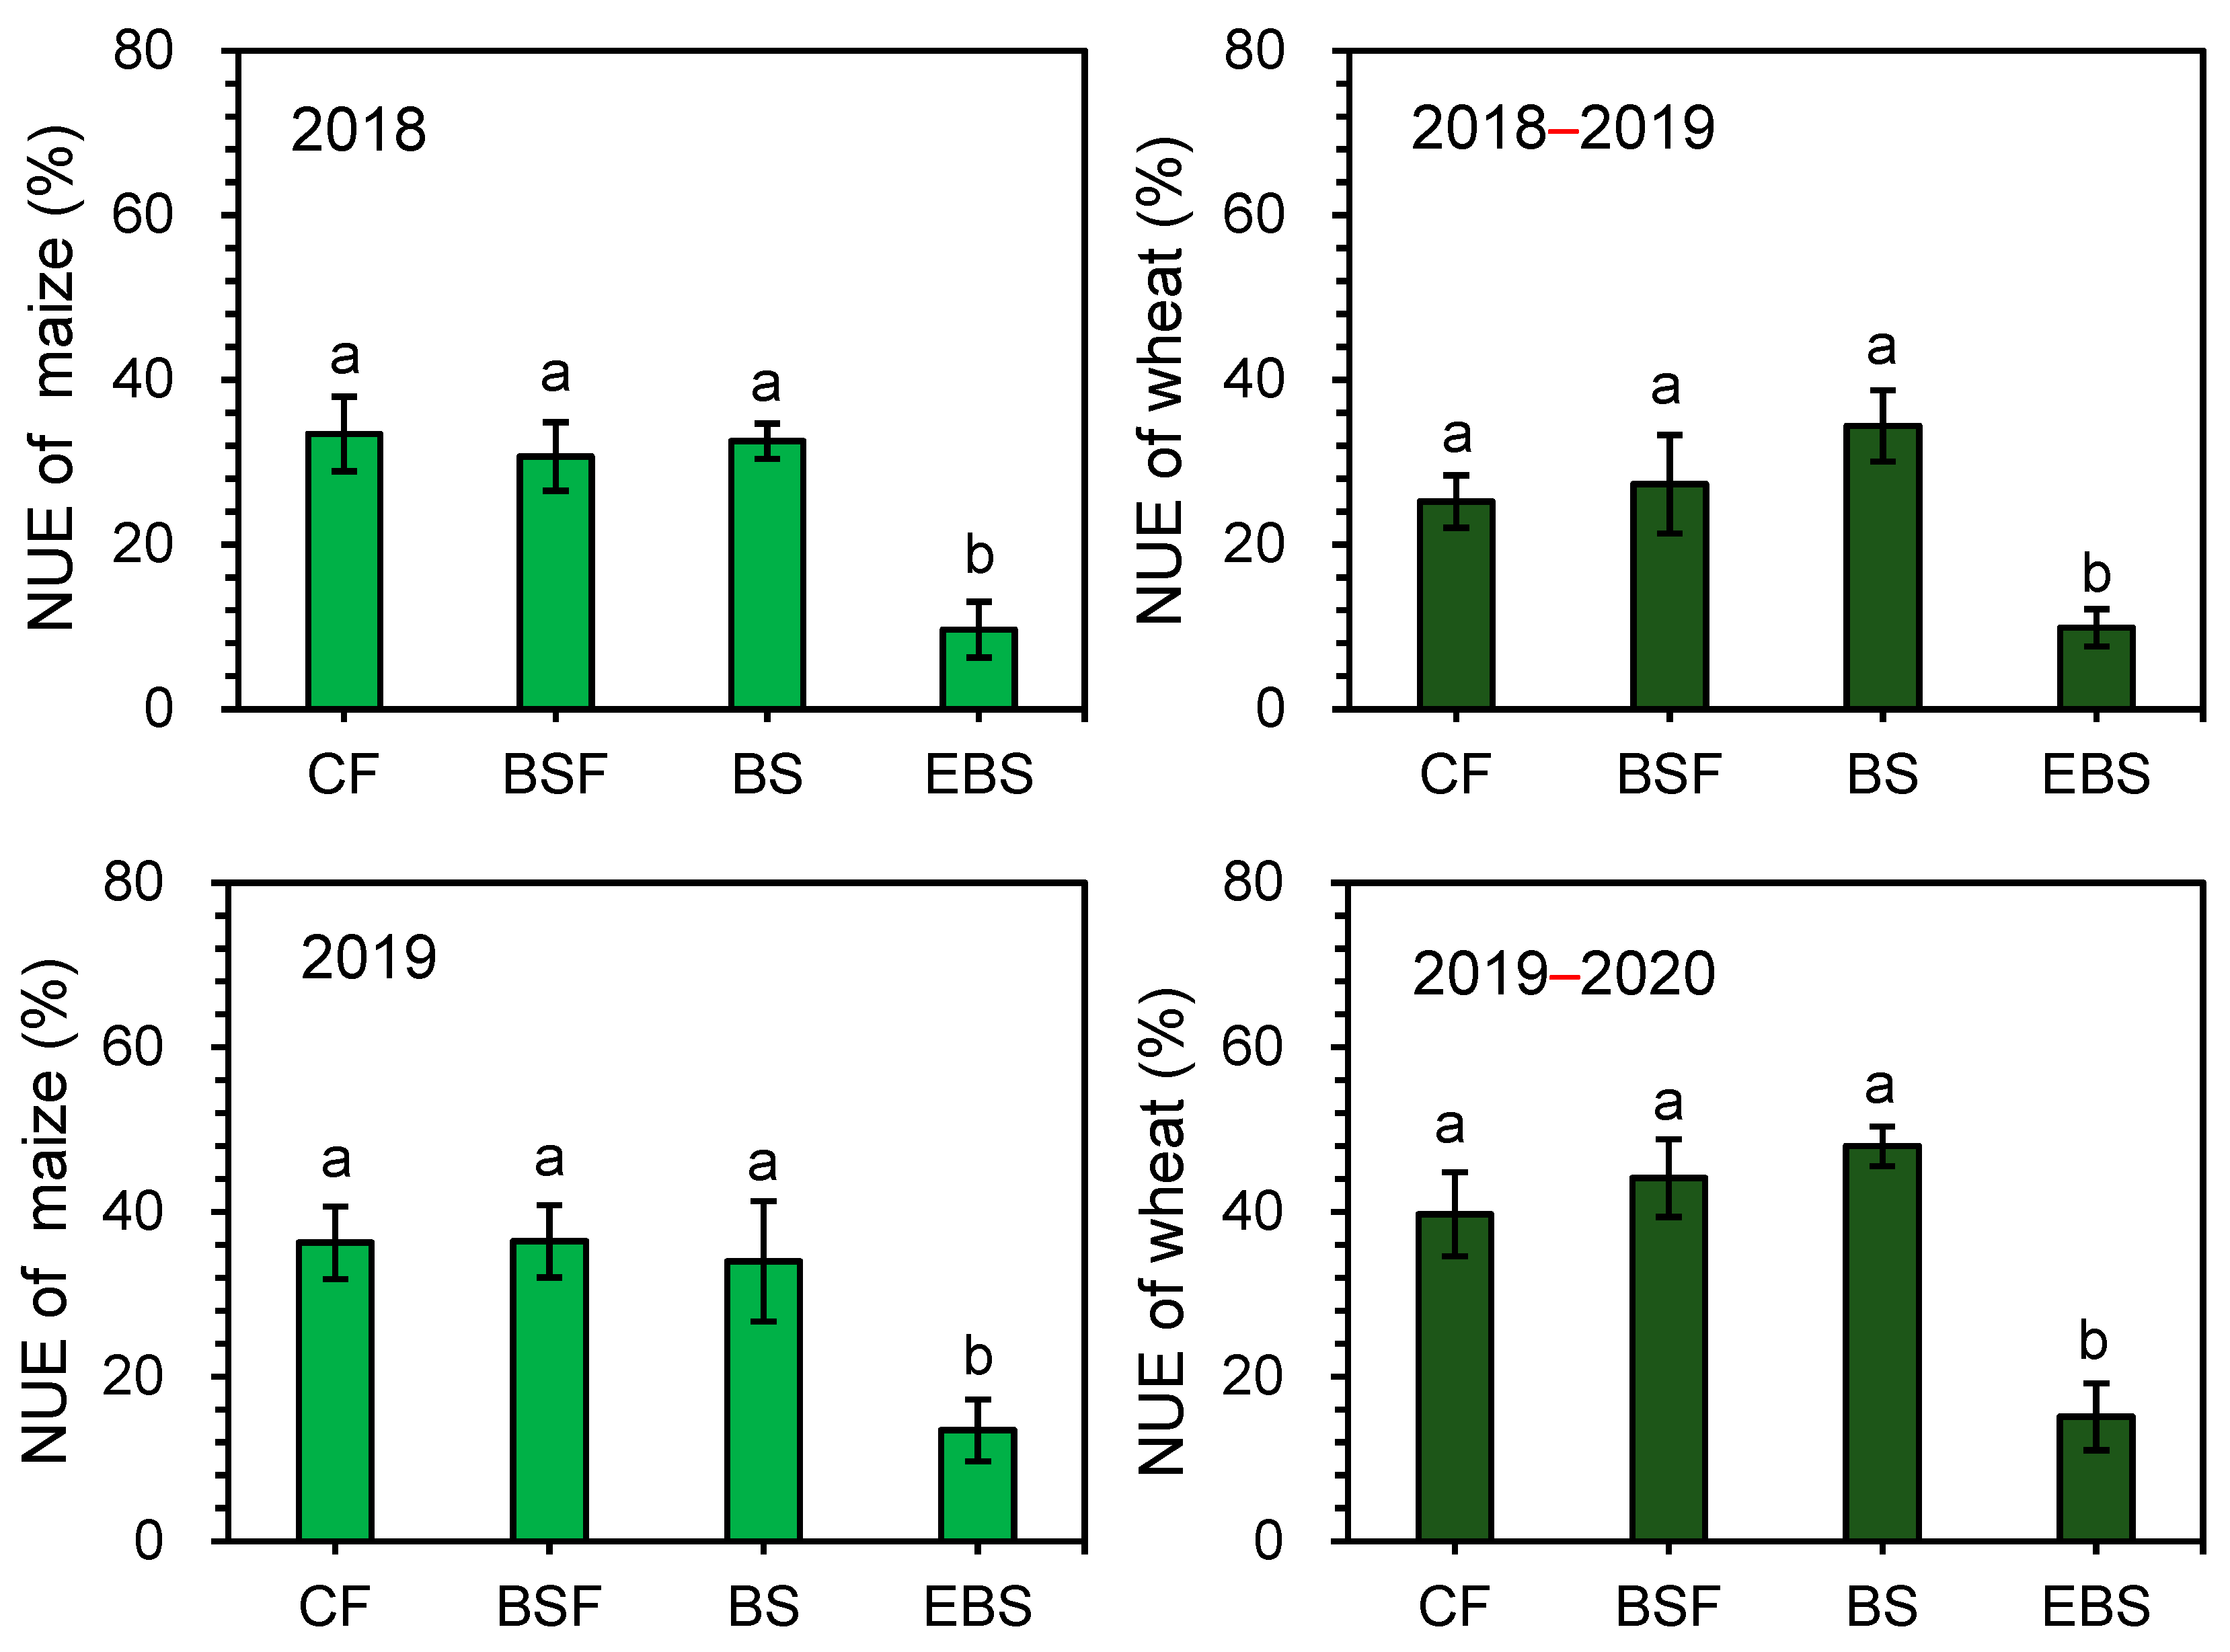
3.3. Crop Yield and NUE
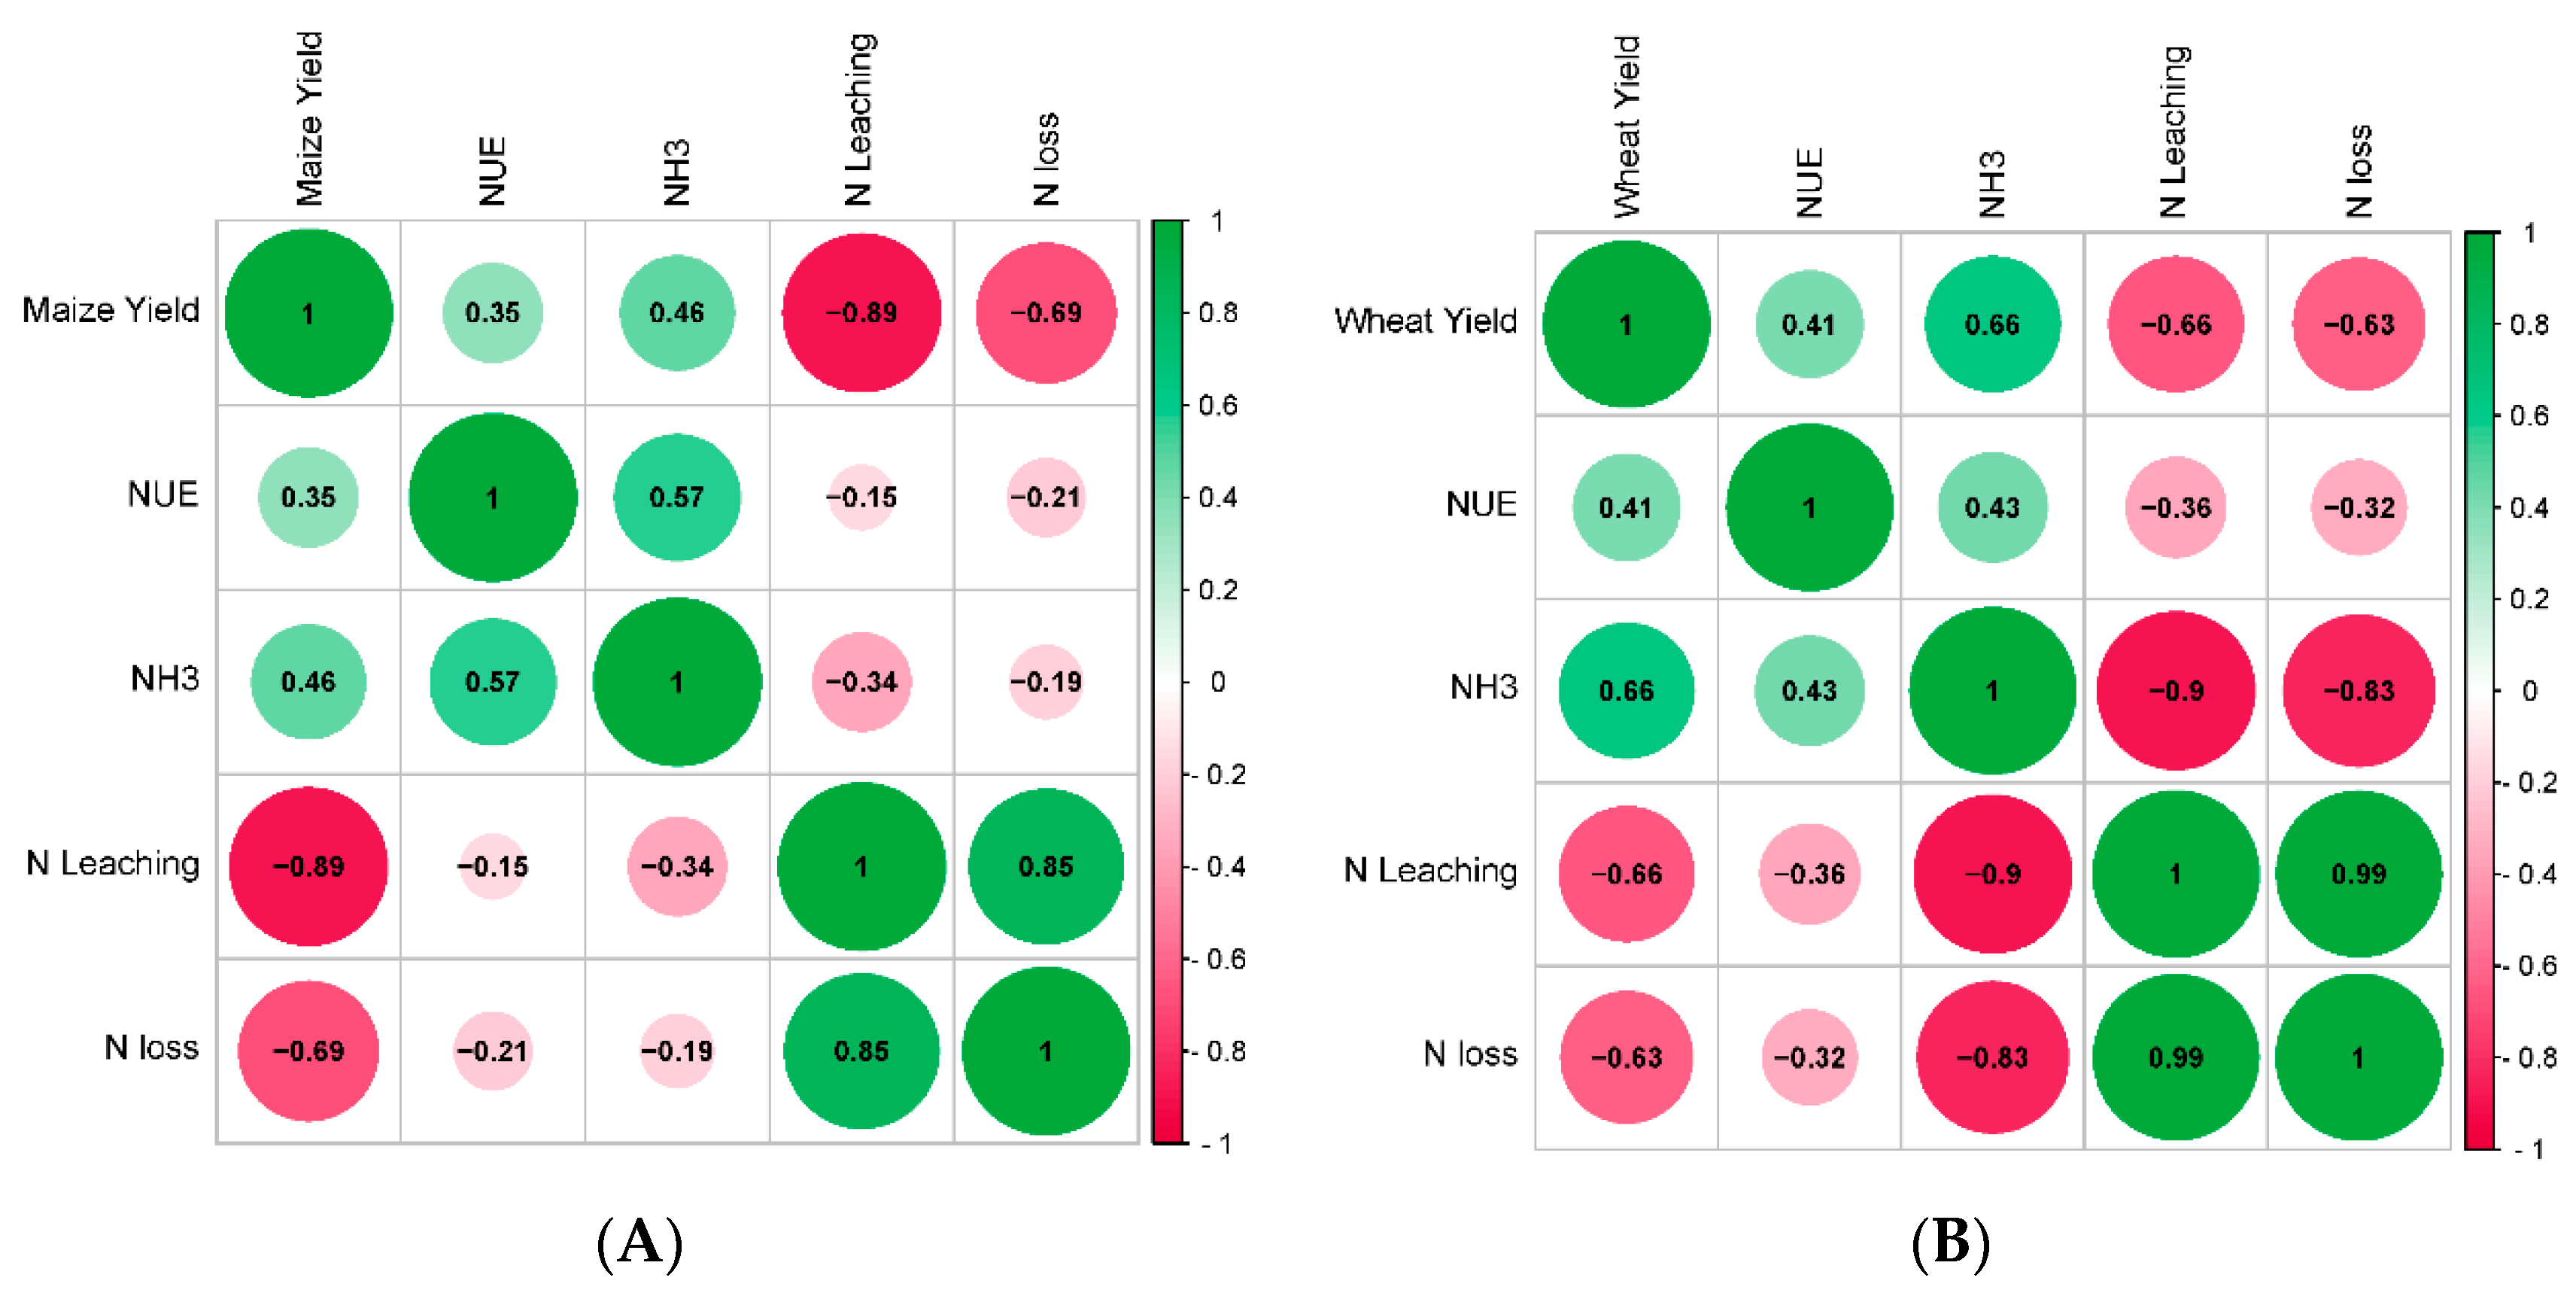
3.4. The Correlation between Crop Yield, NUE, and Nitrogen Loss
3.5. Nitrogen Balance
4. Discussion
4.1. Effect of Biogas Slurry Substitution on N Loss
4.2. Improving Effects of Biogas Slurry Substitution on Crop Yield, Nitrogen Use, and N Loss Reduction
5. Conclusions
Supplementary Materials
Author Contributions
Funding
Data Availability Statement
Conflicts of Interest
References
- Nyang’au, J.O.; Sørensen, P.; Møller, H.B. Nitrogen availability in digestates from full-scale biogas plants following soil application as affected by operation parameters and input feedstocks. Bioresour. Technol. Rep. 2023, 24, 101675. [Google Scholar] [CrossRef]
- Abubaker, J.; Odlare, M.; Pell, M. Nitrous oxide production from soils amended with biogas residues and cattle slurry. J. Environ. Qual. 2013, 42, 1046–1058. [Google Scholar] [CrossRef] [PubMed]
- Baral, K.R.; Labouriau, R.; Olesen, J.E.; Petersen, S.O. Nitrous oxide emissions and nitrogen use efficiency of manure and digestates applied to spring barley. Agric. Ecosyst. Environ. 2017, 239, 188–198. [Google Scholar] [CrossRef]
- Posmanik, R.; Nejidat, A.; Gross, A. Effects of limed manure digestate application in sandy soil on plant nitrogen availability and soil N2O emissions. Soil Environ. Health 2023, 1, 100006. [Google Scholar] [CrossRef]
- Shi, Y.; Rahaman, M.A.; Zhang, Q.; Zhan, X.; Zheng, L. Effects of partial substitution of chemical fertilizer with biogas slurry on nitrous oxide emissions and the related nitrifier and denitrifier in a saline-alkali soil. Environ. Technol. Innov. 2022, 28, 102900. [Google Scholar] [CrossRef]
- Nyameasem, J.K.; Zutz, M.; Kluß, C.; Huf, M.T.; Essich, C.; Buchxen-Tschiskale, C.; Ruser, R.; Flessa, H.; Olfs, H.-W.; Taube, F.; et al. Impact of cattle slurry application methods on ammonia losses and grassland nitrogen use efficiency. Environ. Pollut. 2022, 315, 120302. [Google Scholar] [CrossRef] [PubMed]
- Wang, C.; Duan, J.Z.; Ren, C.; Liu, H.; Reis, S.; Xu, J. Ammonia emissions from croplands decrease with farm size in China. Environ. Sci. Technol. 2022, 56, 9915–9923. [Google Scholar] [CrossRef]
- Lu, L.; Shirong, Z.; Mengmeng, C.; Dejie, C.; Xiaodong, D. Organic amendment increases wheat yield by improving soil N transformations and reducing n loss in North China plain. Arch. Agron. Soil Sci. 2021, 68, 1974–1987. [Google Scholar] [CrossRef]
- Zhao, X.Y.; Wang, N.T.; Cui, B.; Yin, S.L.; Yang, X.; Meng, F.Q. Prediction of nitrogen leaching loss from summer maize production in North China. Chin. J. Eco-Agric. 2023, 31, 1439–1448. (In Chinese) [Google Scholar]
- Rahaman, M.A.; Zhang, Q.; Shi, Y.; Zhan, X.; Li, G. Biogas slurry application could potentially reduce N2O emissions and increase crop yield. Sci. Total Environ. 2021, 778, 146269. [Google Scholar] [CrossRef]
- Chastain, J.P. Ammonia Volatilization Losses during Irrigation of Liquid Animal Manure. Sustainability 2019, 11, 6168. [Google Scholar] [CrossRef]
- Verdi, L.; Kuikman, P.J.; Orlandini, S.; Mancini, M.; Napoli, M.; Dalla Marta, A. Does the use of digestate to replace mineral fertilizers have less emissions of N2O and NH3? Agric. For. Meteorol. 2019, 269–270, 112–118. [Google Scholar] [CrossRef]
- Karimi, R.; Akinremi, W.; Flaten, D. Cropping System and Type of Pig Manure Affect Nitrate-Nitrogen Leaching in a Sandy Loam Soil. J. Environ. Qual. 2017, 46, 785–792. [Google Scholar] [CrossRef] [PubMed]
- Yang, C.; Du, W.; Zhang, L.; Dong, Z.; Chen, H. Effects of Sheep Manure Combined with Chemical Fertilizers on Maize Yield and Quality and Spatial and Temporal Distribution of Soil Inorganic Nitrogen. Complexity 2021, 2021, 4330666. [Google Scholar] [CrossRef]
- Yaseen, M.; Ahmad, A.; Younas, N.; Naveed, M.; Ali, M.A.; Shah, S.S.H.; Hasnain, M.; Mustafa, A. Value-Added Fertilizers Enhanced Growth, Yield and Nutrient Use Efficiency through Reduced Ammonia Volatilization Losses under Maize-Rice Cropping Cultivation. Sustainability 2023, 15, 2021. [Google Scholar] [CrossRef]
- Wang, Z.H.; Liu, X.J.; Ju, X.T.; Zhang, F.S. Field in situ determination of ammonia volatilization from soil: Venting method. Plant Nutr. Fertil. Sci. 2002, 8, 205–209. [Google Scholar]
- Liu, H.B.; Zou, G.Y.; Fan, X.P.; Liu, S.; Ren, T.Z. Monitoring Method and Practice of Non-Point Source Pollution in Farmland; Science Press: Beijing, China, 2015; pp. 1–252. [Google Scholar]
- Gu, L.; Liu, T.; Wang, J.; Liu, P.; Dong, S.; Zhao, B.Q.; So, H.-B.; Zhang, J.; Zhao, B.; Juan, L. Lysimeter study of nitrogen losses and nitrogen use efficiency of northern Chinese wheat. Field Crop Res. 2016, 196, 473–474. [Google Scholar] [CrossRef]
- Du, H.Y.; Feng, J.F.; Guo, H.G.; Wang, F.; Zhang, J.Y.; Zhang, K.Q. Effects of dairy effluents irrigation on N balance in soil under winter wheat-summer maize rotation system. Trans. Chin. Soc. Agric. Eng. 2015, 31, 159–165. [Google Scholar]
- Sun, R.; Ding, J.; Li, H.; Wang, X.; Li, W.; Li, K.; Ye, X.; Sun, S. Mitigating nitrate leaching in cropland by enhancing microbial nitrate transformation through the addition of liquid biogas slurry. Agric. Ecosyst. Environ. 2023, 345, 108324. [Google Scholar] [CrossRef]
- Doyeni, M.O.; Baksinskaite, A.; Suproniene, S.; Tilvikiene, V. Effect of Animal Waste Based Digestate Fertilization on Soil Microbial Activities, Greenhouse Gas Emissions and Spring Wheat Productivity in Loam and Sandy Loam Soil. Agronomy 2021, 11, 1281. [Google Scholar] [CrossRef]
- Ten Huf, M.; Reinsch, T.; Zutz, M.; Essich, C.; Ruser, R.; Buchen-Tschiskale, C.; Flessa, H.; Olfs, H.-W. Effects of Liquid Manure Application Techniques on Ammonia Emission and Winter Wheat Yield. Agronomy 2023, 13, 472. [Google Scholar] [CrossRef]
- Du, H.; Gao, W.; Li, J.; Shen, S.; Wang, F.; Fu, L.; Zhang, K. Effects of digested biogas slurry applicationmixed with irrigation water on nitrate leaching during wheat-maize rotation in the North China Plain. Agric. Water Manag. 2019, 213, 882–893. [Google Scholar] [CrossRef]
- Aronsson, H.; Liu, J.; Ekre, E.; Torstensson, G.; Salomon, E. Effects of pig and dairy slurry application on n and p leaching from crop rotations with spring cereals and forage leys. Nutr. Cycl. Agroecosystems 2014, 98, 281–293. [Google Scholar] [CrossRef]
- Li, H.; Li, D.; Xu, S.; Wang, Z.; Chen, X.; Ding, Y.; Chu, Q.; Sha, Z. Hydrothermal carbonization of biogas slurry and cattle manure into soil conditioner mitigates ammonia volatilization from paddy soil. Chemosphere 2023, 344, 140378. [Google Scholar] [CrossRef]
- Nyang’au, J.O.; Sørensen, P.; Møller, H.B. Effects of plasma treatment of digestates on pH, nitrification and nitrogen turnover during storage and after soil application. Environ. Technol. Innov. 2024, 34, 103578. [Google Scholar] [CrossRef]
- Wang, X.; Xu, S.; Wu, S.; Feng, S.; Bai, Z.; Zhuang, G.; Zhuang, X. Effect of trichoderma viride biofertilizer on ammonia volatilization from an alkaline soil in northern China. J. Environ. Sci. 2018, 66, 199–207. [Google Scholar] [CrossRef] [PubMed]
- Hansen, B.; Kristensen, E.S.; Grant, R.; Høgh-Jensen, H.; Simmelsgaard, S.E.; Olesen, J.E. Nitrogen leaching from conventional versus organic farming systems-a systems modelling approach. Eur. J. Agron. 2000, 13, 65–82. [Google Scholar] [CrossRef]
- Cheng, J.; Chen, Y.; He, T.; Liao, R.; Liu, R.; Yi, M.; Huang, L.; Yang, Z.; Fu, T.; Li, X. Soil nitrogen leaching decreases as biogas slurry DOC/N ratio increases. Appl. Soil Ecol. 2017, 111, 105–113. [Google Scholar] [CrossRef]
- Yin, G.; Wang, X.; Du, H.; Shen, S.; Liu, C.; Zhang, K.; Li, W. N2O and CO2 emissions, nitrogen use efficiency under biogas slurry irrigation: A field study of two consecutive wheat-maize rotation cycles in the North China Plain. Agric. Water Manag. 2019, 212, 232–240. [Google Scholar] [CrossRef]
- Maurer, C.; Seiler-Petzold, J.; Schulz, R.; Müller, J. Short-Term Nitrogen Uptake of Barley from Differently Processed Biogas Digestate in Pot Experiments. Energies 2019, 12, 696. [Google Scholar] [CrossRef]
- Liu, Z.; Sun, K.; Zheng, B.; Dong, Q.; Li, G.; Han, H.; Li, Z.; Ning, T. Impacts of straw, biogas slurry, manure and mineral fertilizer applications on several biochemical properties and crop yield in a wheat-maize cropping system. Plant Soil Environ. 2019, 65, 1–8. [Google Scholar] [CrossRef]
- Sherman, J.; Young, E.; Jokela, W.; Cavadini, J. Impacts of Low Disturbance Liquid Dairy Manure Incorporation on Alfalfa Yield and Fluxes of Ammonia, Nitrous Oxide, and Methane. Agriculture 2021, 11, 750. [Google Scholar] [CrossRef]
- Li, G.J.; Zhang, L.; Wu, J.L.; Wang, Z.Y.; Wang, M.; Kronzucker, H.J.; Shi, W.M. Plant iron status regulates ammonium-use efficiency through protein N-glycosylation. Plant Physiol. 2024. [Google Scholar] [CrossRef] [PubMed]


| pH | Moisture Content (%) | N (%) | NH4+-N (%) | P2O5 (%) | K2O (%) |
|---|---|---|---|---|---|
| 7.85~8.02 | 95.6~98.2 | 0.09~0.11 | 0.05~0.07 | 0.03~0.05 | 0.11~0.14 |
| Treatment | N Fertilizer kg N ha−1 | Crop N Uptake kg N ha−1 | Soil Residual N kg N ha−1 | Apparent N Loss kg N ha−1 |
|---|---|---|---|---|
| CF | 840 | 329.6 ± 16.2 a | 320.9 ± 104.1 ab | 189.5 ± 104.2 a |
| BSF | 840 | 323.9 ± 51.9 a | 280.1 ± 60.8 ab | 236.0 ± 110.3 a |
| BS | 840 | 351.3 ± 54.4 a | 266.6 ± 107.5 b | 222.1 ± 76.5 a |
| EBS | 1260 | 303.3 ± 26.7 a | 530.7 ± 204.6 a | 426.0 ± 182.4 a |
Disclaimer/Publisher’s Note: The statements, opinions and data contained in all publications are solely those of the individual author(s) and contributor(s) and not of MDPI and/or the editor(s). MDPI and/or the editor(s) disclaim responsibility for any injury to people or property resulting from any ideas, methods, instructions or products referred to in the content. |
© 2024 by the authors. Licensee MDPI, Basel, Switzerland. This article is an open access article distributed under the terms and conditions of the Creative Commons Attribution (CC BY) license (https://creativecommons.org/licenses/by/4.0/).
Share and Cite
Zhao, Z.; Fu, L.; Yao, L.; Wang, Y.; Li, Y. Replacing Chemical Fertilizer with Separated Biogas Slurry to Reduce Soil Nitrogen Loss and Increase Crop Yield—A Two-Year Field Study. Agronomy 2024, 14, 1173. https://doi.org/10.3390/agronomy14061173
Zhao Z, Fu L, Yao L, Wang Y, Li Y. Replacing Chemical Fertilizer with Separated Biogas Slurry to Reduce Soil Nitrogen Loss and Increase Crop Yield—A Two-Year Field Study. Agronomy. 2024; 14(6):1173. https://doi.org/10.3390/agronomy14061173
Chicago/Turabian StyleZhao, Zichao, Longyun Fu, Li Yao, Yanqin Wang, and Yan Li. 2024. "Replacing Chemical Fertilizer with Separated Biogas Slurry to Reduce Soil Nitrogen Loss and Increase Crop Yield—A Two-Year Field Study" Agronomy 14, no. 6: 1173. https://doi.org/10.3390/agronomy14061173
APA StyleZhao, Z., Fu, L., Yao, L., Wang, Y., & Li, Y. (2024). Replacing Chemical Fertilizer with Separated Biogas Slurry to Reduce Soil Nitrogen Loss and Increase Crop Yield—A Two-Year Field Study. Agronomy, 14(6), 1173. https://doi.org/10.3390/agronomy14061173