Abstract
Saline soils limit plant growth due to high salinity. Straw returning has proven effective in enhancing soil adaptability and agricultural stability on saline lands. This study evaluates the effects of different straw-returning methods—straw mulching (SM), straw incorporation (SI), and straw biochar (BC)—on soil nutrients, water dynamics, and salinity in a barley–cotton rotation system using field box experiments. SM improved soil water retention during barley’s jointing and heading stages, while SI was more effective in its filling and maturation stages. BC showed lesser water storage capacity. During cotton’s growth, SI enhanced early-stage water retention, and SM benefited the flowering and boll opening stages. Grey relational analysis pinpointed significant water relationships at 10 cm and 20 cm soil depths, with SM regulating water across layers. SM and BC notably reduced soil conductivity, primarily within the top 20 cm, and their effectiveness decreased with depth. SI significantly lowered soil conductivity at barley’s jointing stage. SM effectively reduced salinity at 10 cm and 20 cm soil depths, whereas BC decreased soil conductivity throughout barley’s jointing, filling, and heading stages. For cotton, SI lowered soil conductivity at the seedling and boll opening stages. SM consistently reduced salinity across all stages, and BC decreased conductivity in the top 30 cm of soil during all growth stages. Both SM and BC significantly enhanced the total nutrient availability for barley and cotton, especially improving soil organic carbon and available potassium, with BC showing notable improvements. At barley’s heading stage, SI maximized dry matter accumulation, while SM boosted accumulation in leaves, stems, and spikes during the filling and maturation stages. Straw returning increased barley yield, particularly with SM and BC, and improved water use efficiency by 11.60% and 5.74%, respectively. For cotton, straw returning significantly boosted yield and water use efficiency, especially with SI and SM treatments, enhancing the total bolls and yield. In conclusion, straw returning effectively improves saline soils, enhances fertility, boosts crop yields, and supports sustainable agriculture. These results provide a robust scientific foundation for adopting efficient soil improvement strategies on saline lands, with significant theoretical and practical implications for increasing agricultural productivity and crop resilience to salt stress.
Keywords:
saline soil; straw returning; biochar; soil water; soil salinity; soil nutrient; yield; water use efficiency 1. Introduction
The global coverage of saline soil is estimated to be approximately 8.97 × 10⁶ km2, accounting for about 6.5% of the world’s total land area and 39% of arid regions [1]. Saline soils, characterized by their high salt content and alkaline conditions, are found across the globe and significantly restrict plant growth [2]. With the world’s population increasing and arable land diminishing, the efficient utilization of saline soils for agriculture has emerged as a critical challenge [3]. Saline soils present numerous obstacles to agricultural productivity, particularly due to the detrimental impact of salinity on plant osmotic regulation, ion balance, and physiological metabolism, which in turn restricts plant growth and development [4]. The challenges are further compounded by the heterogeneous distribution of salt, poor soil structure, and suboptimal water management, making soil improvement efforts even more complex [5]. Therefore, achieving effective improvement of saline soils, with the aim of enhancing soil adaptability, increasing plant salt tolerance, and stabilizing agricultural systems, presents significant technological and managerial challenges. Among the strategies explored to overcome these challenges, straw returning has been extensively studied for its potential benefits in soil amendment.
Crop straw, an agricultural by-product, is a substantial source of matter, energy, and nutrients, rich in organic compounds including carbon, nitrogen, phosphorus, potassium, and also medium and trace elements, along with lignin and cellulose, thus representing a vital renewable resource [6]. The practice of straw returning, a principal method for enhancing the soil environment and fertility, has gained widespread acceptance in global agricultural practices [7]. Research has consistently shown that appropriate straw-returning techniques can significantly improve soil’s physical and chemical attributes, enhance nutrient accumulation, increase water retention, reduce surface soil salinity, support beneficial soil ecological processes, and consequently elevate crop yield and quality [8,9]. Straw-returning methods are varied, encompassing direct soil incorporation after crushing, surface covering, composting or manuring, and conversion into biochar. These methods differently affect soil properties, fertility, salt dynamics, crop growth, and yield [10]. For instance, a study by Paul et al. in the coastal saline-alkali soils of the Ganges Delta, India, over two years, demonstrated that straw mulching improved soil moisture in the 0–15 cm layer and significantly reduced surface soil salinity, leading to increased sunflower yields compared to plots without mulch [11]. Jin et al.’s research in the Hetao irrigation area of Inner Mongolia, which faces alternating saline and freshwater irrigation, found that straw mulching decreased water loss, enhanced soil moisture, and reduced surface salt accumulation. The straw layer effectively regulated salt distribution below it and decreased soil salt concentration in the crop’s root zone [12]. Similarly, Che et al.’s two-year study in Northeast China’s saline-alkali regions showed that straw mulching significantly reduced soil bulk density and increased levels of available phosphorus, potassium, and organic matter in highly saline-alkali soils, leading to notable improvements in rice yield compared to non-mulched fields [13]. In conclusion, the impacts of straw returning on soil moisture, salinity, nutrient levels, and crop yield are varied, with significant differences due to regional climates, soil types, crop varieties, agricultural practices, policies, and economic factors [14]. Therefore, the choice of straw-returning methods must be tailored to local conditions, enabling the selection of techniques that best suit the specific environmental and agricultural context. This adaptive approach promotes a harmonious balance between soil conservation, agricultural sustainability, and economic viability.
This research focuses on a barley–cotton rotation experiment utilizing box planting to explore the effects of different straw-returning techniques, such as straw mulching, straw incorporation, and biochar, on soil nutrients, moisture, and salinity levels within saline environments. Additionally, it examines the impact of these strategies on the growth and productivity of barley and cotton crops. Through a meticulously designed experimental approach and thorough analysis, the study aims to provide a robust scientific basis for the development of effective soil improvement interventions in saline territories. It also intends to contribute valuable insights toward the sustainable progression of agricultural practices. The outcomes of this investigation are poised to offer substantial theoretical and practical benefits for boosting agricultural output and increasing crop resilience against salinity stress.
2. Materials and Methods
2.1. Experimental Area
The study was conducted from November 2022 to October 2023 at the Agricultural Water and Hydrological Ecological Experimental Site of Yangzhou University, located in Yangzhou City, Jiangsu Province, China (32°21′ N, 119°24′ E). This site is situated in the Jianghuai Plain, an area under the influence of a subtropical monsoon climate. The climate is moderate, with an average annual air temperature of 14.8 °C and marked seasonal changes, encompassing spring, summer, autumn, and winter. Rainfall distribution throughout the year is uneven, with the region receiving an average annual precipitation of 1063 mm, approximately 70% of which occurs between April and September. The area typically enjoys 223 frost-free days per year. The distribution of precipitation, fluctuations in air temperature, and irrigation practices during the study period are depicted in Figure 1.

Figure 1.
Distribution of precipitation, air temperature fluctuations, and irrigation practices applied to the experimental crops within the study area over the course of the experimental period.
2.2. Experimental Design
The experiment was conducted using planting boxes, as depicted in Figure 2, and involved four distinct treatment approaches: (1) Straw Mulching (SM), where 350 g of crushed wheat straw was uniformly spread over the soil surface to form a mulching layer approximately 5 cm thick; (2) Straw Incorporation (SI), involving the even distribution and blending of 350 g of straw with the top 15 cm of soil; (3) Biochar (BC), where 350 g of maize straw-derived biochar was mixed into the topsoil layer; and (4) Bare Soil (BS), which served as the control with no straw application. Each treatment was replicated three times. The crops studied were barley (Hordeum vulgare L.) and cotton (Gossypium spp.). Barley was sown in early November 2022 and harvested by mid-May 2023. Cotton was transplanted in mid-June 2023 and harvested by the end of October. Since the experimental equipment for cotton followed that used for barley, both straw and biochar experienced mass changes (e.g., decomposition) during the barley experiments. Thus, it was essential to replenish these materials in the planting boxes before initiating the cotton experiments. The replenishment procedure for each treatment is as follows: For the SM treatment, the residual weight of straw in the planting boxes was assessed at the conclusion of the barley experiments, and crushed straw was added to achieve a total of 350 g. For the SI and BC treatments, soil samples were collected post-barley experiments, and the remaining quantities of straw or biochar were determined through suitable physical separation techniques, with additions made to reach 350 g. Barley was planted in two rows per box, 20 cm apart, while cotton was planted with three plants per box, also spaced 20 cm apart. The planting boxes, measuring 80 cm in length, 40 cm in width, and 52 cm in height, were made from polypropylene, chosen for its durability against sunlight and frost. To prevent root rot, a water storage chassis was installed at the bottom of each box, which also featured a waterproof plug to prevent leakage during irrigation. To reduce the direct impact of sunlight on soil temperature and potential adverse effects on crop development, the exterior of the boxes was insulated with a heat-reflective film for the duration of the experiment. The soil used was coastal saline soil, which was sieved through a 10 mm mesh and air-dried prior to use. Soil filling was methodically carried out to ensure a uniform density of approximately 1.20 g·cm−3, with the soil filled in layers, each 10 cm thick, to a total depth of 40 cm. Before the barley planting and cotton transplantation, each box was fertilized with 20 g of a specialized compound fertilizer to ensure optimal nutrient availability. During the experiment, should the soil appear exceptionally dry or the moisture content approach the wilting point, an equal amount of uniform irrigation was administered to each planting box using a watering can to ensure crop survival and the continuation of the experiment. Throughout the growth periods of both barley and cotton, consistent management practices, including spraying and weeding, were meticulously followed to maintain the integrity of the experimental conditions.
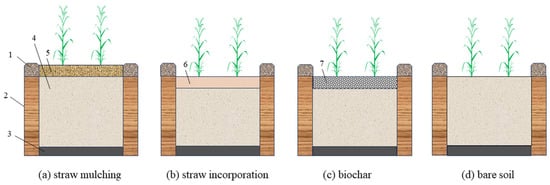
Figure 2.
Schematic diagram of different straw-returning measures. (a) straw mulching treatment; (b) straw incorporation treatment; (c) biochar application treatment; (d) treatment without straw return. Note: 1. waterproof cap; 2. box; 3. water storage chassis; 4. coastal saline soil; 5. straw mulching layer; 6. a layer of soil mixed with crushed straw; 7. a layer of soil blended with biochar.
2.3. Measurement Indicators and Methods
2.3.1. Soil Water Content
The soil water content was accurately assessed through the drying method, involving systematic collection of soil samples at depths of 10 cm, 20 cm, 30 cm, and 40 cm using a soil drill with a 25 mm inner diameter during distinct growth phases of the crops in the study. For barley, these stages included jointing, heading, filling, and maturation, whereas for cotton, they were seedling, bud, flowering, and boll opening stages. Initially, the wet weight of each soil sample was recorded, followed by oven drying at 105 °C until a constant dry weight was achieved, ensuring complete moisture removal. After weighing, the dry soil sample was immediately returned to the corresponding planting box to preserve the volume and structural integrity of the soil. This process was repeated at a regular interval of every 10 days throughout the duration of the experiment.
2.3.2. Soil Water Storage
Soil water storage (SWS, mm) quantifies the volume of water retained within a defined thickness of the soil profile. The calculation of SWS is given by the following formula [15]:
where is the volumetric water content of the i-th soil layer, expressed in cm3·cm−3, which is calculated by multiplying the soil mass water content, determined using the drying method, by the soil bulk density; n is the total number of soil layers considered in the calculation; and hi represents the thickness of the i-th soil layer, mm.
2.3.3. Soil Conductivity
Soil conductivity, an indicator of the salinity level in the soil, was assessed utilizing the Spectrum EC 450 portable conductivity meter (Spectrum Technologies Co., Ltd., Chicago, IL, USA). The measurements were conducted at four different soil depths: 10 cm, 20 cm, 30 cm, and 40 cm. To ensure a comprehensive understanding of the soil’s conductivity changes over time, these assessments were carried out at regular intervals, specifically every 10 days, during the entire observation period.
2.3.4. Soil Nutrients
Soil samples were collected from various locations using soil drills, adhering to an S-shaped pattern at the end of the growth cycles for barley and cotton. The samples were taken from two depths, 0–10 cm and 10–20 cm, and subsequently combined to form a representative composite sample for each treatment. The assessment of soil nutrients included measurements of soil organic carbon, available nitrogen, available phosphorus, and available potassium. The specific determination methods were as follows [16]:
(1) Soil organic carbon: Air-dried soil samples were weighed and transferred to a hard test tube, to which 0.1 g of silver sulfate was added. Subsequently, 5 mL of potassium dichromate standard solution and 5 mL of sulfuric acid were carefully added. The mixture was rotated and shaken gently before being heated in an oil bath pot preheated to 185–190 °C. The temperature was maintained at 170–180 °C, and the mixture was boiled for 5 min. Upon achieving an orange-yellow or yellow-green color, the mixture was cooled and transferred to a 250 mL conical flask, adjusting the volume to 60–80 mL. After adding 3–4 drops of phenanthroline indicator, the mixture was titrated with 0.2 mol·L−1 ammonium ferrous sulfate standard solution until the color transitioned from orange-yellow through blue-green to brown-red.
(2) Available nitrogen: The air-dried soil was evenly dispersed in the outer chamber of a diffusion dish and covered with a powdered ferrous sulfate reducing agent. In the inner chamber, 2 mL of 20.0 g·L−1 H3BO3 solution and one drop of nitrogen indicator were added. The edges of the outer chamber were sealed with alkaline glue, and 10 mL of NaOH solution was added. The setup was incubated at 40 °C for 24 h. The resulting blue liquid in the inner chamber was titrated with 0.01 mol·L−1 standard acid.
(3) Available phosphorus: The procedure began with placing an air-dried soil sample in a 200 mL conical flask, followed by the addition of 100 mL of sodium bicarbonate extractant. The flask was sealed and agitated on an oscillating machine for 30 min. The mixture was then filtered through filter paper into a 200 mL volumetric flask, rinsed with water, and diluted to the mark with water. The solution (5–20 mL) was transferred to a 50 mL volumetric flask, adjusted to 20 mL with water, and acidified with 1 mol·L−1 sulfuric acid until slightly yellow. After ceasing bubble formation, 5 mL of molybdenum antimony anti-coloring agent was added, the flask was filled to the mark with water, and well shaken. After resting for 30 min, absorbance was measured at a wavelength of 700 nm using a 1–2 cm absorption cell on a spectrophotometer to determine phosphorus content based on a standard curve.
(4) Available potassium: An air-dried soil sample was placed in a 200 mL conical flask, to which 50 mL of ammonium acetate extractant was added. The flask was sealed and immediately placed on an oscillating machine for 30 min. The sample was filtered through filter paper into a 100 mL volumetric flask, rinsed with ammonium acetate leaching agent, and diluted to volume with the same agent. The emission intensity was measured at a wavelength of 766.5 nm on an atomic absorption spectrophotometer under selected working conditions to derive the potassium content from the working curve.
The formula used to calculate the nutrient storage in soil (, kg·hm−2) for each nutrient was as follows [17]:
where denotes the depth of the arable layer (cm), represents the bulk density of the soil (g·cm−3), and represents the concentration of specific soil nutrients (g·kg−1).
The total available nutrient storage (, kg·hm−2) was defined as the sum of the storages of organic carbon, available nitrogen, available phosphorus, and available potassium in the soil, calculated as follows:
where , , , and represent the storages of organic carbon, available nitrogen, available phosphorus, and available potassium, respectively.
2.3.5. Crop Yield and Water Use Efficiency
During the heading, filling, and maturation stages of barley growth, five plants exhibiting uniform growth were selected for analysis. These plants were separated into stems, leaves, and spikes, which were then dried at 75 °C to ascertain the dry weight of each component. Furthermore, at the maturation stage, the total number of spikes per planting box was documented, with five spikes randomly selected from each box for further examination. The grains per spike were counted, and the average number of grains per spike for each box was determined. Additionally, the total grain weight for the selected spikes was measured, and the weight of a thousand grains was calculated.
Water use efficiency (WUE) is a vital metric that describes the efficiency of a crop’s water usage. To calculate crop water consumption and WUE throughout the growth cycle, the water balance method was utilized. The formula for calculating actual water consumption (ET, mm) and WUE (kg·mm−1∙hm−2) is provided as follows [18]:
where signifies the crop yield (kg·hm−2), represents the change in soil water storage from the beginning to the end of the growth period (mm), P is the precipitation received during the growth period (mm), I is the irrigation applied (mm), U indicates groundwater recharge (which is omitted in box planting experiments due to no recharge from groundwater), D represents deep drainage (omitted because the presence of a water storage chassis beneath the planting box allows for soil water supplementation during drought conditions without deep drainage), and R stands for surface runoff (which is also neglected owing to the planting box design preventing runoff by accommodating rainfall within the space above the soil surface).
2.4. Grey Relational Analysis
Grey relational analysis is a method designed to evaluate the relational degree (grey relational grade) among multiple factors within a system by examining the geometric relationship of their statistical sequences. The fundamental concept posits that the more similar the geometric shapes of the statistical sequence curves are, the higher the grey relational grade between the sequences, and conversely, the less similar they are, the lower the relational grade [19].
To initiate grey relational analysis, it is necessary first to define a reference sequence against which the similarity of other sequences is assessed. Let X0 = {X0(k)|k = 1, 2, …, n} represent the reference sequence, and Xi = {Xi(k)|k = 1, 2, …, n} (where i = 1, 2, …, m) denote the comparison sequences. The correlation coefficient between Xi(k) and X0(k) is calculated using the following formula:
In this equation, represents the resolution coefficient, which is typically set to 0.5. The term denotes the absolute difference between the k-th elements of x0 and xi. The expressions and indicate the two-tier minimum and maximum absolute differences across all comparisons, respectively.
Thus, the correlation coefficient between xi(k) and the corresponding x0(k) for each k within the sequence range can be expressed as follows:
After the computation of correlation coefficients, the values indicating the relational degree between each comparison sequence and the reference sequence at every point are obtained. However, when dealing with a multitude of results, the dispersion of data can make comparative analysis challenging. It becomes essential to synthesize the correlation coefficients from each point for every comparison sequence into a singular value. This aggregated value, known as the grey relational grade r (, ), simplifies the comparison between sequences by encapsulating the relational degree into a single metric, denoted as . The grey relational grade is typically calculated using the average method, represented by the following equation:
To analyze the effect of various straw-returning practices on the soil water profile characteristics, the grey relational analysis was employed to determine the grey relational grade of soil water content at different soil depths. The soil profile was divided into four distinct layers: 10 cm, 20 cm, 30 cm, and 40 cm. The soil water content at each layer is represented by X1, X2, X3, and X4, with each defined as , , , and , respectively, where n represents the total number of observations of soil water content during the crop’s growth period. The sequence representing soil water content at the 10 cm depth was chosen as the reference sequence, while those for the 20 cm, 30 cm, and 40 cm depths were used as comparison sequences. The grey relational grades obtained from these comparisons were noted as R12, R13, and R14, respectively. Similarly, the sequence for the 20 cm depth was then set as the reference sequence, with the 30 cm and 40 cm depth sequences as comparisons, resulting in grey relational grades R23 and R24. Finally, the soil water content sequence at a depth of 30 cm was identified as the reference sequence, and the sequence for the 40 cm depth was used as the comparison sequence, yielding a grey relational grade denoted as R34. This methodological approach facilitates a comprehensive evaluation of soil water dynamics under varied agricultural practices, highlighting the influence of straw returning on soil moisture across different layers.
2.5. Data Analysis
The dataset acquired from the experimental study was subjected to extensive processing and analytical procedures using a suite of software applications. For the initial data processing tasks, Microsoft Excel (2019 version, Microsoft Inc., Redwood City, WA, USA) was the tool of choice. For the creation of graphs and data visualizations, OriginPro 2022 (OriginLab Co., Northampton, MA, USA) was employed. Further statistical analyses, including variance and correlation analyses, were conducted using SPSS version 25.0 (IBM Corp., Armonk, NY, USA). To ascertain the statistical significance of differences across various experimental treatments, Duncan’s new multiple range test was applied. This statistical test is designed for conducting comparisons between multiple groups while controlling the error rate, with a predetermined significance level set at 0.05.
2.6. The Main Physicochemical Properties of the Tested Soil
Before the experiment commenced, soil samples were extracted from the untreated planting boxes using a soil auger, with samples taken from every 10 cm layer. The soil texture of the experimental soil samples was analyzed using a Beckman Coulter LS 13,320 laser particle size analyzer (Beckman Coulter, Inc., Brea, CA, USA). Other physical and chemical properties were determined according to the methods previously described. The results of these analyses are presented in Table 1.

Table 1.
Fundamental physical properties and nutrient content of the soil utilized in the experiment.
3. Results
3.1. Effects of Straw-Returning Practices on Soil Water
3.1.1. Impact of Straw Returning on Barley’s Soil Water Storage
Figure 3 demonstrates the influence of various straw-returning practices on soil water storage in barley cultivation across different growth stages. During the jointing stage (from mid-February to mid-March) and the heading stage (from mid-March to mid-April), the soil water storage at a depth of 0 to 40 cm under SM treatment showed superior levels compared to BS, SI, and BC. Specifically, during the jointing stage, the soil water storage of SM increased by 35.44 mm, 42.93 mm, and 35.59 mm compared to BS, SI, and BC, respectively. Similarly, during the heading stage, SM also exhibited increases of 27.86 mm, 1.85 mm, and 59.06 mm compared to BS, SI, and BC, respectively. A statistically significant difference was observed between SM and BS during the jointing stage (p < 0.05). In contrast, during the filling stage (from mid-April to early May) and the maturation stage (from early May to mid-May), soil water storage at a depth of 0 to 40 cm for the SI treatment was higher than that for BS, SM, and BC. Specifically, the average soil water storage for SI was higher by 32.92 mm, 29.86 mm, and 49.70 mm, respectively, when compared to BS, SM, and BC, with a significant difference noted between SI and BC during the filling stage (p < 0.05). Throughout the entire growth period, BC’s soil water storage at a depth of 0 to 40 cm was consistently lower than that of BS, SI, and SM by 16.23 mm, 37.32 mm, and 33.58 mm, respectively. The filling stage’s dry climate conditions further widened these discrepancies, resulting in a marked reduction in soil water storage across all treatments. Notably, the SI treatment demonstrated superior soil water retention capabilities at a depth of 0 to 40 cm during drought conditions, with its soil water storage being 28.40 mm higher than that of BS.
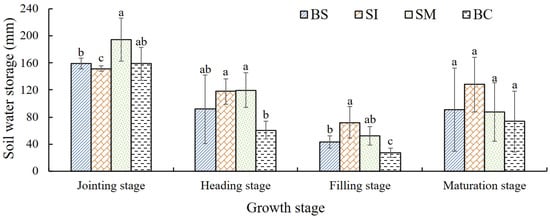
Figure 3.
Variations in soil water storage within the 0–40 cm depth layer at various growth stages of barley subjected to different straw-returning strategies. The use of distinct lowercase letters within the same growth stage indicates significant differences in soil water storage among the straw-returning treatments, as determined by Duncan’s new multiple range test, with a significance level set at p < 0.05.
3.1.2. Impact of Straw Returning on Cotton’s Soil Water Storage
Figure 4 provides insights into the effects of different straw-returning practices on soil water storage in cotton cultivation, focusing on variations within the 0–40 cm soil depth at distinct growth stages. During the early seedling stage (early July to late July) and the bud stage (early August to late August), soil water storage under SI exhibited superior levels compared to BS, SM, and BC, with increases of 29.23 mm, 15.52 mm, and 33.30 mm, respectively. There were significant differences between the BS and BC treatments and the SI treatment (p < 0.05). In the subsequent growth phases, specifically during the flower and boll stage (late August to mid-September) and the boll opening stage (late September to late October), soil water storage with the SM treatment was found to exceed that of BS, SI, and BC. The soil water storage under SM was, on average, 15.32 mm, 9.40 mm, and 33.03 mm higher, respectively, when compared to BS, SI, and BC, with a significant difference noted between SM and BC during the boll opening stage (p < 0.05). Throughout the cotton growth cycle, the soil water storage at the 0–40 cm depth for the BC treatment consistently lagged behind that of BS, SI, and SM by 10.89 mm, 28.47 mm, and 25.41 mm, respectively. Notably, the bud stage, characterized by dry conditions and a lack of rainfall, saw pronounced reductions in soil water storage across all treatments. However, the SI treatment stood out for its ability to enhance soil water retention within the 0–40 cm depth, maintaining soil water storage that was 38.32 mm higher than BS.
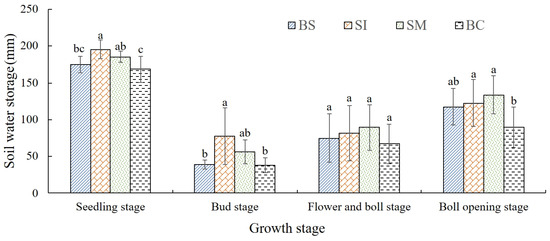
Figure 4.
Variations in soil water storage within the 0–40 cm depth across different growth stages of cotton under assorted straw-returning practices. The use of distinct lowercase letters at each growth stage highlights the significant differences in soil water storage among the straw-returning treatments, as established by Duncan’s new multiple range test, with a significance level of p < 0.05.
3.1.3. Grey Relational Analysis of Soil Water across Soil Layers under Different Straw-Returning Measures
Table 2 presents the outcomes of a grey relational analysis, which evaluates the soil water content relationships across various soil layers under different straw-returning practices. The analysis reveals a pattern where SI, SM, and BC demonstrate similar trends. A notable observation is the strongest correlation between the soil water contents at the 10 cm and 20 cm depths, indicating that water in the 20 cm layer predominantly originates from seepage from the 10 cm layer. This suggests that the seepage enhanced by precipitation from the 10 cm layer can directly infiltrate the 20 cm layer, whereas only a minimal portion reaches the deeper 30 cm and 40 cm layers. Moreover, the analysis indicates that the correlation between soil water content at the 20 cm and 30 cm depths is stronger than that between the 10 cm and 40 cm layers. This finding suggests that water in the 40 cm layer is largely sourced from secondary seepage from the 20 cm and 30 cm layers, with additional contributions from the 10 cm layer. Water present in the 10 cm soil layer is initially absorbed and utilized by the subsequent 20 cm and 30 cm layers. The most pronounced similarity in trends of soil water variation between the 10 cm and 20 cm layers was observed under various straw-returning measures. When comparing the efficiency of straw-returning measures horizontally, under barley cultivation, SM exhibited the most favorable outcomes, followed by BC, with BS and SI being less effective. Conversely, under cotton cultivation, SI proved to be the most effective, followed by BC and SM, with BS being the least effective. This indicates that the effectiveness of straw-returning measures on soil water replenishment from the 10 cm to the 20 cm layer varies under the same crop conditions. Additionally, the efficiency of soil water replenishment from the 10 cm to the 20 cm layer differs under the same straw-returning measure but under different crop conditions. The degree of correlation in soil water variation trends between other soil layers was generally weaker than between the 10 cm and 20 cm layers. However, SM showed a better correlation, followed by BC and SI, with BS exhibiting the weakest correlation. This suggests that compared to the absence of straw returning, the application of straw mulching significantly enhances the regulation of soil moisture, leading to a more evenly distributed vertical trend of soil water changes.
Table 2.
Grey relational grade of soil water at various depths under different straw-returning measures.
3.2. Effects of Various Straw-Returning Measures on Soil Conductivity
The influence of different straw-returning strategies on soil conductivity was observed to vary across soil depths, leading to distinct salt suppression effects within each soil layer, as depicted in Figure 5 and Figure 6. Among the evaluated strategies, SM and BC treatments demonstrated a marked reduction in soil conductivity in the 0–40 cm soil layer, with the effect being particularly pronounced in the 0–20 cm layer. This indicates a significant inhibitory impact on salt levels in saline soils. Furthermore, the extent of conductivity reduction differed among soil layers, following a decreasing trend from the surface downward: 10 cm > 20 cm > 30 cm > 40 cm. Therefore, the effectiveness of the soil salt suppression diminished progressively with increasing depth.

Figure 5.
Dynamic changes in soil conductivity at soil layers of (A) 0−10 cm, (B) 10−20 cm, (C) 20−30 cm, and (D) 30−40 cm during the barley growth period under different straw-returning measures. Within the same growth stage, distinct lowercase letters indicate significant differences in soil conductivity among the straw-returning treatments, as established by Duncan’s new multiple range test (p < 0.05).
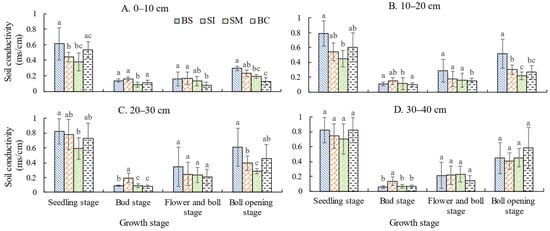
Figure 6.
Dynamic changes in soil conductivity at soil layers of (A) 0−10 cm, (B) 10−20 cm, (C) 20−30 cm, and (D) 30−40 cm under different straw-returning measures during the cotton growth period. Distinct lowercase letters within the same growth stage denote significant differences in soil conductivity among the treatments, as determined by Duncan’s new multiple range test (p < 0.05).
During the growth periods of barley and cotton, significant differences in soil conductivity were observed at various soil depths under different straw-returning measures, as illustrated in Figure 5 and Figure 6. Notably, throughout the barley growth period, soil conductivity at the 10 cm depth remained consistently lower than at the 30 cm and 40 cm depths for all treatments (Figure 5). Additionally, at the depths of 10 cm, 20 cm, 30 cm, and 40 cm, the soil conductivity levels under SI, SM, and BC treatments during the jointing stage were found to be lower than those under the BS treatment (Figure 5). Similarly, during the cotton growth period, the soil conductivity levels within the 0–30 cm soil layer for SI and SM treatments were lower than those observed for the BS treatment (Figure 6).
During the barley growth period, within the 0–40 cm soil layer, the SI treatment resulted in an average reduction in soil conductivity of 11.13% compared to the BS treatment, with this effect being particularly pronounced at the 10 cm depth during the jointing stage (p < 0.05), as depicted in Figure 5. In the 10 and 20 cm soil layers, SM significantly reduced soil conductivity by 50.36% and 28.86%, respectively, throughout the entire growth period, with notable significance observed during the jointing stage (p < 0.05), as shown in Figure 5A,B. However, in the deeper soil layers (30–40 cm), the salt suppression effect of the SM treatment was limited, showing a tendency towards improving soil conductivity in comparison to the BS treatment, as illustrated in Figure 5C,D. Except during the filling stage, the BC treatment exhibited a consistent reduction in soil conductivity within the 0–40 cm soil layer across the other three growth stages, as shown in Figure 5. Specifically, at the depths of 10 cm, 20 cm, 30 cm, and 40 cm, soil conductivity under the BC treatment was 52.83%, 33.58%, 17.11%, and 25.18% lower than that of the BS treatment, respectively, according to Figure 5.
During the cotton growth period, within the 0–40 cm soil layer, the SI treatment resulted in a reduction of soil conductivity by an average of 17.56% and 28.49% at the seedling and boll opening stages, respectively, compared to the BS treatment, with a pronounced effect at the 10 cm depth (p < 0.05), as indicated in Figure 6. Conversely, at the bud stage, the SI treatment led to an average increase in soil conductivity within the 0–40 cm layer by 38.24% compared to the BS treatment, with significant impacts observed in the deeper soil layers (30–40 cm) (p < 0.05), as shown in Figure 6. In the soil layers at 10 cm, 20 cm, and 30 cm depths, SM decreased soil conductivity by 34.68%, 44.73%, and 35.28%, respectively, throughout the entire growth period, achieving significance at the seedling stage, bud stage, and boll opening stage (p < 0.05), as depicted in Figure 6A–C. However, the salt suppression effect of the SM treatment was minimal in the 40 cm soil layer (Figure 6D). Excluding the seedling stage, the SM treatment slightly improved soil conductivity compared to the BS treatment during the other three growth stages (Figure 6D). Except for the 40 cm soil layer, the BC treatment consistently reduced soil conductivity within the 0–30 cm layer across all four growth stages, as shown in Figure 6A–C. Specifically, at the depths of 10 cm, 20 cm, and 30 cm, soil conductivity under the BC treatment was 29.39%, 34.01%, and 21.14% lower than that of the BS treatment, respectively (Figure 6A–C).
3.3. Effects of Various Straw-Returning Measures on Soil Nutrients
The implementation of diverse straw-returning measures resulted in marked changes in soil nutrient content, substantially affecting the soil’s nutrient storage capacity (see Table 3). In the context of barley cultivation, compared to the BS treatment, SM and BC treatments resulted in an enhancement of total effective nutrient storage capacity by 8.14% and 19.22%, respectively. Similarly, under cotton cultivation conditions, SI and BC treatments led to increases in total effective nutrient storage capacity by 2.58% and 5.71%, respectively, relative to the BS treatment. An analysis of the storage capacity for nitrogen, phosphorus, and potassium in the plough layer under barley cultivation revealed that various straw-returning measures had a negligible impact on available nitrogen and phosphorus but significantly influenced organic carbon and available potassium. Under barley cultivation conditions, both the SM and BC treatments augmented the storage capacity for soil organic carbon and available potassium in the plough layer in comparison to the BS treatment, with the BC treatment showing the most substantial increase. Specifically, the BC treatment enhanced the storage capacity for organic carbon and available potassium by 19.89% and 6.16%, respectively, compared to the BS treatment. Under cotton cultivation conditions, different straw-returning measures significantly affected soil organic carbon, available phosphorus, and available potassium. Relative to the BS treatment, the SI treatment led to an increase of 2.74% in soil organic carbon and 14.15% in available phosphorus content. Furthermore, the SM treatment showed increases of 17.44%, 17.62%, and 9.97% in available nitrogen, phosphorus, and potassium, respectively, compared to the BS treatment, with significant differences observed in the nitrogen and potassium levels (p < 0.05). Compared to BS, the BC treatment significantly enhanced organic carbon, available phosphorus, and available potassium by 5.73%, 63.59%, and 3.33%, respectively (p < 0.05).
Table 3.
Soil nutrient storage under various straw-returning measures.
3.4. Effects of Different Straw-Returning Measures on Dry Matter Accumulation, Yield, and Water Use Efficiency of Barley and Cotton
3.4.1. Dry Matter Accumulation of Barley at Various Growth Stages under Different Straw-Returning Measures
Table 4 presents the dry matter accumulation in barley at different growth stages under various straw-returning measures. The data show that the total dry matter in barley gradually increased until reaching a certain threshold, after which it stabilized from the heading stage through the filling stage and onto the maturation stage. The transition from the heading stage to the filling stage was marked by predominant vegetative growth, leading to the most significant rate of increase in total dry matter accumulation. In contrast, the period from the filling stage to the maturation stage was characterized by a shift towards reproductive growth, resulting in the reallocation of dry matter from stems to spikes. At the heading stage, an analysis of dry matter distribution among different plant organs revealed that stems constituted a larger fraction of the total dry matter than leaves, accounting for 59.27% and 40.73%, respectively. During the filling stage, stems remained the dominant component, constituting 56.1% of the total dry matter, followed by spikes at 29.0% and leaves at 14.9%. By the maturation stage, however, spikes had surpassed stems in dry matter accumulation, representing 54.65% of the total, compared to stems at 45.35%.
Table 4.
Dry matter (g) of barley organs at various growth stages under different straw-returning measures.
The total dry matter accumulation under different straw-returning measures demonstrated the following pattern: at the heading stage, SI > BS > BC > SM; at the filling stage, SM > BC > BS > SI; and at the maturation stage, SM > SI > BC > BS, as detailed in Table 4. The variations in dry matter accumulation at the heading and filling stages among the different straw-returning measures were primarily attributable to differences in leaf dry matter. At the heading stage, the leaf dry weight under the SM treatment exhibited increases of 12.43%, 33.33%, and 11.23% compared to the BS, SI, and BC treatments, respectively. Similarly, during the filling stage, the leaf dry weight under the SM treatment showed enhancements of 12.67% and 43.2% relative to the BS and SI treatments. Additionally, at this stage, the stem dry weight under SM treatment recorded increases of 19.09%, 20.18%, and 21.52% compared to the BS, SI, and BC treatments, respectively, with spike dry weight also increasing by 7.76%, 7.29%, and 3.34% against these treatments. At the maturation stage, the stem dry weight under the SM treatment demonstrated significant increases of 33.85%, 29.81%, and 26.26% compared to the BS, SI, and BC treatments, respectively. Furthermore, the spike dry weight under SM showed notable enhancements of 26.85%, 8.56%, and 26.62% in comparison to the respective treatments.
3.4.2. Yield and Water Use Efficiency of Barley and Cotton under Different Straw-Returning Measures
The variation in soil water and salt distribution, along with nutrient status across different straw-returning measures, significantly influenced the yield and water use efficiency of barley. Data from Table 5 highlight that various straw-returning strategies contributed to an increase in crop yield, with notable differences observed in the number of grains per plant, the thousand-grain weight, and overall yield across treatments. Relative to the BS treatment, the number of grains per plant saw an increase of 6.01% under the SM treatment. Similarly, the thousand-grain weight was elevated by 6.10% with SI and by 0.27% with SM treatment. Furthermore, the overall yield was enhanced by 4.22% and 4.69% with the SM and BC treatments, respectively. An analysis of barley yield and water use efficiency across the different straw-returning measures demonstrated that both the SM and BC treatments resulted in higher barley yields and water use efficiency compared to the BS treatment. Specifically, the SM and BC treatments led to yield increases of 4.22% and 4.69%, respectively, and improvements in water use efficiency of 11.60% and 5.74%, respectively, when compared to the BS treatment.
Table 5.
Barley yield, its constituent factors, and water use efficiency under different straw-returning measures.
From the data presented in Table 6, it is clear that different straw-returning measures have a significant impact on cotton yield and water use efficiency. The total number of cotton bolls for the SI and SM treatments was significantly higher than that observed in the BS treatment, with increases of 2.31% and 13.87%, respectively. Furthermore, both the seed cotton yield and lint yield exhibited the trend of SM > SI > BC > BS. Specifically, the seed cotton yield from the SI, SM, and BC treatments was higher than that of the BS treatment by 23.75%, 24.51%, and 2.99%, respectively. An analysis of water use efficiency revealed that the SI, SM, and BC treatments achieved higher water use efficiency compared to the BS treatment, with increments of 22.63%, 25.86%, and 0.98%, respectively, relative to the BS treatment.
Table 6.
Cotton yield, its constituent factors, and water use efficiency under different straw-returning measures.
4. Discussion
4.1. Effects of Straw-Returning Measures on Soil Water Status
Soil water is critical for crop growth, especially during periods of low rainfall and high evaporation rates. Effective management of soil water is crucial for maximizing crop yields. In agricultural settings, evaporation of soil water is a major route of water loss, highlighting the importance of strategies that reduce ineffective water usage, minimize soil evaporation, and enhance soil water retention for the benefit of crop development. This study corroborates the beneficial impacts of straw mulching on increasing soil water storage and managing the moisture levels of deeper soil layers, aligning with findings from previous research [20,21,22]. Several mechanisms underlie this effect. First, the straw cover provides shade over the soil surface, reducing the impact of direct sunlight and lowering the temperature at the soil surface, which slows down the rate of water evaporation [23]. Additionally, the presence of straw mulch reduces wind speed at the soil surface, diminishing the wind’s capacity to carry water away and thus decreasing the loss of surface water [24]. The mulch layer also acts as a barrier that retains water, directly inhibiting the evaporation of soil water into the atmosphere. Moreover, the structure created by the straw mulch enhances the soil’s ability to absorb rainfall, extending the period of soil–water contact and encouraging more efficient infiltration of rainwater into the soil profile, as opposed to quick runoff [25]. As a result, straw mulching improves the soil water regime by controlling crop evaporation rates and enhancing rainwater infiltration, ultimately supporting better crop growth and increased yields.
The study highlights the beneficial effects of incorporating straw into the soil, notably in maintaining soil moisture levels during the seedling and bud stages of cotton growth. The observed enhancement in soil water may be attributed to the increased rainfall recorded from July to August 2023, as illustrated in Figure 1. Integrating crushed straw into the soil improves the soil structure and increases its porosity, which allows for deeper penetration of rainwater into the soil layers rather than accumulation at the surface, thereby boosting soil water content. Additionally, the inherent water-absorbing properties of straw play a crucial role in retaining water, especially during periods of heavy rainfall, thus preventing excessive drainage. Contrary to common beliefs, however, the study reveals that the application of biochar may reduce soil water retention capacity, challenging the prevailing notion that biochar generally enhances the soil’s ability to hold water (as shown in Figure 3 and Figure 4). This discrepancy might be explained by the addition of biochar potentially increasing soil water repellency, attributed to the presence of hydrophobic groups within its organic matter, which diminishes its water retention effectiveness [26]. This water repellency becomes apparent when water forms as liquid droplets on the surface of soil containing biochar, obstructing long-term infiltration and facilitating the evaporation of surface water. Moreover, biochar’s dark color may lead to increased soil heat absorption and decreased surface reflectance, which elevates soil temperature and accelerates the evaporation of soil water, resulting in reduced soil moisture levels [27].
4.2. Impact of Straw-Returning Measures on Soil Conductivity
Soil conductivity, which reflects the concentration of electrolytes (including salts) in the soil, serves as a key indicator of soil salinity. The presence of salt in the soil enhances its ability to conduct electricity, thus making soil conductivity a rapid and indirect method to assess soil salinity levels [28]. High electrical conductivity in the soil typically indicates a high salt concentration, while low electrical conductivity suggests lower levels of salinity [29]. Soil conductivity is a convenient and commonly used parameter for determining soil salinity, providing significant benefits for soil monitoring and management practices. Accordingly, this study evaluated the effects of various straw-returning measures on soil salinity by monitoring changes in soil conductivity.
Numerous studies have established that the use of straw mulching is an effective method for managing saline farmland, effectively inhibiting the upward migration of salt [30,31]. Our findings corroborate this, showing that both straw mulching and biochar application significantly reduce soil conductivity within the 0−40 cm soil layer, in line with previous research [32,33]. Notably, under the straw mulching treatment, soil conductivity in the 0–20 cm layer was 36% lower than in bare soil, highlighting the efficacy of straw mulching in preventing soil salt accumulation (as depicted in Figure 5 and Figure 6). This reduction can be ascribed to several mechanisms. Firstly, straw mulching helps to slow soil water evaporation, which plays a crucial role in maintaining soil moisture levels. This, in turn, limits the dissolution and upward migration of salts to the soil surface, thus slowing the process of salt concentration [34]. Additionally, in environments with high temperatures, where elevated rates of water evaporation can lead to surface salt accumulation, straw mulching acts as a barrier against direct sunlight and moderates soil temperature, thereby reducing water evaporation and subsequent salt buildup [35]. In conclusion, straw mulching is proven to be an effective strategy for reducing soil salt accumulation in the topsoil by maintaining soil water and moderating soil temperatures.
This study shows that the application of biochar exhibits a notable effect in inhibiting soil salinity during the growth period of the two crops, as illustrated in Figure 5 and Figure 6. This salt inhibition effect of biochar can be attributed to two main factors. Firstly, the surface of biochar is characterized by a porous structure that is capable of adsorbing salts from the soil, including those dissolved in water. This adsorption capacity effectively sequesters salts on the biochar’s surface, thus mitigating their impact on the soil [5]. Secondly, the addition of biochar to soil can influence soil pH levels. In the case of alkaline soils, biochar can counteract the effects of alkaline salts, thereby improving soil suitability for crop growth [36]. Conversely, the study noted that straw incorporation had a strong inhibitory effect on surface soil salinity (0–10 cm), but this effect was less pronounced in deeper soil layers (30–40 cm), as depicted in Figure 5A,D and Figure 6A,D. This variation in the effectiveness of straw incorporation against soil salinity could be due to the distribution of straw predominantly within the upper soil layer (0–15 cm), leading to a more significant inhibitory effect on salinity in these superficial layers compared to the deeper ones. Moreover, as straw gradually decomposes, it releases organic matter and nutrients into the soil. This decomposition process, which may proceed more swiftly in the upper soil layers, increases the organic matter content there, potentially reducing the salinity impact. However, in deeper soil layers, the decomposition rate of organic material might be slower, resulting in a less effective inhibitory effect on salinity [37].
4.3. Impacts of Straw-Returning Measures on Soil Nutrients
Soil nutrients, including vital elements necessary for plant growth, are foundational for successful crop production. The content of these nutrients in the soil is a key indicator of soil fertility and the health of the farmland ecosystem [38,39]. Crop straw, which is rich in essential nutrients such as carbon, nitrogen, phosphorus, and potassium, plays a crucial role as a source of soil nutrients. Returning straw to the soil acts as a natural supplement, replenishing the nutrients that crops absorb and those lost through soil erosion. This practice not only enhances the fertility of the soil but also contributes to the prevention of soil degradation, supporting sustainable agricultural practices and ensuring the long-term viability of farmland ecosystems [40,41].
The outcomes of this investigation highlight the profound influence of various straw-returning practices, including straw mulching, straw incorporation, and the application of biochar, on enhancing soil levels of carbon, nitrogen, phosphorus, and potassium, as documented in Table 3. The improvement in soil nutrient levels is attributed to the addition of rich mineral nutrients and organic matter through these straw-returning measures, which directly improve soil nutrient content [42]. Incorporating straw and biochar into the soil, both rich sources of organic carbon, can significantly increase the levels of soil organic matter. The addition of biochar and straw introduces a surge in bioavailable carbon content, fueling the energy requirements of soil heterotrophic microorganisms and enhancing the process of nitrogen mineralization [43]. Furthermore, the high phosphorus content found in both biochar and straw boosts the available phosphorus levels in the soil. The potassium salts contained in the ash of biochar also contribute to increased nutrient availability, thereby raising soil potassium levels and improving the efficiency of organic matter conversion [44]. Therefore, the strategic application of straw and biochar not only enriches the soil with organic carbon but also increases the availability of nitrogen, phosphorus, and potassium, thereby enhancing soil fertility and promoting healthier crop growth.
Overall, all straw-returning practices demonstrate potential in enhancing soil nutrient content and fertility to various degrees, with the process of straw carbonization (biochar application) producing the most notable effects in terms of soil nutrient accumulation, aligning with findings from numerous prior studies [9,45,46]. Biochar acts as an effective soil amendment that increases the carbon stock and overall soil fertility, as well as boosting the levels of soil organic matter. Additionally, the application of biochar enhances the soil’s cation exchange capacity and surface area, which improves the adsorption of essential nutrient elements such as nitrogen, phosphorus, and potassium, thereby increasing the effectiveness of soil nutrients [47]. Meanwhile, straw mulching and straw incorporation also contribute to the enhancement of soil nutrients, promoting the accumulation of essential nutrients, though these effects are somewhat less pronounced compared to the impact of biochar application (as noted in Table 3). This difference can be attributed to the fact that the organic matter and nutrients contained within straw need to undergo decomposition and microbial processing before they become available to plants. This decomposition process is gradual and occurs at a relatively slow rate. Furthermore, during the decomposition of straw, the carbon properties are not as beneficial compared to those of biochar [48]. Therefore, the impact of biochar on soil nutrient enhancement is more significant due to its ability to steadily release nutrients over a prolonged period, offering a sustained improvement in soil fertility and nutrient availability.
4.4. Effects of Straw-Returning Measures on Dry Matter Accumulation and Yield of Crops
At the heart of attaining high crop yields is the capacity for substantial dry matter production, which is fundamentally linked to the uptake of nutrients [49]. In the context of barley production, the accumulation of dry matter is a crucial determinant of barley yield formation, with observations indicating that grain yield tends to augment as dry matter accumulation increases within a certain threshold [50,51]. Therefore, enhancing dry matter accumulation through strategic straw-returning practices is identified as a key method for achieving higher yields. These practices, by enriching the soil with necessary nutrients and improving soil physical properties, can significantly contribute to the increase in biomass and, subsequently, the overall yield of the crop.
In this study, straw mulching, straw incorporation, and the application of biochar were all found to have positive effects on the accumulation of dry matter in barley across different growth stages. Particularly, the treatment involving straw mulching stood out for its enhanced accumulation of leaf and stem dry matter at all growth stages, with the most notable impact observed at the maturation stage (as shown in Table 4). This effect can be traced back to several underlying mechanisms. First, the practice of returning straw to the field is instrumental in improving the soil structure of saline soils, which in turn enhances soil permeability. This improvement facilitates water infiltration and helps to prevent the accumulation of salt [52]. Additionally, straw returning plays a crucial role in regulating soil water by maintaining optimal moisture levels, thus creating favorable conditions for crop growth [53]. Beyond its impact on soil water and structure, straw returning enriches the soil with a significant amount of organic matter, including carbon, nitrogen, and other vital nutrients. The decomposition of these organic components within the soil releases nutrients that are readily available for crop uptake, further stimulating the activity of soil microbes. The resultant increase in soil organic matter leads to the development of richer, more fertile soil, ultimately supporting enhanced crop growth and the accumulation of dry matter [54].
Various straw-returning techniques significantly impact crop yields. Compared to the BS treatment, the SM and BC treatments led to an increase in barley yield, as detailed in Table 5. This increase is largely due to the comprehensive benefits provided by straw mulching, which improves the growth conditions in saline soils. These benefits encompass enhanced soil structure, optimal soil water maintenance, reduced salinity, and an increased supply of organic matter. Together, these factors support the normal growth and dry matter accumulation in barley, ultimately boosting its yield [55]. Similarly, the application of biochar creates a more favorable growth environment by adsorbing salts, improving soil structure, and increasing soil fertility, thereby supporting higher yields of barley in saline conditions [56]. For cotton, the SI and SM treatments significantly increased the total number of bolls, seed cotton yield, and water use efficiency, as indicated in Table 6. These improvements are attributed to the capacity of straw-returning measures to reduce water evaporation, conserve soil water, relieve salt stress, enhance soil structure, deter weed growth, and enrich the soil, thereby improving water use efficiency and boosting seed cotton yield in saline soils [57]. Furthermore, incorporating crushed straw into the soil boosts soil organic matter, enhances soil structure, promotes soil improvement, slows salt accumulation, and provides essential nutrients for crop growth. This comprehensive soil quality enhancement contributes to improved seed cotton yield and water use efficiency [34].
5. Conclusions
(1) Various straw-returning methods significantly influenced soil moisture levels in barley and cotton crops. Specifically, during the growth stages of barley, SM was particularly effective in retaining water at the jointing and heading stages, whereas SI proved more efficient during the filling and maturation stages. In contrast, BC exhibited poor soil water retention across all stages. For cotton, SI demonstrated greater soil water retention during the seedling and bud stages, while SM was more effective during the flowering and boll opening stages. BC consistently showed low soil water storage capacity. Grey relational analysis underscored a strong relationship between soil water at the 10 cm and 20 cm depths, revealing varying trends among the different treatments. Straw-returning methods significantly affected water supply capacities in the 10 cm to 20 cm soil layers under different crop conditions, with SM exhibiting superior regulatory effects, despite weaker correlations in other soil layers.
(2) The study observed considerable differences in the effectiveness of various straw-returning methods in mitigating salt presence in saline soils. The SM and BC treatments significantly lowered soil conductivity within the 0–40 cm soil layer, particularly within the 0–20 cm depth range, with the degree of conductivity reduction diminishing with increased soil depth. During the growth of barley, the SI treatment was particularly effective in reducing soil conductivity at the jointing stage, while the SM treatment demonstrated significant salt suppression at the 10 cm and 20 cm depths. The BC treatment was effective in lowering soil conductivity during the jointing, filling, and heading stages. In the growth stages of cotton, the SI treatment was effective in limiting soil conductivity during the seedling and boll opening stages but led to an increase during the bud stage. The SM treatment displayed consistent salt inhibition effects across all stages, whereas the BC treatment effectively reduced soil conductivity within the 0–30 cm depth range throughout the growth stages.
(3) The implementation of various straw-returning methods had a profound effect on soil nutrient content and storage during the cultivation of both barley and cotton. Notably, the SM and BC treatments resulted in significant increases in total effective nutrient storage capacity, showing enhancements of 8.14% and 19.22% for barley and 2.58% and 5.71% for cotton, respectively. The BC treatment, in particular, had a remarkable effect on the storage of soil organic carbon and available potassium. The response to straw-returning practices varied between crops. Overall, considering the broader impact, the BC treatment emerged as more beneficial in boosting total soil nutrient storage capacity, particularly in enhancing the accumulation of organic carbon and available potassium.
(4) The application of different straw-returning methods significantly influenced the accumulation of dry matter in barley across its growth stages. Specifically, the SI treatment led to the highest accumulation of dry matter during the heading stage. During the filling and maturation stages, the SM treatment notably enhanced dry matter accumulation in leaves, stems, and spikes. These straw-returning practices substantially increased barley’s yield, with the SM and BC treatments yielding increases of 4.22% and 4.69%, respectively, over the BS treatment. In terms of water use efficiency, the SM and BC treatments resulted in improvements of 11.60% and 5.74%, respectively, compared to the BS treatment. Similarly, in cotton cultivation, straw returning significantly enhanced both yield and water use efficiency, with the SI and SM treatments showing the most significant effects by increasing the total number of cotton bolls and overall yield. In summary, straw returning had a positive impact on crop yield and water use efficiency, with the SM treatment demonstrating particularly notable performance.
Author Contributions
Conceptualization, M.T.; methodology, R.L. and M.T.; software, R.L.; validation, Z.L.; formal analysis, R.L.; investigation, R.L., Z.L. and C.L.; resources, M.T., C.Z. and S.F.; data curation, Z.L. and C.L.; writing—original draft preparation, R.L.; writing—review and editing, M.T. and C.Z.; visualization, R.L.; supervision, M.T., C.Z. and S.F.; project administration, M.T. and C.Z.; funding acquisition, M.T. and C.Z. All authors have read and agreed to the published version of the manuscript.
Funding
This research was funded by the National Natural Science Foundation of China (Nos. 52209071, 52379049), the Postgraduate Research & Practice Innovation Program of Jiangsu Province (Yangzhou University) (No. SJCX23_1951, SJCX23_1945), the “Chunhui Plan” Cooperative Scientific Research Project of the Ministry of Education of China (No. HZKY20220115), the China Postdoctoral Science Foundation (Nos. 2023T160552, 2020M671623), the Natural Science Foundation of the Higher Education Institutions of Jiangsu Province (No. 21KJB210022), and the Priority Academic Program Development of Jiangsu Higher Education Institutions of China (PAPD).
Data Availability Statement
The data that support this study cannot be publicly shared due to ethical or privacy reasons and may be shared upon reasonable request to the corresponding author if appropriate.
Acknowledgments
The authors extend their heartfelt thanks to Ziang Xie and Jiying Kong for their invaluable assistance. Their contributions to setting up the experimental plot and collecting data were instrumental to the research, and the authors greatly appreciate their dedicated support.
Conflicts of Interest
The authors declare no conflicts of interest.
References
- Negacz, K.; Malek, Ž.; de Vos, A.; Vellinga, P. Saline soils worldwide: Identifying the most promising areas for saline agriculture. J. Arid Environ. 2022, 203, 104775. [Google Scholar] [CrossRef]
- Gao, G.; Yan, L.; Tong, K.; Yu, H.; Lu, M.; Wang, L.; Niu, Y. The potential and prospects of modified biochar for comprehensive management of salt-affected soils and plants: A critical review. Sci. Total Environ. 2023, 912, 169618. [Google Scholar] [CrossRef] [PubMed]
- Goswami, S.K.; Kashyap, A.S.; Kumar, R.; Gujjar, R.S.; Singh, A.; Manzar, N. Harnessing Rhizospheric Microbes for Eco-friendly and Sustainable Crop Production in Saline Environments. Curr. Microbiol. 2024, 81, 14. [Google Scholar] [CrossRef] [PubMed]
- Wang, S.; Liu, J.; Wang, Y.; Liu, Y.; Tian, C. Performance of halophytes in soil desalinization and its influencing factors: A meta-analysis. Front. Environ. Sci. 2023, 11, 1198540. [Google Scholar] [CrossRef]
- Rassaei, F. Effects of Different Rates of Sugarcane Biochar on Amelioration of Adverse Salinity Effects in Calcareous Clay Soil. Commun. Soil Sci. Plan. 2024, 55, 1349–1360. [Google Scholar] [CrossRef]
- Jing, X.; Li, Q.; Qiao, X.; Chen, J.; Cai, X. Effects of accumulated straw residues on sorption of pesticides and antibiotics in soils with maize straw return. J. Hazard. Mater. 2021, 418, 126213. [Google Scholar] [CrossRef] [PubMed]
- Li, Y.; Hu, Y.; Song, D.; Liang, S.; Qin, X.; Siddique, K.H. The effects of straw incorporation with plastic film mulch on soil properties and bacterial community structure on the loess plateau. Eur. J. Soil Sci. 2021, 72, 979–994. [Google Scholar] [CrossRef]
- Getahun, G.T.; Katterer, T.; Munkholm, L.J.; Parvage, M.M.; Keller, T.; Rychel, K.; Kirchmann, H. Short-term effects of loosening and incorporation of straw slurry into the upper subsoil on soil physical properties and crop yield. Soil Tillage Res. 2018, 184, 62–67. [Google Scholar] [CrossRef]
- Wang, X.; Jia, Z.; Liang, L.; Zhao, Y.; Yang, B.; Ding, R.; Wang, J.; Nie, J. Changes in soil characteristics and maize yield under straw returning system in dryland farming. Field Crop Res. 2018, 218, 11–17. [Google Scholar] [CrossRef]
- He, L.; Zhong, Z.; Yang, H. Effects on soil quality of biochar and straw amendment in conjunction with chemical fertilizers. J. Integr. Agric. 2017, 16, 704–712. [Google Scholar] [CrossRef]
- Paul, P.L.C.; Bell, R.W.; Barrett-Lennard, E.G.; Kabir, E. Straw mulch and irrigation affect solute potential and sunflower yield in a heavy textured soil in the Ganges Delta. Agric. Water Manag. 2020, 239, 106211. [Google Scholar] [CrossRef]
- Jin, Y.; Yang, S.; Zhang, W.; Pan, C.; Liang, Z. Effects of straw and plastic film mulching on water-salt regulation and maize yield in alternate brackish irrigation. Soil Fertil. Sci. Chin. 2020, 2, 198–205. [Google Scholar]
- Che, W.; Piao, J.; Gao, Q.; Li, X.; Li, X.; Jin, F. Response of soil physicochemical properties, soil nutrients, enzyme activity and rice yield to rice straw returning in highly saline-alkali paddy soils. J. Soil Sci. Plant Nutr. 2023, 23, 4396–4411. [Google Scholar] [CrossRef]
- Chen, L.; Sun, S.; Yao, B.; Peng, Y.; Gao, C.; Qin, T.; Zhou, Y.; Sun, C.; Quan, W. Effects of straw return and straw biochar on soil properties and crop growth: A review. Front. Plant Sci. 2022, 13, 986763. [Google Scholar] [CrossRef] [PubMed]
- Han, X.; Liu, W.; Cheng, L. Vertical distribution characteristics and temporal stability of soil water in deep profile on the Loess Tableland, Northwest China. J. Appl. Ecol. 2017, 28, 430–438. [Google Scholar]
- Bao, S. Soil Agricultural Chemistry Analysis, 3rd ed.; China Agriculture Press: Beijing, China, 2018. [Google Scholar]
- Tang, W.; Xiao, X.; Tang, H.; Zhang, H.; Chen, F.; Chen, Z.; Xue, J.; Yang, G. Effects of long-term tillage and rice straw returning on soil nutrient pools and Cd concentration. J. Appl. Ecol. 2015, 26, 168–176. [Google Scholar]
- Zhang, J.-X. Study on the Effect of Straw Mulching on Farmland Soil Water. J. Environ. Public Health 2022, 2022, 3101880. [Google Scholar] [CrossRef] [PubMed]
- Liu, Z.; Liu, S.; Fang, Z. Decision making model of grey comprehensive correlation and relative close degree based on kernel and greyness degree. Control Decis. 2017, 32, 1475–1480. [Google Scholar]
- Tang, M.; Liu, R.; Luo, Z.; Zhang, C.; Kong, J.; Feng, S. Straw Returning Measures Enhance Soil Moisture and Nutrients and Promote Cotton Growth. Agronomy 2023, 13, 1850. [Google Scholar] [CrossRef]
- Dong, F.; Yan, Q.; Wu, L.; Yang, F.; Wang, J.; Zhang, J.; Yan, S. Soil water storage and maize (Zea mays L.) yield under straw return and tillage practices. Crop Sci. 2022, 62, 382–396. [Google Scholar] [CrossRef]
- Zhang, L.; Zhao, H.; Xu, C.; Yan, W.; Sun, N.; Tan, G.; Yu, J.; Meng, X.; Li, F.; Bian, S. Effects of straw returning on soil moisture and maize yield in semi-humid area. Cereal Res. Commun. 2022, 50, 539–548. [Google Scholar] [CrossRef]
- Alhassan, A.-R.M. Impact of mulching and planting time on spring-wheat (Triticum aestivum) growth: A combined field experiment and empirical modeling approach. Open Agric. 2024, 9, 20220242. [Google Scholar] [CrossRef]
- Ma, J.; Chang, L.; Li, Y.; Lan, X.; Ji, W.; Zhang, J.; Han, F.; Cheng, H.; Chai, F.; Chai, S. Straw strip mulch improves soil moisture similar to plastic film mulch but with a higher net income. Agric. Ecosyst. Environ. 2024, 362, 108855. [Google Scholar] [CrossRef]
- Yang, Y.; Liu, H.; Wu, J.; Gao, C.; Zhang, S.; Tang, D. Long-term combined subsoiling and straw mulching conserves water and improves agricultural soil properties. Land Degrad. Dev. 2023, 35, 1050–1060. [Google Scholar] [CrossRef]
- Peng, X.; Ye, L.; Wang, C.; Zhou, H.; Sun, B. Temperature- and duration-dependent rice straw-derived biochar: Characteristics and its effects on soil properties of an Ultisol in southern China. Soil Tillage Res. 2011, 112, 159–166. [Google Scholar] [CrossRef]
- Lee, X.; Yang, F.; Xing, Y.; Huang, Y.; Xu, L.; Liu, Z.; Holtzman, R.; Kan, I.; Li, Y.; Zhang, L.; et al. Use of biochar to manage soil salts and water: Effects and mechanisms. Catena 2022, 211, 106018. [Google Scholar] [CrossRef]
- Wilczek, A.; Szyplowska, A.; Lewandowski, A.; Kafarski, M.; Szerement, J.; Skierucha, W. Soil salinity characterization based on 0.05–3 GHz dielectric permittivity measurements. In Proceedings of the 2017 IEEE MTT-S International Microwave Workshop Series on Advanced Materials and Processes for RF and THz Applications (IMWS-AMP), Pavia, Italy, 20–22 September 2017; IEEE: New York, NY, USA, 2017; pp. 1–3. [Google Scholar]
- Zhang, Y.; Jia, X.; Lai, X.; Huang, Y. Experimental study on relation between whole-salt quantity and electric conductivity. Int. J. Bioautomation 2019, 23, 97. [Google Scholar] [CrossRef]
- Zhao, Y.; Li, Y.; Wang, J.; Pang, H.; Li, Y. Buried straw layer plus plastic mulching reduces soil salinity and increases sunflower yield in saline soils. Soil Tillage Res. 2016, 155, 363–370. [Google Scholar] [CrossRef]
- Rahma, A.E.; Wang, W.; Tang, Z.; Lei, T.; Warrington, D.N.; Zhao, J. Straw mulch can induce greater soil losses from loess slopes than no mulch under extreme rainfall conditions. Agric. For. Meteorol. 2017, 232, 141–151. [Google Scholar] [CrossRef]
- Zhao, Y.; Pang, H.; Wang, J.; Huo, L.; Li, Y. Effects of straw mulch and buried straw on soil moisture and salinity in relation to sunflower growth and yield. Field Crop Res. 2014, 161, 16–25. [Google Scholar] [CrossRef]
- Liang, J.; Li, Q.; Gao, J.; Feng, J.; Zhang, X.; Wu, Y.; Yu, F. Biochar rhizosphere addition promoted Phragmites australis growth and changed soil properties in the Yellow River Delta. Sci. Total Environ. 2020, 761, 143291. [Google Scholar] [CrossRef] [PubMed]
- Li, M.; Wang, W.; Wang, X.; Yao, C.; Wang, Y.; Wang, Z.; Zhou, W.; Chen, E.; Chen, W. Effect of Straw Mulching and Deep Burial Mode on Water and Salt Transport Regularity in Saline Soils. Water 2023, 15, 3227. [Google Scholar] [CrossRef]
- Yusefi, A.; Firouzi, A.F.; Aminzadeh, M. The effects of shallow saline groundwater on evaporation, soil moisture, and temperature distribution in the presence of straw mulch. Hydrol. Res. 2020, 51, 720–738. [Google Scholar] [CrossRef]
- Khan, I.; Chen, T.; Farooq, M.; Luan, C.; Wu, Q.; Wanning, D.; Xu, S.; Li-Xue, W. The residual impact of straw mulch and biochar amendments on soil physiochemical properties and yield of maize under rainfed system. Agron. J. 2021, 113, 1102–1120. [Google Scholar] [CrossRef]
- Song, C.; Du, H. Effects of corn straw cover years on soil organic matter and compactness in typical black soil areas of Songnen Plain. Arab J. Geosci. 2023, 16, 44. [Google Scholar] [CrossRef]
- Havlin, J.; Heiniger, R. Soil fertility management for better crop production. Agronomy 2020, 10, 1349. [Google Scholar] [CrossRef]
- Brar, S.K.; Dhaliwal, S.S.; Sharma, V.; Sharma, S.; Kaur, M. Replacement of rice-wheat cropping system with alternative diversified systems concerning crop productivity and their impact on soil carbon and nutrient status in soil profile of north-west India. Cogent Food Agric. 2023, 9, 2167483. [Google Scholar] [CrossRef]
- Wang, Y.; Pang, J.; Zhang, M.; Tian, Z.; Wei, T.; Jia, Z.; Ren, X.; Zhang, P. Is adding biochar be better than crop straw for improving soil aggregates stability and organic carbon contents in film mulched fields in semiarid regions?—Evidence of 5-year field experiment. J. Environ. Manag. 2023, 338, 117711. [Google Scholar] [CrossRef] [PubMed]
- Zhu, C.; Zhong, W.; Han, C.; Deng, H.; Jiang, Y. Driving factors of soil organic carbon sequestration under straw returning across China’s uplands. J. Environ. Manag. 2023, 335, 117590. [Google Scholar] [CrossRef]
- Wang, X.; Wang, Q.; Zhang, Y.; Zhang, J.; Xia, S.; Qin, H.; Feng, C.; Bie, S. Influence of decomposition agent application and schedule in wheat straw return practice on soil quality and crop yield. Chem. Biol. Technol. Agric. 2023, 10, 8. [Google Scholar] [CrossRef]
- Pang, J.; Wang, Y.; Wang, B.; Wang, J.; Liu, E.; Gao, F.; Sun, S.; Ren, X.; Jia, Z.; Wei, T.; et al. Biochar application increases maize yield under film mulching due to higher soil organic content and soil aggregate stability in a semi-arid area. J. Soils Sediments 2023, 23, 1718–1732. [Google Scholar] [CrossRef]
- Li, Y.; Li, G. Mechanisms of straw biochar’s improvement of phosphorus bioavailability in soda saline-alkali soil. Environ. Sci. Pollut. Res. 2022, 29, 47867–47872. [Google Scholar] [CrossRef] [PubMed]
- Li, B.; Huang, W.; Elsgaard, L.; Yang, B.; Li, Z.; Yang, H.; Lu, Y. Optimal biochar amendment rate reduced the yield-scaled N2O emissions from ultisols in an intensive vegetable field in South China. Sci. Total Environ. 2020, 723, 138161. [Google Scholar] [CrossRef] [PubMed]
- Song, D.; Xi, X.; Zheng, Q.; Liang, G.; Zhou, W.; Wang, X. Soil nutrient and microbial activity responses to two years after maize straw biochar application in a calcareous soil. Ecotoxicol. Environ. Saf. 2019, 180, 348–356. [Google Scholar] [CrossRef] [PubMed]
- Nanda, S.; Dalai, A.K.; Berruti, F.; Kozinski, J.A. Biochar as an exceptional bioresource for energy, agronomy, carbon sequestration, activated carbon and specialty materials. Waste Biomass Valoriz. 2016, 7, 201–235. [Google Scholar] [CrossRef]
- Chen, X.; Tian, Y.; Guo, X.; Chen, G.; He, H.; Li, H. The effect of monoculture peanut and cassava/peanut intercropping on physical and chemical properties in peanut rhizosphere soil under the biochar application and straw mulching. IOP Conf. Ser. Earth Environ. Sci. 2017, 59, 012021. [Google Scholar] [CrossRef]
- Watt, M.S.; Clinton, P.W.; Whitehead, D.; Richardson, B.; Mason, E.G.; Leckie, A.C. Above-ground biomass accumulation and nitrogen fixation of broom (Cytisus scoparius L.) growing with juvenile Pinus radiata on a dryland site. For. Ecol. Manag. 2003, 184, 93–104. [Google Scholar] [CrossRef]
- Kaur, A. Productivity and profitability of malt barley (Hordeum vulgare) varieties at different nitrogen levels under saline water irrigation. Indian J. Agron. 2020, 65, 456–461. [Google Scholar] [CrossRef]
- Rogers, C.W.; Dari, B.; Hu, G.; Mikkelsen, R. Dry matter production, nutrient accumulation, and nutrient partitioning of barley. J. Plant Nutr. Soil Sci. 2019, 182, 367–373. [Google Scholar] [CrossRef]
- Song, X.; Sun, R.; Chen, W.; Wang, M. Effects of surface straw mulching and buried straw layer on soil water content and salinity dynamics in saline soils. Can. J. Soil Sci. 2019, 100, 58–68. [Google Scholar] [CrossRef]
- Zhang, Z.; Zhang, Z.; Feng, G.; Lu, P.; Huang, M.; Zhao, X. Biochar Amendment Combined with Straw Mulching Increases Winter Wheat Yield by Optimizing Soil Water-Salt Condition under Saline Irrigation. Agriculture 2022, 12, 1681. [Google Scholar] [CrossRef]
- Ryu, J.H.; Kang, J.G.; Kim, Y.J.; Oh, Y.Y.; Lee, S.H.; Kim, S.; Hong, H.; Kim, Y.; Kim, S.L. Effects of straw mulching on soil physicochemical properties in Saemangeum reclaimed land. Korean J. Soil Sci. Fertil. 2016, 49, 12–16. [Google Scholar] [CrossRef]
- Shan, Y.; Li, G.; Bai, Y.; Liu, H.; Zhang, J.; Wei, K.; Wang, Q.; Wu, B.; Cao, L. Effects of different improvement measures on hydrothermal carbon and cotton (Gossypium hirsutum L.) yield in saline-alkali soil. Appl. Ecol. Environ. Res. 2022, 20, 1821–1835. [Google Scholar] [CrossRef]
- Li, X.; Yao, T.; Huang, X.; Li, X.; Li, P.; Du, S.; Wang, W.; Miao, S.; Wang, D.; Jin, F.; et al. Biochar increases rice yield by improving root morphological and root physiological functions in heavily saline-sodic paddy soil of Northeast China. BioResources 2022, 17, 1241–1256. [Google Scholar] [CrossRef]
- Bezborodov, G.A.; Shadmanov, D.K.; Mirhashimov, R.T.; Yuldashev, T.; Qureshi, A.S.; Noble, A.D.; Qadir, M. Mulching and water quality effects on soil salinity and sodicity dynamics and cotton productivity in Central Asia. Agric. Ecosyst. Environ. 2010, 138, 95–102. [Google Scholar] [CrossRef]
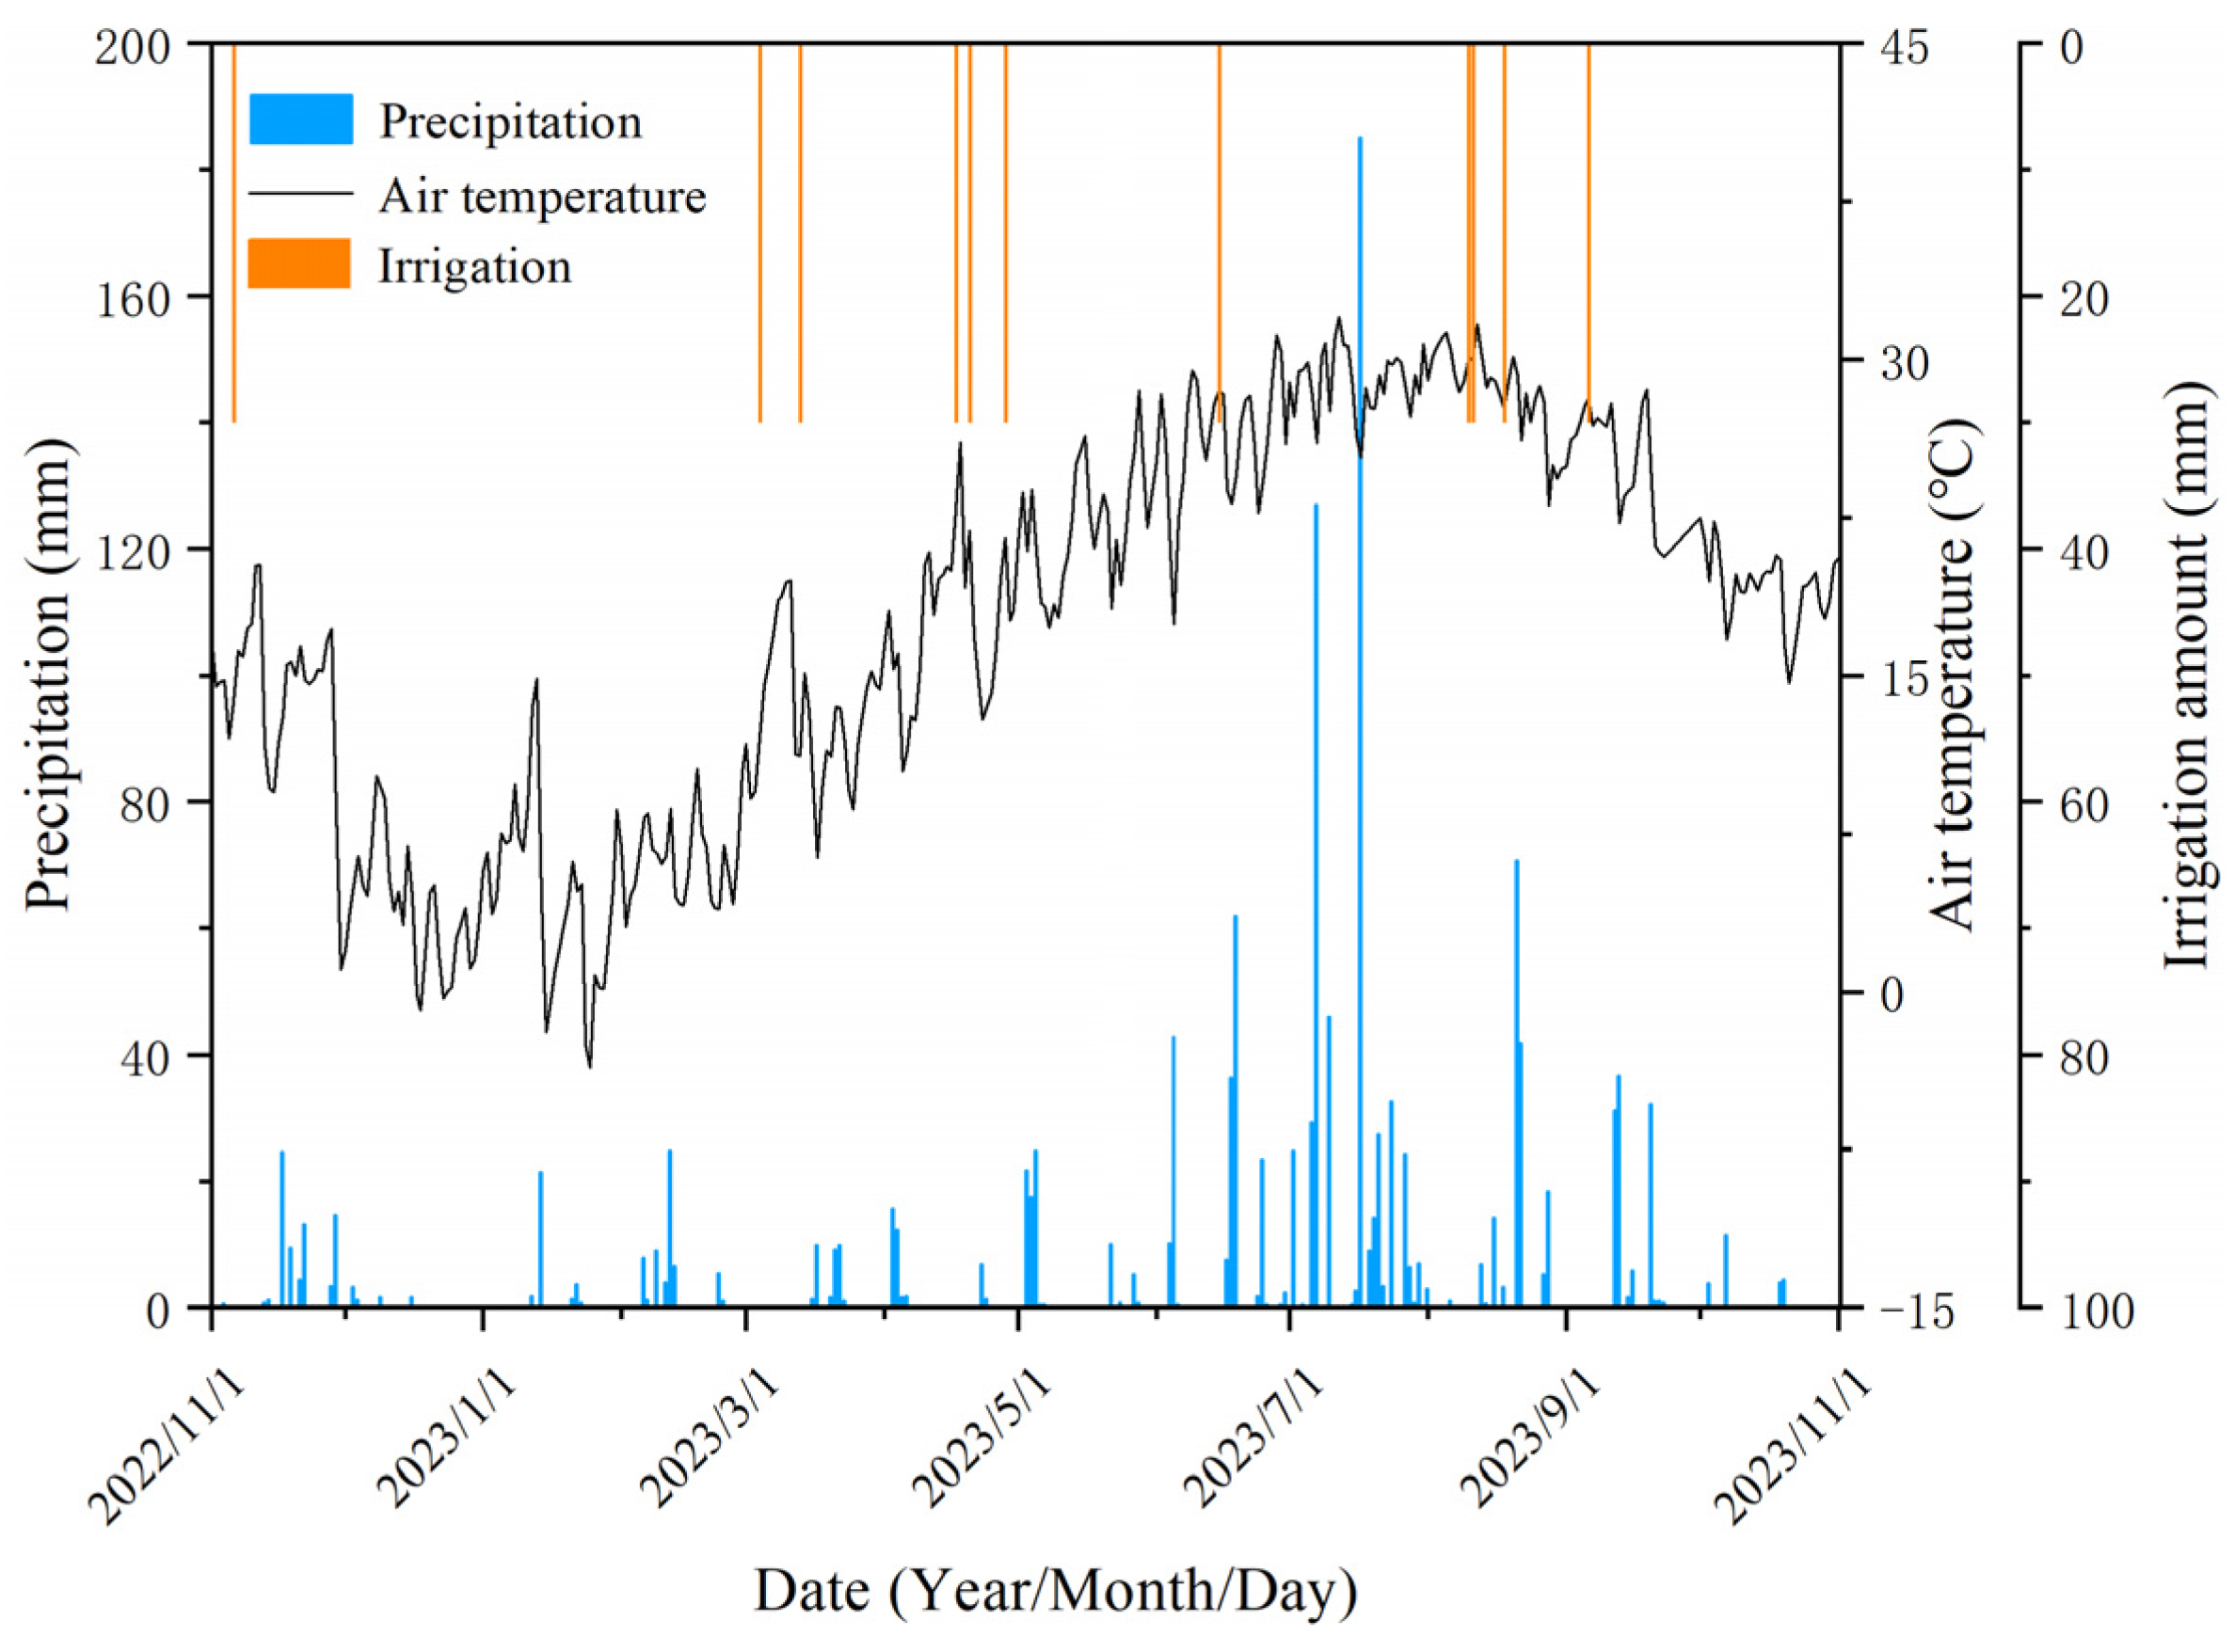


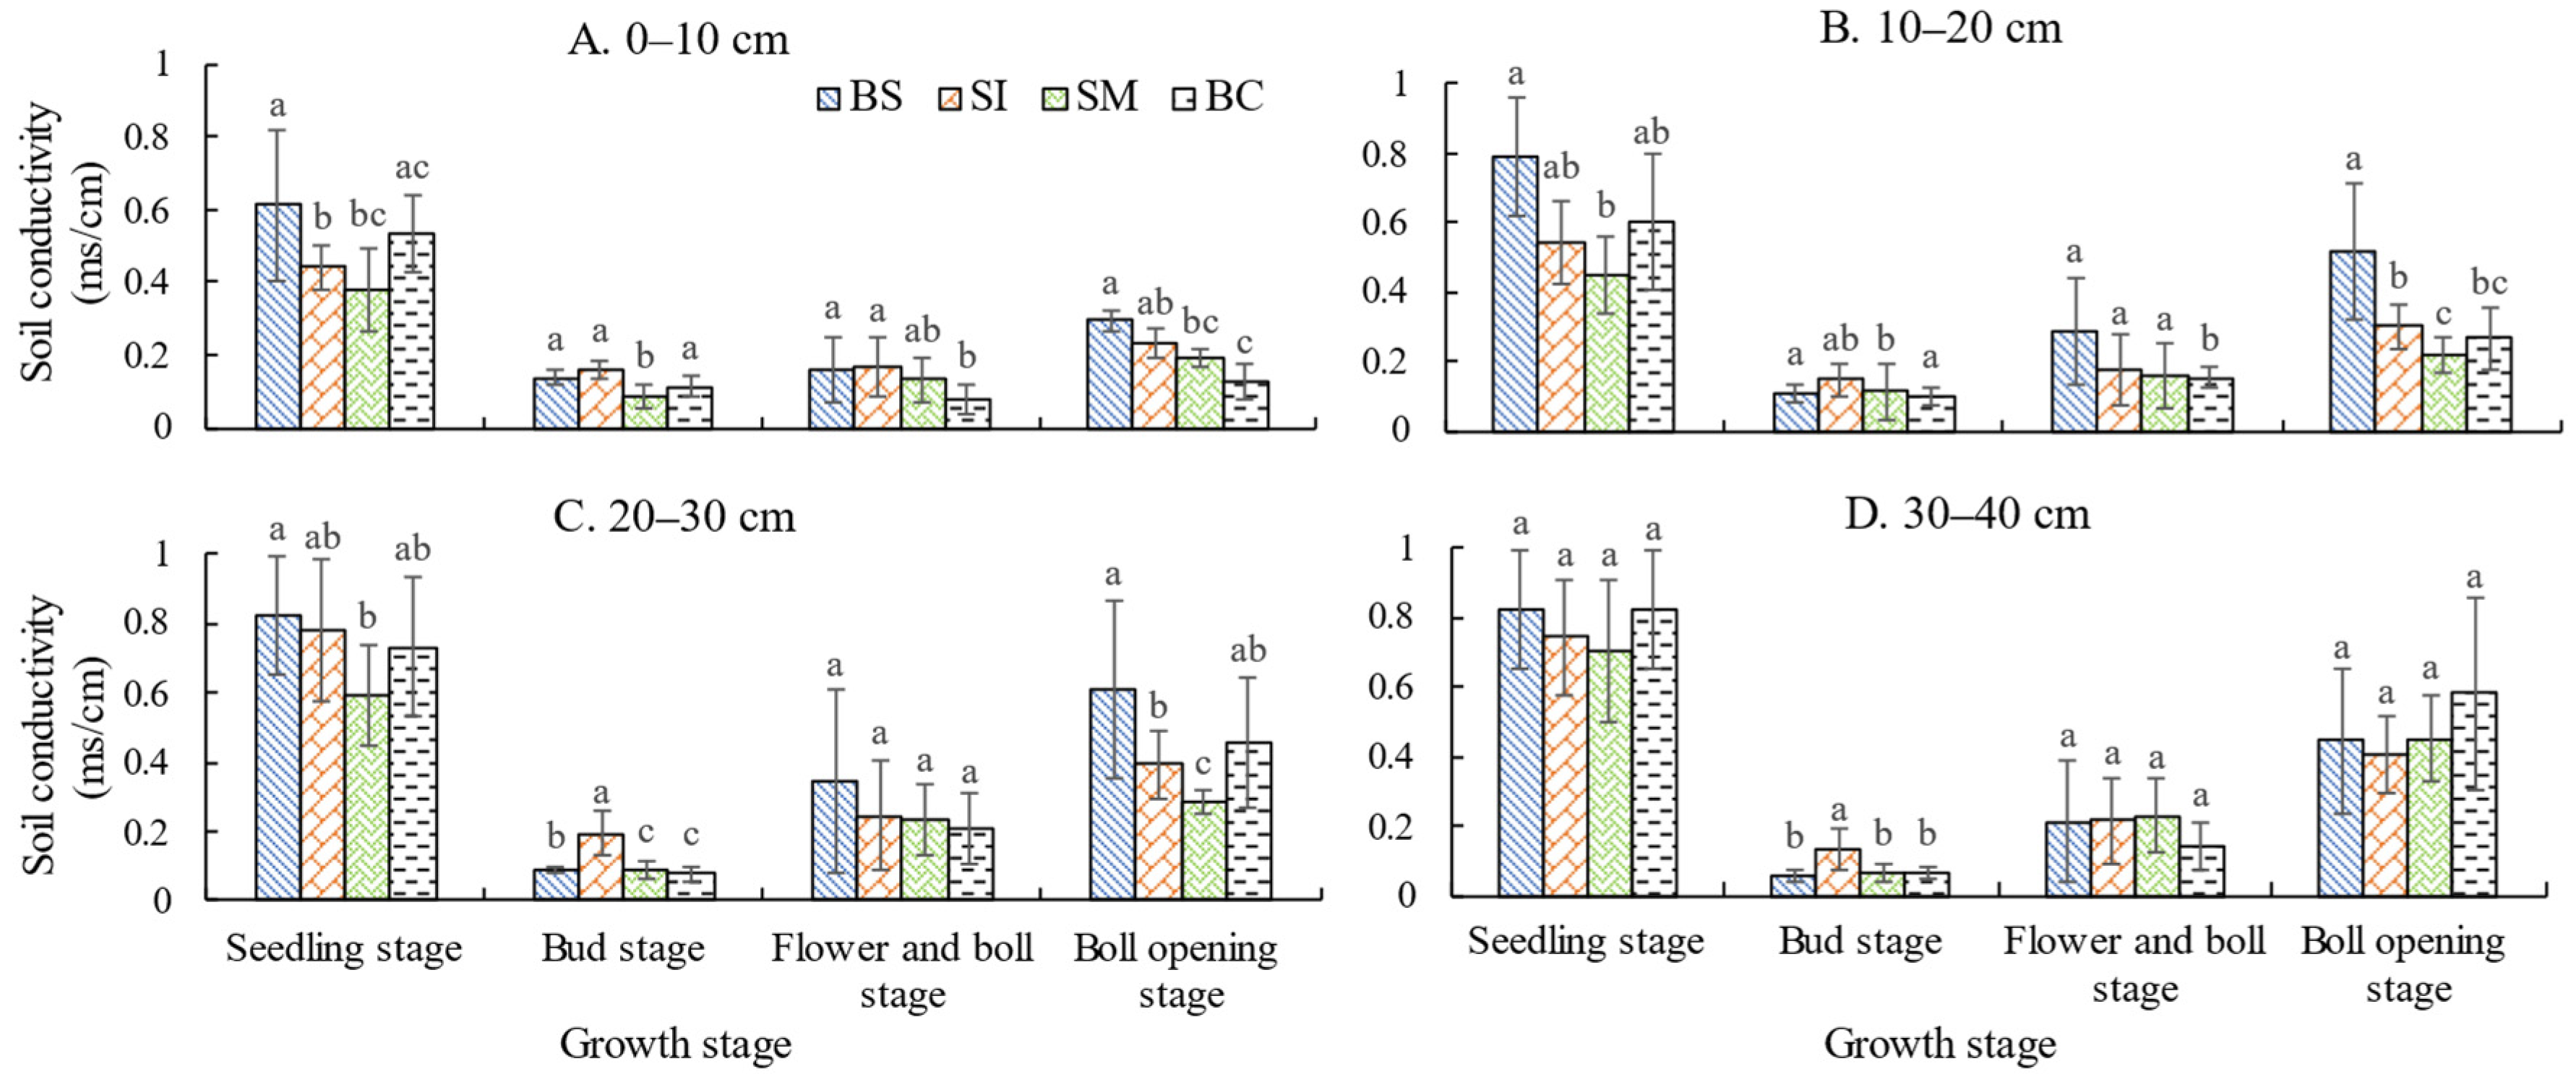
Disclaimer/Publisher’s Note: The statements, opinions and data contained in all publications are solely those of the individual author(s) and contributor(s) and not of MDPI and/or the editor(s). MDPI and/or the editor(s) disclaim responsibility for any injury to people or property resulting from any ideas, methods, instructions or products referred to in the content. |
© 2024 by the authors. Licensee MDPI, Basel, Switzerland. This article is an open access article distributed under the terms and conditions of the Creative Commons Attribution (CC BY) license (https://creativecommons.org/licenses/by/4.0/).