Article

Genome-Wide Association Study and Candidate Gene Mining of Seed Size Traits in Soybean

1
Shaanxi Key Laboratory of Chinese Jujube, College of Life Science, Yan’an University, Yan’an 716000, China
2
Department of Agricultural Biotechnology, Faculty of Agriculture, Food and Consumer Sciences, University for Development Studies, Tamale P.O. Box TL 1882, Ghana
3
Département de Phytologie, Université Laval, Québec, QC G1V 0A6, Canada
*
Author to whom correspondence should be addressed.
Agronomy 2024, 14(6), 1183; https://doi.org/10.3390/agronomy14061183
Submission received: 30 April 2024 / Revised: 26 May 2024 / Accepted: 28 May 2024 / Published: 30 May 2024

Abstract

:
Seed size traits, including seed length (SL), seed width (SW), and seed thickness (ST), are crucial appearance parameters that determine soybean seed weight, yield, and ultimate utilization. However, there is still a large gap in the understanding of the genetic mechanism of these traits. Here, 281 soybeans were utilized to analyze the genetic architecture of seed size traits in different years through multiple (single-locus and multi-locus) genome-wide association study (GWAS) models, and candidate genes were predicted by integrating information on gene function and transcriptome sequencing data. As a result, two, seven, and three stable quantitative trait nucleotides (QTNs) controlling SL, SW, and ST were detected in multiple environments using the single-locus GWAS model, and concurrently detected by the results of the multi-locus GWAS models. These stable QTNs are located on 10 linkage disequilibrium blocks, with single genome regions ranging in size from 20 to 440 kb, and can serve as the major loci controlling soybean seed size. Furthermore, by combining gene functional annotation and transcriptome sequencing data of seeds at different developmental stages from two extreme soybean accessions, nine candidate genes, including Glyma.05G038000, Glyma.05G244100, Glyma.05G246900, Glyma.07G070200, Glyma.11G010000, Glyma.11G012400, Glyma.17G165500, Glyma.17G166500, and Glyma.20G012600 within the major loci that may regulate soybean seed size, were mined. Overall, these findings offer valuable insights for molecular improvement breeding as well as gene functional studies to unravel the mechanism of soybean seed size.

1. Introduction

Soybean is an important crop widely grown in the world, which provides nearly 60% of global oilseed production and 70% of plant protein for human diet and animal feed [1]. However, China’s soybean production still cannot meet domestic demand, especially in recent years, where over 90 million tons of soybeans and their products are imported annually. It is imperative to boost China’s soybean production. Seed size traits, including seed length (SL), seed width (SW), and seed thickness (ST), are major appearance parameters that determine soybean seed weight, yield, and ultimate utilization [2,3,4]. These traits can be regarded as key target traits for breeders to improve soybean seeds. However, SL, SW, and ST are quantitative traits regulated by multiple micro-effect genes, which are highly influenced by growth environments, and are challenging to enhance by conventional breeding methods [5,6]. Therefore, identifying the quantitative trait loci (QTLs) and potential regulatory genes for these traits is of profound significance for improving soybean seed shape and yield.
Numerous QTLs associated with soybean seed size and shape traits have been identified by a linkage analysis strategy from different biparental mapping populations [7,8,9,10,11]. In recent years, Li et al. [12] identified seven SL and five SW additive QTLs using a recombinant inbred line (RIL) population named NJRISX. In the RIL population produced by crossing K099 with Fendou 16, Kumawat and Xu [13] mapped a total of 53 QTLs for six seed size and shape traits, and confirmed a major seed size QTL (qSS2) using near-isogenic lines. Kumar et al. [14] identified 42 QTLs controlling seed weight and shape traits on 13 different chromosomes. To date, the US Department of Agriculture’s Soybean Genome Database (SoyBase; http://www.soybase.org (accessed on 24 January 2024)) has reported hundreds of QTLs associated with soybean seed size/shape. However, the mapping resolution of the linkage analysis is influenced by the population size and marker density of genetic maps. Most seed size QTLs were identified in small-scale populations or low-density genetic maps, resulting in QTLs with larger genomic intervals [7,8,11,14]. These factors make it difficult to practically apply the aforementioned QTLs in molecular-assisted breeding and gene cloning. Therefore, currently, only a limited number of genes involved in seed size/weight have been confirmed based on the results of QTL mapping, for instance, GmPP2C-1 [15], GmSSS1 [16], and GmKIX8-1 [17].
GWAS can leverage a vast array of historical recombination events within a mapping panel and high-density molecular markers covering the entire genome, with it having a higher mapping resolution than linkage analysis [18,19]. This leap is a result of advances made in sequencing technology and statistical models, where researchers can easily obtain single nucleotide polymorphism (SNP) markers, thereby facilitating the deployment of GWAS in elucidating the inheritance of complex traits in crops [20,21,22]. In recent years, GWAS has also been effectively applied in the identification of influential loci and candidate genes mining for soybean seed size traits. For instance, Li et al. [23] detected an important locus controlling seed size on chromosome 9 using 196 soybean germplasms. Duan et al. [24] identified GmST05 within a small genomic region (180 kb) as a key locus controlling ST through GWAS with over 1800 soybeans. Then, they determined the functional gene of this locus. Shao et al. [25] detected a major genomic region controlling seed size and shape on chromosome 10 based on 196 soybean accessions with 5,630,273 SNPs, and predicted three candidate genes for this important genomic region. Li et al. [26] cloned the functional gene of the Seed Thickness 1 (ST1) locus by combining GWAS and linkage mapping. These indicate that GWAS could aid in identifying important loci/genes for complex traits. However, the genes associated with seed size identified in soybean are currently limited, and the molecular genetic mechanisms underlying these traits remain largely unexploited in breeding demand-driven soybean cultivars [24,26,27].
Seed size is measured based on multiple parameters, and its genetic basis may be more intricate than that of seed weight, yet it remains poorly understood [27]. To facilitate our breeding effort, it is imperative to understand the genetic and molecular mechanisms underlying soybean seed size traits. Therefore, in this study, the QTN composition of these traits in multiple environments was analyzed by GWAS. Furthermore, the candidate gene mining was conducted by integrating detected QTN results with the transcriptome data of contrasting soybean seeds at different developmental stages. These results may offer novel insights for molecular breeding improvement and the functional gene mining of soybean seed size traits.

2. Materials and Methods

2.1. Planting Accessions and Field Experiment Design

A mapping panel containing 281 soybean accessions was utilized as the experimental material, which has been applied in our previous research [28]. The 281 accessions were mainly collected from the northwest, Jiang-Huai, and Huang-Huai regions of China. All soybeans were planted during the soybean growing season (from early May to mid-October) in the years 2019 (E1), 2020 (E2), and 2021 (E3) at the Yan’an Experimental Station of Yan’an Agricultural Science Institute in Yan’an, Shaanxi, China (36°72′ N; 109°40′ E). A total of 281 accessions were planted in a completely randomized block experiment design. Fifteen individual plants of each accession were planted in a 1.5 m single-row plot with a row spacing of 0.5 m. The experiment was replicated three times in each environment.

2.2. Phenotypic Assessment and Statistical Analysis

After maturity, harvest the seeds and dry them to a moisture content of 13% (measured using Grain Moisture Fast Measure Instrument, TF-LS model, produced by Shanghai Tianfeng Measuring Instrument Co., Ltd., Shangai, China), then measure the phenotypic value of the SL, SW, and ST traits. Ten full and undamaged seeds were randomly selected from each accession for phenotypic investigation using the vernier calipers [6,14]. The phenotypic value for each accession in one planting environment was the average of the three replicates. The descriptive statistical analysis was performed on the traits of 281 accessions in the 3 environments (E1, E2, and E3) using SPSS software (version 22.0, SPSS Inc., Chicago, IL, USA). The statistical parameters included the mean, standard deviation (SD), maximum and minimum values, coefficient of variation (CV), and skewness and kurtosis of phenotype distribution in the different environments. To assess the effects of genetics, environment, and the interaction between genetics and environment on seed size traits, an analysis of variance was performed using the lmer function within the R-lme4 package [29]. The Broad heritability (h2) is computed using the formula by [30].

2.3. Genome-Wide Association Analysis

In a previous study, we used Wm82.a1 as the reference genome and obtained 58,112 SNPs (rare allele ratio > 0.05) throughout the genome [31]. In this study, we realigned the SNP marker positions using Wm82.a2 as the reference genome, and ultimately retained 56,608 markers for subsequent analysis. Detailed information on the population structure of this soybean panel is presented in our previous study [28].
Two types of GWAS models were used in the present study. First, the single-locus model was utilized to carry out the GWAS of three traits based on the phenotypic data in the three growth environments. The main purpose of this process is to discover as many SNP markers related to traits as possible and to detect the environmental stability of these markers. The second is used by multi-locus models to perform GWAS on the average values of traits across all environments, with the aim of verifying and supplementing the results of the single-locus model.
For the single-locus analysis model, the mixed linear model (PCA + K) analysis method within the R-GAPIT software (version 3.1.0) package is implemented [32]. GWAS was analyzed using trait phenotypes measured in the E1, E2, and E3 environments. In addition, −log10(p) ≥ 3 was as the threshold for screening for the significantly associated SNP markers. For the multi-locus models, six multi-locus GWAS (mrMLM, FASTmrEMMA, FASTmrMLM, pLARmEB, pKWmEB, and ISIS EM-BLASSO) models were used [33,34,35,36,37,38]. The average value under multiple environments was used as the phenotype for GWAS. This process was implemented through the R-mrMLM package [39]. The LOD (logarithm of odds) value is greater than 3.0 as the threshold to determine whether the QTN is significant.

2.4. Analysis of QTN Distribution in Extreme Germplasm

Two groups of soybeans with contrasting phenotypes (15 accessions with large-seeded and 15 accessions with small-seeded phenotypes, thus the top 5% and bottom 5%, respectively) were selected from the mapping panel. The allele of QTN that can increase phenotypic values was the excellent allele. Then, the proportion of excellent allele variation between the two groups (proposal of excellent alleles, PEA) was analyzed. The formula for calculating the PEA was PEA = n/N, where n represents the number of excellent allele variations contained in the soybean, and N is the total number of identified QTNs for each trait [40].

2.5. Important QTNs and Haplotype Analysis

SNPs detected in multiple environments in the single-loci analysis model and identified by ML-GWAS were considered important QTNs for controlling seed size traits. SNP markers in the region around the important QTNs were subsequently selected, and linkage disequilibrium (LD) analysis in the region around the important QTNs was visualized using Haploview 4.2 [41]. The LD block (genomic region) containing the important QTNs was the major locus for soybean seed size traits.

2.6. Candidate Gene Mining within the Major Loci

Potential candidate genes for soybean seed size were predicted by the functional annotation, the expression levels at different stages of soybean seed development, and the enrichment analysis of genes within major loci (LD block regions). Functional annotations (Wm82.a2.) for all genes within the major loci were obtained from SoyBase (SoyBase; http://www.soybase.org (accessed on 18 March 2024)). The expression data of genes were derived from sequencing data of transcripts from three seed development stages (R4, R5, and R6) of two soybeans selected from 281 accessions with significant differences in seed size traits. The gene expression and phenotype were statistically analyzed by SPSS software (version 22.0, SPSS Inc., Chicago, IL, USA). During the transcriptome sequencing process, each sample contains three biological replicates. A threshold of |log2 foldchange| ≥ 1 with p-value < 0.05 was adopted to screen for differentially expressed genes within the stable loci [42].

3. Results

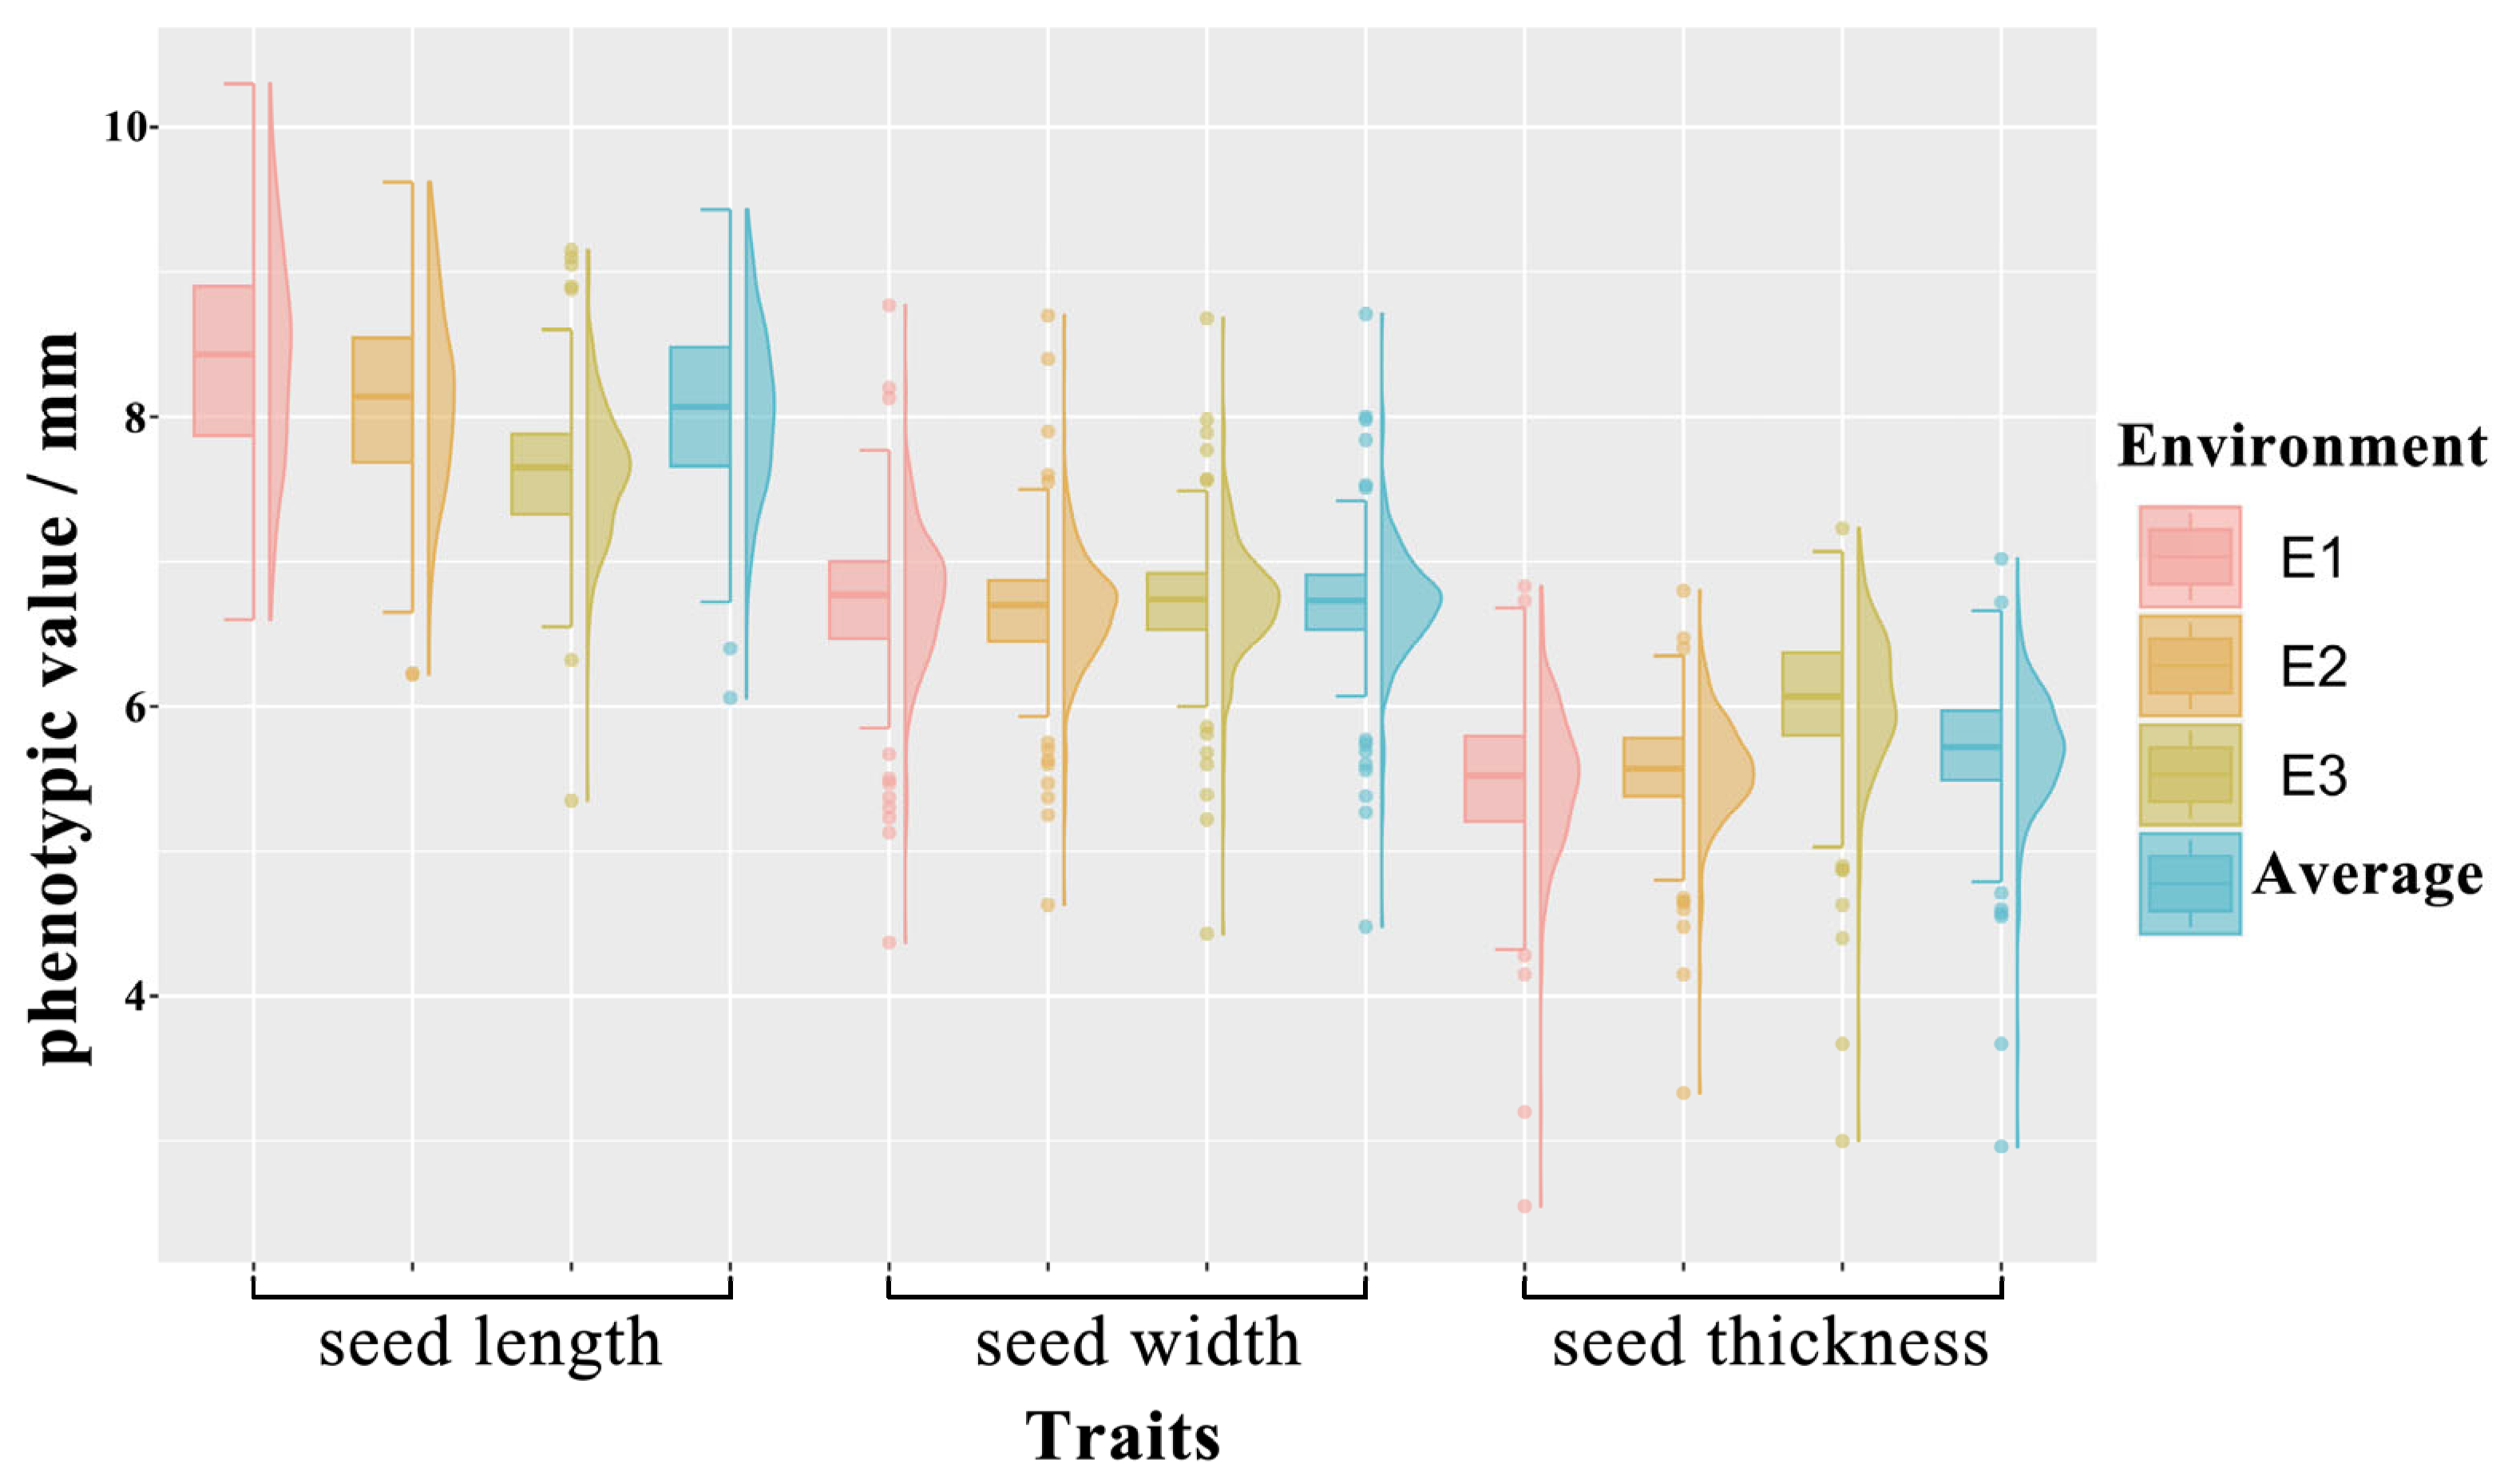
3.1. Phenotypic Evaluation of Seed Size Traits in the Mapping Panel

The seed size traits of 281 soybean accessions were evaluated in three environments. The descriptive statistics and distribution results are shown in Table 1 and Figure 1. The ranges of SL, SW, and ST were 5.35–10.30, 4.37–8.77, and 2.55–7.23 mm in all environments, respectively. Across all environments, the mean ± SD values for SL, SW, and ST were 8.06 ± 0.56, 6.71 ± 0.40, and 5.70 ± 0.42 mm, respectively, while, in the same order, the CV values were 6.09–8.76%, 6.04–7.23%, and 8.16–8.97% (Table 1). All traits were continuously distributed across all environments (Figure 1), indicating that soybean seed size traits are typical quantitative traits and regulated by many genes.
The h2 estimates of SL, SW, and ST were 0.72, 0.74, and 0.75, respectively (Table 1), suggesting that the seed size traits are mainly regulated by genetic factors in soybean. Conversely, the three seed size traits differed significantly in different environments (E1 to E3). In addition, these traits were influenced by the interaction between genotype and environment. Taken together, these results suggest that soybean seed size traits are easily affected by environmental factors, indicating that improving these traits solely through breeding methods relying on field phenotype selection may have uncertain outcomes.

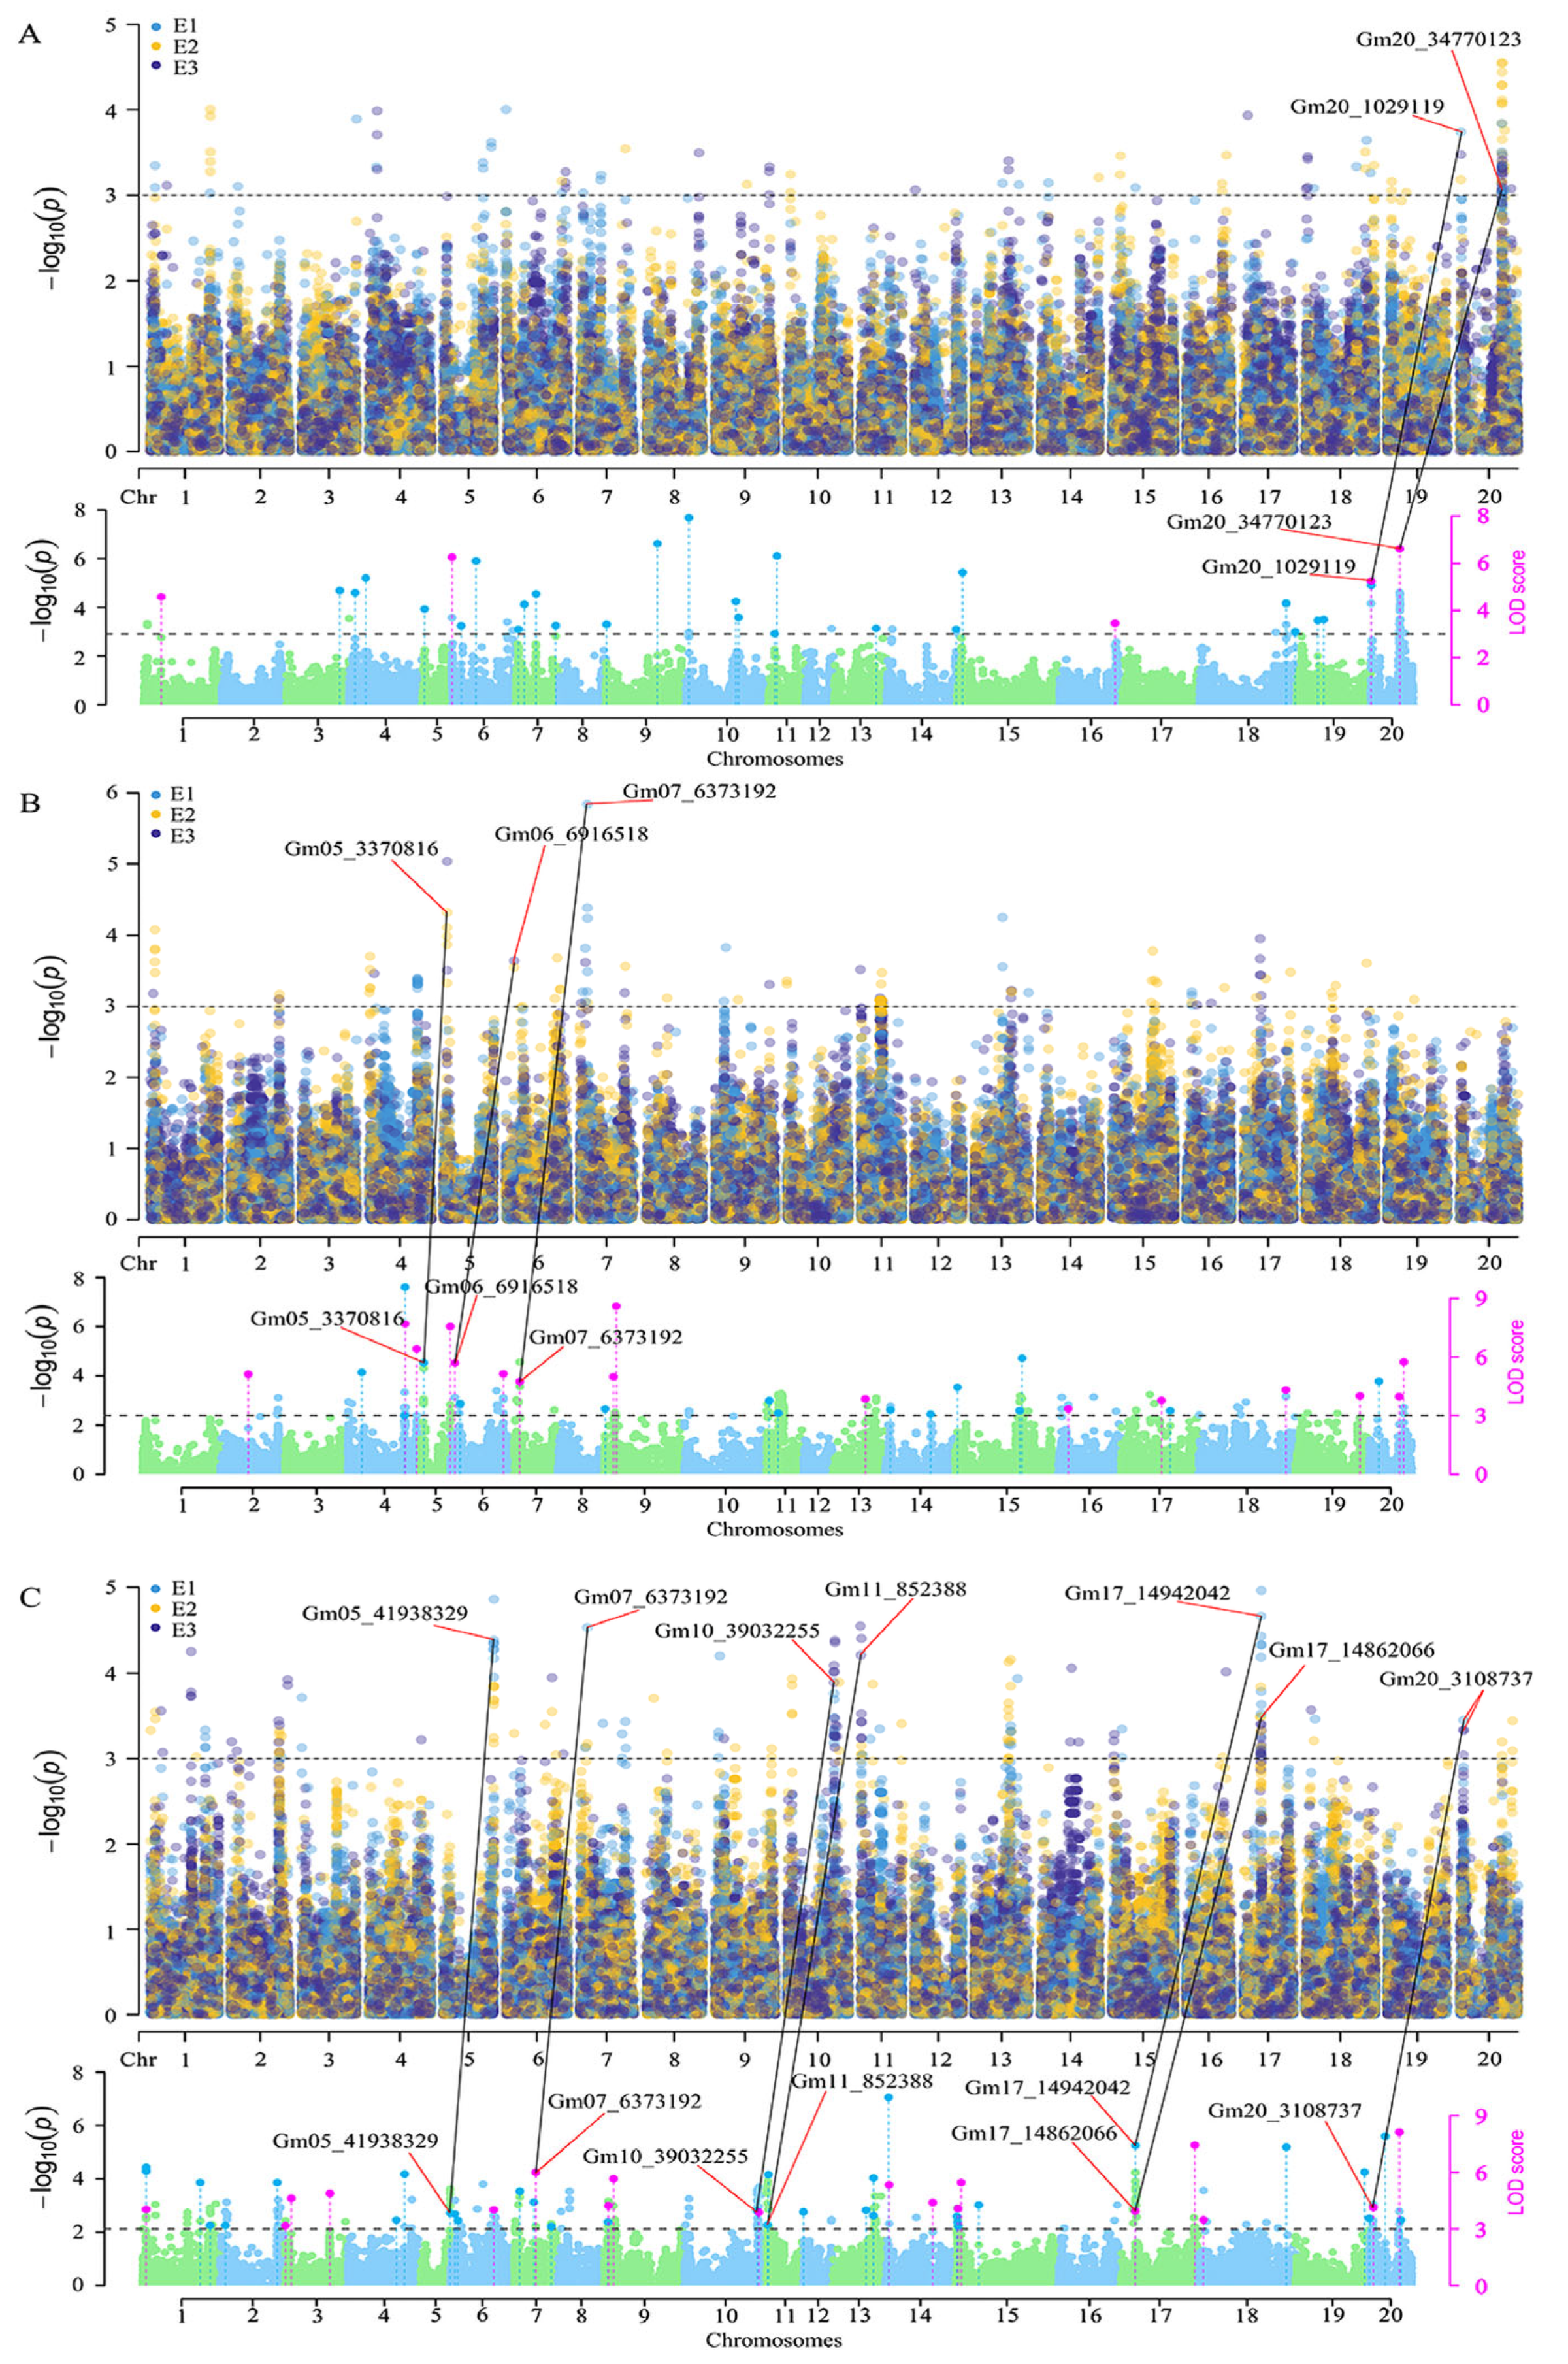
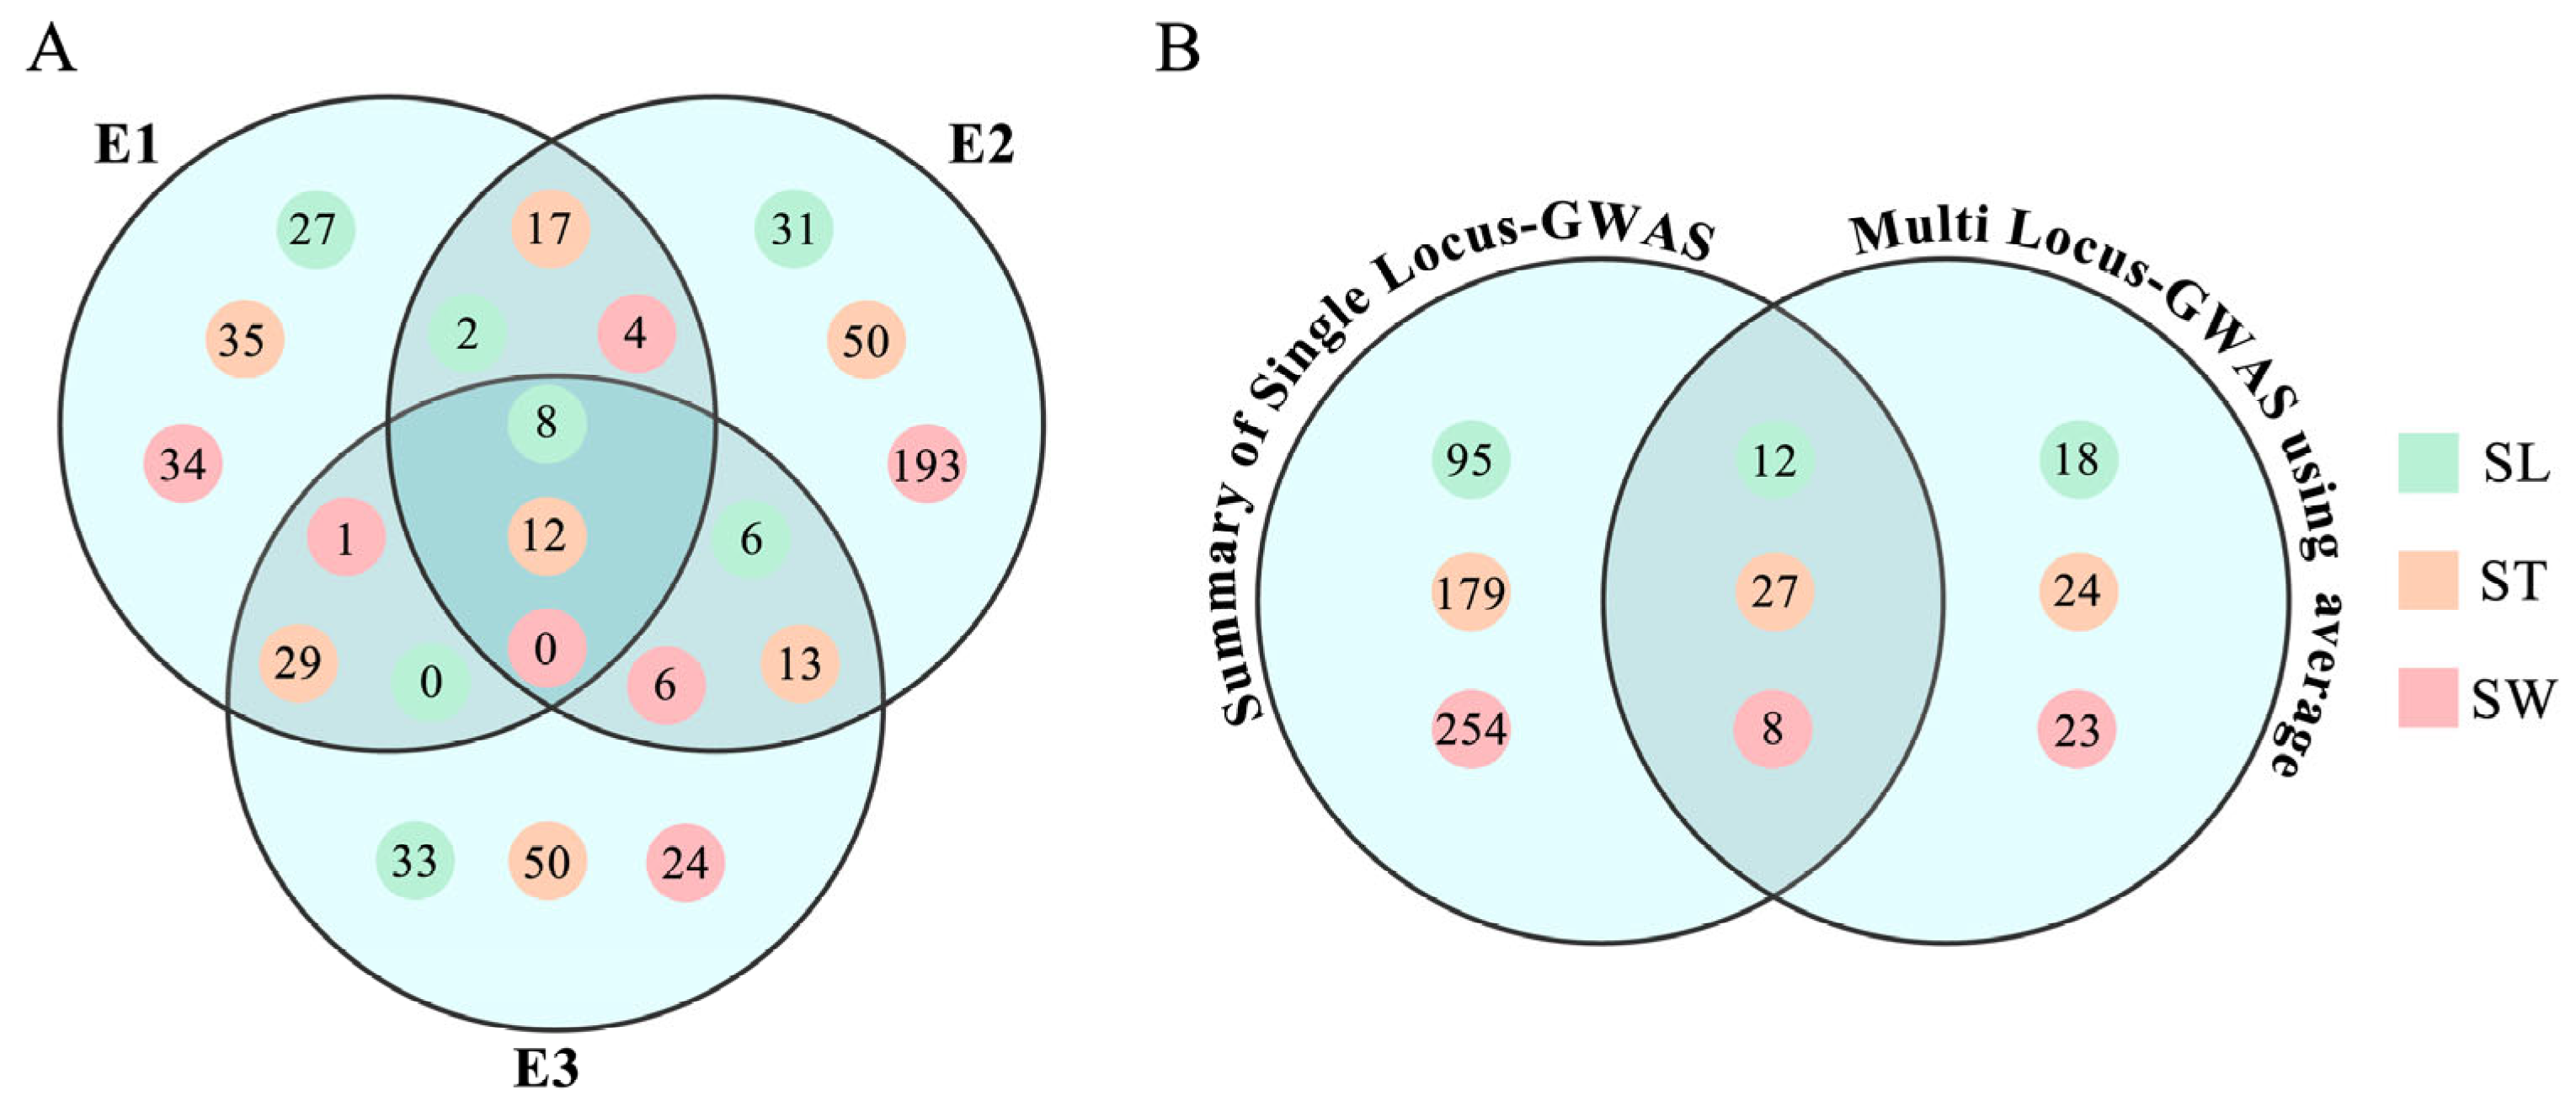
3.2. GWAS for Seed-Size Traits

For the single-locus GWAS model (MLM), a total of 107, 206, and 262 SNPs with −log10(p) ≥ 3 were detected for SL, SW, and ST across three environments (Figure 2 and Figure 3 and Table S1). For all significantly associated SNP markers, the −log10(p) values ranged from 3.00 to 5.84, while the allelic effect values were observed to be within the range of −3.9 to 3.0 mm. For the SL trait, 37, 47, and 57 significantly associated SNP markers were identified in one of the three environments. Eight and eight of these SNP markers could be detected in two and all environments and considered as environmentally stable SNPs. The remaining SNP markers were environmentally sensitive, only detected in a single environment. For the ST trait, 93, 92, and 104 significantly associated SNP markers were identified in separate planting environments, respectively (Table S1). Twelve SNPs were detected in all environments; 59 SNPs could be detected in two environments. The remaining 135 were environmentally sensitive SNPs. For the SW trait, the most, with 203 SNPs, were detected in the E2 environment, while 39 SNPs were detected in E1 and 31 SNPs were detected in E3 (Table S1). Typical of a quantitative trait, no SNP was detected simultaneously in the three environments, suggesting the complex nature of seed size traits. However, eleven SNPs were detected in two environments (Table S1).
In order to verify and supplement the single-locus model results, six multi-locus GWAS models were also used. There were 30, 51, and 31 QTNs for SL, SW, and ST, respectively (Figure 2 and Figure 3 and Table S2). The log of odds (LOD), phenotypic variation explained (PVE), and effect values for the individual QTNs ranged from 3.01–10.98, 0–14.91%, and 0–3.1 mm, respectively (Table S2).
Combining the results of the two types of GWAS methods, a total of 125, 230, and 285 QTNs controlling SL, ST, and SW were detected (Figure 3). Among these, two, seven, and three QTNs controlling SL, ST, and SW were detected simultaneously in two strategies and multiple growth environments, making them stable and critical QTNs for soybean seed size traits (Figure 2 and Table 2). The QTN: Gm07_6373192 was found to especially control both ST and SW traits (Figure 2 and Table 2).

3.3. Distribution of the QTNs in Extreme Accessions

The distribution characteristics of the identified 125, 230, and 285 QTNs controlling SL, ST, and SW in the accessions with extreme phenotypes (15 with small-seeded phenotype and 15 with large-seeded phenotype) were analyzed (Figure 4). The results displayed that the PEA of soybeans with the small seed length trait (6.06–7.15 mm) was less than 40%, except for AP205, while the accessions with large seed length trait values had a PEA between 65.1 and 87.2%. The same results were obtained for the ST and SW traits. The phenotype of accessions is directly proportional to the PEA, and the soybeans with the large-seeded phenotype also contain more PEA. This result indicates that the QTNs identified in this study have significant impact on soybean seed size and can provide information for whole-genome design breeding and parent matching of hybrid breeding.

3.4. Haplotype Analysis and Excellent Allele Excavation for the Important QTNs

Using the 11 important QTNs and their upstream and downstream SNP markers information for the linkage disequilibrium analysis, we found that the important QTNs located in 10 linkage disequilibrium blocks, where the size of a single genome region ranges from 20 to 440 Kb, could be regarded as major loci to control the soybean seed size (Table 2, Figure S1). Among these 10 major loci, two (named SL-1 and SL-2) were associated with SL, three (named SW-1, SW-2, and SW-3) were associated with SW, and six (named ST-1 to ST-6) were controlling ST. The genomic region of SW-2 and ST-3 is consistent, indicating that this locus controls both SW and ST traits, and has been renamed STW-1.
To validate the major loci and screen for excellent allelic variants, the phenotype distribution of seed size traits with different allelic types on ten important QTNs were analyzed (Figure 5). For SL, two SNP markers were used (Gm20_1029119 and Gm20_34770123). There were significant differences (p < 0.01) in the phenotype of two different genotypes of accessions on these two QTNs. For example, QTN Gm20_1029119 has T and C genotypes. When the genotype is T, the mean SL is 8.09 mm, significantly higher than the phenotype of the soybeans with genotype C (≈7.43 mm) (p = 3.7 × 10⁻⁴). There was a significant difference in SL phenotype between the two genotypes of QTN Gm20_34770123 (p = 2.2 × 10⁻¹⁶). For the ST trait, when the alleles were A, C, A, G, A, and C on QTNs Gm05_41938329, Gm07_6373192, Gm11_852388, Gm10_39032255, Gm17_14862066, and Gm20_3108737, the ST could increase by 0.33, 0.60, 0.25, 0.54, 0.55, and 0.24 mm, respectively, compared to another allele (p < 1.8 × 10⁻⁴). Analogous results were obtained for the SW trait, and excellent alleles of three QTNs, Gm 05_3370816, Gm 06_6916518, and Gm 07_6373192 could increase the phenotype values by 0.48, 0.40, and 0.60 mm, respectively.

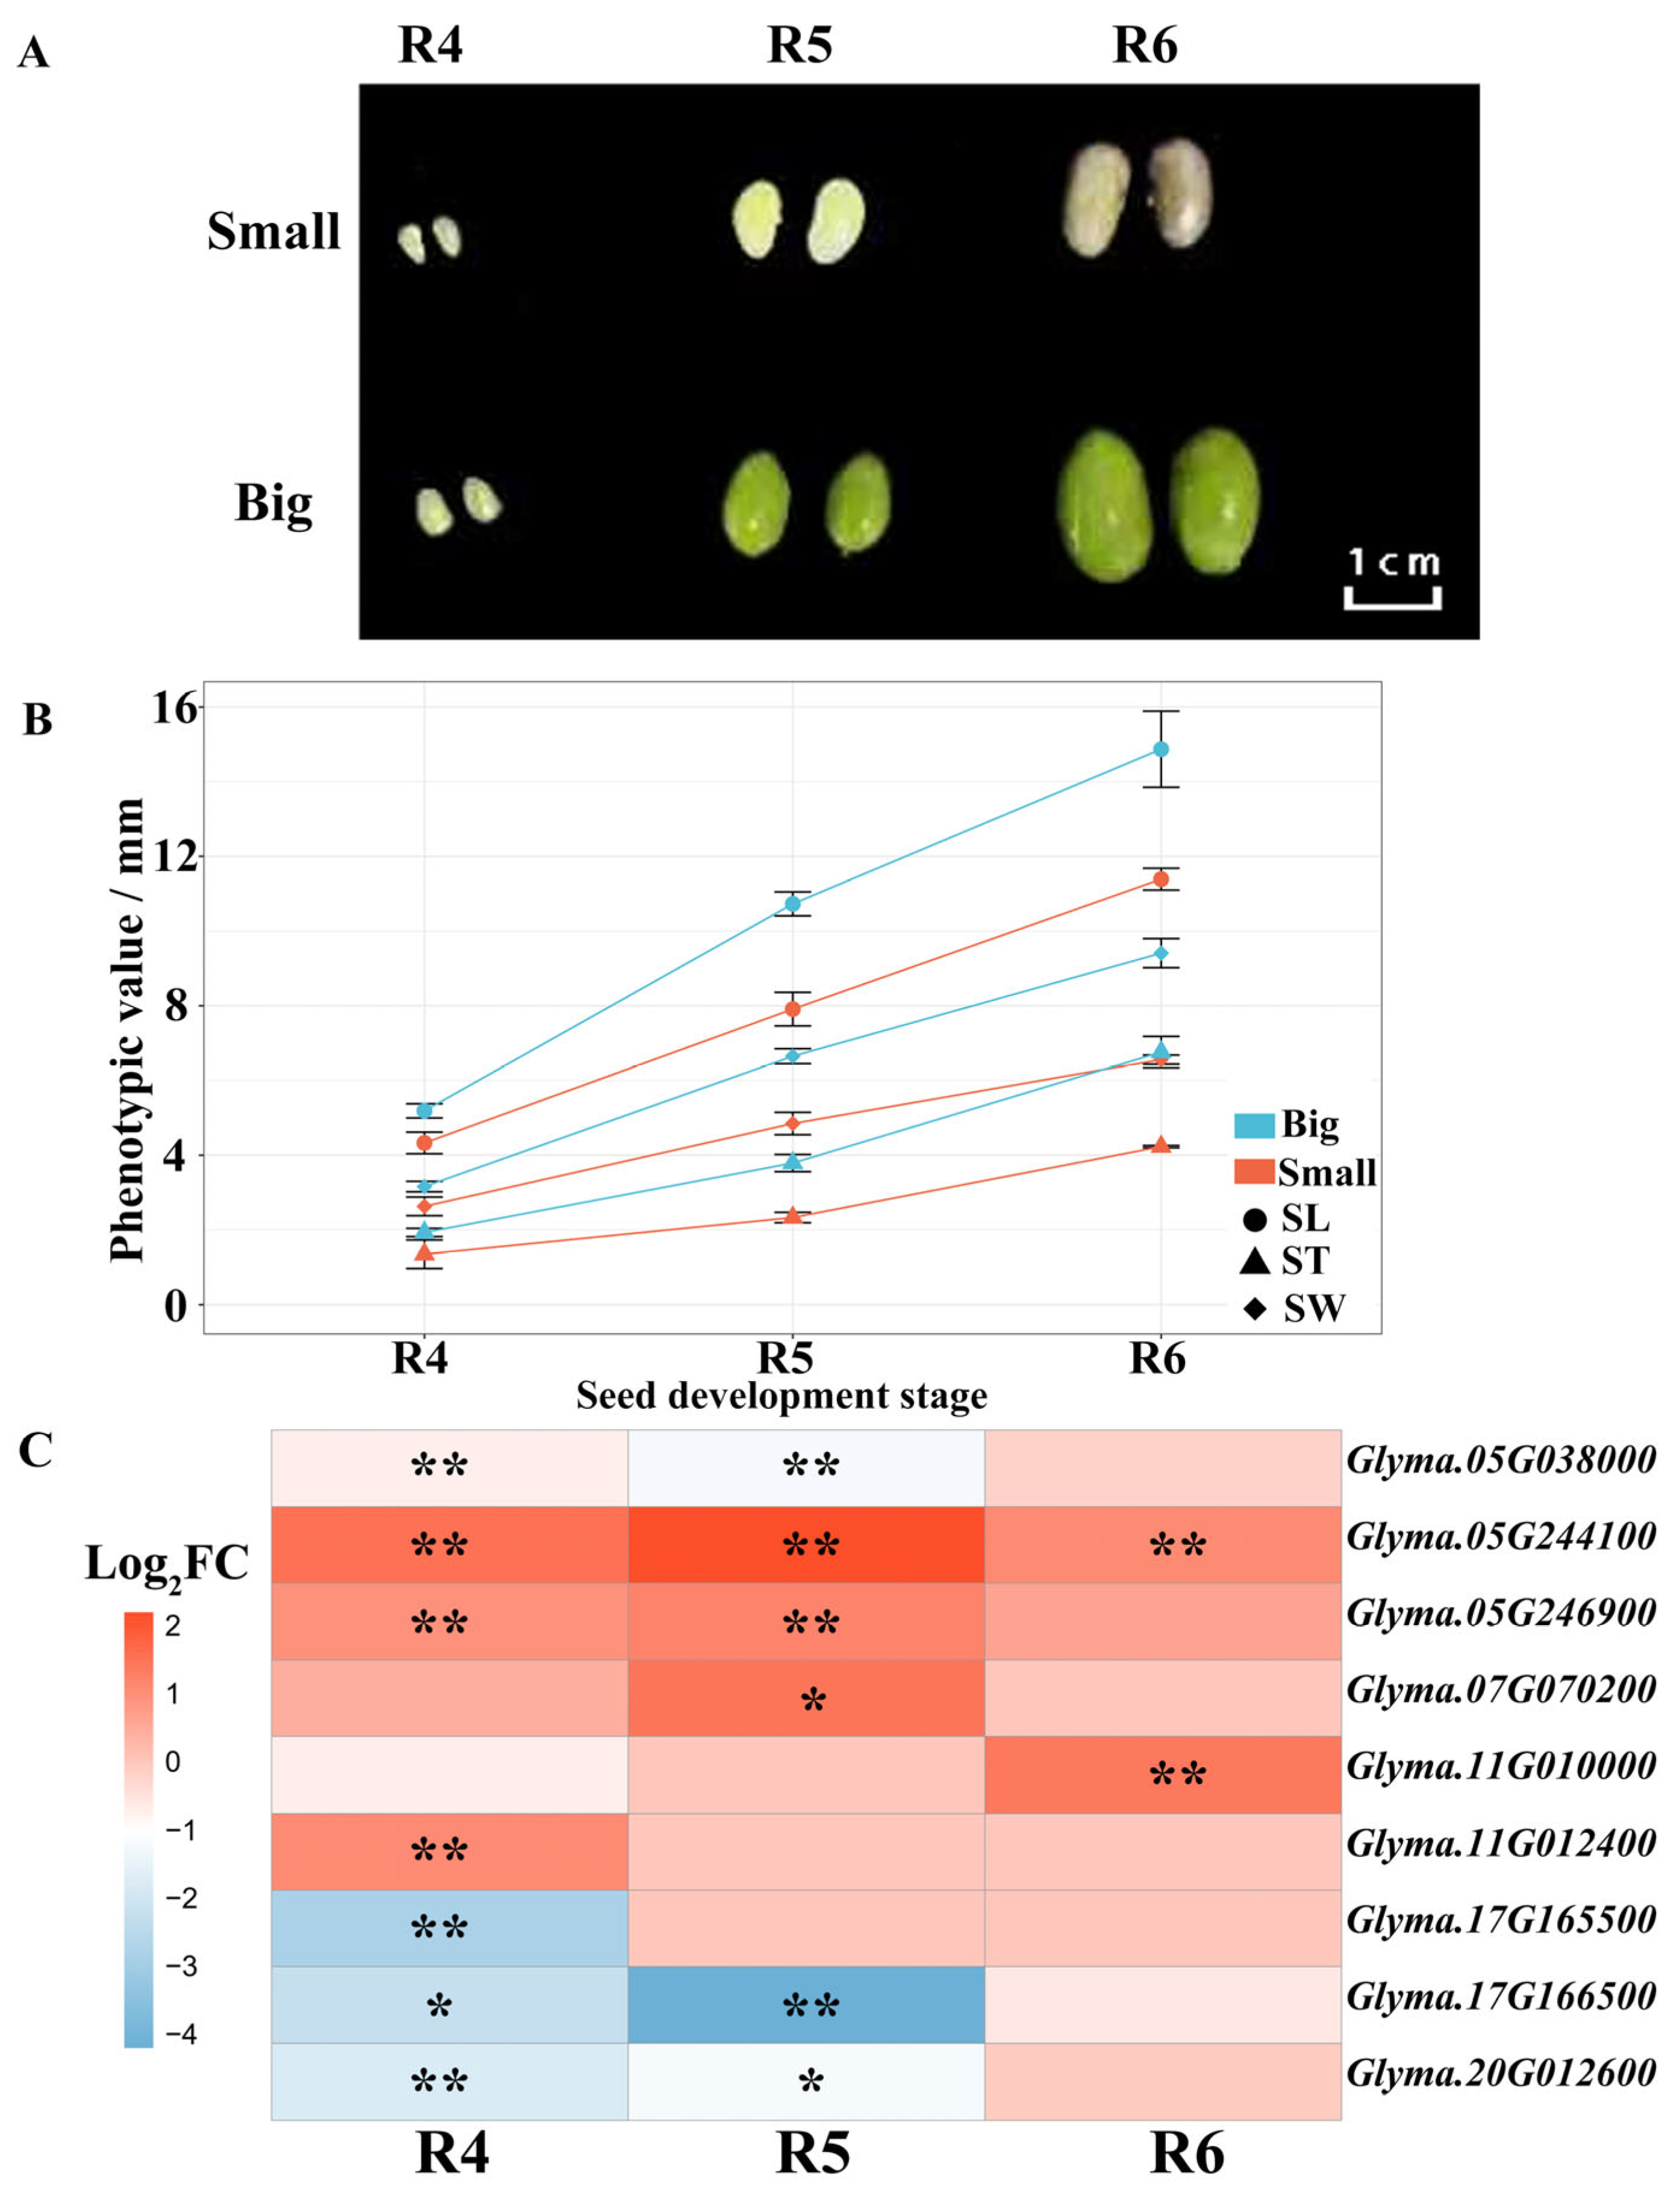
3.5. Candidate Gene Discovery for Seed Size Traits Underlying the Major Loci

Potential regulatory genes were mined from the 10 major loci. There are a total of 186 genes located within these loci, of which 170 genes are homologous to Arabidopsis genes (Table S3). A total of 137 genes have transcriptome sequencing data and 51 genes have differential expression levels (|log2 foldchange| ≥ 1 with p-value < 0.05) in at least one seed development stage in two soybeans with extreme phenotypes (Table S4). Further combining gene functional annotation, gene ontology (GO) enrichment analysis, and existing literature, a total of nine genes, differentially expressed at the seed development stages, are predicted to play a vital role in controlling seed size (Figure 6 and Table 3). Among these candidate genes, Glyma.05G244100 has been proven to regulate seed size in soybean [24]. Some of the remaining genes have been found to be related to seed size in Arabidopsis or other crops, while others are involved in embryo development, cell division, and cell proliferation biological processes and are notable candidates for controlling soybean seed size [43].

4. Discussion

Seed size is one of the key factors determining soybean yield, and it also significantly affects seed germination, quality, and commercial use [13,17,44]. For example, varieties with small seeds are suitable for the production of bean sprouts, and soybeans with large seeds contain more nutrients, which are more suitable for making fresh soybeans and soybean milk. However, parameters that determine seed size, including SL, SW, and ST, are complex quantitative traits and highly sensitive to the environment [6,11,25]. It is hard to effectively manipulate these traits through traditional methods. In order to accurately and quickly improve these traits, it is necessary to know their genetic composition in detail. Therefore, the current study used 281 soybeans for trait evaluation in three environments (E1, E2, and E3) to detect stable QTNs and major loci as well as potential regulatory genes for seed size traits that are convenient for application in soybean molecular breeding and gene function verification processes.
Due to soybean accessions potentially having different allele variations on a series of seed size loci, the phenotype of related traits exhibits extensive variation [4,24,25]. If the distribution information of excellent alleles in soybeans can be clear, breeders can accurately select varieties with excellent alleles as parents and integrate molecular marker-assisted selection to expedite the breeding program. In this study, a total of 125, 230, and 285 QTNs controlling SL, SW, and ST were detected based on two methods and multiple environments. It was found that the distribution of the PEA of these QTNs was consistent with the phenotype values in accessions with extreme phenotypes, indicating these QTNs can reflect the genetic basis of seed size. Meanwhile, some excellent allele variation vectors were discovered. For instance, soybean AP065 carries over 80% PEA across all three traits, making it suitable as a donor parent for breeding large seed varieties. In contrast, AP039 has less than 40% PEA in all three traits, rendering it a fitting choice as a parent for cultivating small seed varieties. Overall, these results can provide information for design breeding and parents selection in soybean seed size improvement breeding process.
Furthermore, a number of QTLs responsible for soybean seed size have been mapped based on linkage analysis [13,45,46]. In addition, some markers and genomic regions related to soybean seed size traits have also been identified through GWAS [26,47,48,49]. However, many QTLs have large confidence intervals, and only a few loci could be mapped in different environments [6,10,11,14,50]. These QTLs have not yet been applied in the breeding process of improving soybean seed size. In the present research, ten major loci with a region size of 20–440 Kb were found to control soybean seed size (Table 2). These loci are more favored in candidate gene cloning and molecular breeding research. Among them, SL-2 overlaps with seed length to width ratio 3–1 in SoyBase [51], ST-1 and ST-4 overlap with GmST05 and seed height 1–2 [24,52], and SW-1 and SW-2 are located in the same regions as seed width 4–3 and seed width 4–4 [53], respectively. Also, in the case of ST-1 and ST-5, which were previously found to control soybean seed weight in our research, we speculate that these two loci may be controlling ST to regulate the seed weight [31]. The results verify each other, indicating that these loci are key regulators of soybean seed size in our mapping population. To the best of our knowledge, the remaining five loci are being reported for the first time; hence, they could be targeted to enhance our cognition of genetic control over these traits. However, compared to previous research results, the size of important genomic intervals discovered in this study is less than 500 Kb, and the drawing accuracy has greatly improved. For instance, seed height 1–2 was reported to be within the physical region of 0.56–6.22 MB on chromosome 11, and it was detected within a linkage disequilibrium block with the size of 250 kb (ST-4, 0.71–0.96 Mb) in this study. In addition, it was found that ST-2 or SW-3 could modulate both ST and SW simultaneously, and therefore could serve as imperative targets for further research.
In recent years, numerous genes responsible for regulating seed size have been cloned and identified in rice, Arabidopsis, and other plants [54,55]. Some seed size genes in soybean have also been identified, such as GmCYP78A [56,57], GmPP2C-1 [15], GmBS1 [58], GmST1 [26], GmST05 [24], GmKIX8-1 [17], and GmSWEET10a [59]. However, compared with other major crops, the molecular regulatory pathway of seed size in soybean remains relatively unclear [43]. To pyramid elite alleles in molecular breeding, more genes are necessary to identify and discover [60]. In this study, we explored candidate genes by combining GWAS results and gene expression information at seed development stages of soybean with extreme phenotypes (Figure 6). Compared to relying solely on enrichment analysis and functional annotation, this not only improves the screening efficiency but also makes the results more reliable. Finally, nine candidate genes were predicted underlying the major loci. Among the nine candidate genes, Glyma.05G244100 is located within the genomic region identified on chromosome 5 (ST-2) that controls the ST trait. Glyma.05G244100 (SoyZH13:05G229200, ZH13a2 as reference genome) belongs to the PEBP family of genes and is a homolog of AtMFT in Arabidopsis. It has recently been determined to be involved in regulating soybean ST and regulating seed oil content by affecting the expression of GmSWEET10a [24]. It is now known that Brassinosteroid (BR) plays an important role in the development of plant seeds [61]. The AtDET2 (DE-ETIOLATED 2, At2G38050) is an essential gene involved in BR synthesis in Arabidopsis and has been identified to control seed size and shape by affecting the development of the embryo and endosperm [54]. Glyma.11G010000 is a homologous gene to the AtDET2 gene in soybean, making it an important candidate gene in the SW-2 locus. Glyma.17G165500 within ST-5 encoding one of the auxin-responsive GH3 family proteins is homologous to AT4G37390 (YDK1), which plays a key role in maintaining auxin homeostasis and responding to auxin stimulation. Knockout of the YDK1 gene in Arabidopsis leads to the increase in seed length, width, and weight, making Glyma.17G165500 a potential functional gene for controlling soybean seed size traits [62]. Glycosyltransferases play a pivotal role in plant growth and development, participating in resistance to abiotic stress, synthesis of secondary metabolites, and regulation of hormone balance. Research has indicated the UDP glucosyltransferase (GSA1) in rice can balance seed size and resistance to abiotic stress by regulating energy allocation [63]. The differentially expressed gene Glyma.17G166500 encodes the glucosyl/glucuronosyl transferases protein; therefore, it is considered another candidate gene for the ST-5 locus.
The seed size of plants is dictated by the growth of the endosperm, embryo, and coat [54,55]. The molecular mechanisms underlying the formation of these components have been extensively explored, and some pathways determining seed size have been identified [27,55]. According to the annotation results of gene ontology and existing literature information, Glyma.05G038000, Glyma.05G246900, Glyma.11G012400, Glyma.20G012600, and Glyma.07G072000 may be involved in biological processes such as cell proliferation, cell growth, cell division, starch biosynthetic process, embryo development, and regulation of hormone metabolism. These genes can serve as candidate genes for regulating soybean seed size traits. However, the evidence for identifying genes that regulate seed size in this study is insufficient, and the functions of these candidate genes still need to be studied and validated using genetic and molecular biology techniques such as gene knockout and overexpression.

5. Conclusions

In the current research, we conducted GWAS on soybean SL, SW, and ST, to dissect the QTN composition of these traits. As a result, 107, 206, and 262 significantly associated SNPs were detected for SL, SW, and ST in at least one environment using the single-locus GWAS model. A total of 30, 51, and 31 QTNs controlling SL, SW, and ST were detected by the multi-locus GWAS model. By integrating the results of two types of GWAS models, two, seven, and three stable QTNs controlling SL, SW, and ST were detected. These stable QTNs are located on 10 linkage disequilibrium (LD) blocks, with single genome regions ranging in size from 20 to 440 Kb, which can serve as the major loci controlling soybean seed size. Among these loci, five are being reported for the first time, which could be targeted to increase our knowledge of the genetic control of soybean seed size traits. Nine candidate genes that may regulate soybean seed size were mined within the major loci. These findings offer valuable insights for molecular breeding and functional genes discovery for soybean seed size.

Supplementary Materials

The following supporting information can be downloaded at https://www.mdpi.com/article/10.3390/agronomy14061183/s1: Figure S1: Results of LD block analysis of the region around the position of stable QTNs; Table S1: Results of the single-locus GWAS model in different environments; Table S2: Results of multi-locus GWAS models based on the average across different environments; Table S3: The annotation information of genes underlying 10 major loci; Table S4: The transcriptome sequencing data of genes within major loci at seed R4, R5, and R6 developmental stages.

Author Contributions

Conceptualization,Y.C. and G.C.; methodology, Y.C.; funding acquisition, Y.C.; software, P.Z. and Z.Y.; validation, S.J. and B.K.; formal analysis, P.Z.; investigation, P.Z., Z.Y., N.L., and S.J.; data curation, P.Z.; visualization, P.Z., Z.Y., and S.J.; project administration, Y.C.; supervision, G.C.; resources, Y.C.; writing—original draft preparation, P.Z., Z.Y., and S.J.; writing—review and editing, Y.C. and B.K. All authors have read and agreed to the published version of the manuscript.

Funding

This research was funded by the National Natural Science Foundation of China (Grant No. 32160469), the Natural Science Basic Research Plan in Shaanxi Province of China (Program No. 2020JQ-795), the Young Talent fund of University Association for Science and Technology in Shaanxi, China (20200205), the Special Scientific Research Project of Yan’an University (YDY2020-30), and the College Students’ Innovation Program of Yan’an University (202310719041, D2023100).

Data Availability Statement

The original contributions presented in the study are included in the article and Supplementary Materials; further inquiries can be directed to the corresponding author.

Conflicts of Interest

The authors declare no conflicts of interest.

References

  1. SoyStats®2023. Available online: http://soystats.com/ (accessed on 24 April 2024).
  2. Adebisi, M.A.; Kehinde, T.O.; Salau, A.W.; Okesola, L.A.; Porbeni, J.B.O.; Esuruoso, A.O.; Oyekale, K.O. Influence of Different Seed Size Fractions on Seed Germination, Seedling Emergence and Seed Yield Characters in Tropical Soybean (Glycine max L. Merrill). Int. J. Agric. Res. 2013, 8, 26–33. [Google Scholar] [CrossRef]
  3. Morrison, M.J.; Xue, A.G. The Influence of Seed Size on Soybean Yield in Short-Season Regions. Can. J. Plant Sci. 2007, 87, 89–91. [Google Scholar] [CrossRef]
  4. Ray, D.D.; Sen, S.; Bhattacharyya, P.K.; Bhattacharyya, S. Study on Seed Size Variation in Soybean (Glycine max L. Merr.) and Its Correlation with Yield. Int. J. Econ. Plants 2022, 9, 204–209. [Google Scholar]
  5. Luo, S.; Jia, J.; Liu, R.; Wei, R.; Guo, Z.; Cai, Z.; Chen, B.; Liang, F.; Xia, Q.; Nian, H. Identification of Major QTLs for Soybean Seed Size and Seed Weight Traits Using a RIL Population in Different Environments. Front. Plant Sci. 2023, 13, 1094112. [Google Scholar] [CrossRef] [PubMed]
  6. Elattar, M.A.; Karikari, B.; Li, S.; Song, S.; Cao, Y.; Aslam, M.; Hina, A.; Abou-Elwafa, S.F.; Zhao, T. Identification and Validation of Major QTLs, Epistatic Interactions, and Candidate Genes for Soybean Seed Shape and Weight Using Two Related RIL Populations. Front. Genet. 2021, 12, 666440. [Google Scholar] [CrossRef] [PubMed]
  7. Gao, W.; Ma, R.; Li, X.; Liu, J.; Jiang, A.; Tan, P.; Xiong, G.; Du, C.; Zhang, J.; Zhang, X. Construction of Genetic Map and QTL Mapping for Seed Size and Quality Traits in Soybean (Glycine max L.). Int. J. Mol. Sci. 2024, 25, 2857. [Google Scholar] [CrossRef] [PubMed]
  8. Jiang, A.; Liu, J.; Gao, W.; Ma, R.; Tan, P.; Liu, F.; Zhang, J. Construction of a Genetic Map and QTL Mapping of Seed Size Traits in Soybean. Front. Genet. 2023, 14, 1248315. [Google Scholar] [CrossRef]
  9. Yang, H.; Wang, W.; He, Q.; Xiang, S.; Tian, D.; Zhao, T.; Gai, J. Chromosome Segment Detection for Seed Size and Shape Traits Using an Improved Population of Wild Soybean Chromosome Segment Substitution Lines. Physiol. Mol. Biol. Plants 2017, 23, 877–889. [Google Scholar] [CrossRef] [PubMed]
  10. Teng, W.L.; Sui, M.N.; Li, W.; Wu, D.P.; Zhao, X.; Li, H.Y.; Han, Y.P.; Li, W.B. Identification of Quantitative Trait Loci Underlying Seed Shape in Soybean across Multiple Environments. J. Agric. Sci. 2018, 156, 3–12. [Google Scholar] [CrossRef]
  11. Hina, A.; Cao, Y.; Song, S.; Li, S.; Sharmin, R.A.; Elattar, M.A.; Bhat, J.A.; Zhao, T. High-Resolution Mapping in Two RIL Populations Refines Major “QTL Hotspot” Regions for Seed Size and Shape in Soybean (Glycine max L.). Int. J. Mol. Sci. 2020, 21, 1040. [Google Scholar] [CrossRef]
  12. Li, M.; Chen, L.; Zeng, J.; Razzaq, M.K.; Xu, X.; Xu, Y.; Wang, W.; He, J.; Xing, G.; Gai, J. Identification of Additive–Epistatic QTLs Conferring Seed Traits in Soybean Using Recombinant Inbred Lines. Front. Plant Sci. 2020, 11, 566056. [Google Scholar] [CrossRef] [PubMed]
  13. Kumawat, G.; Xu, D. A Major and Stable Quantitative Trait Locus qSS2 for Seed Size and Shape Traits in a Soybean RIL Population. Front. Genet. 2021, 12, 646102. [Google Scholar] [CrossRef] [PubMed]
  14. Kumar, R.; Saini, M.; Taku, M.; Debbarma, P.; Mahto, R.K.; Ramlal, A.; Sharma, D.; Rajendran, A.; Pandey, R.; Gaikwad, K.; et al. Identification of Quantitative Trait Loci (QTLs) and Candidate Genes for Seed Shape and 100-Seed Weight in Soybean [Glycine max (L.) Merr.]. Front. Plant Sci. 2023, 13, 1074245. [Google Scholar] [CrossRef] [PubMed]
  15. Lu, X.; Xiong, Q.; Cheng, T.; Li, Q.-T.; Liu, X.-L.; Bi, Y.-D.; Li, W.; Zhang, W.-K.; Ma, B.; Lai, Y.-C.; et al. A PP2C-1 Allele Underlying a Quantitative Trait Locus Enhances Soybean 100-Seed Weight. Mol. Plant 2017, 10, 670–684. [Google Scholar] [CrossRef] [PubMed]
  16. Zhu, W.; Yang, C.; Yong, B.; Wang, Y.; Li, B.; Gu, Y.; Wei, S.; An, Z.; Sun, W.; Qiu, L.; et al. An Enhancing Effect Attributed to a Nonsynonymous Mutation in SOYBEAN SEED SIZE 1, a SPINDLY-like Gene, Is Exploited in Soybean Domestication and Improvement. New Phytol. 2022, 236, 1375–1392. [Google Scholar] [CrossRef] [PubMed]
  17. Nguyen, C.X.; Paddock, K.J.; Zhang, Z.; Stacey, M.G. GmKIX8-1 Regulates Organ Size in Soybean and Is the Causative Gene for the Major Seed Weight QTL qSw17-1. New Phytol. 2021, 229, 920–934. [Google Scholar] [CrossRef] [PubMed]
  18. Rafalski, J.A. Association Genetics in Crop Improvement. Curr. Opin. Plant Biol. 2010, 13, 174–180. [Google Scholar] [CrossRef]
  19. Ibrahim, A.K.; Zhang, L.; Niyitanga, S.; Afzal, M.Z.; Xu, Y.; Zhang, L.; Zhang, L.; Qi, J. Principles and Approaches of Association Mapping in Plant Breeding. Trop. Plant Biol. 2020, 13, 212–224. [Google Scholar] [CrossRef]
  20. Khan, S.U.; Yangmiao, J.; Liu, S.; Zhang, K.; Khan, M.H.U.; Zhai, Y.; Olalekan, A.; Fan, C.; Zhou, Y. Genome-Wide Association Studies in the Genetic Dissection of Ovule Number, Seed Number, and Seed Weight in Brassica napus L. Ind. Crop. Prod. 2019, 142, 111877. [Google Scholar] [CrossRef]
  21. Tao, Y.; Zhao, X.; Wang, X.; Hathorn, A.; Hunt, C.; Cruickshank, A.W.; van Oosterom, E.J.; Godwin, I.D.; Mace, E.S.; Jordan, D.R. Large-scale GWAS in Sorghum Reveals Common Genetic Control of Grain Size among Cereals. Plant Biotechnol. J. 2020, 18, 1093–1105. [Google Scholar] [CrossRef]
  22. Kabange, N.R.; Dzorkpe, G.D.; Park, D.-S.; Kwon, Y.; Lee, S.-B.; Lee, S.-M.; Kang, J.-W.; Jang, S.-G.; Oh, K.-W.; Lee, J.-H. Rice (Oryza sativa L.) Grain Size, Shape, and Weight-Related QTLs Identified Using GWAS with Multiple GAPIT Models and High-Density SNP Chip DNA Markers. Plants 2023, 12, 4044. [Google Scholar] [CrossRef]
  23. Li, J.; Zhao, J.; Li, Y.; Gao, Y.; Hua, S.; Nadeem, M.; Sun, G.; Zhang, W.; Hou, J.; Wang, X.; et al. Identification of a Novel Seed Size Associated Locus SW9-1 in Soybean. Crop J. 2019, 7, 548–559. [Google Scholar] [CrossRef]
  24. Duan, Z.; Zhang, M.; Zhang, Z.; Liang, S.; Fan, L.; Yang, X.; Yuan, Y.; Pan, Y.; Zhou, G.; Liu, S.; et al. Natural Allelic Variation of GmST05 Controlling Seed Size and Quality in Soybean. Plant Biotechnol. J. 2022, 20, 1807–1818. [Google Scholar] [CrossRef]
  25. Shao, Z.; Shao, J.; Huo, X.; Li, W.; Kong, Y.; Du, H.; Li, X.; Zhang, C. Identification of Closely Associated SNPs and Candidate Genes with Seed Size and Shape via Deep Re-Sequencing GWAS in Soybean. Theor. Appl. Genet. 2022, 135, 2341–2351. [Google Scholar] [CrossRef] [PubMed]
  26. Li, J.; Zhang, Y.; Ma, R.; Huang, W.; Hou, J.; Fang, C.; Wang, L.; Yuan, Z.; Sun, Q.; Dong, X.; et al. Identification of ST1 Reveals a Selection Involving Hitchhiking of Seed Morphology and Oil Content during Soybean Domestication. Plant Biotechnol. J. 2022, 20, 1110–1121. [Google Scholar] [CrossRef]
  27. Duan, Z.; Li, Q.; Wang, H.; He, X.; Zhang, M. Genetic Regulatory Networks of Soybean Seed Size, Oil and Protein Contents. Front. Plant Sci. 2023, 14, 1160418. [Google Scholar] [CrossRef] [PubMed]
  28. Cao, Y.; Zhang, X.; Jia, S.; Karikari, B.; Zhang, M.; Xia, Z.; Zhao, T.; Liang, F. Genome-Wide Association among Soybean Accessions for the Genetic Basis of Salinity-Alkalinity Tolerance during Germination. Crop Pasture Sci. 2021, 72, 255–267. [Google Scholar] [CrossRef]
  29. Douglas Bates, M.M.; Bolker, B.; Walker, S. Fitting Linear Mixed-Effects Models Using Lme4. J. Stat. Softw. 2015, 67, 1–48. [Google Scholar]
  30. Nyquist, W.E.; Baker, R.J. Estimation of Heritability and Prediction of Selection Response in Plant Populations. Crit. Rev. Plant Sci. 1991, 10, 235–322. [Google Scholar] [CrossRef]
  31. Cao, Y.; Jia, S.; Chen, L.; Zeng, S.; Zhao, T.; Karikari, B. Identification of Major Genomic Regions for Soybean Seed Weight by Genome-Wide Association Study. Mol. Breed. 2022, 42, 38. [Google Scholar] [CrossRef]
  32. Lipka, A.E.; Tian, F.; Wang, Q.; Peiffer, J.; Li, M.; Bradbury, P.J.; Gore, M.A.; Buckler, E.S.; Zhang, Z. GAPIT: Genome Association and Prediction Integrated Tool. Bioinformatics 2012, 28, 2397–2399. [Google Scholar] [CrossRef] [PubMed]
  33. Tamba, C.L.; Zhang, Y.-M. A Fast mrMLM Algorithm for Multi-Locus Genome-Wide Association Studies. bioRxiv 2018. [Google Scholar] [CrossRef]
  34. Wen, Y.-J.; Zhang, H.; Ni, Y.-L.; Huang, B.; Zhang, J.; Feng, J.-Y.; Wang, S.-B.; Dunwell, J.M.; Zhang, Y.-M.; Wu, R. Methodological Implementation of Mixed Linear Models in Multi-Locus Genome-Wide Association Studies. Brief. Bioinform. 2018, 19, 700–712. [Google Scholar] [CrossRef] [PubMed]
  35. Wang, S.-B.; Feng, J.-Y.; Ren, W.-L.; Huang, B.; Zhou, L.; Wen, Y.-J.; Zhang, J.; Dunwell, J.M.; Xu, S.; Zhang, Y.-M. Improving Power and Accuracy of Genome-Wide Association Studies via a Multi-Locus Mixed Linear Model Methodology. Sci. Rep. 2016, 6, 19444. [Google Scholar] [CrossRef] [PubMed]
  36. Zhang, J.; Feng, J.-Y.; Ni, Y.L.; Wen, Y.J.; Niu, Y.; Tamba, C.L.; Yue, C.; Song, Q.; Zhang, Y.M. pLARmEB: Integration of Least Angle Regression with Empirical Bayes for Multilocus Genome-Wide Association Studies. Heredity 2017, 118, 517–524. [Google Scholar] [CrossRef] [PubMed]
  37. Ren, W.-L.; Wen, Y.-J.; Dunwell, J.M.; Zhang, Y.-M. pKWmEB: Integration of Kruskal–Wallis Test with Empirical Bayes under Polygenic Background Control for Multi-Locus Genome-Wide Association Study. Heredity 2018, 120, 208–218. [Google Scholar] [CrossRef] [PubMed]
  38. Tamba, C.L.; Ni, Y.-L.; Zhang, Y.-M. Iterative Sure Independence Screening EM-Bayesian LASSO Algorithm for Multi-Locus Genome-Wide Association Studies. PLoS Comput. Biol. 2017, 13, e1005357. [Google Scholar] [CrossRef] [PubMed]
  39. Zhang, Y.-W.; Tamba, C.L.; Wen, Y.-J.; Li, P.; Ren, W.-L.; Ni, Y.-L.; Gao, J.; Zhang, Y.-M. mrMLM v4. 0.2: An R Platform for Multi-Locus Genome-Wide Association Studies. Genom. Proteom. Bioinform. 2020, 18, 481–487. [Google Scholar] [CrossRef] [PubMed]
  40. Qi, Z.; Song, J.; Zhang, K.; Liu, S.; Tian, X.; Wang, Y.; Fang, Y.; Li, X.; Wang, J.; Yang, C.; et al. Identification of QTNs Controlling 100-Seed Weight in Soybean Using Multilocus Genome-Wide Association Studies. Front. Genet. 2020, 11, 689. [Google Scholar] [CrossRef]
  41. Barrett, J.C.; Fry, B.; Maller, J.; Daly, M.J. Haploview: Analysis and Visualization of LD and Haplotype Maps. Bioinformatics 2005, 21, 263–265. [Google Scholar] [CrossRef]
  42. Tang, X.; Xue, Y.; Cao, D.; Luan, X.; Zhao, K.; Liu, Q.; Ren, Y.; Zhu, Z.; Li, Y.; Liu, X. Identification of Candidate Genes for Drought Resistance during Soybean Seed Development. Agriculture 2023, 13, 949. [Google Scholar] [CrossRef]
  43. Zhang, Y.; Bhat, J.A.; Zhang, Y.; Yang, S. Understanding the Molecular Regulatory Networks of Seed Size in Soybean. Int. J. Mol. Sci. 2024, 25, 1441. [Google Scholar] [CrossRef] [PubMed]
  44. Gandhi, A.P. Quality of Soybean and Its Food Products. Int. Food Res. J. 2009, 16, 11–19. [Google Scholar]
  45. Xu, M.; Kong, K.; Miao, L.; He, J.; Liu, T.; Zhang, K.; Yue, X.; Jin, T.; Gai, J.; Li, Y. Identification of Major Quantitative Trait Loci and Candidate Genes for Seed Weight in Soybean. Theor. Appl. Genet. 2023, 136, 22. [Google Scholar] [CrossRef] [PubMed]
  46. Cui, B.; Chen, L.; Yang, Y.; Liao, H. Genetic Analysis and Map-based Delimitation of a Major Locus qSS3 for Seed Size in Soybean. Plant Breed. 2020, 139, 1145–1157. [Google Scholar] [CrossRef]
  47. Dong, Y.-Y.; Ji, L.I.U.; Zhang, X.-C.; Feng, L.I.N.; Shi, F.-F.; Bo, W.; Xue, F.U.; Xue, Z.; Han, Y.-P.; Li, W.-B. Genome-Wide Association Analysis of Seed Size Traits in Soybean under Multiple Environments. Chin. J. Oil Crop Sci. 2023, 45, 111–123. [Google Scholar]
  48. Niu, M.; Tian, K.; Chen, Q.; Yang, C.; Zhang, M.; Sun, S.; Wang, X. A Multi-Trait GWAS-Based Genetic Association Network Controlling Soybean Architecture and Seed Traits. Front. Plant Sci. 2024, 14, 1302359. [Google Scholar] [CrossRef] [PubMed]
  49. Fang, C.; Ma, Y.; Wu, S.; Liu, Z.; Wang, Z.; Yang, R.; Hu, G.; Zhou, Z.; Yu, H.; Zhang, M.; et al. Genome-Wide Association Studies Dissect the Genetic Networks Underlying Agronomical Traits in Soybean. Genome Biol. 2017, 18, 161. [Google Scholar] [CrossRef] [PubMed]
  50. Dargahi, H.; Tanya, P.; Srinives, P. Detection of Quantitative Trait Loci for Seed Size Traits in Soybean (Glycine max L.). Agric. Nat. Resour. 2015, 49, 832–843. [Google Scholar]
  51. Qi, X.; Li, M.-W.; Xie, M.; Liu, X.; Ni, M.; Shao, G.; Song, C.; Kay-Yuen Yim, A.; Tao, Y.; Wong, F.-L.; et al. Identification of a Novel Salt Tolerance Gene in Wild Soybean by Whole-Genome Sequencing. Nat. Commun. 2014, 5, 4340. [Google Scholar] [CrossRef]
  52. Salas, P.; Oyarzo-Llaipen, J.C.; Wang, D.; Chase, K.; Mansur, L. Genetic Mapping of Seed Shape in Three Populations of Recombinant Inbred Lines of Soybean (Glycine max L. Merr.). Theor. Appl. Genet. 2006, 113, 1459–1466. [Google Scholar] [CrossRef] [PubMed]
  53. Jun, T.-H.; Freewalt, K.; Michel, A.P.; Mian, R. Identification of Novel QTL for Leaf Traits in Soybean. Plant Breed. 2014, 133, 61–66. [Google Scholar] [CrossRef]
  54. Li, N.; Li, Y. Signaling Pathways of Seed Size Control in Plants. Curr. Opin. Plant Biol. 2016, 33, 23–32. [Google Scholar] [CrossRef] [PubMed]
  55. Li, N.; Xu, R.; Li, Y. Molecular Networks of Seed Size Control in Plants. Annu. Rev. Plant Biol. 2019, 70, 435–463. [Google Scholar] [CrossRef] [PubMed]
  56. Du, J.; Wang, S.; He, C.; Zhou, B.; Ruan, Y.-L.; Shou, H. Identification of Regulatory Networks and Hub Genes Controlling Soybean Seed Set and Size Using RNA Sequencing Analysis. J. Exp. Bot. 2017, 68, 1955–1972. [Google Scholar] [CrossRef] [PubMed]
  57. Zhao, B.; Dai, A.; Wei, H.; Yang, S.; Wang, B.; Jiang, N.; Feng, X. Arabidopsis KLU Homologue GmCYP78A72 Regulates Seed Size in Soybean. Plant Mol. Biol. 2016, 90, 33–47. [Google Scholar] [CrossRef] [PubMed]
  58. Ge, L.; Yu, J.; Wang, H.; Luth, D.; Bai, G.; Wang, K.; Chen, R. Increasing Seed Size and Quality by Manipulating BIG SEEDS1 in Legume Species. Proc. Natl. Acad. Sci. USA 2016, 113, 12414–12419. [Google Scholar] [CrossRef] [PubMed]
  59. Wang, S.; Liu, S.; Wang, J.; Yokosho, K.; Zhou, B.; Yu, Y.-C.; Liu, Z.; Frommer, W.B.; Ma, J.F.; Chen, L.-Q.; et al. Simultaneous Changes in Seed Size, Oil Content and Protein Content Driven by Selection of SWEET Homologues during Soybean Domestication. Natl. Sci. Rev. 2020, 7, 1776–1786. [Google Scholar] [CrossRef] [PubMed]
  60. Tian, Z.; Wang, J.-W.; Li, J.; Han, B. Designing Future Crops: Challenges and Strategies for Sustainable Agriculture. Plant J. 2021, 105, 1165–1178. [Google Scholar] [CrossRef]
  61. Jiang, W.-B.; Huang, H.-Y.; Hu, Y.-W.; Zhu, S.-W.; Wang, Z.-Y.; Lin, W.-H. Brassinosteroid Regulates Seed Size and Shape in Arabidopsis. Plant Physiol. 2013, 162, 1965–1977. [Google Scholar] [CrossRef]
  62. Bartels, A. Regulation of Seed Development in Arabidopsis Thaliana. Ph.D. Thesis, Saint Louis University, Saint Louis, MO, USA, 2021. [Google Scholar]
  63. Dong, N.-Q.; Sun, Y.; Guo, T.; Shi, C.-L.; Zhang, Y.-M.; Kan, Y.; Xiang, Y.-H.; Zhang, H.; Yang, Y.-B.; Li, Y.-C.; et al. UDP-Glucosyltransferase Regulates Grain Size and Abiotic Stress Tolerance Associated with Metabolic Flux Redirection in Rice. Nat. Commun. 2020, 11, 2629. [Google Scholar] [CrossRef] [PubMed]
Figure 1. Frequency distribution of soybean seed size traits, where E1 to E3 and Average represents the test environment in the years 2019 to 2021 and the average across three test environments, respectively.
Agronomy 14 01183 g001
Figure 2. Results of single-locus and multi-locus GWAS models for soybean seed size traits. (AC) GWAS results of SL, SW, and ST respectively. The SNP markers highlighted in the figure are stable QTNs that control seed size traits, which can be detected in multiple environments through the single-locus model and validated using multi-locus models. In the results of the multi-locus GWAS model, the points connected by dashed lines represent QTNs associated with seed size. The points marked in blue indicate QTNs that can be detected using only one unique multi-locus model, while the red-marked points denote QTNs that can be detected using several different multi-locus models.
Agronomy 14 01183 g002
Figure 3. Summary of GWAS results of soybean seed size traits. (A) Number of QTNs detected by single-locus GWAS in E1 to E3 environments. (B) Comparison of results between single-locus and multi-locus GWAS models. Numbers marked in green, orange, and pink represent the results of SL, ST, and SW, respectively.
Agronomy 14 01183 g003
Figure 4. The proportion of excellent alleles of QTNs in extreme accessions. (AC) PEA results of SL, SW, and ST, respectively.
Agronomy 14 01183 g004
Figure 5. The distribution of the seed size traits among individuals with different alleles on stable QTNs. (AC) Distribution results of SL, SW, and ST respectively.
Agronomy 14 01183 g005
Figure 6. Accessions with extreme phenotypes and differential expressed genes for seed size traits. (A,B) The phenotype and performance of extreme accessions in seed size traits at R4, R5, and R6 developmental stages. (C) The differential expression of 9 predicted genes in extreme accessions at seed developmental stages. ** p < 0.01, * p < 0.05.
Agronomy 14 01183 g006
Table 1. Descriptive statistics results for soybean seed size traits of 281 accessions.
TraitEnvironment aMean (mm)SDMax (mm)Min (mm)CV (%)h2
Seed lengthE18.400.7410.306.608.760.72
E28.140.639.626.227.73
E37.630.469.155.356.09
Average8.060.569.436.066.96
Seed widthE16.740.498.774.377.230.74
E26.670.418.704.636.22
E36.730.418.684.436.04
Average6.710.408.714.485.93
Seed thicknessE15.490.496.832.558.970.75
E25.570.366.803.336.55
E36.050.497.233.008.16
Average5.700.427.022.967.31
a E1 to E3 indicate the growth environment in the years 2019, 2020, and 2021, respectively.
Table 2. Stable QTNs and major loci for seed size traits detected in the present research.
TraitLocus NameChromosomeStable QTNGenomic Interval (Mb) aReported QTL/QTN b
SLSL-120Gm20_10291191.03–1.13
SL-220Gm20_3477012334.77–34.87Seed length to width ratio 3–1
SWSW-15Gm05_33708163.37–3.39Seed width 4–3
SW-26Gm06_69165186.92–7.01Seed width 4–4
SW-3/
STW-1
7Gm07_63731926.35–6.39
STST-15Gm05_4193832941.78–42.22GmST05
ST-2/
STW-1
7Gm07_63731926.35–6.39
ST-310Gm10_3903225539.03–39.17
ST-411Gm11_8523880.71–0.96Seed height 1–2
ST-517Gm17_14862066
Gm17_14942042
14.86–15.22
ST-620Gm20_31087373.09–3.41
a represents the genomic region of the LD block containing stable QTNs. b indicates that the position of this locus is consistent or close to the previously detected QTL/QTN.
Table 3. Candidate genes for soybean seed size traits within the major loci.
LociCandidate GeneArabidopsis GeneAnnotation DescriptionBiological Processes a
SW-1Glyma.05G038000AT5G16750Transducin family protein/wd-40 repeat family proteinCell division, lipid storage
ST-1Glyma.05G244100AT1G18100Phosphatidylethanolamine-binding protein
Glyma.05G246900AT3G17930Protein of unknown functionStarch biosynthetic process
ST-2, SW-3Glyma.07G070200AT1G20930Cell division protein kinaseCell proliferation
ST-4Glyma.11G010000AT2G38050,DET23-oxo-5-alpha-steroid 4-dehydrogenase family proteinBrassinosteroid biosynthetic process; brassinosteroid homeostasis
Glyma.11G012400AT4G33270Cell division cycle 20 (cdc20) (fizzy)-relatedCell division
ST-5Glyma.17G165500AT4G37390,YDK1Gh3 auxin-responsive promoterAuxin homeostasis, response to auxin stimulus
Glyma.17G166500AT2G23260Glucosyl/glucuronosyl transferasesRegulation of auxin metabolic process,Regulation of hormone levels
SL-1Glyma.20G012600AT1G14740Vernalization-insensitive protein 3Embryo development
a Candidate genes involved in biological processes that may regulate seed size [43].
Disclaimer/Publisher’s Note: The statements, opinions and data contained in all publications are solely those of the individual author(s) and contributor(s) and not of MDPI and/or the editor(s). MDPI and/or the editor(s) disclaim responsibility for any injury to people or property resulting from any ideas, methods, instructions or products referred to in the content.

