Abstract
The increase in ambient temperature decreases crop yields. Therefore, greenhouse cooling techniques can be considered adaptation strategies to climate change. To improve the efficiency of crop production, semi-closed greenhouses are utilized, which reduce the mass and energy transfer from the greenhouse. Frequently, these types of structures include an evaporative panel and a distribution system through perforated inflated ducts. To further improve the management of this type of installation, the present work models its behavior. The proper functioning of these installations greatly depends on temperature, as well as the relative humidity of the exterior air. The results show how the exterior climate conditions affect the values of temperature and relative humidity inside the greenhouse due to its effect on the value of evaporative cooling. The cooling capacity of the air per unit mass of evaporated water is reduced when the temperature and/or humidity of the air to be treated in the evaporative panel increases. Thus, when the exterior air is at 40 °C and its relative humidity is 75%, its temperature after passing through the evaporative panel is 15 °C higher than when the initial state of the exterior air is 30 °C and 30%. The effect of the use of frequency drivers in the fans on energy consumption has also been evaluated. A reduction of 8% in the frequency value causes a 22% decrease in the power consumed and a 15% pressure drop in the circuit. Therefore, reducing the frequency of electrical energy can contribute to energy savings without affecting the climate inside the greenhouse.
1. Introduction
Extreme weather conditions, the reduction in the quantity and quality of available resources, and the increased cost of raw materials threaten the sustainability of agricultural production and the resilience of agro-food companies [1]. Therefore, the addition of technology to improve the resilience of the agro-food sector has gained importance as never before. Greenhouses are used to mitigate harsh weather conditions and to allow out-of-season production [2,3]. In the main agricultural production areas, producers of specific crops choose harvesting schedules that allow them to reduce competition with other growers and areas, thus improving the economic results of their farms [4,5]. Thus, for example, in some areas in the Mediterranean region, it is common to plant in greenhouses in the summer months to avoid the high temperatures due to the humid weather and the ventilation with the exterior. However, in extreme weather conditions, with a high temperature and low relative humidity, it is indispensable to decouple the climate inside the greenhouse from the climate outside through a reduction in ventilation and the use of evaporative cooling techniques [6,7].
In addition, to improve the sustainability of agricultural production, it is necessary to develop techniques that favor energy savings and reduce emissions. Semi-closed greenhouses allow reducing energy losses due to a decrease in ventilation from the exterior environment [8,9,10]. In a theoretical study in Almeria, the climate, production, and efficiency with respect to the use of resources in a semi-closed greenhouse were analyzed [11]. The results indicated that this type of technology could be profitable thanks to the savings in resources (mainly water and power) and an increase in crop quality and yield. These types of buildings have a side aisle for air treatment installations, such as refrigeration, heating, de-humidification, and/or carbon enrichment, to improve the management of the crop and increase, quality and yield [12,13,14]. Other benefits of semi-closed greenhouses could be a reduction in water consumption—due to the decreased transfer of water vapor towards the exterior environment via ventilation—and the decreased use of pesticides as a result of limiting the entrance of insects and the transmission of diseases [15]. Among the lines of improvement in the design of semi-closed greenhouses, the reduction in energy consumption in the distribution of air is underlined [16], as well as the development of refrigeration installations in greenhouses that are efficient in different climates, such as those found in continental, Mediterranean, tropical, and desert environments [17].
Evaporative cooling installations are most efficient in warm and arid climates [18,19]. Among them, we find fan pad and fogging systems. The fan pad system allows for a greater reduction in temperature, given its better air saturation efficiency, although the homogeneity of temperature distribution is lower [20,21]. Its refrigeration potential is limited by the humidity of the exterior air [18]. Ref. [22] assessed an evaporative cooling installation equipped with a lateral pre-chamber and a system of air distribution via perforated inflatable ducts in a greenhouse located in Almeria. Among the double cropping lines, a duct was installed for the distribution of refrigerated air. The experiment was performed during the month of August in Almeria, Spain. The results showed a homogenous reduction in the greenhouse temperature and the considerable effect of the exterior climate on the efficiency of the system. In this type of installation, fans are very important components, given that they play two roles. The fans modulate evaporative cooling; the efficiency of the process decreases as the air speed increases as the air passes through the fan pad. Moreover, they regulate the distribution and cooling of the air inside the greenhouse. In order to minimize the increase in temperature of the air pushed by the ducts due to the transfer of energy from the fans, excessive speeds are not recommended. The value of evaporative efficiency is a function of the characteristics of the installation, the crop, and the initial state of the air (outside the greenhouse), decreasing with the increase in the speed of the air in the panel. In environmental conditions of 39 °C temperature and 15% relative humidity, the evaporation efficiency was reduced from 85 to 73.5% by increasing the ventilation flow rate per m2 floor area from 61 to 284 m3 m−2 h−1. On the other hand, the air temperature difference between the panel and the fan decreases with increasing speed from 6.8 °C for a ventilation flow rate per m2 floor area of 61 m3 m−2 h−1 to 2 °C for 284 m3 m−2 h−1, but there is no significant decrease beyond 180 m3 m−2 h−1 [23,24,25,26]. It must also be considered that fans are the pieces of equipment that consume most of the energy needed by the cooling system. Similar installations are used to improve the energy efficiency of air conditioning equipment. In them, the air that passes through the condenser is previously circulated through an evaporative panel using a single fan [23,24].
To know and improve the functioning of the evaporative cooling system with a pre-chamber and distribution of air through perforated inflatable ducts, in the present work, the installation experimentally evaluated by [22] will be modeled. Extreme climate conditions were utilized, typically found in summer in warm areas and with different values of ambient humidity. Also, the air distribution system was modeled, and the use of a variable frequency drive, as a power savings feature, was simulated to determine its effect on the efficiency of the system. The main contribution of this work is to quantify the effect of the state of the exterior air on the climate inside a greenhouse with a fan pad system and air distribution through perforated inflatable ducts. In addition, energy savings are estimated by installing frequency drives in the fans.
The article has been structured into five chapters, including an introduction that includes a review of the state of the art, and the proposal from this study (above). The materials and methods section describes the installation used, the procedure proposed for its dimensioning and the conditions used in this study. The results and discussion section discusses the dimensioning of the installation, the temperature of the air treated in the fan pad, the specific consumption of water, the evaporative performance, the temperature inside the greenhouse and the effect of a variable frequency drive in the fan, on energy consumption and the climate inside the greenhouse. The conclusions section presents our results, and a list of the bibliographical references is cited.
2. Materials and Methods
The installation described in [22] was utilized. This is a pepper greenhouse with an area of 360 m2, composed of two modules measuring 8.0 × 22.5 m2, with a gothic style roof, with a height at the channel of 4.0 m, and 5.5 m at the ridge. The cultivation was performed on sand in six paired rows 17 m in length. The separation between the rows was 1.60 m, and 0.75 m inside the row (Figure 1). The greenhouse is located in Almeria, Spain (36°54′19″ N 2°21′29″ W). The cooling system was sized depending on the climate in the area, and the characteristics of the greenhouse and crop, considering the recommendations found in the literature on the state of the art [24,27].
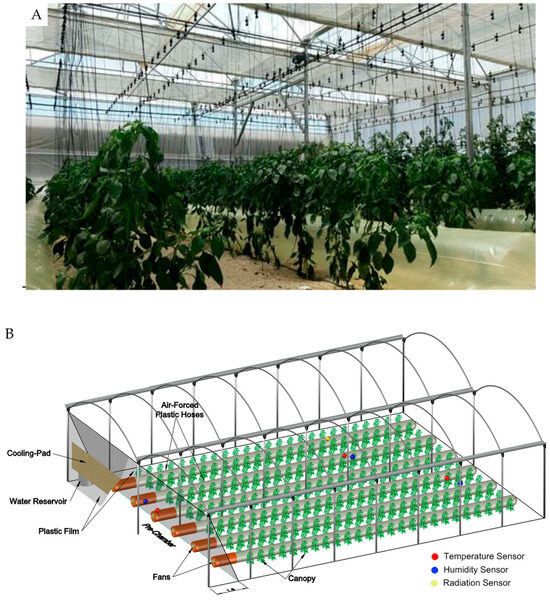
Figure 1.
(A) Image of the interior of the greenhouse with the inflatable tubes perforated between the crop rows; (B) Diagram of the refrigeration installation with the pad, the pre-chamber, the fans and the ducts inside the greenhouse.
The analysis of the cooling process allows us to obtain a value for the temperature and relative humidity of the air after passing through the fan pad ( and ). The optimal flow rate of the installation is what is necessary to guarantee its correct operation. The optimum point of functioning of the installation was determined, defined by the flow rate and pressure values needed to circulate the air through the fan pad and the distribution system. The nominal flow rate of the fan corresponds to the highest value of its performance. It is necessary to choose a commercial fan with nominal conditions (flow rate and pressure loss corresponding to the maximum value of its performance) that are the most similar to the optimum functioning of the installation. The operational flow rate of the fan is the actual operating value. It must be as close as possible to the values of the optimal flow rate of the installation and the nominal flow rate of the fan. The operational flow rate and pressure of the fan were determined, and the energy provided by the air through this propulsion system was considered in order to estimate the temperature of the air in the distribution system. Next, the temperature and relative humidity inside the greenhouse were obtained and compared with the set-point value to establish the technical viability of the installation (Figure 2). Lastly, the effect of the use of a variable frequency drive on the reduction in the consumption of energy of the air propulsion system was assessed.
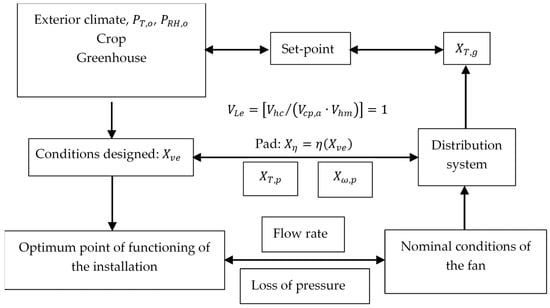
Figure 2.
Operation diagram of the fan pad and air distribution system. After setting the climate threshold in the greenhouse, the optimal operating point of the installation is obtained, a fan with a similar nominal operation is chosen, and the operational status of the installation is calculated. Finally, the climate in the greenhouse under these conditions is determined.
2.1. Sizing of the System
In the analysis of the cooling and air distribution system, the following assumptions were used to simplify the mass and energy transfer balances [28]:
- The pad material is uniformly and completely wetted;
- The transfer coefficients of mass and energy by convection of humid air on the surface of liquid water are constant;
- The thermal properties of air and water are constant;
- The temperature at the water–air interface is constant and uniform;
- Le = 1;
- The air close to the water–air interface is saturated at the water temperature;
- The air temperature only changes in the x-direction;
- The air is considered incompressible.
It is assumed that the transfer of heat of the air during evaporative cooling is only due to the change in phase. Therefore, the cooling of the air in the panel is only due to the evaporation of water in the panel. It must be considered that the evaporative pre-chamber includes heat insulation that is enough to ignore energy transfer due to solar radiation. Also, the amount of time in which a specific air mass is found in the pre-chamber is very low.
2.1.1. Optimal Point of Operation of the Installation
Starting with the value of the perturbations (, , , ), and considering the characteristics of the greenhouse and crop, the set-point values for the temperature () and relative humidity values () that must be maintained in the greenhouse are defined. The cooling system was sized so that the value of is similar to the set-point value.
The values of the pad area () and the air speed as it passed through it (), that is, the flow rate of the treated air, , were adopted in agreement with the recommendations of the specialized scientific literature. Generally, a ventilation rate of 120–150 m3 m−2 h−1 permits satisfactory operation. The pad area should be about 1 m2 for 20–30 m2 of greenhouse floor area [24]. In our case, the surface of the panel is slightly higher, and the flow rate is slightly lower than these recommendations. Thus, the air speed ensures high evaporative efficiency, low pressure loss and low energy consumption of the fan. Starting with the expressions of sensible () and latent () heat transferred between the air and the pad, and given that the state of the exterior air was known, we determined the temperature and the relative humidity of the air as it exited the pad ( and , respectively) (Appendix A).
is used for the initial estimation of the pressure that must be maintained by the fan. For this, the initial value of its diameter was established, , which also coincided with that of the perforated inflatable ducts. The distribution of the air toward the greenhouse was calculated with a number “” of perforations placed in “” lines along the duct, which are equidistant to each other by length “” (m) for the total length of the duct, “” (m). If two contiguous lines are generically named “” and “”, with defined as the value of the total pressure needed to maintain the flow of the air in the duct, the following equation is found (Appendix B):
The total pressure needed for the functioning of the installation is equal to the sum of the loss of pressure in the pad and duct. The loss of pressure in the pad can be expressed as a function of through a second-degree polynomial equation, according to the manufacturer’s manual (CELdek 7060-15, Munters, Stockholm, Sweden) [29], which in this case results in:
The that can be provided by the fan, guaranteeing the necessary pressure in the installation, was determined, and was calculated taking into account the difference between the state of the air in the system and that utilized by the manufacturer to characterize the fan. This value was used to correct the evaporative efficiency values and the state of the air values when exiting the pad. Next, the state of the air when exiting the ducts was determined, considering the flow of energy transferred to the air when exiting the pad (energy consumed by the fan and transfers of energy through radiation and conduction–convection in the duct (Appendix C).
2.1.2. Climate Inside the Greenhouse
The increase in temperature in the distribution system was considered in the balance of energy in the greenhouse to obtain a value of the air temperature inside the greenhouse, . Given the configuration of the cooling system, the air treated in the pad was added to that which entered the greenhouse due to renewal with the exterior air. The evapotranspiration of the plants and the soil also contribute toward the variation in the energy content in the greenhouse. Also, the energy is transported through conduction from the greenhouse to the floor. Lastly, it was necessary to take into account the transfer of energy due to conduction–convection and the increase in the energy content in the greenhouse due to solar radiation. In the expression of this last term, the temperature of the greenhouse roof was utilized (). To determine its values, a balance of energy was performed considering the transfer of energy to the roof due to solar radiation and the transfers due to external and internal convection (Appendix D).
The determination of was performed starting with the balances of matter and energy, considering the greenhouse as an open system (control volume), with the entry of matter and energy from the pad through the distribution system and a generic exit of matter and energy. If we consider that the variation in energy in the greenhouse is approximately equal to the energy as heat transferred to and from the greenhouse, in a instant and a posterior , with being 10 s, then the value of relative humidity in the interior of the greenhouse can be obtained as (Appendix E):
where, given the characteristics of the functioning of the fan pad system, it was considered that the enthalpy of the air and the vapor at the exit ( and ) approximately coincided with the values in the greenhouse at instant ( and ).
2.2. Technical Viability of the System
The functioning of the system was modeled with different climate conditions, with the exterior temperature varying between 30 and 40 °C, and the exterior relative humidity varying between 30 and 75 %. The technical viability of the refrigeration installation was analyzed as a function of the exterior climate. The operation was analyzed from an energetic point of view. The frequency of the power used to maintain the installation was varied to define the possibilities of energy savings. The initial value of the frequency of the electrical energy at 50 Hz was modified, and , , and were determined. For this, the equations that were valid for the nominal conditions of the fan were utilized. Lastly, the effect of the variation in the energy consumed on the temperature of the greenhouse was determined.
3. Results and Discussion
3.1. Cooling System and Air Distribution
To meet the technical specifications of this installation, an air speed of 0.50 m s−1 was assumed to pass through the pad, resulting in a flow rate of 6350 m3 h−1 and a loss of static pressure of 180 Pa. To satisfy the needs of the installation, a fan was selected with the appropriate optimum point of proper functioning, with the values of the properties shown in Table 1.

Table 1.
Technical characteristics of the cooling system (area and thickness of the pad, unit and total flow rate, performance and angular speed of the fan, air speed in the pad, and discharge speed into the duct).
The selection of the fan must guarantee the functioning of the installation in the most unfavorable conditions. As for its regulation, if the nominal flow rate is greater than the flow rate planned, the increase in the air speed leads to a decrease in efficiency, that is, an increase in the air temperature as it exits the pad. Also, the power consumed by the fan is proportional to the flow rate, and as a result, there is an increase in the temperature of the air that enters the greenhouse due to renewal. Another consequence of the increase in flow rate is the increase in the dynamic pressure required in the circuit. However, if the flow rate is less than the flow rate planned, the speed decreases, which leads to an increase in the evaporative efficiency, that is, a decrease in temperature as it exits the pad. Also, the power consumed by the fan is reduced, which translates into an additional decrease in the temperature of the air that enters the greenhouse due to renewal. Thus, to regulate the flow rate in the installation, the best values vary between 85 and 105% of the nominal flow rate of the fan. In this way, the performance will be similar to the maximum value, thereby meeting the specific guidelines, which recommend the maximum performance of the fan.
To improve the functioning of the installation, we did not only have to take into account the maximum performance of the fan. We must also reduce the use of energy, and for this, we must limit the loss of pressure in the circuit. For example, the specific guidelines limit the loss of pressure due to the air diffusion elements to values between 40 and 200 Pa. It is necessary to guarantee a considerable value of the loss of pressure to ensure a homogeneous distribution of the cooled air, and ultimately, of the temperature inside the greenhouse.
3.2. Evaporative Cooling
Figure 3 shows a representation of evaporative cooling processes as a function of the state of the exterior air. The angle between the and axes is 90°. The angled curvilinear lines represent states of air with the same values. The angled rectilinear lines represent states of air with the same values.
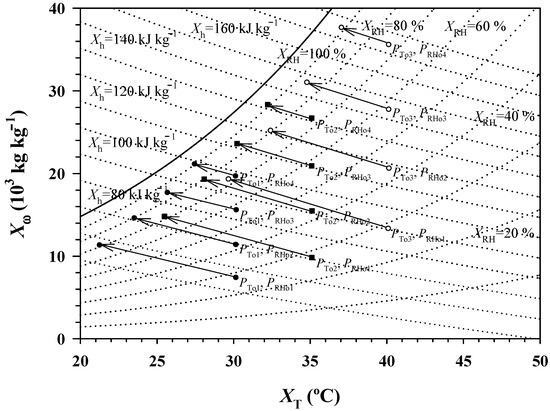
Figure 3.
Diagram of (°C) as compared to (103 kg kg−1) with the representation of (%) and (kJ kg−1) lines. The oriented segments represent the evaporative cooling processes in the pad for the initial states of the exterior air at different temperatures ( = 30 °C, black circles; = 35 °C, black squares; = 40 °C, white circles) and relative humidity ( = 30%, = 45%, = 60% and = 75%).
Figure 3 shows the processes of evaporative cooling starting with different initial states of the air to be treated by the fan pad system. When the initial temperature of the air is moderate (for example, = 30 °C), the processes are practically isenthalpic ( = cte). However, when and increase towards extreme values (between 35 and 40 °C, or from 60 to 75%), enthalpy, , tends to increase throughout the process. Therefore, a greater consumption of water per unit of mass of air treated in the pad is observed. Thus, for the value of = 30%, the decrease in the temperature will be 9.0, 9.5 and 10.0 °C, and the variation in the relative humidity of the air will be 4.0, 5.0 and 6.0 when the value of is 30, 35, and 40 °C, respectively. However, for a value of = 75%, the decrease in temperature is 2.7, 2.8 and 3.0 °C, and the variation in the relative humidity of the air is 1.5, 1.8 and 2.0, when the value of is 30, 35 and 40 °C, respectively. That is, the relation between the cooling of the air and the increase in its relative humidity decreases from 2.2, 1.9 and 1.8 °C, when is 30%, to 1.8, 1.7 and 1.6 °C, when is 75%, if the temperature in the air to be treated is 30, 35 and 40 °C, respectively. We are dealing with an approximate reduction of 20% in the capacity to cool per unit of water evaporated with the values utilized in the present work when increases, if is maintained constant, or when increases, if is constant. This is an additive effect, so if and the increase, the cooling capacity is reduced by 35% with the values utilized in the present work. Despite the differences between the processes described, in every case, the evaporative efficiency of the pad, , barely varied between 75 and 76%. These results are similar to those found in the application of an evaporative panel to improve the efficiency of an air conditioning installation [23].
3.3. Temperature of the Air as It Exits the Pad
Figure 4 represents the value of the air temperature as it exits the pad (, °C) as a function of the initial state of the air to be treated, provided by and . The result is a linear increase in the values as and increase.
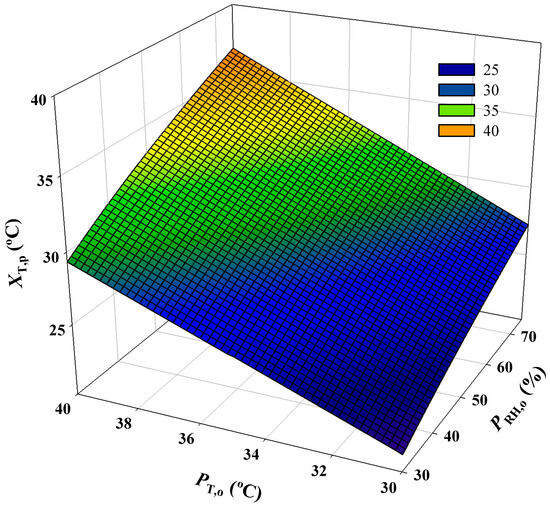
Figure 4.
Changes in the temperature values of the air as it exits the pad, as a function of its initial state.
The values estimated in the present work are correlated linearly with those that were experimentally determined by [22]. In the conditions of the assay, the temperature of the air as it exited the pad, , varied between 21.2 and 36.9 °C when = 30 °C and = 75% and when = 40 °C and = 30%, respectively. The value of increased with and with . The values of came closer to as increased (The relation is 0.81 for 30% and 0.96 for 75%). For its part, the increase in , when varied and was constant was less, and it barely increased with the value of .
Figure 5 shows an existing correlation between the values measured and calculated. The values of the statistical indices utilized to assess the fit are shown in Table 2. The values of determined in the present work are similar to those found by [22] starting with the values of obtained experimentally and assuming evaporative cooling without sensible heat transfer. The comparison between the values of obtained in either of these cases did not differ by more than 10%. The greatest differences were found in the values of corresponding to high values, that is, when the solar radiation was highest and greatly interfered with the experimental results. The statistical indicators utilized to evaluate the model showed a high correlation between the values of obtained by both methods.
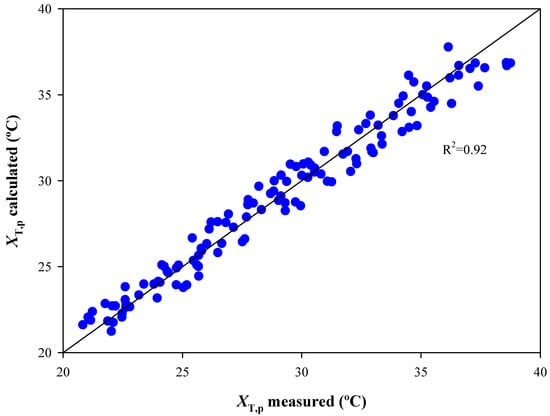
Figure 5.
Regression of calculated starting with the balances of mass and energy as compared to the value measured experimentally.
Table 2.
Statistical indices (Appendix F) for assessing the goodness of fit of the calculation model.
3.4. Evaporative Cooling and Performance
Figure 6 shows a relationship between the values of specific consumption of water () and those of evaporative performance (, %) as a function of the exterior climate. The highest values were reached with high and values and low . As the and decreased, the values of increased, while those of decreased. In order to optimize the functioning of the fan pad system, it is necessary to establish a relationship between the different indicators of efficiency of the functioning of the fan pad system. The evaporative performance (%) is defined as the relationship between the real increase in relative humidity, and the maximum increase in evaporative cooling possible. When is constant, its value increases in a practically linear manner with , with the slope decreasing along with the value of (75 %). When is constant, the value of barely varies with .
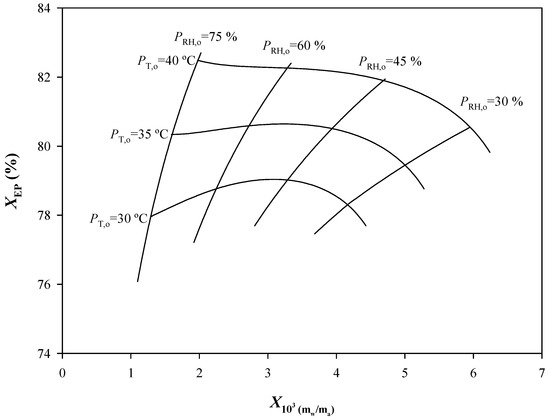
Figure 6.
Relationship between the specific consumption of water and evaporative performance of the fan pad system as a function of the state of the exterior air.
Figure 7 shows the relationship between the and values as a function of the initial state of the air ( and ). In all the states represented, the fan pad system obtained an evaporative efficiency value of that was approximately constant (75–76%). However, the influence of the exterior climate on the and values were very important. The relationship between the values of and in the intervals of and utilized were slightly curvilinear, with mean slope values in the intervals of the conditions of the exterior air practically constant. The mean slopes of the lines when is constant, and of the lines when is constant, tend to increase, with their values decreasing when these variables increase. The mean values of the slopes when is constant are 2.1, 2.0 and 1.9 °C, for 30, 35, and 40 °C, respectively. The mean values of the slopes when is constant are 1.0, 0.8, 0.7, and 0.6 °C for 30, 45, 60, and 75%, respectively. When the value of is 40 °C, and is 75 %, the value of is 2.0, and that of is 3.2 °C, while when is 30 %, the values of these variables are practically tripled (5.9 and 10.7 °C, respectively), with the increase in the value being greater. These results demonstrate that evaporative cooling is an adequate technique for cooling a greenhouse, especially in warm and dry climates, although its main drawback is water consumption [7]. An explanation of the different behaviors of the fan pad system as a function of the characteristics of the exterior air seems adequate due to the properties of the water vapor as opposed to the characteristics of the evaporative cooling process.
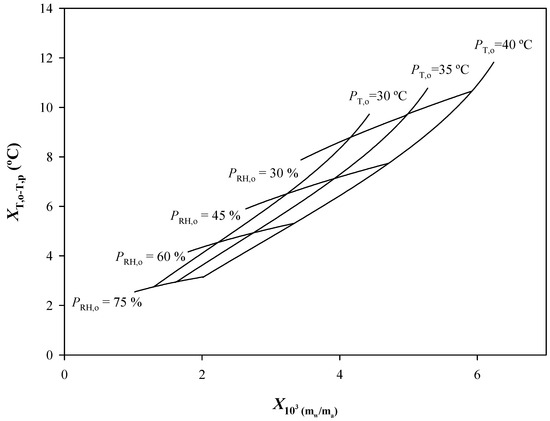
Figure 7.
Relationship between the specific consumption of water, , and evaporative cooling, , as a function of the state of the exterior air.
The relationships between the values of the and the , when is constant, are analogous to those determined in [22]. However, it is necessary to take into account the difference between the range of values found starting with the experimental data in that study and those obtained in the present one. Thus, the differences between the values of and found in both works as increased can be explained, and are perhaps due to the effect of solar radiation on the experimental results.
3.5. Temperature inside the Greenhouse
The temperature inside the greenhouse, , varied as a function of the exterior climate, as shown in Figure 8. The value of increased proportionally with and .
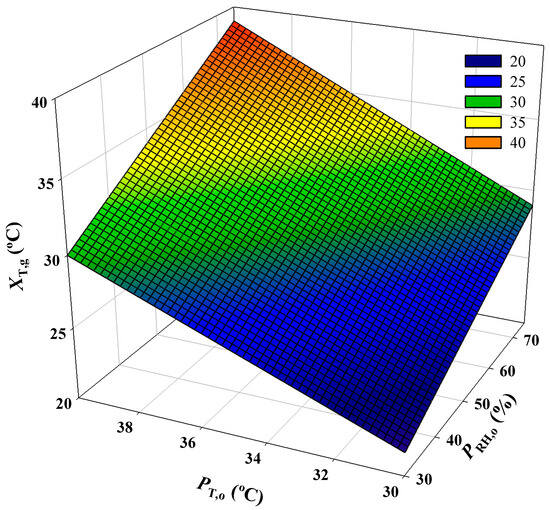
Figure 8.
Variation in as a function of the exterior climate, and .
Figure 9 shows the cooling of the air inside the greenhouse with respect to the exterior temperature . Its value increased as decreased and did not really change with .
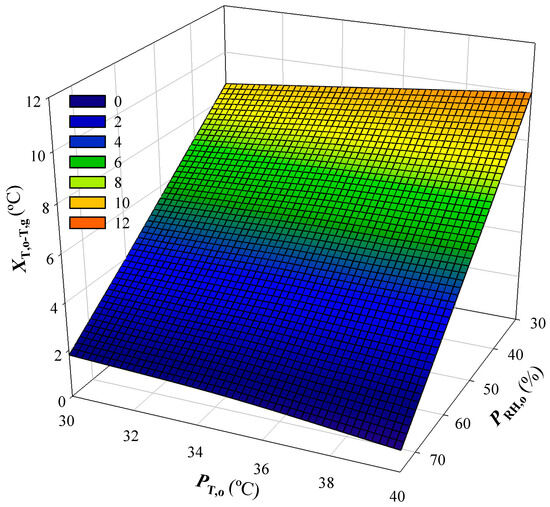
Figure 9.
Variation in the cooling of the air inside the greenhouse, , as a function of the exterior climate, and
The values of decreased from the state of the exterior air, of = 40 °C and = 75%, to those characterized by = 30 °C and = 30%. Also, the values of increased together with the value of when was constant. Therefore, the efficiency of these systems in reducing the values of is greater in dry climates. These results are a limitation of the set-point values of temperature in the greenhouse when using this type of installation. As a function of the climatic conditions, it may be impossible to achieve specific values of set. To better understand the effect of climate on the values of , we must analyze the cooling values produced in the greenhouse (Figure 8). It can be observed that the decrease in temperature between the exterior air and the greenhouse, , was practically a function of , with the cooling value at = 30% varying between 8.6 °C when = 30 °C and 10.0 °C when = 40 °C. However, when = 75%, the cooling value varied between 0.9 °C, if = 40 °C, and 1.8 °C if = 30 °C (Figure 9). Other works have described a notable reduction in the efficiency of cooling in humid climates [22,30]. In [31], the authors found a significant decrease in the cooling of a multi-span greenhouse with a rose crop (Rosa indica L. cv ‘Mercedes Long) in a climate with a temperature of 35 °C and a relative humidity of 50 %. However, Ref. [32] indicated that tropical regions, such as Malaysia, were very adequate for the use of fan pad evaporative cooling systems. In [33], the authors found that the most efficient method for cooling a single span ridge greenhouse in a dry and hot region in summer in India was fan pad evaporative cooling. Lastly, Ref. [34] discovered that the fan pad based evaporative cooling systems were very compatible with dry climates, such as those found in Jordan.
3.6. Variation in the Frequency of the Extractor Driver
Table 3 shows the values of fan power, (W), flow rate provided, (m3 h−1), loss of pressure in the duct, (Pa), and the global coefficient of energy transfer by convection–conduction between the duct and the air inside the greenhouse, (W m−2 °C−1), for the different frequency values of electrical energy, , (70, 50 and 30 Hz). The climate conditions in the exterior were provided by values of (35 °C), (30%) and (800 W m−2).
Table 3.
Values of the unitary properties of the functioning of the extraction–driving system for frequencies of 30, 50 and 70 Hz. External conditions: : 35 °C, : 30%, : 800 W m−2.
The energy consumption of the installation can be reduced by varying the angular speed of the fan by modifying the frequency of the electrical energy, (Hz). In all the calculations of the energy consumed, it was assumed that the consumption of energy of the variable frequency drive was 10% of the consumption of the fan. However, the use of the variable frequency drive allowed reducing the consumption of energy of the installation with respect to the functioning in nominal conditions. Although the transfer of energy improved with the increase in , the consumption of energy and the losses of pressure also increased.
Table 4 shows the values of (W), (m3 h−1), and (Pa) produced by the fan selected when the nominal value of (Hz) was reduced between 50 and 46 Hz. The climate conditions in the exterior are given by values of (35 °C), (30%) and (800 W m−2).
Table 4.
Values of the unitary properties of the functioning of the extraction–driving system for frequencies between 50 and 46 Hz. External conditions: : 35 °C, : 30%, : 800 W m−2.
A decrease in of 8% lead to the same decrease in fan rotation speed (m3 h−1). However, (W) decreased by 22% and (Pa) by 15%. Therefore, the reduction in can be thought of as an energy savings measure, and it also leads to a decrease in the consumption of water, given that the decrease in the value of improved evaporative efficiency (%). To reduce the losses of pressure during the transport of cooled air, and to improve the energy efficiency of the installation, inflatable plastic ducts that increase in their cross-sectional area from the start of the duct next to the fan to the end of the crop cultivation lines could be utilized.
The comparison of the values found in Table 3 and Table 4 for the nominal value of (50 Hz) explains the effect of the air humidity on the energy parameters of the installation. Thus, when the value of changed from 30 to 60% (Table 3 and Table 4, respectively), an increase in power was observed (), along with a loss of pressure () and a reduction in flow rate (). An explanation can be found in the analysis of the characteristics of evaporative cooling (Figure 3). When the initial temperature () and humidity () of the air increase, the air enthalpy () increases during the cooling process. The energy needed to transport this humidified air is proportional to this variation in enthalpy so that the power of the fan is greater if the air is warmer and more humid. This increase in power increases the loss of pressure, which reduces air speed, and therefore its flow rate in the distribution system.
Figure 10 shows the temporal changes in as a function of . The changes in the functioning of the extraction–driving systems due to the variation in the frequency utilized did not actually affect the value. As the value of the frequency decreased, the initial value of the temperature in the interior of the greenhouse tended to increase, although its stationary value tended to be lower.
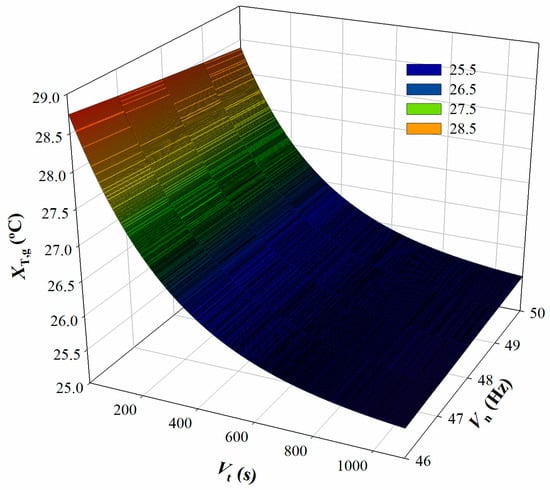
Figure 10.
Temporal change in the temperature in the interior of the greenhouse, , as a function of the frequency of the electrical current that powers the fans, .
The transitory analysis of the response of to the functioning of the evaporative cooling and air distribution system shows a correspondence with a first-order system. As the value of decreases, the value of the system gain tends to increase, while that of the time constant tends to decrease.
Semi-closed greenhouses with a side aisle tend to improve the efficiency of water use. The quantity of water saved is proportional to the capacity of the cooling system installed. Therefore, the design of a semi-closed greenhouse can be improved by including two side aisles (for example, on the eastern and western sides of the greenhouse) with evaporative panels. In this manner, the length of the air distribution ducts is reduced to less than half, leaving a central aisle that is parallel to the side ones. This change in design translates into a reduction in the loss of pressure in the air transfer circuit, and therefore of the energy consumed.
With respect to the regulation of the flow rate, it is necessary to analyze the resulting energy needs when the exterior climate variables change, as they have an effect on the greenhouse climate. These are temperature, ambient humidity, solar radiation, or wind speed, as well as the action of other climate control elements such as shading and/or ventilation. The values obtained from the energy demand must be satisfied through a multi-factorial decision, considering the flow rate and the loss or pressure. To adapt the functioning of the fan, the installation of a variable frequency drive could help meet the needs of the installation, by decreasing the power required and the energy consumed by the installation. Ref. [35] tested the performance of the R410A inverter air conditioner system (3.5 kW capacity) with an evaporatively cooled unit by varying the input conditions. The coefficient of performance (COP) was improved by 18.32% at the lowest compressor frequency (30 Hz) and water flow rate of 200 L h−1.
Semi-closed greenhouses allow the use of strategies that are different from conventional greenhouses. Thus, Ref. [10] concluded that to obtain all the advantages of semi-closed greenhouses, growers must reduce the frequency of ventilation and accept higher values of temperature and relative humidity during the summer.
4. Conclusions
The initial state of the exterior air had an influence on the functioning of an evaporative cooling installation for the cooling of greenhouses. Although the evaporative efficiency hardly varied, the temperature of the air treated in the panel and the temperature in the greenhouse increased with the initial temperature and humidity of the air. The cooling of the inside air hardly varied with the exterior temperature and increased proportionally to the decrease in the relative humidity of the exterior air. The set temperature points in the interior of the greenhouse can be compromised as a function of the exterior climate. The reduction in the frequency of the electrical energy through a variable frequency drive can help by saving energy, without affecting the temperature values inside of the greenhouse. It would be interesting to assess other strategies, such as the use of perforated flexible ducts of variable-size cross-sections to assess the reduction in losses in pressure. More analyses are needed of this type of greenhouse cooling system that can contribute towards the adaptation of crops to the effects of climate change.
Author Contributions
Conceptualization, J.M.C.-Z., J.F.-P. and F.R.; methodology, S.P.-P., J.M.C.-Z., J.F.-P. and F.R.; software, S.P.-P. and F.R.; validation, S.P.-P., J.M.C.-Z., J.F.-P. and F.R.; formal analysis, S.P.-P., J.M.C.-Z., J.F.-P. and F.R.; investigation, S.P.-P., J.M.C.-Z. and F.R.; resources, J.M.C.-Z. and J.F.-P.; data curation, S.P.-P. and J.M.C.-Z.; writing—original draft preparation, S.P.-P., J.M.C.-Z. and J.F.-P.; writing—review and editing, J.M.C.-Z., J.F.-P. and F.R.; visualization, J.M.C.-Z. and F.R.; supervision, J.M.C.-Z. and J.F.-P.; project administration, J.M.C.-Z. and F.R.; funding acquisition, J.M.C.-Z. and J.F.-P. All authors have read and agreed to the published version of the manuscript.
Funding
This study is part of the AGROALNEXT program (AGROALNEXT/2022/048) and was supported by MCIN with funding from the European Union NextGenerationEU (PRTR-C17.I1) and the Generalitat Valenciana.
Data Availability Statement
The original contributions presented in the study are included in the article, further inquiries can be directed to the corresponding author.
Conflicts of Interest
The authors declare no conflicts of interest.
Abbreviations
| P | Perturbance variable |
| X | Unknown variable |
| V | Known value variable |
| C | Constant value variable |
| Variables | |
| T | temperature (K, °C) |
| RH | Relative humidity (%) |
| p | Pressure (Pa) |
| vv | Wind speed outside (m s−1) |
| Dv | Wind direction outside (°) |
| SR | Solar radiation outside (W m−2) |
| PAR | Photosynthetically active radiation (µmol m−2 s−1) |
| η | Evaporative efficiency of the fan pad system (%) |
| ω | Relative humidity of the air (kgv kga−1) |
| ve | Wind speed as it passes through the pad (m s−1) |
| v | Wind speed (m s−1) |
| Q | Energy exchanged as heat (J) |
| W | Mechanical power transferred by the fan (W) |
| μ | Fan performance (%) |
| t | Time (s) |
| m | Mass (kg) |
| V | Volume (m3) |
| cp | Specific heat (J kg−1 K−1) |
| λ | Latent heat (J kg−1) |
| hc | Coefficient of energy transfer as heat due to convection (W m−2 K−1) |
| hm | Coefficient of mass transfer (kg m−2 s−1) |
| Le | Lewis number (-) |
| ξ | Porous surface per unit of volume of the panel (m2 m−3) |
| B | Base or thickness of the panel (m) |
| H | Panel height (m) |
| δ | Thickness of the panel (m) |
| x | Direction perpendicular to the main area of the panel (m) |
| ρ | Density (kg m−3) |
| P | Proportionality coefficient characteristic of the panel (kg sn−3 m−n K−1) |
| β | Factor of integration (sn−1 m−n) |
| n | Coefficient characteristic of the panel (-) |
| i | number of perforations in a line of perforations (-). |
| N | Number of perforation lines along the inflatable distribution line (-). |
| L | Space between contiguous perforation lines along the inflatable duct (m) |
| M | Total length of the inflatable duct (m) |
| f | Darcy friction factor (-) |
| Re | Reynolds number (-) |
| D | Diameter of the inflatable duct (m) |
| C | Coefficient of localized pressure losses in a duct (-) |
| pe | Static pressure in the interior of the hose (Pa) |
| pd | Dynamic pressure in the interior of the hose (Pa) |
| E | Extinction coefficient of solar radiation (-) |
| A | First coefficient of crop evapotranspiration (s2 m−2) |
| B | First coefficient of crop evapotranspiration (s m−1) |
| LAI | Leaf area index (m2 m−2) |
| VPD | Vapor pressure deficit (Pa) |
| ET | Evapotranspiration (kg m−2 s) |
| d | Depth (m) |
| k | Coefficient of thermal conductivity (W m−1 s−1) |
| hcc | Global coefficient of energy transfer by convection–conduction between the duct and the air in the greenhouse (W m−2 °C−1) |
| S | Surface (m2) |
| α | Radiation absorption coefficient (-) |
| τ | Radiation transmission coefficient (-) |
| σ | Stefan-Boltzmann constant (5.67·10−8 W m−2·K−4) |
| K | Global heat transfer coefficient (W m−2 K−1) |
| F | Flow rate (m3 s−1) |
| h | Specific enthalpy (J kg−1) |
| n | Angular frequency (Hz, rpm) |
| Other sub-indices | |
| v | Vapor |
| a | Air |
| w | State of adiabatic saturation |
| w | Humid, referring to temperature |
| p | Pad |
| c | Evaporative pre-chamber |
| o | Exterior |
| o | With evapotranspiration, reference |
| g | Greenhouse |
| pid | perforated inflatable duct |
| e | Exit |
| s | Saturated |
| se | Sensible |
| la | Latent |
| cr | Crop |
| so | Soil |
| rad | Radiation |
| cov | Roof |
| enc | Enclosure |
| fl | Floor |
| atm | Atmospheric |
| ter | Thermal |
| cd | Conduction |
| cv | Convection |
| cc | Conduction-convection |
| des | Design |
Appendix A
Characteristics of the air as it exits the pad. As a function of its thickness (), each pad has a relationship between its evaporative efficiency () and the wind speed as it passes through the panel, , which can be obtained from the expression of sensible heat, . If the normal direction of main section of the pad is named , the value of exchanged by the air with a movement of per unit of time:
If the variables are separated and integrated between the initial state of the air (; ) and the final 2 (; ) in the process of evaporative cooling, we obtain:
By solving the equation, we obtain:
If we substitute between and in the expression of the evaporative efficiency of the cooling panel, we obtain:
As a function of the characteristics of the panel, there is a relationship between the coefficient of convection, , and , which responds to the generic expression given by [27]. If it is substituted in the expression (A4) of the evaporative efficiency value, we obtain:
If we make (A5) and (A4) equal to each other, we obtain:
Analogously, the value of the relative humidity of the air as it exits the panel, , can be obtained from . That is:
When separating the variables and integrating between the initial state of the air 1 (; ) and the final 2 (; ), we obtain:
In the case that the relationship was taken into account, assuming that [27], that is, in the case that the evaporative cooling was considered adiabatic, solving we obtain:
Or
Appendix B
Initial sizing of the air distribution system. The distribution of the air toward the greenhouse is performed through a number of perforations along lines equidistant to each other throughout a hose of length (m) on the total length of the duct, (m). Between two contiguous lines, generically named and , with , the pressure decreases in the direction of the forward movement of the flow of the air due to continued losses of pressure or due to friction () and singular or localized losses (). The balances of the matter and energy applied to a control volume in the hose allow us to relate the speed at the start of the hose with the speed in position , and the difference between static pressure () in two contiguous lines of perforations throughout the same duct, e .
Solving,
Therefore, the value of the static pressure needed to maintain the flow of air in the duct is:
And the total pressure is:
The value of can be obtain according to [36] as:
Appendix C
Determination of the temperature in the perforated inflatable duct. The state of the air as it exits the ducts is determined considering that the flow of energy transferred to the air from its exit from the pad is constant (the energy consumed by the fan and the transfers of energy due to radiation and conduction–convection on the duct), so that the increase in temperature along the duct can be obtained as:
Therefore, the mean value of the air temperature in the duct is:
Appendix D
Temperature in the interior of the greenhouse. The energy that enters the greenhouse from renewal from the exterior is obtained as
The evapotranspiration of the plants and soil also contributes to reducing the energy content of the greenhouse, resulting in:
The greenhouse also loses energy due to conduction through the floor
On the other hand, the energy content of the greenhouse increases due to solar radiation
Lastly, the energy exchanged due to conduction–convection is
In expression (A20), the greenhouse roof temperature is used (). To determine its value, the energy in the system must be balanced. Thus, the transfer of energy to the roof due to solar radiation is:
The transfer due to exterior and interior convection are, respectively:
Appendix E
Determination of relative humidity of the air in the interior of the greenhouse. The balances of the matter (dry air and water vapor) and energy, considering the greenhouse as an open system (control volume) with the entry of matter and energy, from the pad through the perforated plastic duct, and the exit to the exterior of matter and energy, are, respectively:
If value is removed from expression (A27) and substituted in (A28), taking into account the definition of relative humidity (), we can obtain an expression for . If we consider that the energy as heat transferred to and from the greenhouse, in an instant and a posterior instant , is approximately equal to the variation in energy in the greenhouse, then the value of relative humidity in the interior of the greenhouse can be obtained as:
where it is considered that the enthalpy of the air and the vapor as they exit ( and ) approximately coincide with the values in the greenhouse at instant t’ ( and ).
Appendix F
Statistical indices. The statistical indices used for the model assessment were calculated as follows:
where and are the observed (measured) and the predicted (calculated) values, respectively; is the mean of the observed values; n is the sample size. Optimal values for the indices are , , , , and .
References
- Tawalbeh, M.; Aljaghoub, H.; Alami, A.H.; Olabi, A.G. Selection criteria of cooling technologies for sustainable greenhouses: A comprehensive review. Therm. Sci. Eng. Prog. 2023, 38, 101666. [Google Scholar] [CrossRef]
- Dehbi, A.; Youssef, B.; Chappey, C.; Mourad, A.-H.; Picuno, P.; Statuto, D. Multilayers Polyethylene Film for Crop Protection in Harsh Climatic Conditions. Adv. Mater. Sci. Eng. 2017, 2017, 4205862. [Google Scholar] [CrossRef]
- Moreno-Teruel, M.Á.; Molina-Aiz, F.D.; López-Martínez, A.; Marín-Membrive, P.; Peña-Fernández, A.; Valera-Martínez, D.L. The Influence of Different Cooling Systems on the Microclimate, Photosynthetic Activity and Yield of a Tomato Crops (Lycopersicum esculentum Mill.) in Mediterranean Greenhouses. Agronomy 2022, 12, 524. [Google Scholar] [CrossRef]
- Sahdev, R.K.; Dhingra, A.K.; Kumar, M. A comprehensive review of greenhouse shapes and its applications. Front. Energy 2019, 13, 427–438. [Google Scholar]
- Ghani, S.; Bakochristou, F.; ElBialy, E.M.A.A.; Gamaledin, S.M.A.; Rashwan, M.M.; Abdelhalim, A.M.; Ismail, S.M. Design challenges of agricultural greenhouses in hot and arid environments—A review. Eng. Agric. Environ. Food 2019, 12, 48–70. [Google Scholar] [CrossRef]
- Katsoulas, N.; Sapounas, A.; De Zwart, F.; Dieleman, J.A.; Stanghellini, C. Reducing ventilation requirements in semi-closed greenhouses increases water use efficiency. Agric. Water Manag. 2015, 156, 90–99. [Google Scholar] [CrossRef]
- Hegazy, A.; Farid, M.; Subiantoro, A.; Norris, S. Sustainable cooling strategies to minimize water consumption in a greenhouse in a hot arid region. Agric. Water Manag. 2022, 274, 107960. [Google Scholar] [CrossRef]
- Quillec, S.L.; Albert, B.; Lesourd, D.; Loda, D.; Barette, R.; Brajeul, E. Benefits of a semi-closed greenhouse for tomato production in the West of France. Acta Hortic. 2017, 1170, 883–888. [Google Scholar] [CrossRef]
- Coomans, M.; Allaerts, K.; Wittemans, L.; Pinxteren, D. Monitoring and energetic performance of two similar semi-closed greenhouse ventilation systems. Energy Convers. Manag. 2013, 76, 128–136. [Google Scholar] [CrossRef]
- Dannehl, D.; Josuttis, M.; Ulrichs, C.; Schmidt, U. The potential of a confined closed greenhouse in terms of sustainable production, crop growth, yield and valuable plant compounds of tomatoes. J. Appl. Bot. Food Qual. 2014, 87, 210–219. [Google Scholar]
- Van’t Ooster, A.; Van Ieperen, W.; Kalaitzoglou, P. Model study on applicability of a semi closed greenhouse concept in Almeria: Effects on greenhouse climate, crop yield and resource use efficiency. Acta Hortic. 2012, 927, 51–58. [Google Scholar] [CrossRef]
- Gieling, T.H.; Dieleman, J.A.; Janssen, H.J.J.; Campen, J.B.; Raaphorst, M.G.M.; Kromwijka, J.A.M.; Kempkes, F.L.K.; Garcia, N. Monitoring of climate variables in semi-closed greenhouses. Acta Hortic. 2015, 893, 1073–1080. [Google Scholar] [CrossRef]
- Heuvelink, E.; Bakker, M.; Marcelis, L.F.M.; Raaphorst, M. Climate and Yield in a Closed Greenhouse. Acta Hortic. 2008, 801, 1083–1092. [Google Scholar] [CrossRef]
- Qian, T.; Dieleman, J.A.; Elings, A.; De Gelder, A.; Marcelis, L.F.M.; Van Kooten, A.O. Comparison of climate and production in closed, semi-closed and open greenhouses. Acta Hortic. 2011, 893, 807–814. [Google Scholar] [CrossRef]
- de Zwart, H.F. Overall energy analysis of (semi) closed greenhouses. Acta Hortic. 2008, 801, 811–818. [Google Scholar] [CrossRef]
- ATECYR. Selección de Equipos de Transporte de Fluidos. Guía Técnica; IDEA: Madrid, Spain, 2012; 102p. [Google Scholar]
- Sapounas, A.; Katsoulas, N.; Slager, B.; Bezemer, R.; Lelieveld, C. Design, Control, and Performance Aspects of Semi-Closed Greenhouses. Agronomy 2020, 10, 1739. [Google Scholar] [CrossRef]
- Kumar, K.S.; Tiwari, K.N.; Jha, M.K. Design and technology for greenhouse cooling in tropical and subtropical regions: A review. Energy Build. 2009, 41, 1269–1275. [Google Scholar] [CrossRef]
- Sethi, V.; Sharma, S. Survey of cooling technologies for worldwide agricultural greenhouse applications. Sol. Energy 2007, 81, 1447–1459. [Google Scholar] [CrossRef]
- López, A.; Valera, D.L.; Molina-Aiz, F.D.; Peña, A. Sonic anemometry to evaluate airflow characteristics and temperature distribution in empty Mediterranean greenhouses equipped with pad-fan and fog systems. Biosyst. Eng. 2012, 113, 334–350. [Google Scholar] [CrossRef]
- Misra, D.; Ghosh, S. Evaporative cooling technologies for greenhouses: A comprehensive review. Agric. Eng. Int. CIGR J. 2018, 20, 1–15. [Google Scholar]
- Cámara-Zapata, J.M.; Sánchez-Molina, J.A.; Wang, H.; Carreño-Ortega, A.; Rodríguez, F. Evaluation of an Adapted Greenhouse Cooling System with Pre-Chamber and Inflatable Air Ducts for Semi-Arid Regions in Warm Conditions. Agronomy 2020, 10, 752. [Google Scholar] [CrossRef]
- Gupta, S.K.; Arora, B.B.; Arora, A. Effect of varying ambient conditions on the performance of air conditioner using evaporative cooler. J. Braz. Soc. Mech. Sci. 2023, 45, 625. [Google Scholar] [CrossRef]
- von Zabeltitz, C. Integrated Greenhouse Systems for Mild Climates; Springer: Berlin, Germany, 2011; 363p. [Google Scholar]
- Sabeh, N.C.; Giacomelli, G.A.; Kubota, C. Water use for pad and fan cooling of a greenhouse in a semi-arid climate. Acta Hortic. 2006, 719, 409–416. [Google Scholar] [CrossRef]
- Sabeh, N.C. Evaluation and Minimizing of Water Use by Greenhouse Evaporative Cooling Systems in a Semi-Arid Climate. Ph.D. Thesis, Department of Agricultural and Biosystems Engineering, University of Arizona, Tucson, AZ, USA, 2007; 216p. [Google Scholar]
- Ghoulem, M.; El Moueddeb, K.; Nehdi, E.; Boukhanouf, R.; Calautit, J.K. Greenhouse design and cooling technologies for sustainable food cultivation in hot climates: Review of current practice and future status. Biosyst. Eng. 2019, 183, 121–150. [Google Scholar] [CrossRef]
- Wu, J.M.; Huang, X.; Zhang, H. Theoretical analysis on heat and mass transfer in a direct evaporative cooler. Appl. Therm. Eng. 2009, 29, 980–984. [Google Scholar] [CrossRef]
- Suoying, H.; Gurgenci, H.; Guan, Z.; Alkhedhair, A.M. Pre-cooling with Munters media to improve the performance of Natural Draft Dry Cooling Towers. Appl. Therm. Eng. 2013, 53, 67–77. [Google Scholar]
- Rabbi, B.; Chen, Z.-H.; Sethuvenkatraman, S. Protected cropping in warm climates: A review of humidity control and cooling methods. Energies 2019, 12, 2737. [Google Scholar] [CrossRef]
- Fuchs, M.; Dayan, E.; Presnov, E. Evaporative cooling of a ventilated greenhouse rose crop. Agric. For. Meteorol. 2006, 138, 203–215. [Google Scholar] [CrossRef]
- Jamaludin, D.; Ahmad, D.; Kamaruddin, R.; Jaafar, H.Z.E. Microclimate inside a tropical greenhouse equipped with evaporative cooling pads. J. Sci. Technol. 2014, 22, 255–272. [Google Scholar]
- Ganguly, A.; Ghosh, S. Modeling and analysis of a fan–pad ventilated floricultural greenhouse. Energy Build. 2007, 39, 1092–1097. [Google Scholar] [CrossRef]
- Al-Jamal, K. Greenhouse cooling in hot countries. Energy 1994, 19, 1187–1192. [Google Scholar] [CrossRef]
- Sarntichartsak, P.; Thepa, S. Modeling and experimental study on the performance of an inverter air conditioner using R-410A with evaporatively cooled condenser. ATE 2013, 51, 597–610. [Google Scholar] [CrossRef]
- Kays, W.M.; London, A.L. Compact Heat Exchangers, 3rd ed.; McGraw-Hill: New York, NY, USA, 1984; 156p. [Google Scholar]


Disclaimer/Publisher’s Note: The statements, opinions and data contained in all publications are solely those of the individual author(s) and contributor(s) and not of MDPI and/or the editor(s). MDPI and/or the editor(s) disclaim responsibility for any injury to people or property resulting from any ideas, methods, instructions or products referred to in the content. |
© 2024 by the authors. Licensee MDPI, Basel, Switzerland. This article is an open access article distributed under the terms and conditions of the Creative Commons Attribution (CC BY) license (https://creativecommons.org/licenses/by/4.0/).