Article

Genetic and Molecular Characterization of Maize Landraces from Central China

1
Key Laboratory of Crop Genetics and Breeding of Hebei Province, Institute of Cereal and Oil Crops, Hebei Academy of Agriculture and Forestry Sciences, Shijiazhuang 050035, China
2
State Key Laboratory of North China Crop Improvement and Regulation, Hebei Sub-Center for National Maize Improvement Center, College of Agronomy, Hebei Agricultural University, Baoding 071001, China
3
Hebei Key Laboratory of Crop Cultivation Physiology and Green Production, Institute of Cereal and Oil Crops, Hebei Academy of Agriculture and Forestry Sciences, Shijiazhuang 050035, China
*
Author to whom correspondence should be addressed.
These authors contributed equally to this work.
Agronomy 2024, 14(6), 1278; https://doi.org/10.3390/agronomy14061278
Submission received: 6 May 2024 / Revised: 27 May 2024 / Accepted: 4 June 2024 / Published: 13 June 2024
(This article belongs to the Section Crop Breeding and Genetics)

Abstract

:
Maize productivity in the central belt plays a significant role in the food security of China. With good adaptability and disease resistance, landrace germplasm is important for maize improvement. A total of 246 landrace accessions were collected from the maize belts in central China and genotyped with the SLAF-seq (Specific-Locus Amplified Fragment Sequencing) method, and 144,650 SNPs were obtained for each accession. The results showed that the landrace accessions could be divided into three major groups. In the cluster results, Group I included 64 accessions, which mainly belonged to the landrace of White horse teeth; Group II had 71 accessions, which mainly belonged to the lantern red landraces; the rest of the 116 accessions were clustered as Group III, including a variety of types landraces and seven indicator inbred lines. In the results of structure and multidimensional scaling, the accessions’ attribution differed with the clusters, the main reason for which is the attribution change in intermediate germplasms. Linkage disequilibrium decay distance was 0.98 kb, which was much lower than that of temperate and tropical maize inbred lines, indicated the much higher genetic diversity of landrace germplasms. The results can help us select suitable landrace germplasms and speed up the process of inbred line development and maize improvement.

1. Introduction

Maize (Zea may L.) plays a prominent role in the world, and its yield has exceeded that of rice and wheat [1]. With an increasing demand, raising its production is an urgent challenge today [2]. Maize provides nourishing for countries in Latin America, Africa and parts of Asia. It is also the main ingredient in feed in some countries [3,4]. In China, maize is mainly used as livestock feed. Maize was introduced into China approximately 500 years ago [5] and was widely grown in the south by the 1700s; then, it gradually spread from the south to the north. This crop has been adapted to six corn-growing regions ranging from northeast to southwest China [6], including the North Spring Maize zone, Summer Maize zone, Southwest Spring Maize (rain fed) and Summer Maize zone, Northwest Spring Maize zone, Southern Hilly Maize zone and Qinghai–Tibet Plateau Maize zone.
Maize is an open-pollinated species with a complex genome and with tremendous genetic diversity, which is considered a major factor in heterosis [7]. From the 1930s to the present, three stages in maize hybrid breeding history have been defined according to the source of parents [8]: (1) Inbred lines derived from landraces during the early 20th century [9,10]; (2) inbred lines derived from crosses among artificially selected inbred lines during the 1950s–1980s [11,12]; and (3) inbred lines selected from elite inbred lines [13,14]. Similar to the USA, the breeding history in China dates back to the open-pollinated varieties before 1960 [2], followed by double-cross hybrids in the 1960s and subsequently single-cross hybrids [15]. Landraces were the first and most enduring stage of maize development with over 10,000 accessions of domestic maize landraces being grown over 11 million ha [16,17]. The germplasm used for developing elite hybrids mainly originated from local landraces and introduced inbred lines, hybrids and populations. At the beginning of the 1960s, breeders applied some of the landraces to the development of elite inbred lines [18], such as two well-known founder lines, HuangZaoSi (referred to as HZS), originating from landrace Tang SiPingTou (referred to as Tang SPT), and Dan340, derived from landrace LvDa Red Cob [7,19].
Heterotic groups and patterns are important because these determine how germplasm is organized, managed, and which two or three inbred lines are selected to cross to develop the hybrid [20,21]. The characterization of the genetic relationships, heterotic patterns and breeding history of lines in maize-breeding programs allows breeders to efficiently use maize germplasm for line improvement over time [2]. Genetic relationships within Chinese, North American germplasm and CIMMYT maize inbred lines were studied using multiple molecular markers, for example, simple sequence repeat (SSR) or single-nucleotide polymorphism (SNP) markers [2,5,18,22,23,24,25]. In general, maize germplasm was determined to consist of 4–6 heterotic groups. Zhang [2] used 269 temperate inbred lines which were widely used in China from 1970s to reveal historical trends in heterotic patterns, and cluster analysis and principal coordinate analysis consistently revealed seven groups. Collected from the breeding program of Southwest China, 362 important inbred lines were characterized using the Illumina (San Diego, CA, USA) MaizeSNP50 BeadChip with 56,110 SNPs; with increasing K value, the Temperate group showed a pronounced hierarchical structure with division into further subgroups [5]. However, studies on genetic diversity and genetic relationship of local landrace accessions in China are still lacking.
China’s central belt is an important maize-producing area, and its maize production has a direct impact on China’s food security [18]. However, the genetic basis of key inbred lines is narrow and homogeneous, which hinders the continued growth of corn yields and increases the risk of pests and diseases [5]. Local landrace germplasm is an important maize resource. It is of great significance to study genetic diversity and heterosis groups of landrace germplasms to improve key inbred lines. In this study, SNP markers were used as the genotype to reveal the genetic structure, population distance and linkage disequilibrium of landrace germplasm panel, and to provide a theoretical basis for the utilization of landrace germplasms.

2. Materials and Methods

2.1. Plant Material

In total, 246 landrace accessions were collected from the central maize belt of China, mainly in Hebei Province. This collection work is supported by the project of the third national resource to discover and identify the outstanding germplasm, including local landrace germplasm, that has not been collected previously. The grain color and texture were abundant in 246 landrace accessions (Table S1). Seven inbred lines that are commonly used as indicators for cluster analysis are also included in this study (Table 1). They are generally divided into five heterosis groups, which are most commonly used in China.

2.2. Genotyping by SLAF-Seq and Quality Control

Leaf tissue samples for all landrace accessions were obtained from a pool with at least six individuals. DNA was extracted by a modified CTAB procedure [26] and then sent to Biomarker Technologies Corporation (Beijing, China) for SNP genotyping. Genomic DNA was digested with the restriction enzyme HaeIII and Hpy166II. SNP calling was performed using TASSELGBS pipeline23 with Maize B73 RefGen_v5 as the reference genome [27]. The genotypes of two landrace accessions were not obtained due to poor DNA quality. A total of 7,590,496 SNPs were assigned to chromosomes 1 to 10, and 12,432 of them could not be anchored to any of the 10 maize chromosomes and were excluded. After filtering markers with missing data <50% and minor allele frequency >0.05, the 144,650 unimputed SNPs were obtained and used for subsequent genetic diversity analyses.

2.3. SNP Characteristics

Summary statistics for markers, including heterozygosity, percentage missing data, and Shannon–Wiener index per locus, were computed across the 144,650 markers using R version 4.3.0 [28]. The Shannon–Wiener index (H) for each marker was calculated as follows:
H = ( p i ) × ln ( p i )
pi is the alleles frequencies of the ith allele.

2.4. Linkage Disequilibrium (LD)

A chromosome was divided into 50 kb segment, pair-wise LD was calculated using Pearson’s correlation coefficient (r2) by TASSEL5.2 [29] and average LD was assessed for each segment.

2.5. Population Structure Analysis

ADMIXTURE 1.3.0 was used to detect the population structure among 244 maize landrace accessions and 7 indicator inbred lines using 144,650 SNPs [30] (http://dalexander.github.io/admixture/index.html, accessed on 1 December 2022). Due to the advantages in running speed, admixture has been applied in many studies in recent years. Under a Linux environment, the population number K was set to be 1~20, Q values of landrace accessions were calculated under each K value, and the CV error of each K value was calculated. The minimum CV error value is the most suitable population number.

2.6. Genetic Distance

The genetic distance between each pair of inbred lines was estimated across the 144,650 markers using Rodger’s modified genetic distance (MRD). The MRD was calculated as follows:
M R D = 1 2 m i = 1 m j = 1 a i ( p i j q i j ) 2
where pij and qij are the allele frequencies of the jth allele at ith locus in each pair of inbred lines, ai is the number of alleles at the ith locus, and m is the number of loci [21].
The MRD matrix was used to perform cluster analysis using the neighbor-joining method (NJ) with MEGA 11 [31]. The dendrogram was produced and visualized using the R package ggtree 3.8.2 [32].

2.7. Multidimensional Scaling (MDS)

Multidimensional scaling (MDS) is a common dimensionality reduction method, which can transform high-dimensional data into low-dimensional space. Bio-R software version 3.2 (https://data.cimmyt.org/dataset.xhtml?persistentId=hdl:11529/10820, accessed on 15 May 2023) was used for MDS analysis of sequenced landrace germplasms.

2.8. Population Distance

The Pairwise Wright’s Fixation Indexes (Fst) of the groups was calculated using VCFtools program 4.2 with 144,650 SNPs [33,34].

3. Results

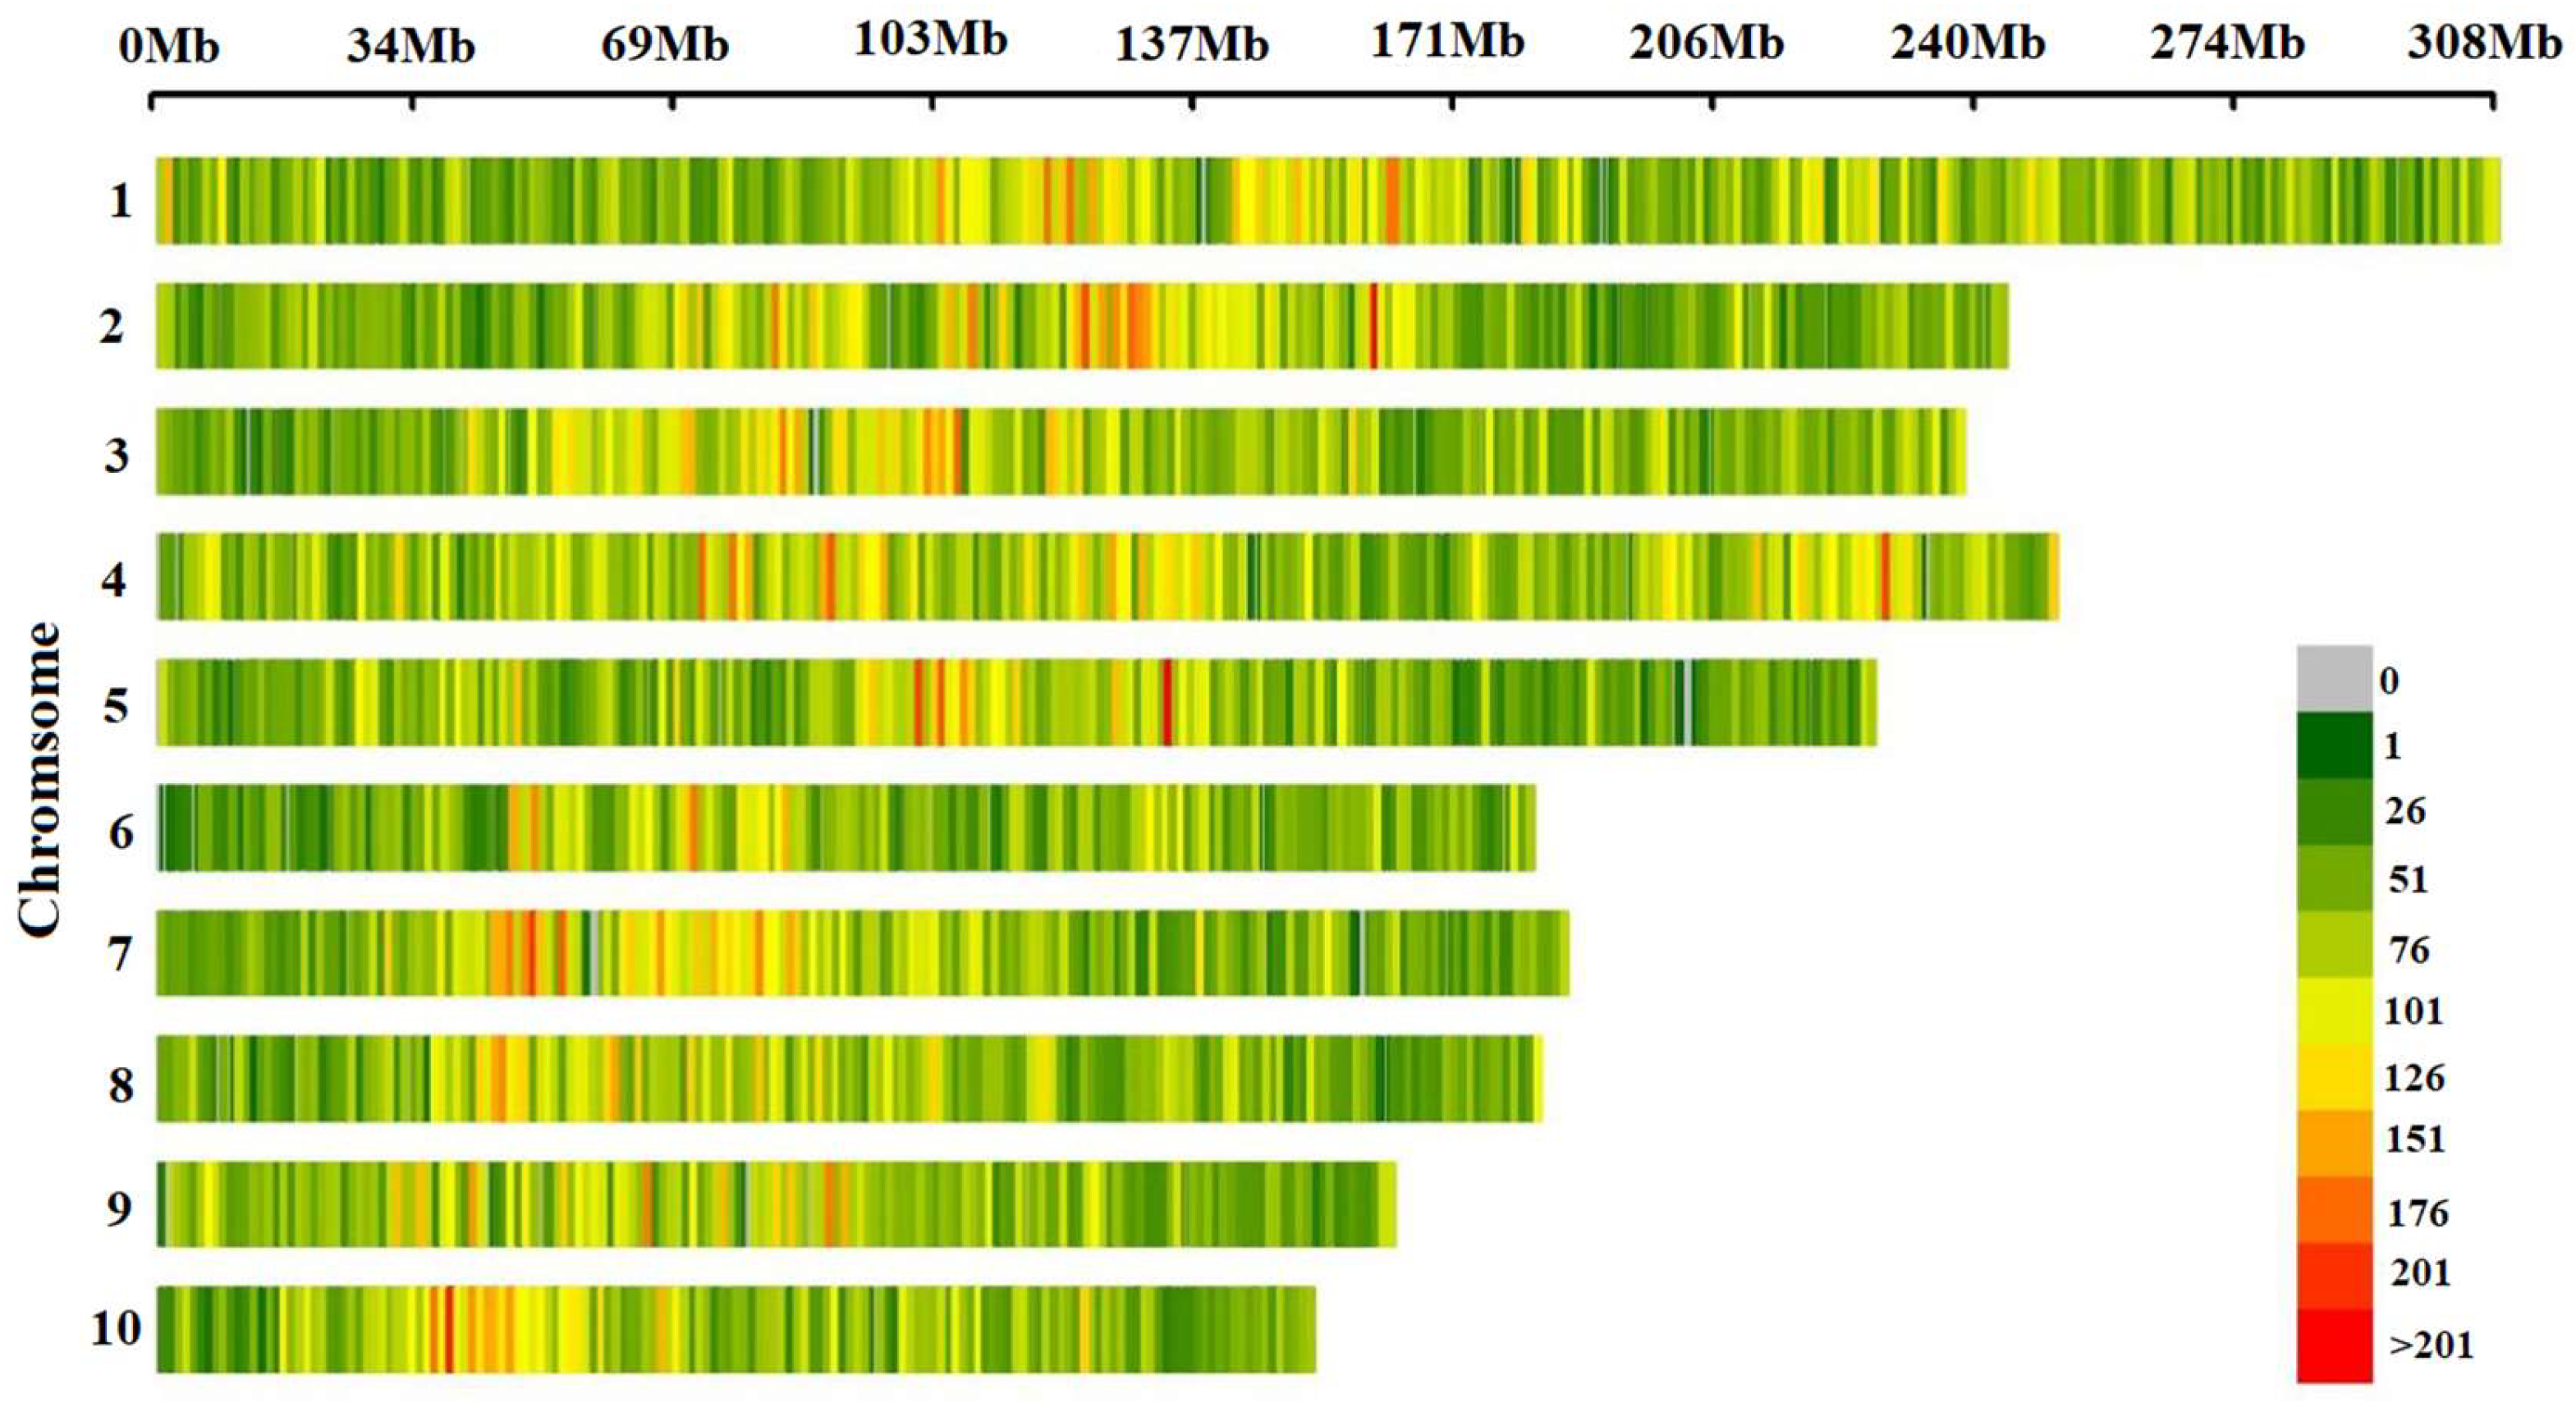
3.1. Distribution and Statistical Analysis of SNPs Markers on Chromosomes

In total, 144,650 high-quality SNPs were obtained after quality control MAF < 0.05/missing rate > 50%). The distribution of SNP markers and the heat map on marker density on all the ten maize chromosomes was shown in Figure 1. SNP markers covered the whole genome and were evenly distributed on each chromosome. Statistical analysis of the minor allele frequency, missing rate, heterozygosity rate and Shannon index of 144,650 SNP marker sites showed that the mean of MAF, missing rate, heterozygosity rate and Shannon index of the 10 chromosomes were 0.24, 0.44, 0.15 and 0.50, respectively, indicating that the genetic diversity of maize landrace germplasms was rich. The mean value of each index of SNPs in each chromosome had little difference (Figure 2).
The average minor allele frequency on chromosome 3 was the highest, which was 0.25. The average missing rate was 0.43. The mean value of heterozygosity was 0.15. The Shannon index of chromosome 3 was the largest, which was 0.52. The average frequency of the minimum allele on chromosome 5 was the lowest, which was 0.23. The average deletion rate was the largest (0.44). The mean value of heterozygosity was 0.14. The Shannon index in chromosome 5 has the smallest average of 0.49.

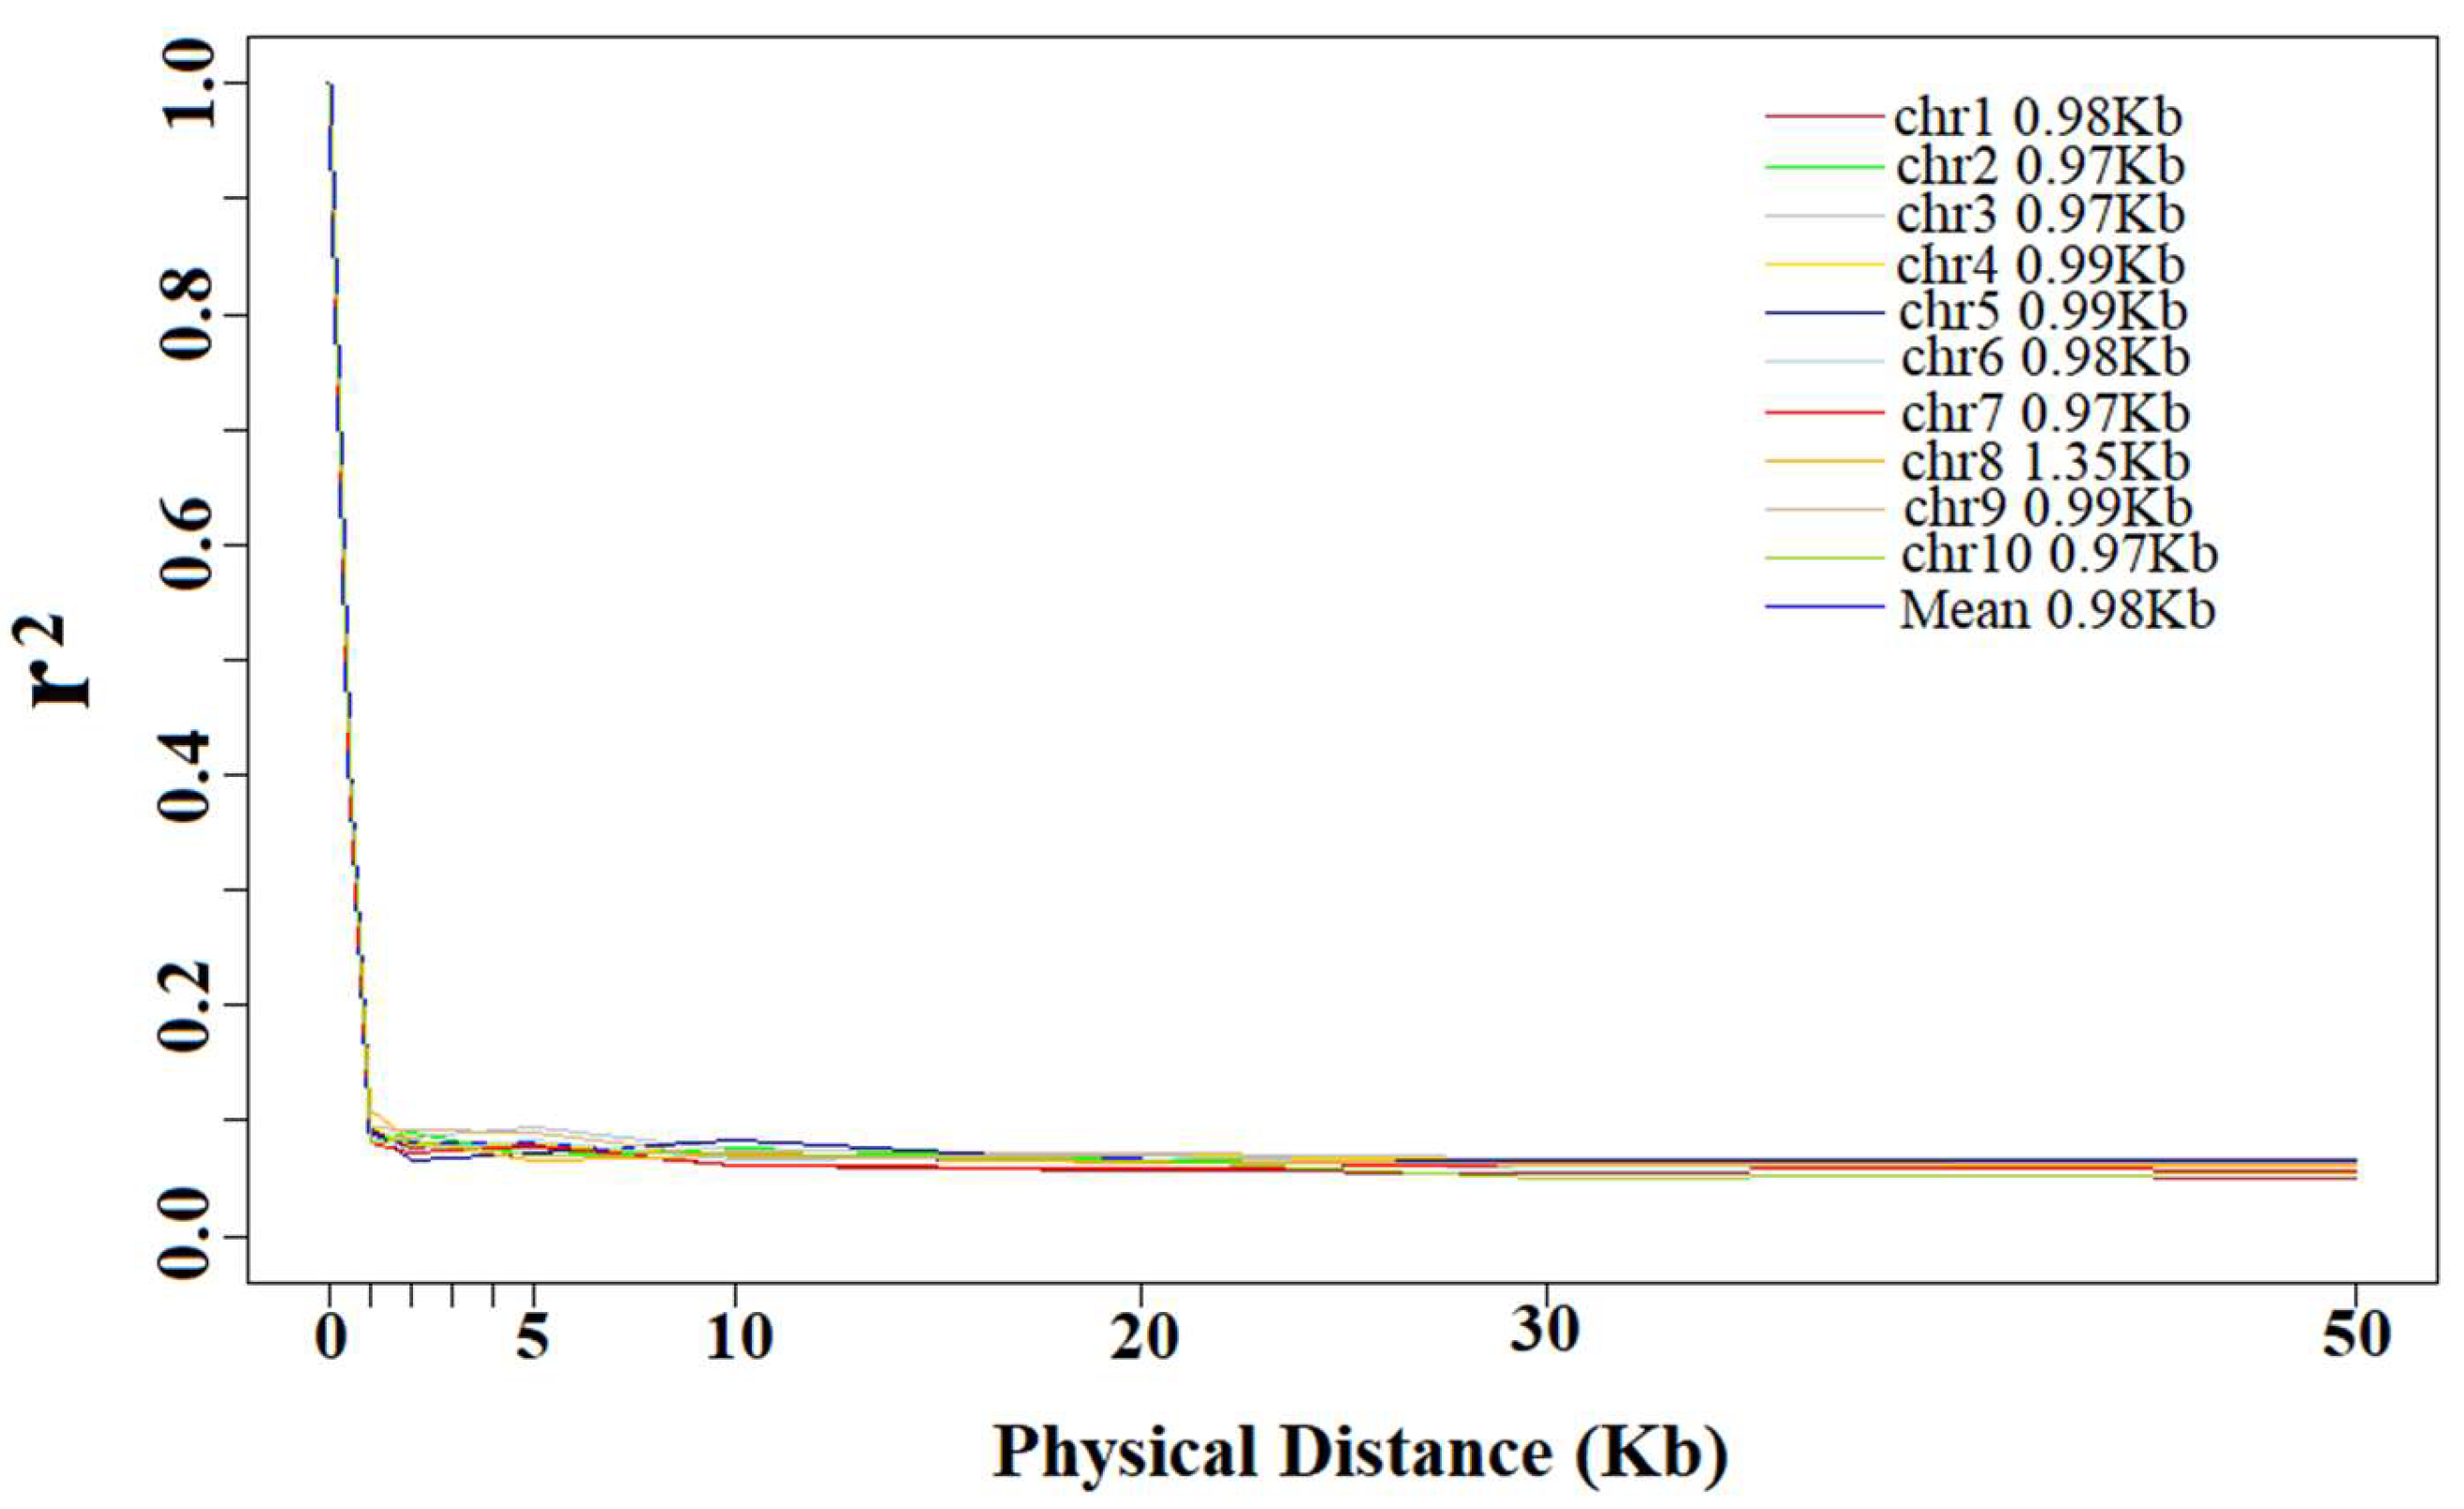
3.2. Linkage Disequilibrium Decay Distance

The average r2 of each distance interval was calculated for the estimation of LD decay distance. The LD decay distance decreased as the r2 increased, and LD decay distance decreased very little when r2 was greater than 0.1. At a cutoff of r2 = 0.10, the entire panel showed an LD decay distance of 0.98 kb. Among the chromosomes in the panel, the LD decay distance changed from 0.97 kb to 1.35 kb; Chr 2, 3, 7 and 10 showed the smallest distance and Chr 8 showed the largest. Except Chr 8, all other chromosomes were similar, ranging from 0.97 to 0.99 kb (Figure 3).

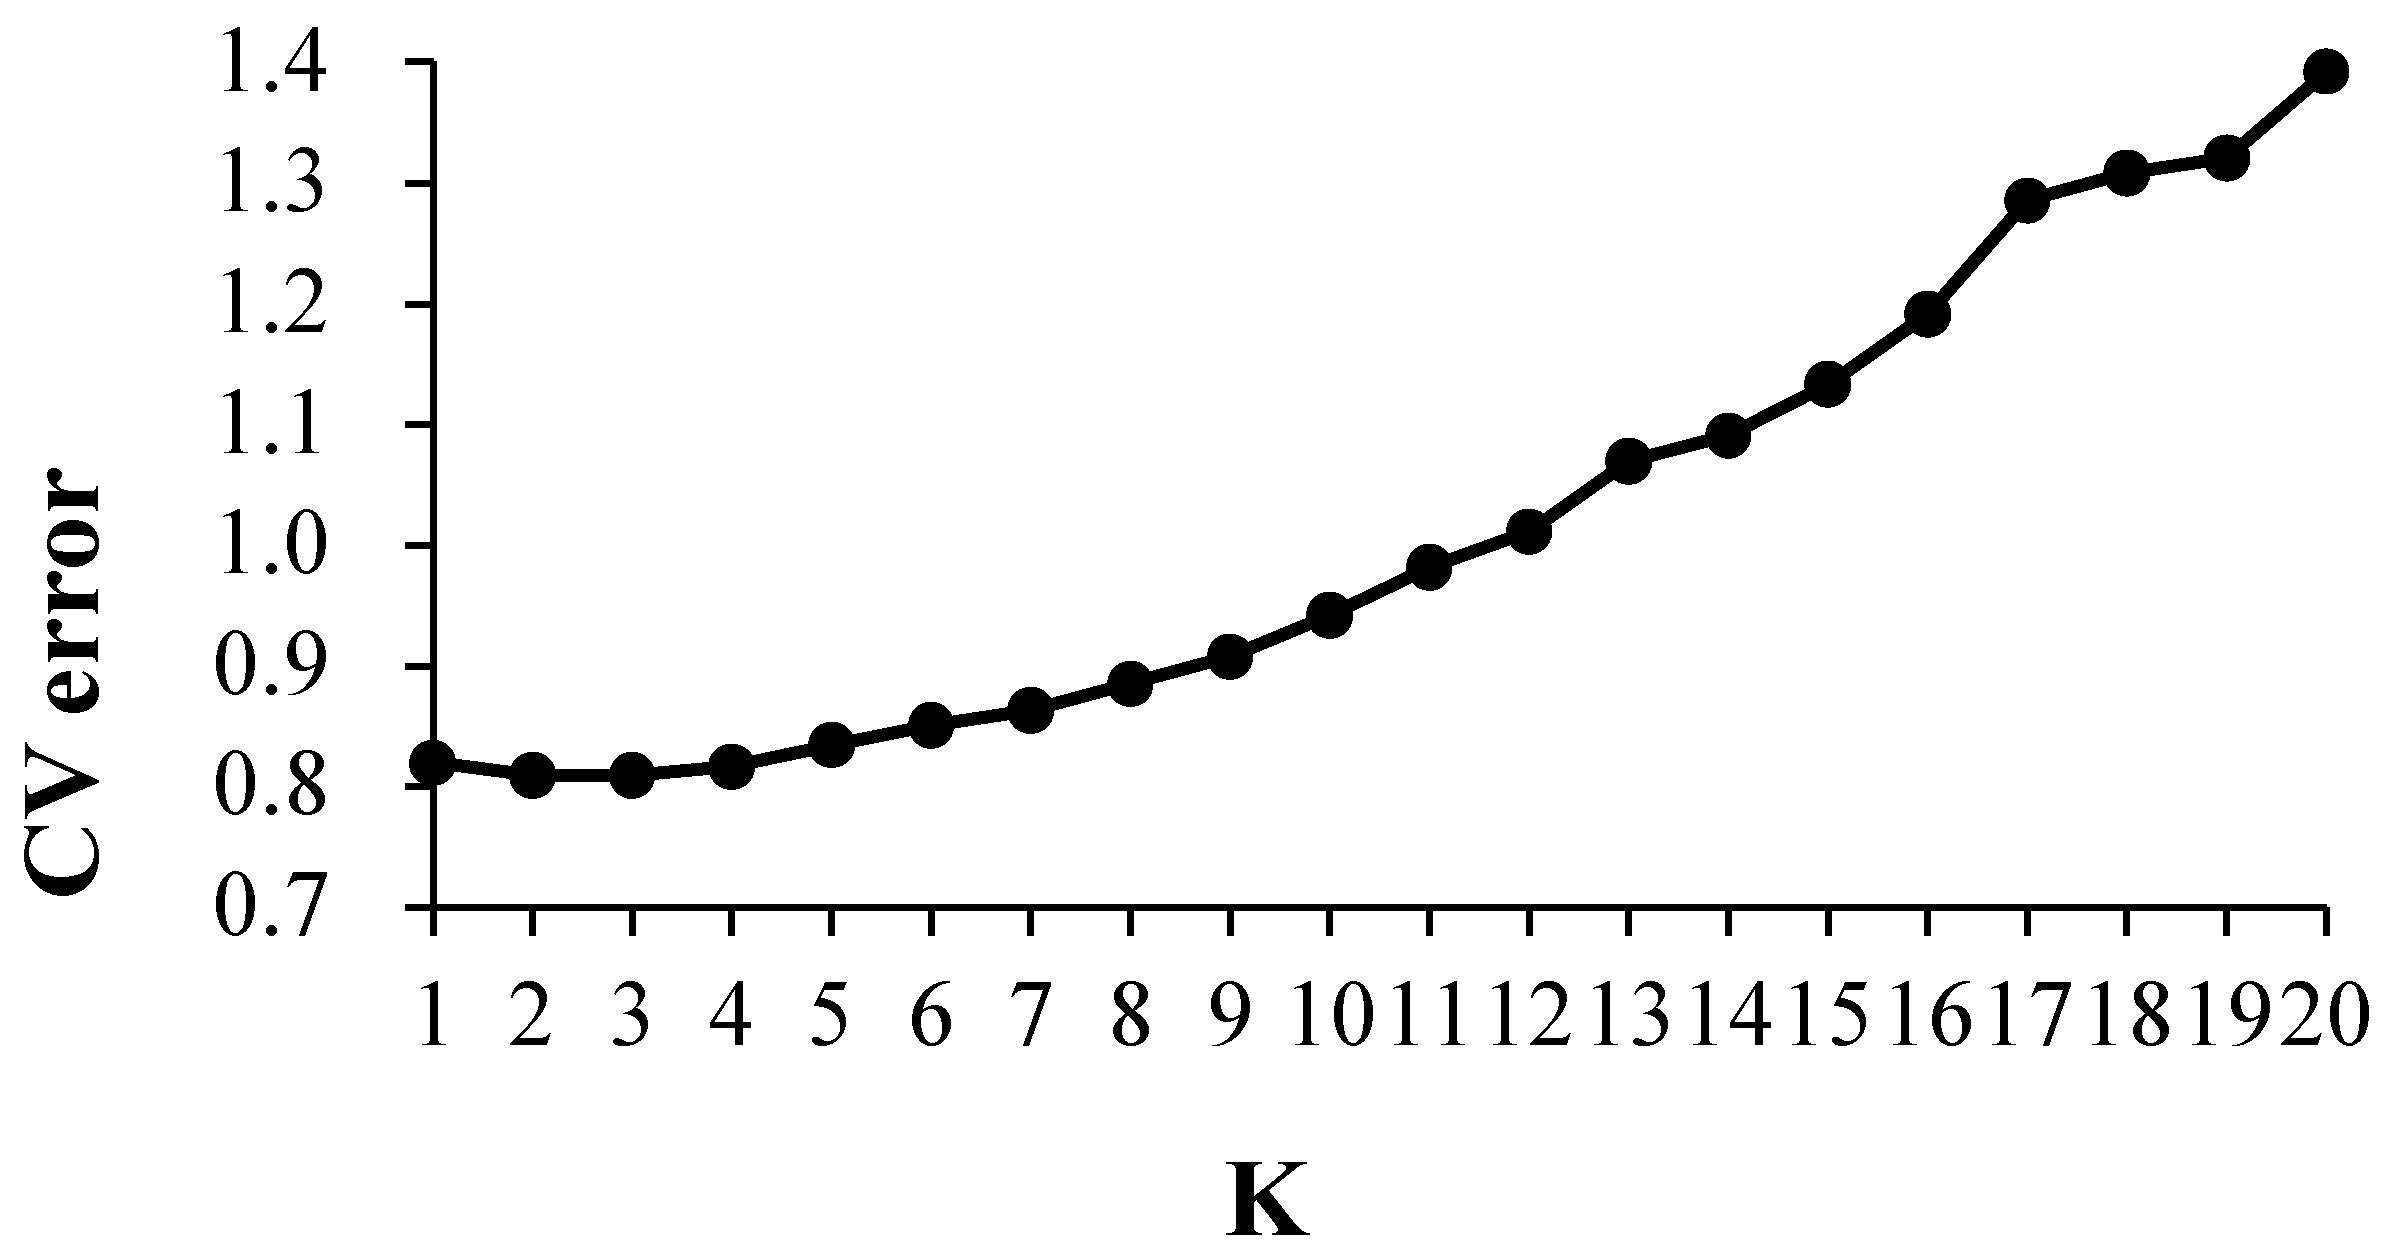
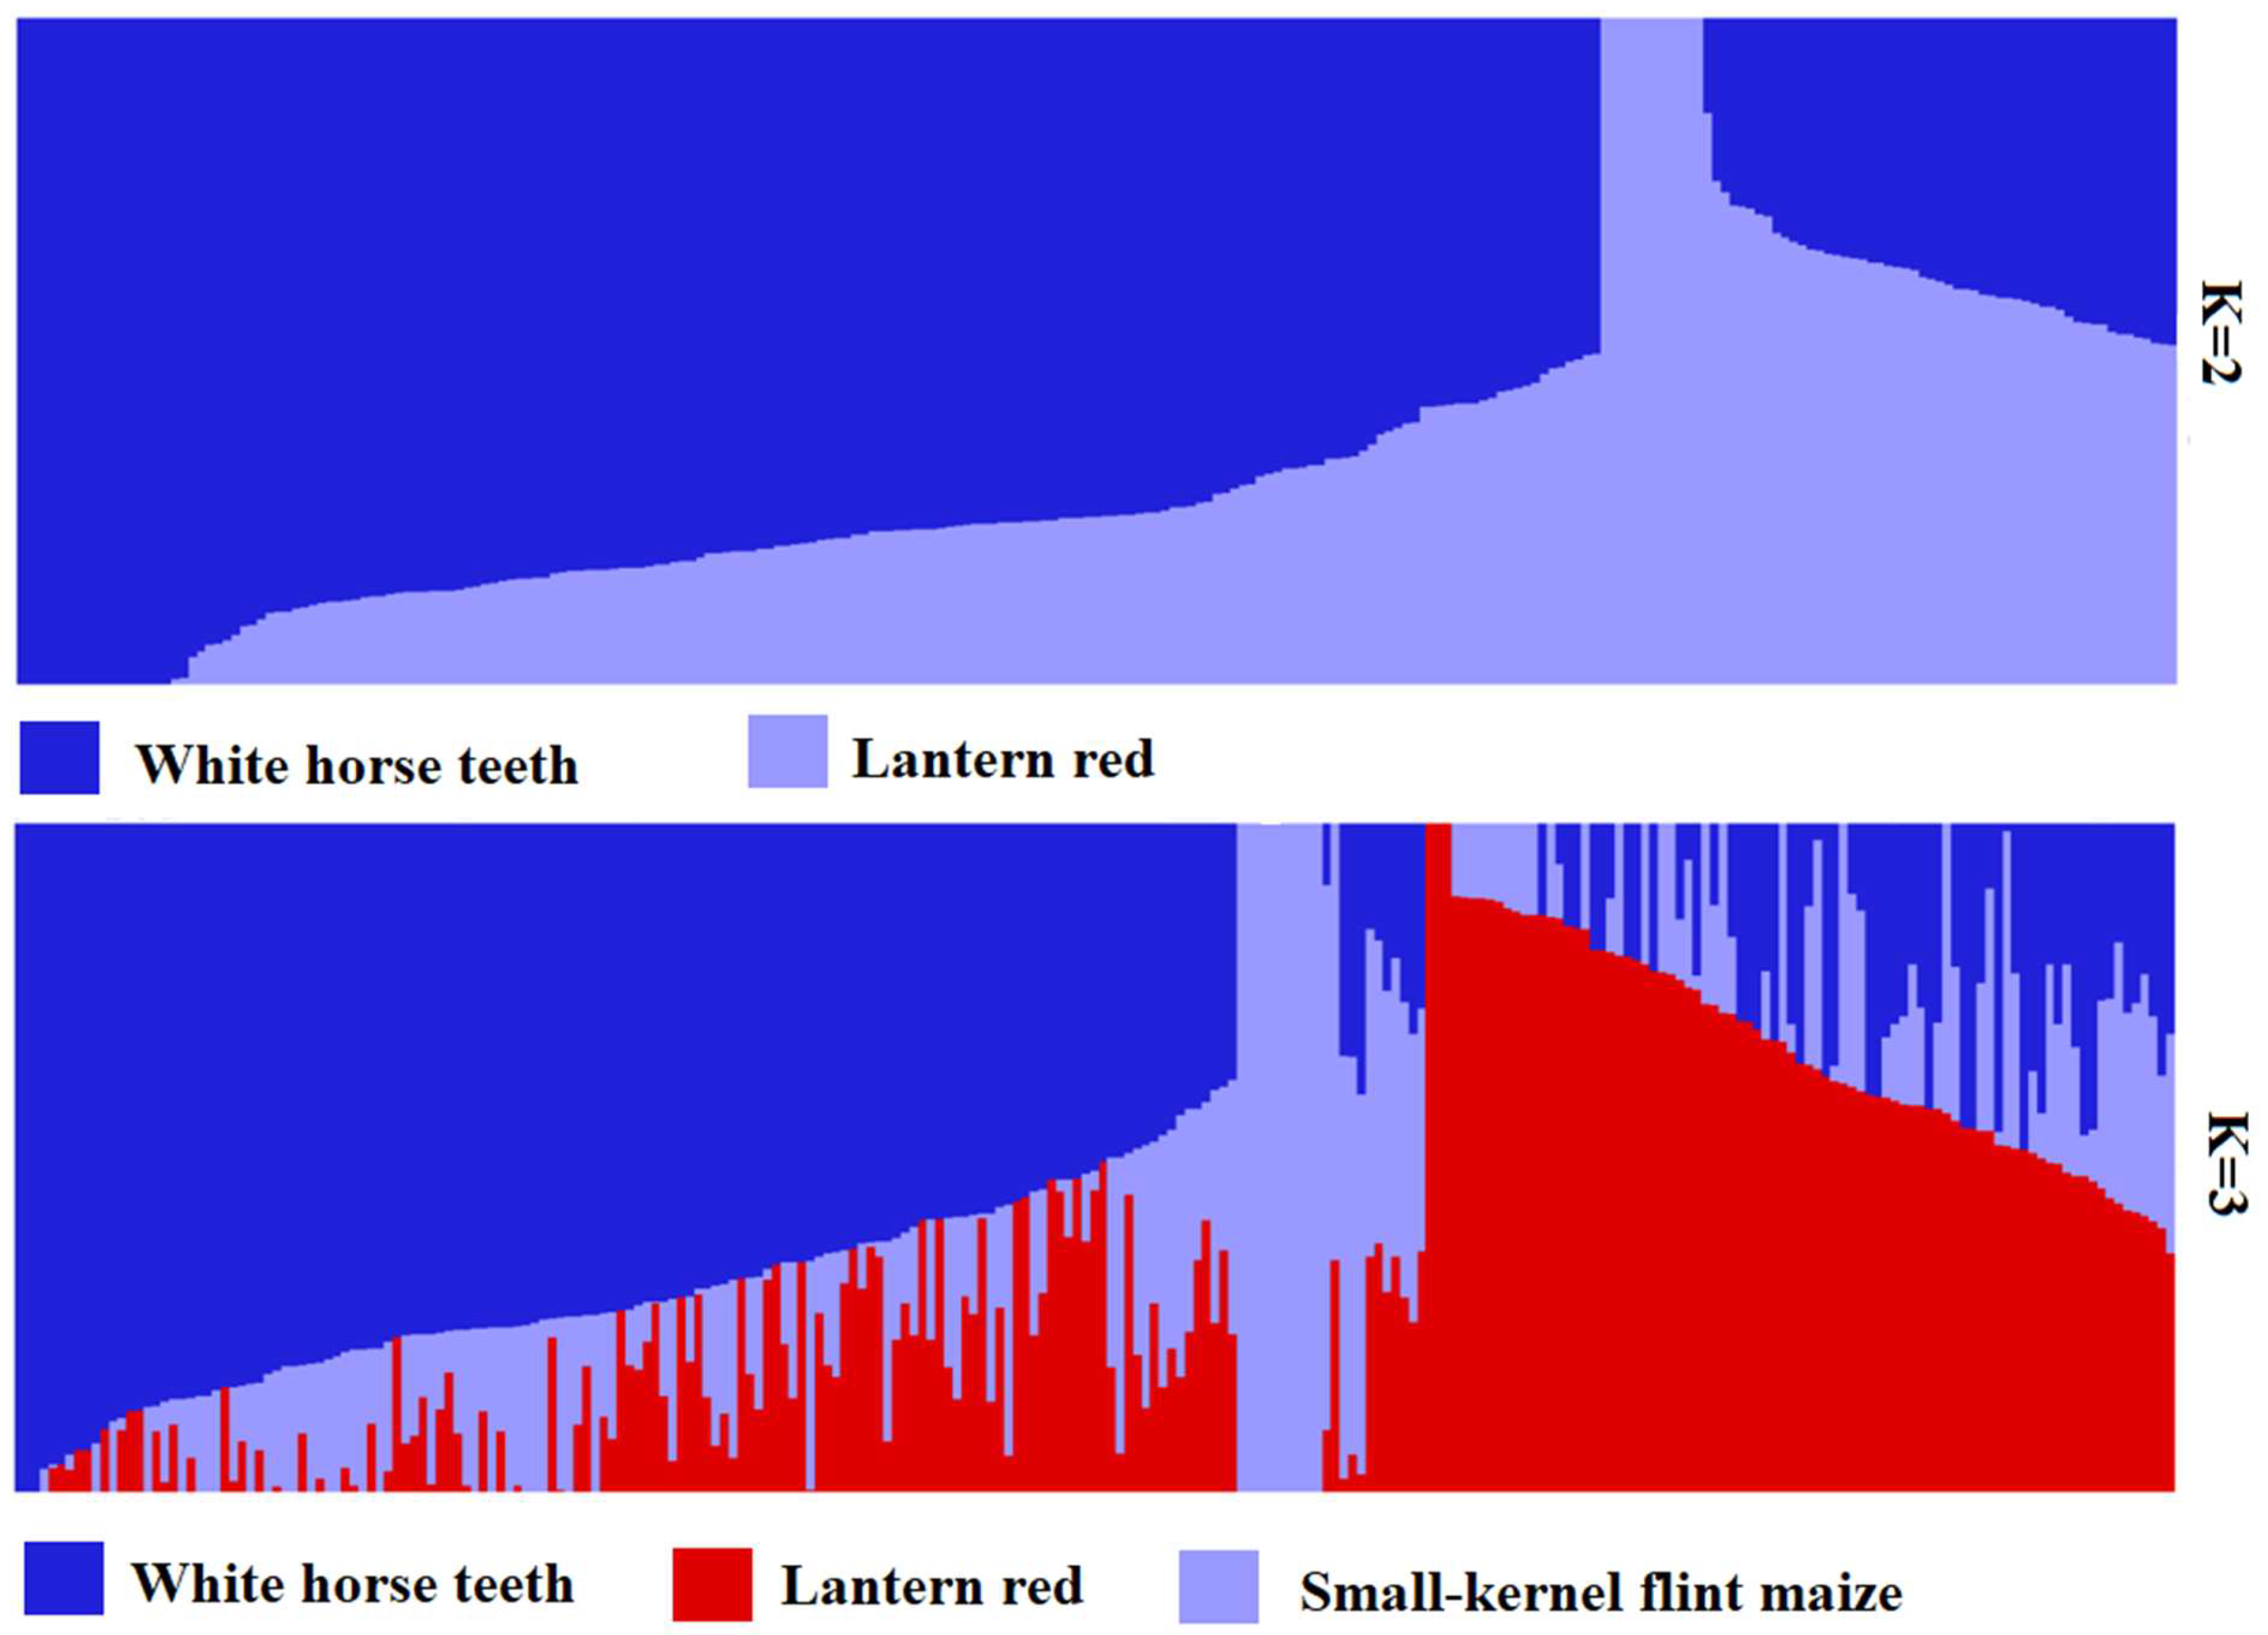
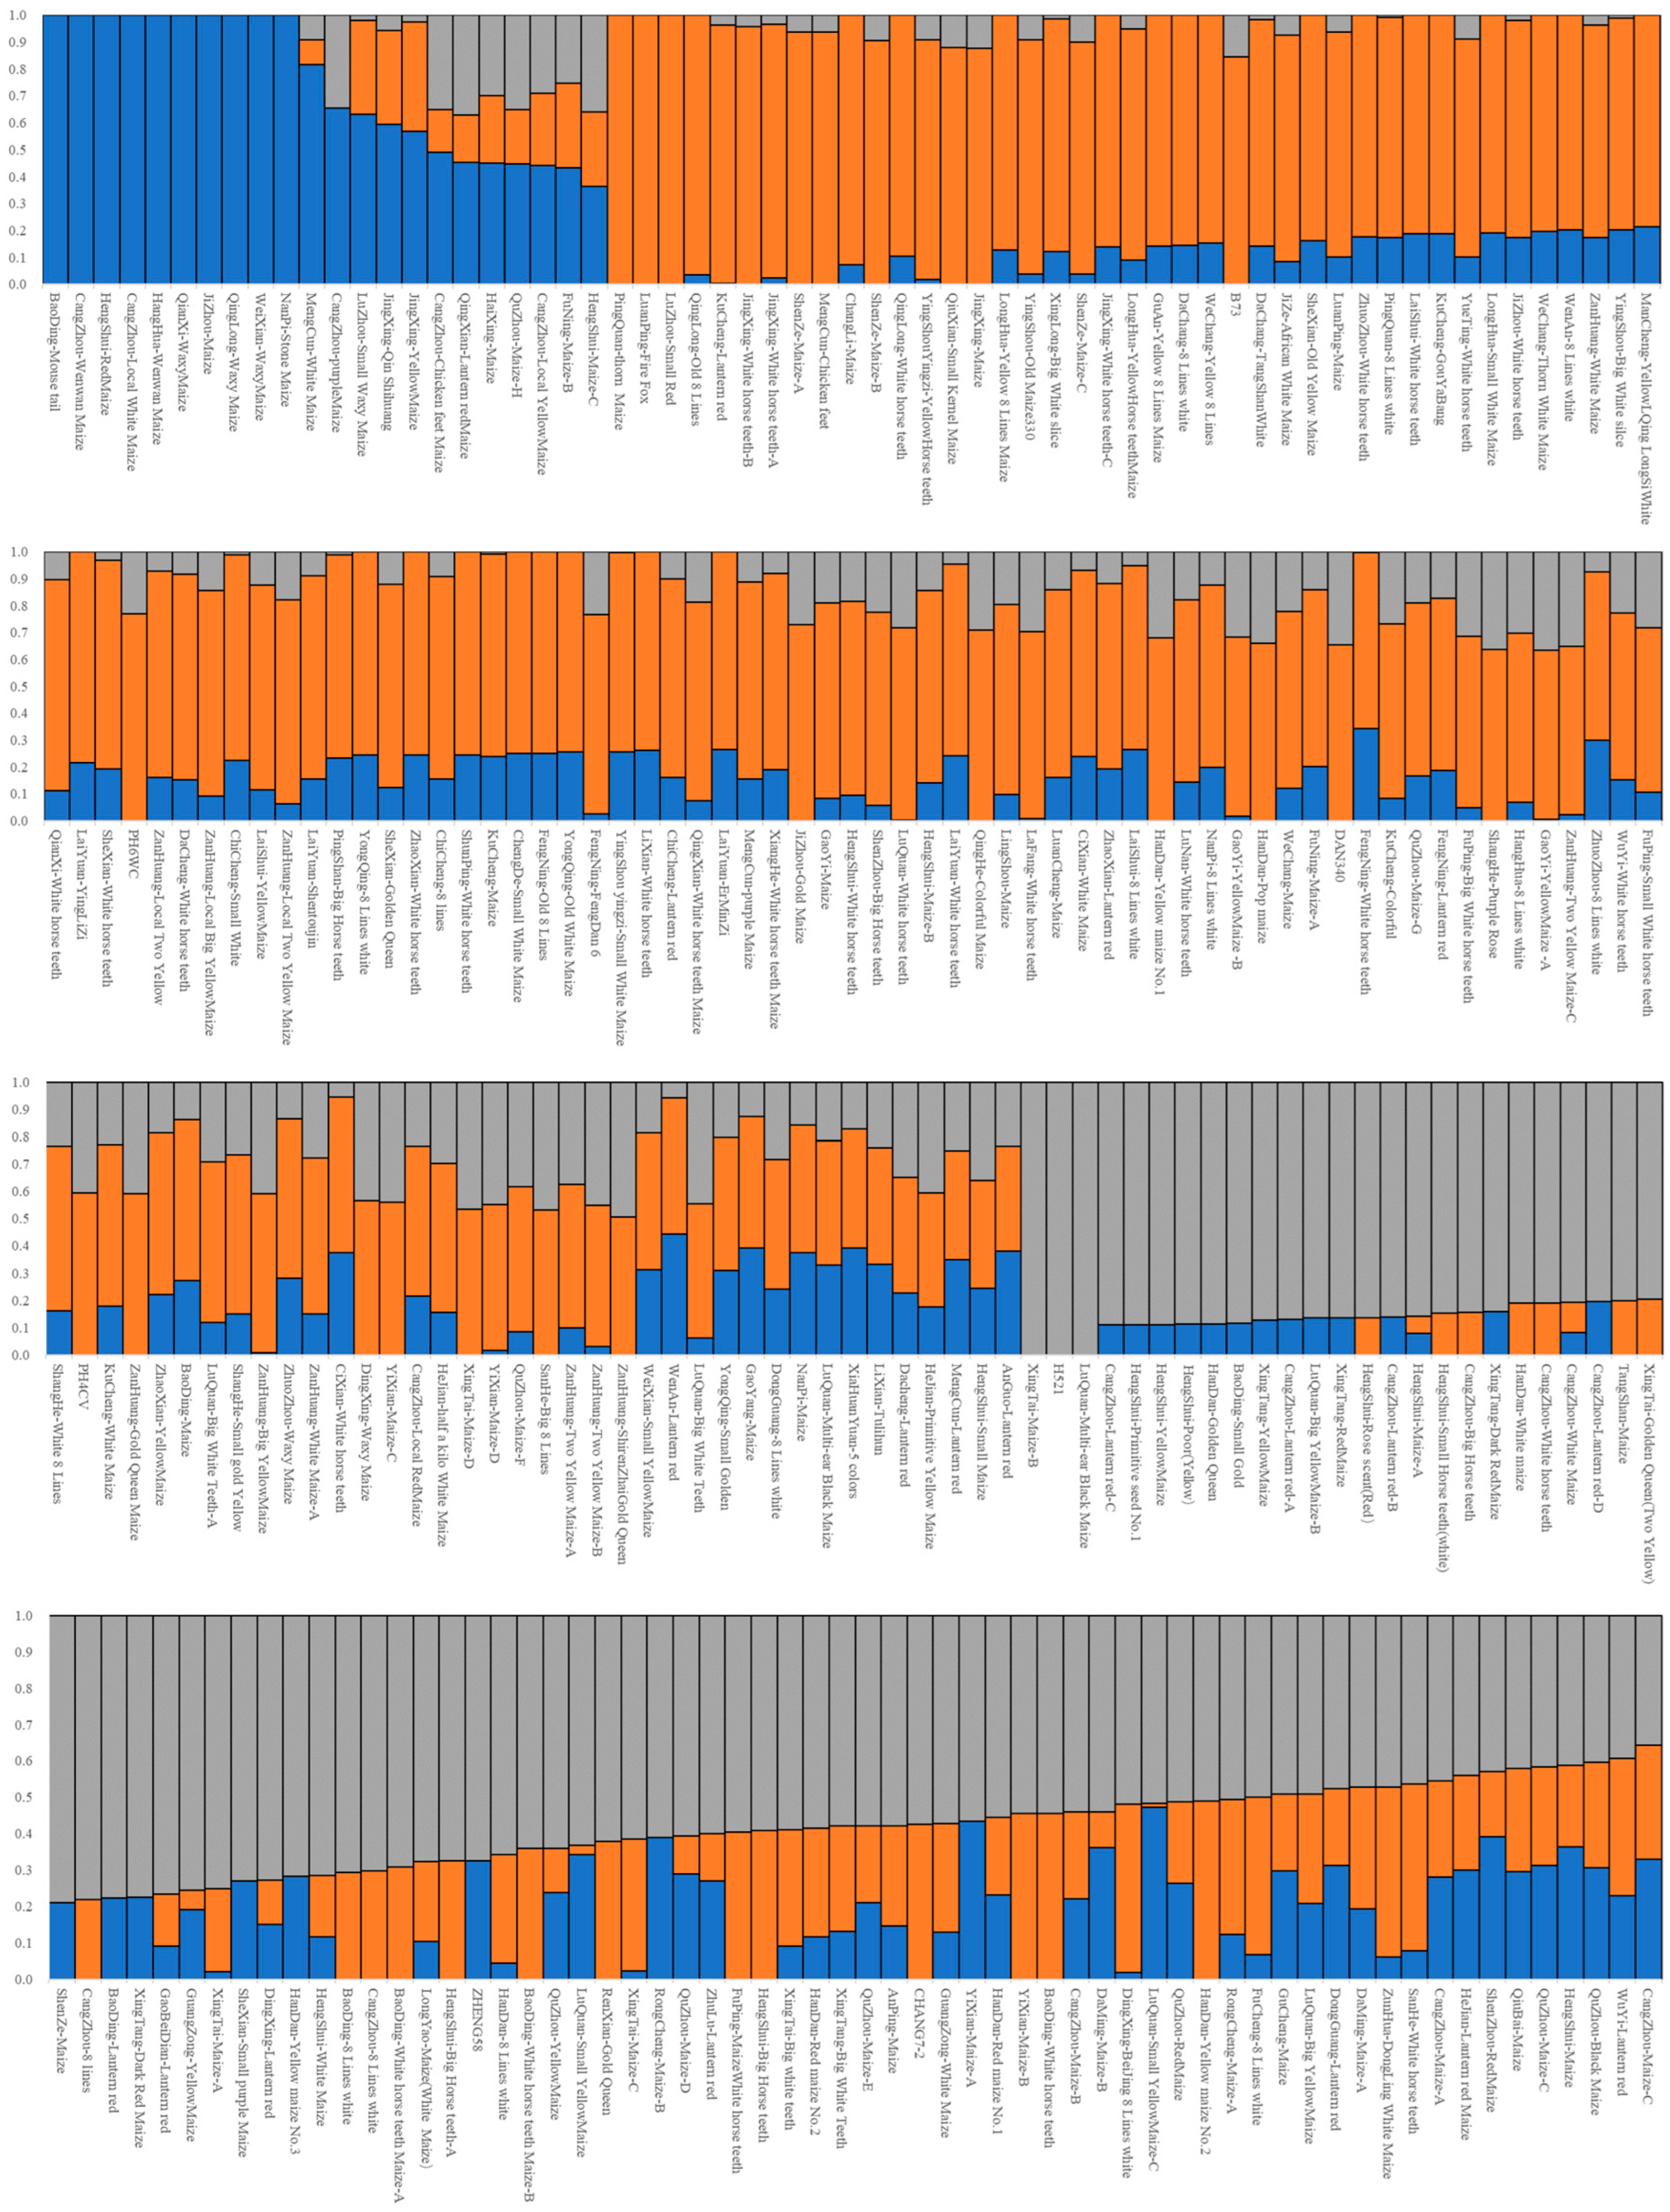
3.3. Structure Analysis

The cross-validation error (CV error) was the smallest when K = 2, and the CV error was 0.8092 (Figure 4). The landrace accessions could be divided into White horse teeth and Lantern red; the two groups contained 184 and 67, respectively (Figure 5). The representative germplasm resources were Cangzhou-White horse teeth in and Dacheng-lantern red. CV error was the second smallest (0.8093) when K = 3; the landrace accessions were assigned into White horse teeth, Lantern red and another group, most of which were small-kernel flint maize, for example, the BaoDing-Mouse tail and CangZhou-Wenwan Maize. There were 137, 87 and 27 landrace accessions in the White horse teeth, Lantern red and the third group. When K = 3 (Figure 6), most accessions in the White horse teeth group were assigned to the group White horse teeth with K = 2, except maize XiaHuanYuan-5 colors and XingTai-Maize-B, which had a membership probability (Q) < 0.5 in all three populations. And all accessions in the third group were assigned to the group Lantern red (K = 2). But the accessions in the second group when K = 3 contained a similar proportion germplasms assigned as those in the groups of White horse teeth and Lantern red when K = 2. A total of 38 landrace accessions were considered mixed as Q < 0.5 in all three populations. The indicator lines were assigned into two groups. When K = 2, the PH4CV, PH6WC, B73, DAN340 and CHANG7-2 were assigned into the White horse teeth group; the rest of the lines, H521 and ZHENG58, were assigned into the Lantern red group. When K = 3, PH4CV, PH6WC, B73 and DAN340 were assigned into the group of White horse teeth, while CHANG7-2, H521 and ZHENG58 were assigned into another group. The Q of CHANG7-2 showed that the membership probability of the group Lantern red was 0.57 and that of the group White horse teeth was 0.43, which indicated that the inbred line CHANG7-2 also has the high probability of the group in the groups White horse teeth and Lantern red.

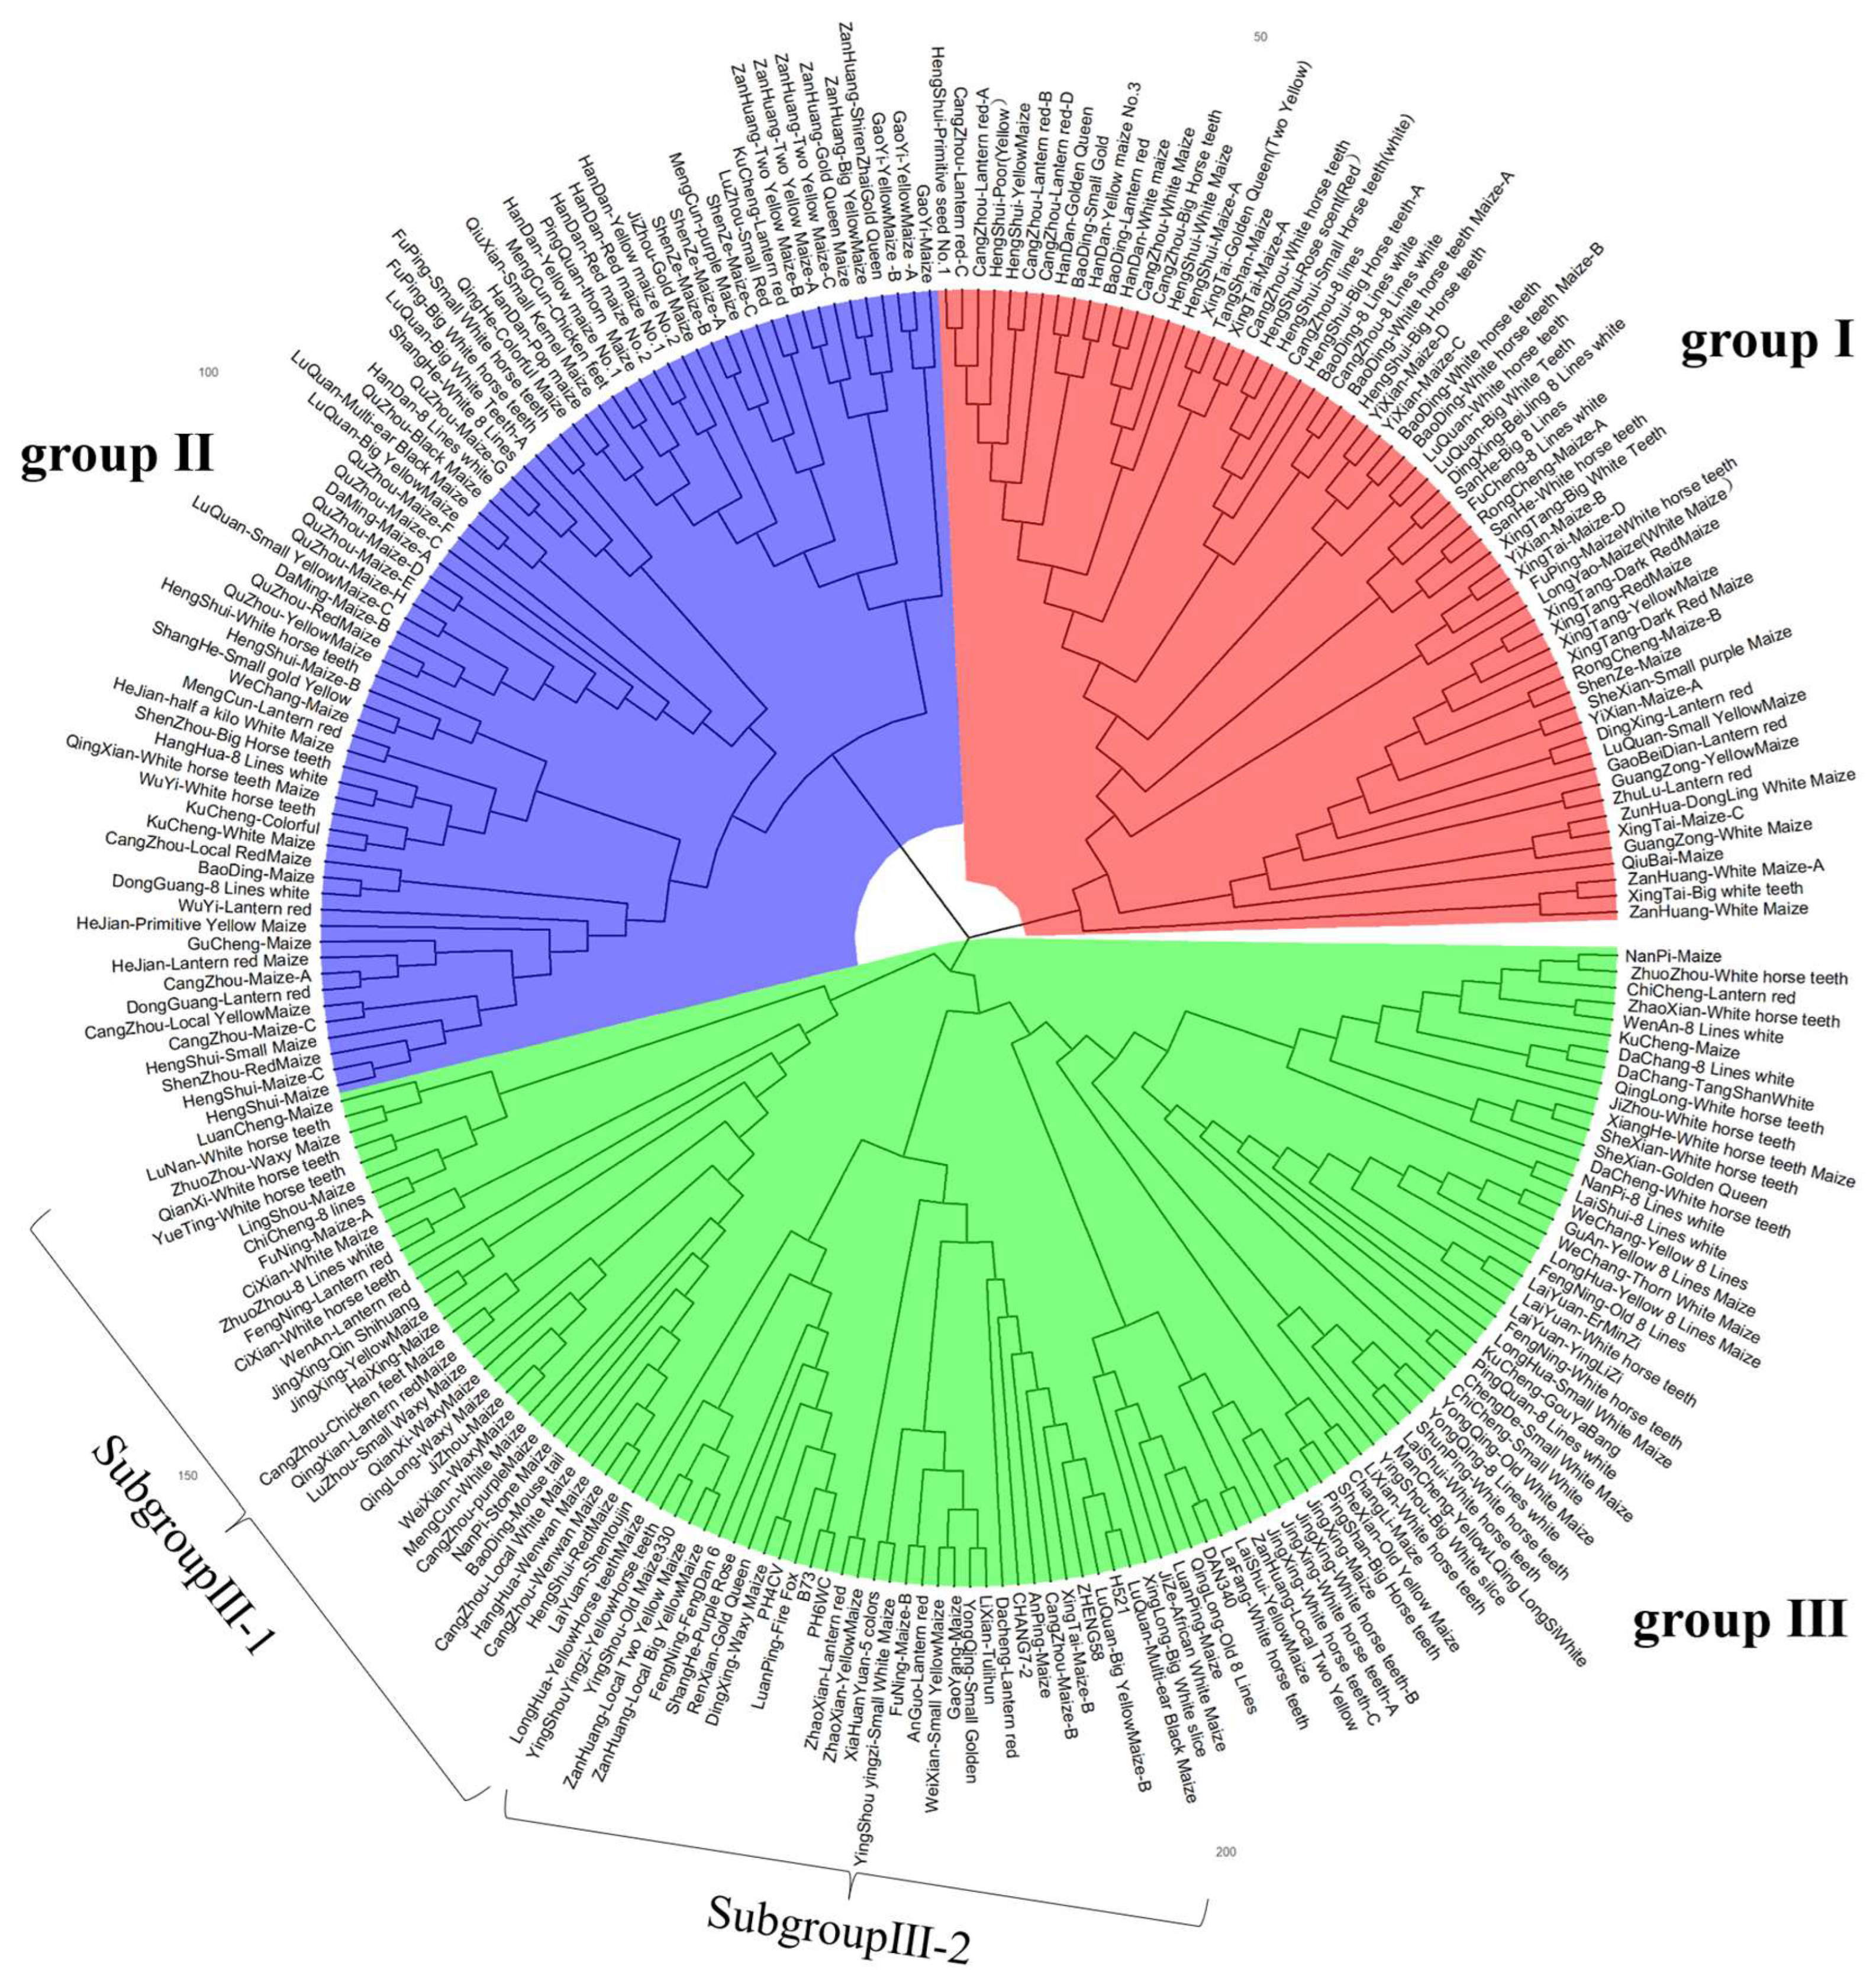
3.4. Cluster Analysis
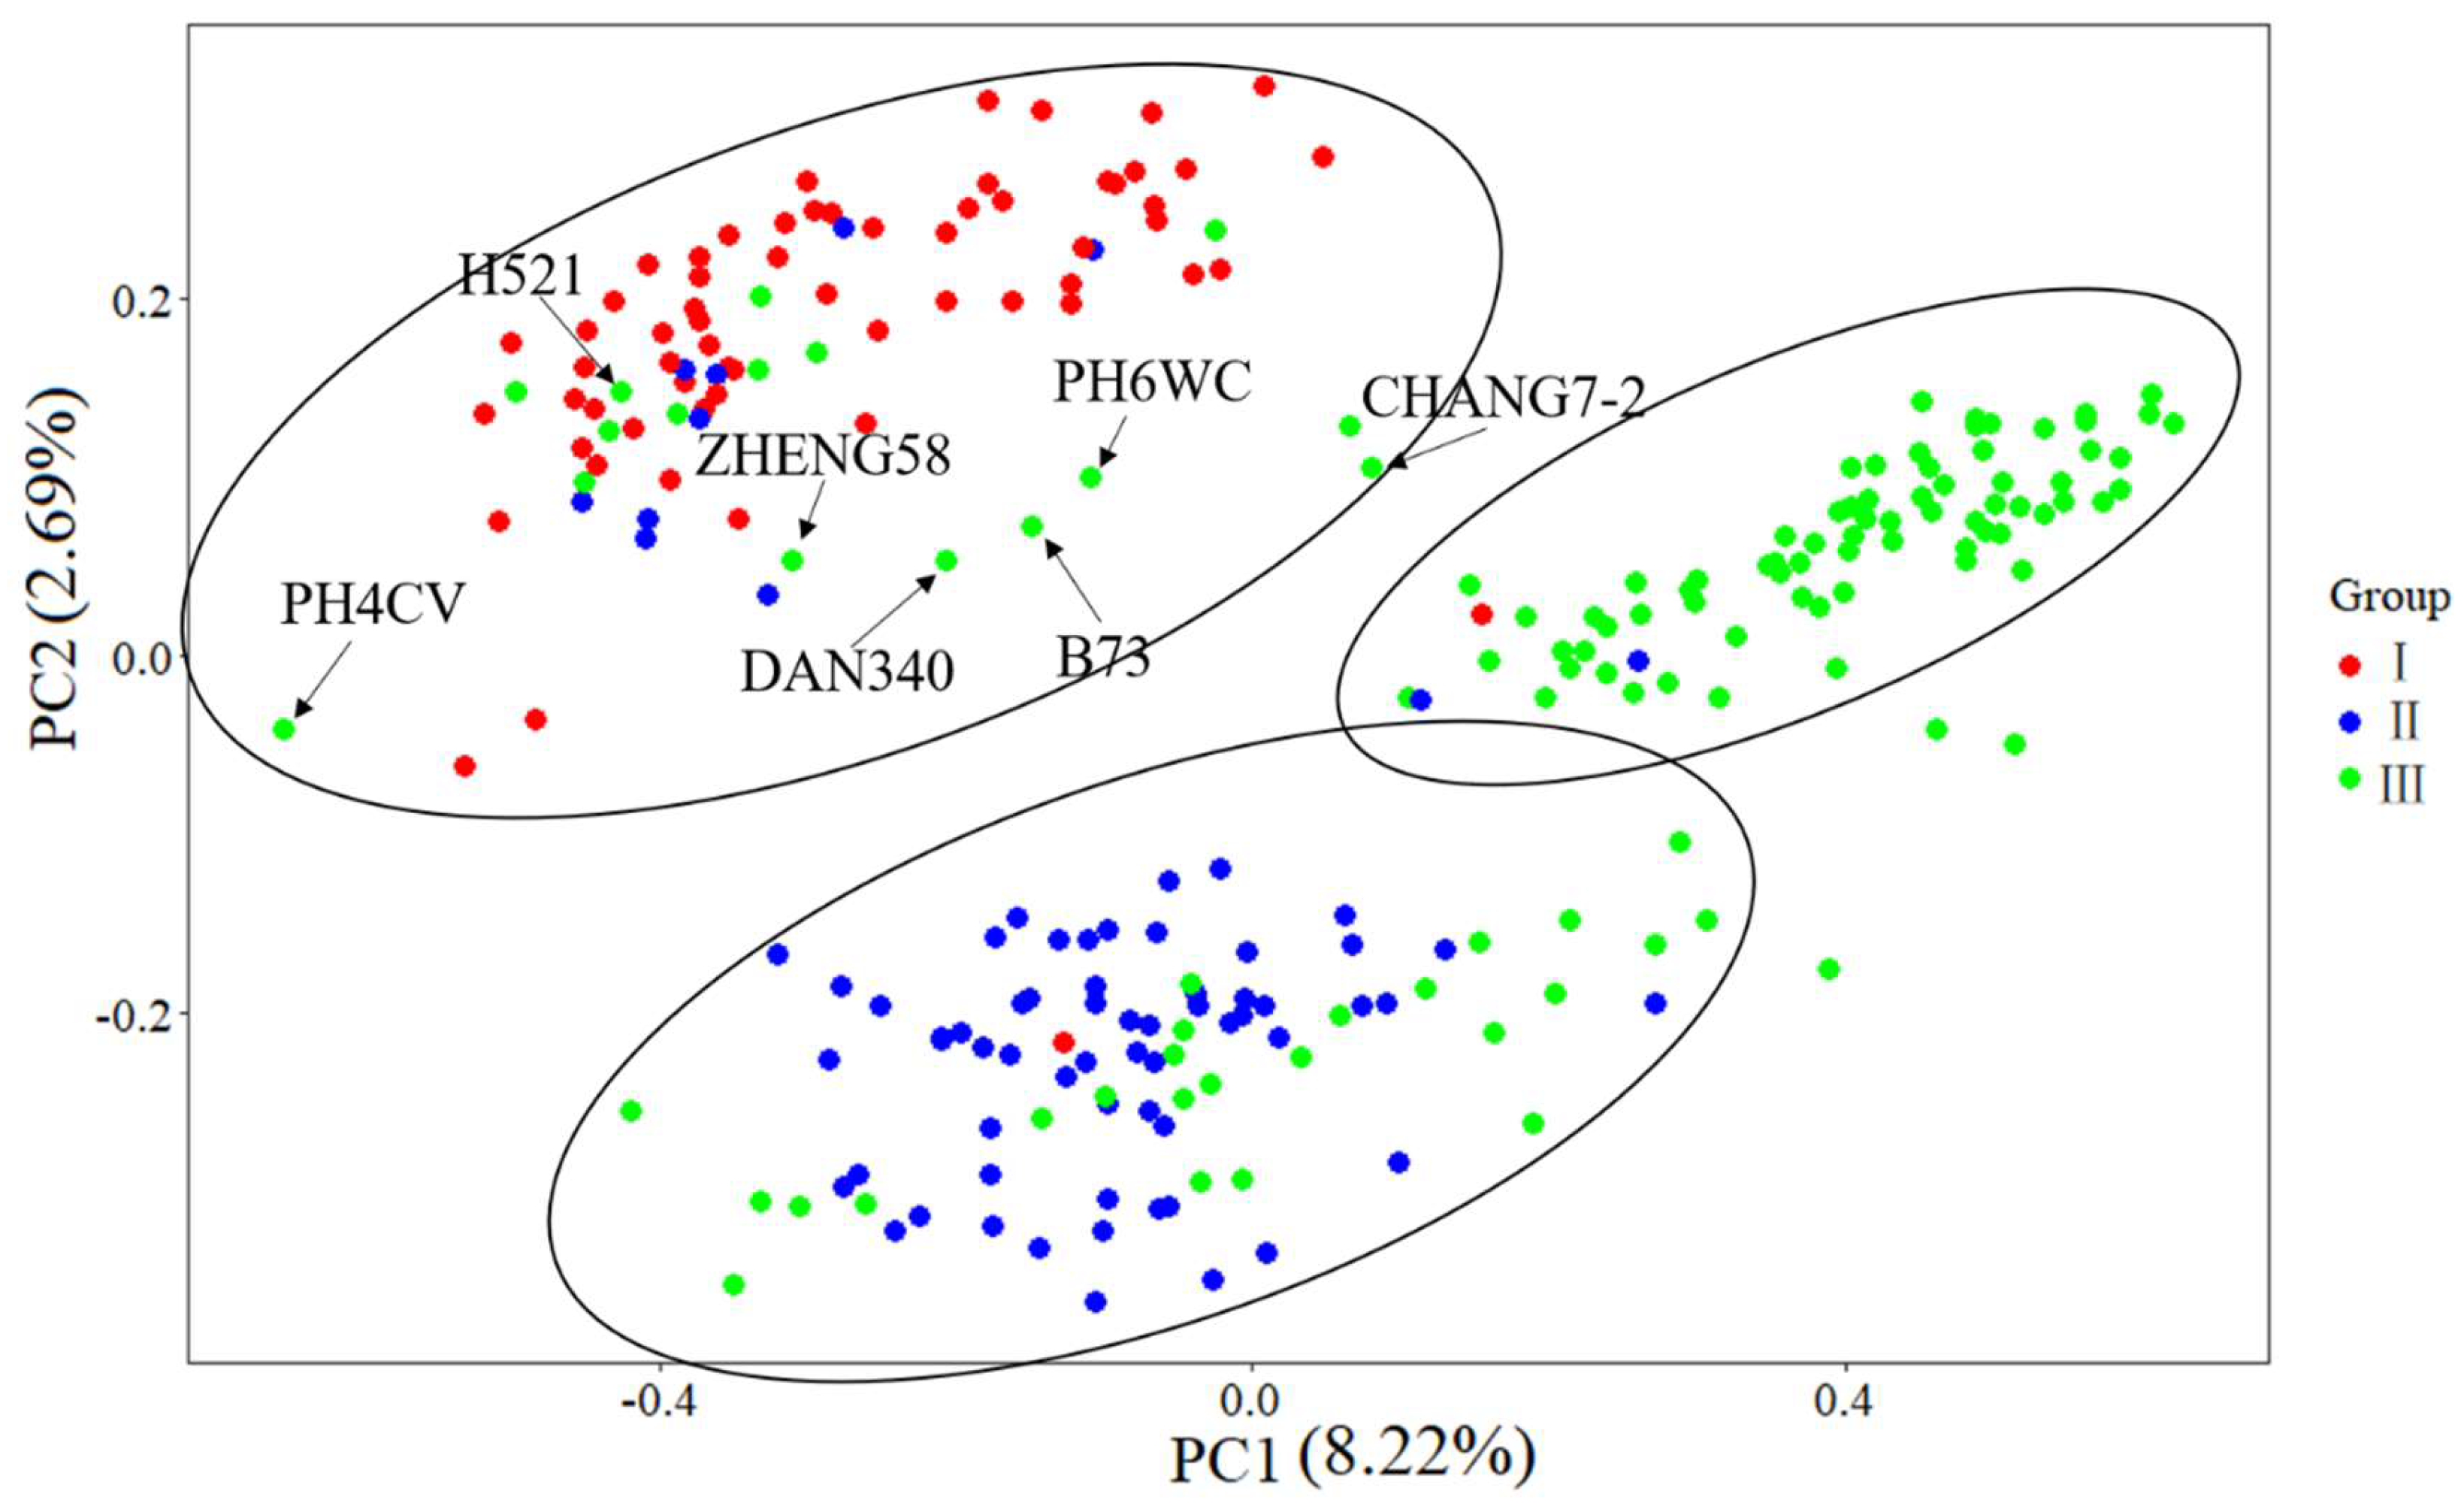
A total of 144,650 high-quality SNPs were selected and used as genotypes, and the MRD distance between the local germplasm was calculated. The UPGMA method was used for clustering. The results indicated that the landrace germplasms had high genetic diversity, and these were divided into three groups (Figure 7). Each group contained two or more distinct subgroups.
Group I included 64 landrace accessions, mainly of the White horse teeth type and other types of germplasms, such as BaoDing-White horse teeth, CangZhou-Big Horse teeth, HengShui-White Maize, ShenZe-Maize, XingTai-Golden Queen (Two Yellow); group II contained 71 landrace accessions, mainly of Lantern red, yellow maize and some White horse tooth types from different regions, for example, CangZhou-Local Yellow Maize, Handan Guangping-Yellow maize No. 1 and No. 2, HeJian-Lantern red Maize, Handan-Pop maize, WuYi-Lantern red, Shahe-White 8 lines maize, etc. There were a total of 116 local landrace accessions in group III, such as Zanhuang-local big yellow maize, Longhua-Yellow horse teeth maize, Luquan-local big yellow maize, Dacheng-lantern red, Jize-African white maize, Jingxing-White Horse tooth, etc. Group III contained a variety of types, and there was no majority of one type. Seven indicators were divided into this group, in which six indicator lines were included into subgroup III-2 except DAN340.
The estimates of Fst (Table 2) suggest that the genetic differentiation reached a middle level (Fst > 0.05) between group I and group II (0.053), and all differences between group I and group III or group II and group III were small (Fst < 0.05). The Fst of group I and group IIII was larger than that of group II and group III, which indicated that there was a smaller genetic distance between group II and group III.

3.5. MDS

The results of MDS analysis showed that the division among different groups was obvious (Figure 8). Principal component 1 (PC1) and principal component 2 (PC2) explained 8.22% and 2.69% of the genetic variation, respectively (Figure 8). According to the MDS results, 246 landrace accessions and seven indicators can be divided into three groups, which is consistent with the results of cluster analysis. The landrace germplasm of group I was White horse tooth, that of group II was hard grain maize such as Lantern red, and the local germplasm of group III was mixed germplasm such as White horse tooth, yellow maize and Lantern red. Most of the relationships of the seven indicators agreed with the actual situation. Compared with the results of cluster analysis, the landrace accessions in group I and group II were still in the same groups except for a few of them, but parts of the accessions of group III were divided into group I and group II, including seven inbred lines which were divided into group I. Most of the accessions of group III which were divided into group I and group II were clustered into subgroup III-2 and III-1, respectively. It can be seen from the figure that the representative inbred lines of Zheng58, Chang 7-2, PH4CV, PH6WC, B73 and other domestic heterosis groups indicate that inbred lines are located between the three populations.

4. Discussion

4.1. Heterotic Groups Inferred in Landrace Germplasm in China Central Belt

Local landrace germplasm plays an important role in the evolution of maize inbred lines in China because of its advantages in environmental adaptability and disease resistance [2,7,18,19]. As in the rest of the world, most of the landraces are maintained by the traditional family farming systems, and the spread of commercial hybrids has led to a steady substitution of landraces and accelerated genetic erosion [35]. The collection and preservation of landraces plays an important role in maintaining the diversity of Chinese maize germplasm and accelerating maize breeding.
Racial classification and heterotic grouping have seldom been carried out in China for landrace accessions [36]. The local landrace accessions have two types, White horse teeth type and non-White horse tooth; generally, the latter mainly includes Lantern red, purple corn and other flint-type maize. The results of cluster analysis were partly in agreement with the general classification results of landrace germplasms. Depending on phenotypic data or experience alone, heterosis groups were not correctly divided [21], especially for landrace germplasm, which is in the preheterotic group era. In the results of MDS, the landrace accessions were divided into three distinct groups, most of which are the same as those obtained with the cluster analysis. When K = 2, the CV error was lowest, with the second lowest at K = 3. Combining the results of cluster analysis, MDS and structure analysis indicated that the landrace germplasm panel was divided into three groups, which was reasonable and had scientific value.
The maize populations in Europe show less polymorphism than the American populations [37]. This polymorphism is particularly high in Central America, suggesting a gradual reduction in maize polymorphism as the geographic distance from the center of domestication increases [35]. There were no significant polymorphism differences between the landraces in the different geographical distributions assessed in this study. In the results of cluster analysis, White horse tooth type maize and non-White horse tooth maize were not completely independent of each other and were located in two groups, respectively. There is no obvious rule in the distribution of origin either. A possible reason is that the local landrace germplasm of different places and different types experienced a certain degree of exchange during the long period of cultivation. Especially in modern times, this process has accelerated with the convenience of transportation.

4.2. Linkage Disequilibrium Decay Distance

In our study, the average LD decay distance was 0.98 kb, which was much lower than that found in previous maize research. Zhang [5] analysed 362 inbred lines used in southwest China and the average LD decay distance was 0.50–0.75 Mb. The temperate group showed the largest distance (2.5–3.0 Mb) and the tropical group showed the smallest LD decay distance (0.25–0.50 Mb). The results of other studies were similar [25,38]. Some studies obtained a much shorter LD decay distance than 500 kb, but still much higher than the result of this study. The LD decay distance was approximately 100 kb in commercial elite inbred lines. The LD decay distance of landrace germplasm panel was much shorter than that of the tropical group and of the temperate group. The LD decay distance was about 6.7 kb in landrace lines in a previous study [39]; thus, 0.98 kb is reasonable for this panel. The LD decay distance is influenced by the source of inbred lines and selection intensity during the breeding process. Modern tropical and temperate inbred lines have a higher decay distance after a long period of manual selection. It also shows that the genetic diversity of landrace germplasm is much higher than that of commercial inbred lines.

4.3. Genetic Divergence of Three Groups

The distance from FST showed that the divergence between group I and group II was the largest among the three groups, reaching a middle level, which was similar to the distance between NSSS and BSSS, but smaller than the divergence between tropical and temperate maize germplasm [21]. The genetic distance between group III and group I/group II is small. Combined with the result of MDS, a possible reason is that some intermediate germplasms are included in group III. These intermediate germplasms may be the resulting germplasm exchange within group I or group II and group III, including indicator inbred lines. Indicator inbred lines are clustered in group III, but the results of MDS analysis show that they are closer to the White horse teeth. In the results of the structure, indicator inbred lines were divided into two groups, but the membership probability of these were within the groups of White horse teeth and Lantern red, without another group being considered. Combining the results of MDS, cluster and structure analysis, these inbred lines should be hybridized and fuse the advantages of the White horse teeth and Lantern red groups, including the large ear and high grain yield of the former, and the good grain quality and early maturity of the latter, and finally form the modern maize inbred lines.

4.4. Use of Maize Landraces in Breeding Programs

Several studies have shown the utility of local maize varieties in breeding programs [40,41]. For example, a composite “Parbhat” was developed from OPV Suwan-1 in Thailand, and popular hybrids include Him-129, which is well adapted to hill areas in India [35], HZS, originated from landrace Tang SiPingTou, and Dan340, derived from landrace LvDa Red Cob in China [7,19]. The development of molecular marker technologies helps us understand the genetic relationships, diversity and evolution of landraces. Racial classification and heterotic grouping should be carried out [36] and will help establish new breeding populations adapted to local ecological environments. The core collections for maize landrace accessions in one ecological region should be systematically and accurately identified. Biotic and abiotic stress resistance are also advantages of landrace germplasm [42,43]. Mining landrace germplasm is helpful to search for new resistance genes. In general, the utilization of maize landrace germplasm is of great significance for breeding.

5. Conclusions

Using the SLAF-seq, we performed the population structure, LD decay distance and cluster analysis of 246 landrace accessions collected from the central part of China. Landraces showed short LD decay distance compared with the tropical and temperate group, revealed that the genetic diversity of landrace germplasm is much higher than that of commercial inbred lines. Combining the results of cluster analysis, MDS and structure analysis indicated that the landrace germplasm panel was divided into three groups and indicator inbred lines should be hybridized and fuse the advantages of the White horse teeth and Lantern red groups. This work illustrates the genetic and molecular characterization of landraces from central China, and also can be used as the basis for future research, such as the utility of local maize varieties in breeding programs and genome-wide association study.

Supplementary Materials

The following supporting information can be downloaded at: https://www.mdpi.com/article/10.3390/agronomy14061278/s1, Table S1: Sources and kernel characteristics of maize landrace varieties.

Author Contributions

R.G.: Formal Analysis, Visualization and Writing—Original Draft. T.L.: Formal Analysis, Visualization and Writing—Original Draft. Q.Z.: Conceptualization and Writing—Review and Editing. J.W. (Jianghao Wang): Resources and Formal Analysis. J.G.: Project Administration and Formal Analysis. L.W.: Formal Analysis and Writing—Original Draft. L.S.: Formal Analysis and Writing—Original Draft. Y.Y.: Formal Analysis and Validation. D.Z.: Investigation and Writing—Review and Editing. J.W. (Jianfeng Wei): Investigation and Formal Analysis. X.L.: Investigation and Formal Analysis. W.S.: Conceptualization, Methodology, Supervision, Visualization and Writing—Review and Editing. All authors have read and agreed to the published version of the manuscript.

Funding

This research was funded by the Science and Technology Innovation Team of Maize Modern Seed Industry in Hebei (grant number: 21326319D), the HAAFS Science and Technology Innovation Special Project (grant number: 2022KJCXZX-LYS-4) and the Basic Research Funds of Hebei Academy of Agriculture and Forestry Sciences (grant number: 2021060202).

Data Availability Statement

The datasets generated during and/or analyzed during the current study are available from the corresponding author upon reasonable request.

Conflicts of Interest

The authors declare no conflicts of interest.

References

  1. FAO. FAOSTAT, Production. 2014. Available online: https://www.fao.org/faostat/en/#data (accessed on 5 May 2024).
  2. Zhang, R.; Xu, G.; Li, J.; Yan, J.; Li, H.; Yang, X. Patterns of genomic variation in Chinese maize inbred lines and implications for genetic improvement. Theor. Appl. Genet. 2018, 131, 1207–1221. [Google Scholar] [CrossRef] [PubMed]
  3. Jones, P.; Thornton, P. The potential impacts of climate change on maize production in Africa and Latin America in 2055. Glob. Environ. Chang. 2003, 13, 51–59. [Google Scholar] [CrossRef]
  4. Beyene, Y.; Semagn, K.; Crossa, J.; Mugo, S.; Atlin, G.N.; Tarekegne, A.; Meisel, B.; Sehabiagur, P.; Vivek, B.S.; Alvarado, G.; et al. Improving Maize Grain Yield under Drought Stress and Non-stress Environments in Sub-Saharan Africa using Marker-Assisted Recurrent Selection. Crop Sci. 2016, 56, 344–353. [Google Scholar] [CrossRef]
  5. Zhang, X.; Zhang, H.; Li, L.; Lan, H.; Ren, Z.; Liu, D.; Wu, L.; Liu, H.; Jaqueth, J.; Li, B.; et al. Characterizing the population structure and genetic diversity of maize breeding germplasm in Southwest China using genome-wide SNP markers. BMC Genom. 2016, 17, 697. [Google Scholar] [CrossRef] [PubMed]
  6. Li, J.S. Production, breeding and process of maize in China. In Handbook of Maize: Its Biology; Jeff, L.B., Sarah, C.H., Eds.; Springer: New York, NY, USA, 2009; pp. 563–576. [Google Scholar]
  7. Li, Y.; Wang, T. Germplasm base of maize breeding in China and formation of foundation parents. Maize Sci. 2010, 18, 1–8. [Google Scholar]
  8. Troyer, A.F. Adaptedness and Heterosis in Corn and Mule Hybrids. Crop Sci. 2006, 46, 528–543. [Google Scholar] [CrossRef]
  9. Shull, G.H. Beginnings of the heterosis concept. In Heterosis; Gowan, J.W., Ed.; Iowa State College Press: Ames, IA, USA, 1952; pp. 14–49. [Google Scholar]
  10. Singleton, W.R. Handbook of hybrid corn. J. Hered. 1963, 54, 205–206. [Google Scholar] [CrossRef]
  11. Hallauer, A.R.; Miranda, J.B. Quantitative Genetics in Maize Breeding; Iowa State University Press: Ames, IA, USA, 1981. [Google Scholar]
  12. Sprague, G.F. Heterosis in maize: Theory and practice. In Heterosis; Frankel, R., Ed.; Springer: Berlin/Heidelberg, Germany, 1983; pp. 47–70. [Google Scholar]
  13. Hallauer, A.R.; Russell, W.A.; Lamkey, K.R. Corn breeding. In Corn and Corn Improvement, 3rd ed.; Sprague, G.F., Dudley, J.W., Eds.; Crop Science Society of America: Madison, WI, USA, 1988. [Google Scholar]
  14. Tracy, W.F.; Chandler, M.A. The Historical and Biological Basis of the Concept of Heterotic Patterns in Corn Belt Dent Maize. In Plant Breeding: The Arnel R. Hallauer International Symposium (Lamkey/Plant); Blackwell Publishing: Ames, IA, USA, 2006; pp. 219–233. [Google Scholar]
  15. Li, Y. Development and germplasm base of maize hybrids in China. Maydica 1998, 43, 259–269. [Google Scholar]
  16. Chinese Academy of Agricultural Science. Elite Germplasm of Maize—Index to Research and Utility; China Agriculture Press: Beijing, China, 1996; pp. 1–9. [Google Scholar]
  17. Wang, T.; Ma, X.; Li, Y.; Bai, D.; Liu, C.; Liu, Z.; Tan, X.; Shi, Y.; Song, Y.; Carlone, M.; et al. Changes in Yield and Yield Components of Single-Cross Maize Hybrids Released in China between 1964 and 2001. Crop Sci. 2011, 51, 512–525. [Google Scholar] [CrossRef]
  18. Shu, G.; Cao, G.; Li, N.; Wang, A.; Wei, F.; Li, T.; Yi, L.; Xu, Y.; Wang, Y. Genetic variation and population structure in China summer maize germplasm. Sci. Rep. 2021, 11, 8012. [Google Scholar] [CrossRef]
  19. Qu, G.; Xu, W.W.; Chen, D.Y.; Li, F.Z.; Shi, J.G.; Liu, X.; Ning, J.L. The breeding and application of the elite maize inbred line Dan340. J. Maize Sci. 2002, 10, 30–33. [Google Scholar]
  20. Melchinger, A.E.; Gumber, R.K. Overview of heterosis and heterotic groups in agronomic crops. In Concepts and Breeding of Heterosis in Crop Plants; Larnkey, K.R., Staub, J.E., Eds.; CSSA: Madison, WI, USA, 1998; pp. 29–44. [Google Scholar]
  21. Guo, R.; Chen, J.; Petroli, C.D.; Pacheco, A.; Zhang, X.; San Vicente, F.; Hearne, S.J.; Dhliwayo, T. The genetic structure of CIMMYT and U.S. inbreds and its implications for tropical maize breeding. Crop Sci. 2021, 61, 1666–1681. [Google Scholar] [CrossRef]
  22. Teng, W.T.; Can, J.S.; Chen, Y.H.; Liu, X.H.; Jing, X.Q.; Zhang, F.J.; Li, J.S. Analysis of maize heterotic groups and patterns during past decade in China. Sci. Agric. Sin. 2004, 37, 1804–1811. [Google Scholar]
  23. Wang, R.H.; Yu, Y.T.; Zhao, J.R.; Shi, Y.; Song, Y.C.; Wang, T.Y.; Li, Y. Population structure and linkage disequilibrium of a mini core set of maize inbred lines in China. Theor. Appl. Genet. 2008, 117, 1141–1153. [Google Scholar] [CrossRef]
  24. Xie, C.X.; Zhang, S.H.; Li, M.S.; Li, X.H.; Hao, Z.F.; Bai, L.; Zhang, D.G.; Liang, Y.H. Inferring genome ancestry and estimating molecular relatedness among 187 Chinese maize inbred lines. J. Genet. Genom. 2007, 34, 738–748. [Google Scholar] [CrossRef] [PubMed]
  25. Wu, Y.; San Vicente, F.; Huang, K.; Dhliwayo, T.; Costich, D.E.; Semagn, K.; Sudha, N.; Olsen, M.; Prasanna, B.M.; Zhang, X.; et al. Molecular characterization of CIMMYT maize inbred lines with genotyping-by-sequencing SNPs. Theor. Appl. Genet. 2016, 129, 753–765. [Google Scholar] [CrossRef] [PubMed]
  26. Murray, M.G.; Thompson, W.F. Rapid isolation of high molecular weight plant DNA. Nucleic Acids Res. 1980, 8, 4321–4326. [Google Scholar] [CrossRef] [PubMed]
  27. Sun, X.; Liu, D.; Zhang, X.; Li, W.; Liu, H.; Hong, W.; Jiang, C.; Guan, N.; Ma, C.; Zeng, H.; et al. SLAF-seq: An Efficient Method of Large-Scale de Novo SNP Discovery and Genotyping Using High-Throughput Sequencing. PLoS ONE 2013, 8, e58700. [Google Scholar] [CrossRef] [PubMed]
  28. R Core Team. R: A Language and Environment for Statistical Computing; R Foundation for Statistical Computing: Vienna, Austria, 2019. [Google Scholar]
  29. Bradbury, P.J.; Zhang, Z.; Kroon, D.E.; Casstevens, T.M.; Ramdoss, Y.; Buckler, E.S. TASSEL: Software for association mapping of complex traits in diverse samples. Bioinformatics 2007, 23, 2633–2635. [Google Scholar] [CrossRef]
  30. Wright, S. The genetical structure of populations. Ann. Eugen. 1951, 15, 323–354. [Google Scholar] [CrossRef]
  31. Koichiro, T.; Glen, S.; Sudhir, K. MEGA11: Molecular Evolutionary Genetics Analysis version 11. Mol. Biol. Evol. 2021, 38, 3022–3027. [Google Scholar]
  32. Yu, G.; Lam, T.T.Y.; Zhu, H.; Guan, Y. Two methods for mapping and visualizing associated data on phylogeny using ggtree. Mol. Biol. Evol. 2018, 35, 3041–3043. [Google Scholar] [CrossRef] [PubMed]
  33. Brown, A.H.D. The estimation of Wright’s fixation index from genotypic frequencies. Genetica 1970, 41, 399–406. [Google Scholar] [CrossRef] [PubMed]
  34. Danecek, P.; Auton, A.; Abecasis, G.; Albers, C.A.; Banks, E.; Depristo, M.A.; Handsaker, R.E.; Lunter, G.; Marth, G.T.; Sherry, S.T. The variant call format and VCFtools. Bioinformatics 2011, 27, 2156–2158. [Google Scholar] [CrossRef]
  35. Prasanna, B.B. Phenotypic and molecular diversity of maize landraces: Characterization and utilization. Indian J. Genet. 2010, 70, 315–327. [Google Scholar]
  36. Li, Y.; Shi, Y.; Cao, Y.; Wang, T. Establishment of a core collection for maize germplasm preserved in Chinese National Genebank using geographic distribution and characterization data. Genet. Resour. Crop Evol. 2004, 51, 845–852. [Google Scholar] [CrossRef]
  37. Rebourg, C.; Gouesnard, B.; Charcosset, A. Large scale molecular analysis of traditional European maize populations—Relationships with morphological variation. Heredity 2001, 86, 574–587. [Google Scholar] [CrossRef] [PubMed]
  38. Yan, J.; Shah, T.; Warburton, M.L.; Buckler, E.S.; McMullen, M.D.; Crouch, J. Genetic Characterization and Linkage Disequilibrium Estimation of a Global Maize Collection Using SNP Markers. PLoS ONE 2009, 4, e8451. [Google Scholar] [CrossRef] [PubMed]
  39. McLean-Rodríguez, F.D.; Costich, D.E.; Camacho-Villa, T.C.; Mario, E.P.; Matteo, D.A. Genetic diversity and selection signatures in maize landraces compared across 50 years of in situ and ex situ conservation. Heredity 2021, 126, 913–928. [Google Scholar] [CrossRef]
  40. Dhillon, B.S.; Prasanna, B.M. Maize. In Breeding Field Crops; Chopra, V.L., Ed.; Oxford & IBH: New Delhi, India, 2001; pp. 147–189. [Google Scholar]
  41. Dhillon, B.S.; Vasal, S.K.; Prasanna, B.M. Maize. In Evolution and Adaptation of Cereal Crops; Chopra, V.L., Shyam, P., Eds.; Oxford & IBH: New Delhi, India, 2002; pp. 99–133. [Google Scholar]
  42. Reid, L.; Arnason, J.T.; Nozzolillo, C.; Hamilton, R.H. Resistance of maize to the European corn borer, Ostrinia nubilalis, as related to the geographical origin of maize. Can. J. Bot. 1990, 68, 311–316. [Google Scholar] [CrossRef]
  43. CIMMYT. Development of New Stress Resistant Maize Genetic Resources (UNDP Project GLO/90/003); CIMMYT Maize Programme Special Report; CIMMYT: Mexico City, Mexico, 1997. [Google Scholar]
Figure 1. Density distribution of SNP markers on chromosomes.
Agronomy 14 01278 g001
Figure 2. Mean values of minor allele frequency, missing rate, heterozygous proportion and Shannon index of SNPs in each chromosome. (a) Mean values of minor allele frequency; (b) mean values of missing rate; (c) mean values of heterozygous proportion; (d) mean values of Shannon index.
Agronomy 14 01278 g002
Figure 3. Trends of mean r2 over different intervals of LD decay distance of 10 chromosomes and total chromosomes.
Agronomy 14 01278 g003
Figure 4. Cross-validation error rate for each k value when K = 1~20.
Agronomy 14 01278 g004
Figure 5. Population structure of 246 germplasm resources from K = 2 to K = 3.
Agronomy 14 01278 g005
Figure 6. The landrace accessions’ assignment by admixture when K = 3. The gray, orange and blue bars represent the Q of White horse teeth group, Lantern red group and small-kernel flint maize group.
Agronomy 14 01278 g006
Figure 7. Cluster analysis diagram based on label information.
Agronomy 14 01278 g007
Figure 8. Scatter plot of the first two principal components (PC1, PC2) for the landrace accessions and seven indicator inbred lines.
Agronomy 14 01278 g008
Table 1. Seven indicators inbred lines and heterosis group.
NameB73PH6WCPH4CVZHENG58CHANG7-2DAN340H521
Heterosis groupsBSSSBSSSNSSSM-ReidTang SiPing TouLvDa Red CobDomestic synthetic species
Table 2. Pairwise Wright’s Fixation Index (Fst) value for the three landrace germplasm groups.
GroupIIIIII
I-0.0530.045
II0.053-0.035
III0.0450.035-
Disclaimer/Publisher’s Note: The statements, opinions and data contained in all publications are solely those of the individual author(s) and contributor(s) and not of MDPI and/or the editor(s). MDPI and/or the editor(s) disclaim responsibility for any injury to people or property resulting from any ideas, methods, instructions or products referred to in the content.

