Article

Land Degradation Affects Soil Microbial Properties, Organic Matter Composition, and Maize Yield

1
School of Forestry, Northeast Forestry University, Harbin 150040, China
2
Northeast Institute of Geography and Agroecology, Chinese Academy of Sciences, Harbin 150081, China
*
Authors to whom correspondence should be addressed.
Agronomy 2024, 14(7), 1348; https://doi.org/10.3390/agronomy14071348
Submission received: 23 April 2024 / Revised: 14 June 2024 / Accepted: 19 June 2024 / Published: 21 June 2024
(This article belongs to the Special Issue Effects of Arable Farming Measures on Soil Quality)

Abstract

:
Land degradation severely affects soil functions, thereby weakening crop productivity. However, the quantitative effects of the soil organic matter (SOM) composition and soil microbial properties on maize yield remain unclear under different levels of land degradation. Here, a gradient of land degradation was selected for sampling in the Horqin Sandy Land in northeast China. The results show that the relative abundances of aliphatic and aromatic groups decreased by 21.51% and 86.01% with increasing land degradation, respectively, and the considerable increase in polysaccharide groups led to a decrease in stability and resistance to SOM decomposition. Microbial properties, such as microbial biomass carbon, basic respiration, qCO2, and enzyme activities, decreased as a result of land degradation. The phospholipid fatty acid content and the ratio between bacteria and fungi markedly decreased with an increasing level of land degradation, and the ratio of G+ to G markedly increased. Correlation analysis confirmed that the microbial properties were significantly related to the SOM composition, and the random forest model indicated that fungi were key factors affecting maize yield (7.15%, p < 0.05). Moreover, the results of the structure equation modelling revealed that land degradation reduced the soil physiochemical properties, resulting in a decrease in microorganisms, causing variations in the SOM composition and directly leading to a decrease in crop yield. The effect of microorganisms (β = 0.84 ***) on maize yield was greater than that of the SOM composition (β = 0.53 **). Our investigation can provide a theoretical basis for the conservation of the cropland in Horqin Sandy Land.

1. Introduction

Soil is the living skin of Earth and is vital to ecosystem services for life, including soil moisture retention, organic carbon sequestration, nutrient cycling, microbial metabolism, and survival and plant production [1]. In recent decades, approximately one-third of the global land surface has been degraded to varying degrees, and 24 billion tons of fertile soil is lost annually [2]. Land degradation is one of the largest problems for agricultural soils globally. Currently, land degradation is projected to cause a 50% reduction in crop yield [3]. Thus, research on the effects of agricultural soil properties on crops in the context of land degradation is essential for environmental protection and agricultural production.
Soil organic matter (SOM) plays a vital role in the soil environment and is inextricably linked to the global carbon cycle [4,5]. Dynamic changes in the SOM components under increased land degradation can alter the stability of the soil structure and affect the carbon balance and sequestration in ecosystems [6]. He et al. [7] showed that soil erosion degradation not only leads to the loss of SOM fractions but also alters the proportional distribution of its fractions, which in turn affects the functioning of the soil organic carbon. Zhang [8] found that meadow soils contain more polycyclic aromatic hydrocarbons than desert sandy land, possessing a complex structure and inhibiting SOM decomposition and loss. The high complexity of SOM’s origin and composition has led to the application of the principle underlying change in SOM’s chemical structure [9]. SOM composition is characterised by identifying the vibrational features of its structural chemical bonds, such as O–H and C–H, and other selective absorption differences in infrared light through Fourier transform infrared (FTIR) spectroscopy [10,11]. Based on this approach, Margenot et al. found a positive relationship between aliphatic –CH and organic matter stability after analysing the functional groups of the SOM in a Californian tomato field [12]. Overall, research on the response of SOM composition to land degradation is vital.
Microorganisms are the facilitators of soil ecosystem change and significant influencers in degraded lands [13]. The common soil microbial indicators of microbial biomass C (MBC), soil basal respiration (Br), and soil enzyme activities are the effective indicators of its adaptation and response to land degradation [14,15,16]. A study by Liu et al. [17] indicated that the severe degradation of subalpine meadows was manifested by a decrease in plant growth-promoting microorganisms and unbalanced CN cycling. In addition, the microbial community structure is affected by land degradation [1]. Cui et al. [18] and Yao et al. [19] explored variations in the structures of soil microbial communities identified by the phospholipid fatty acid (PLFA) technique in different levels of degraded grasslands. Grassland degradation significantly affects the community structures of soil microorganisms, lowering soil microbial populations and reducing activity [20]. A recent study has suggested that changes in microorganisms can lead to irreversible negative influences on the degradation of grasslands in Tibet [21]. Notably, the group of microorganisms is an important driver of land degradation and may even determine its direction and strength [22]. To date, studies on the mechanisms by which different levels of land degradation affect microbial properties are still scarce.
Maize crops are cultivated widely around the world, including in Horqin Sandy Land, which is situated in an agricultural and pastoral zone and holds considerable importance for agriculture. Horqin Sandy Land is the typical wind-eroded region in northeast China, where 80% of the land has experienced land degradation in recent decades [23]. Thus, the maize yield may be greatly threatened. The SOM compositions correlate well with crop productivity [24,25,26]. Li et al. [24] found that a combination of short-term soil tillage and straw return can change the unstable organic carbon fraction and chemical composition of soil ecosystems, thereby affecting soil productivity. Mahmood [27] found that organic matter-rich soils contribute to stabilising maize yields in arid conditions. In addition, as efficient bioindicators of soil health, soil microorganisms mediate various essential processes related to soil nutrient function and plant growth [28]. Soil microorganisms influence the soil bacterial and fungal diversity through soil physico-chemical properties, which in turn change the functional community composition, and thus affect crop yields [29]. Liu et al. [30] and Li et al. [31] reported that manure substitution enhanced maize yield by increasing the soil biological network stability. However, the quantitative effects of SOM composition and soil microbial properties on maize yield remain unclear under different levels of land degradation. In this context, our study aimed to explore the mechanisms of land degradation-associated variations in the physiochemical properties in soil, SOM composition, microbial community structure, and maize yield under different levels of land degradation in Horqin Sandy Land. In this study, we hypothesized that: (1) different levels of land degradation significantly would change the SOM composition and microorganisms; (2) land degradation would decrease maize yield through declining soil physiochemical properties and shift the microbial community structure, thereby changing the SOM component. Our study can provide a theoretical basis for the conservation of the cropland in Horqin Sandy Land.

2. Materials and Methods
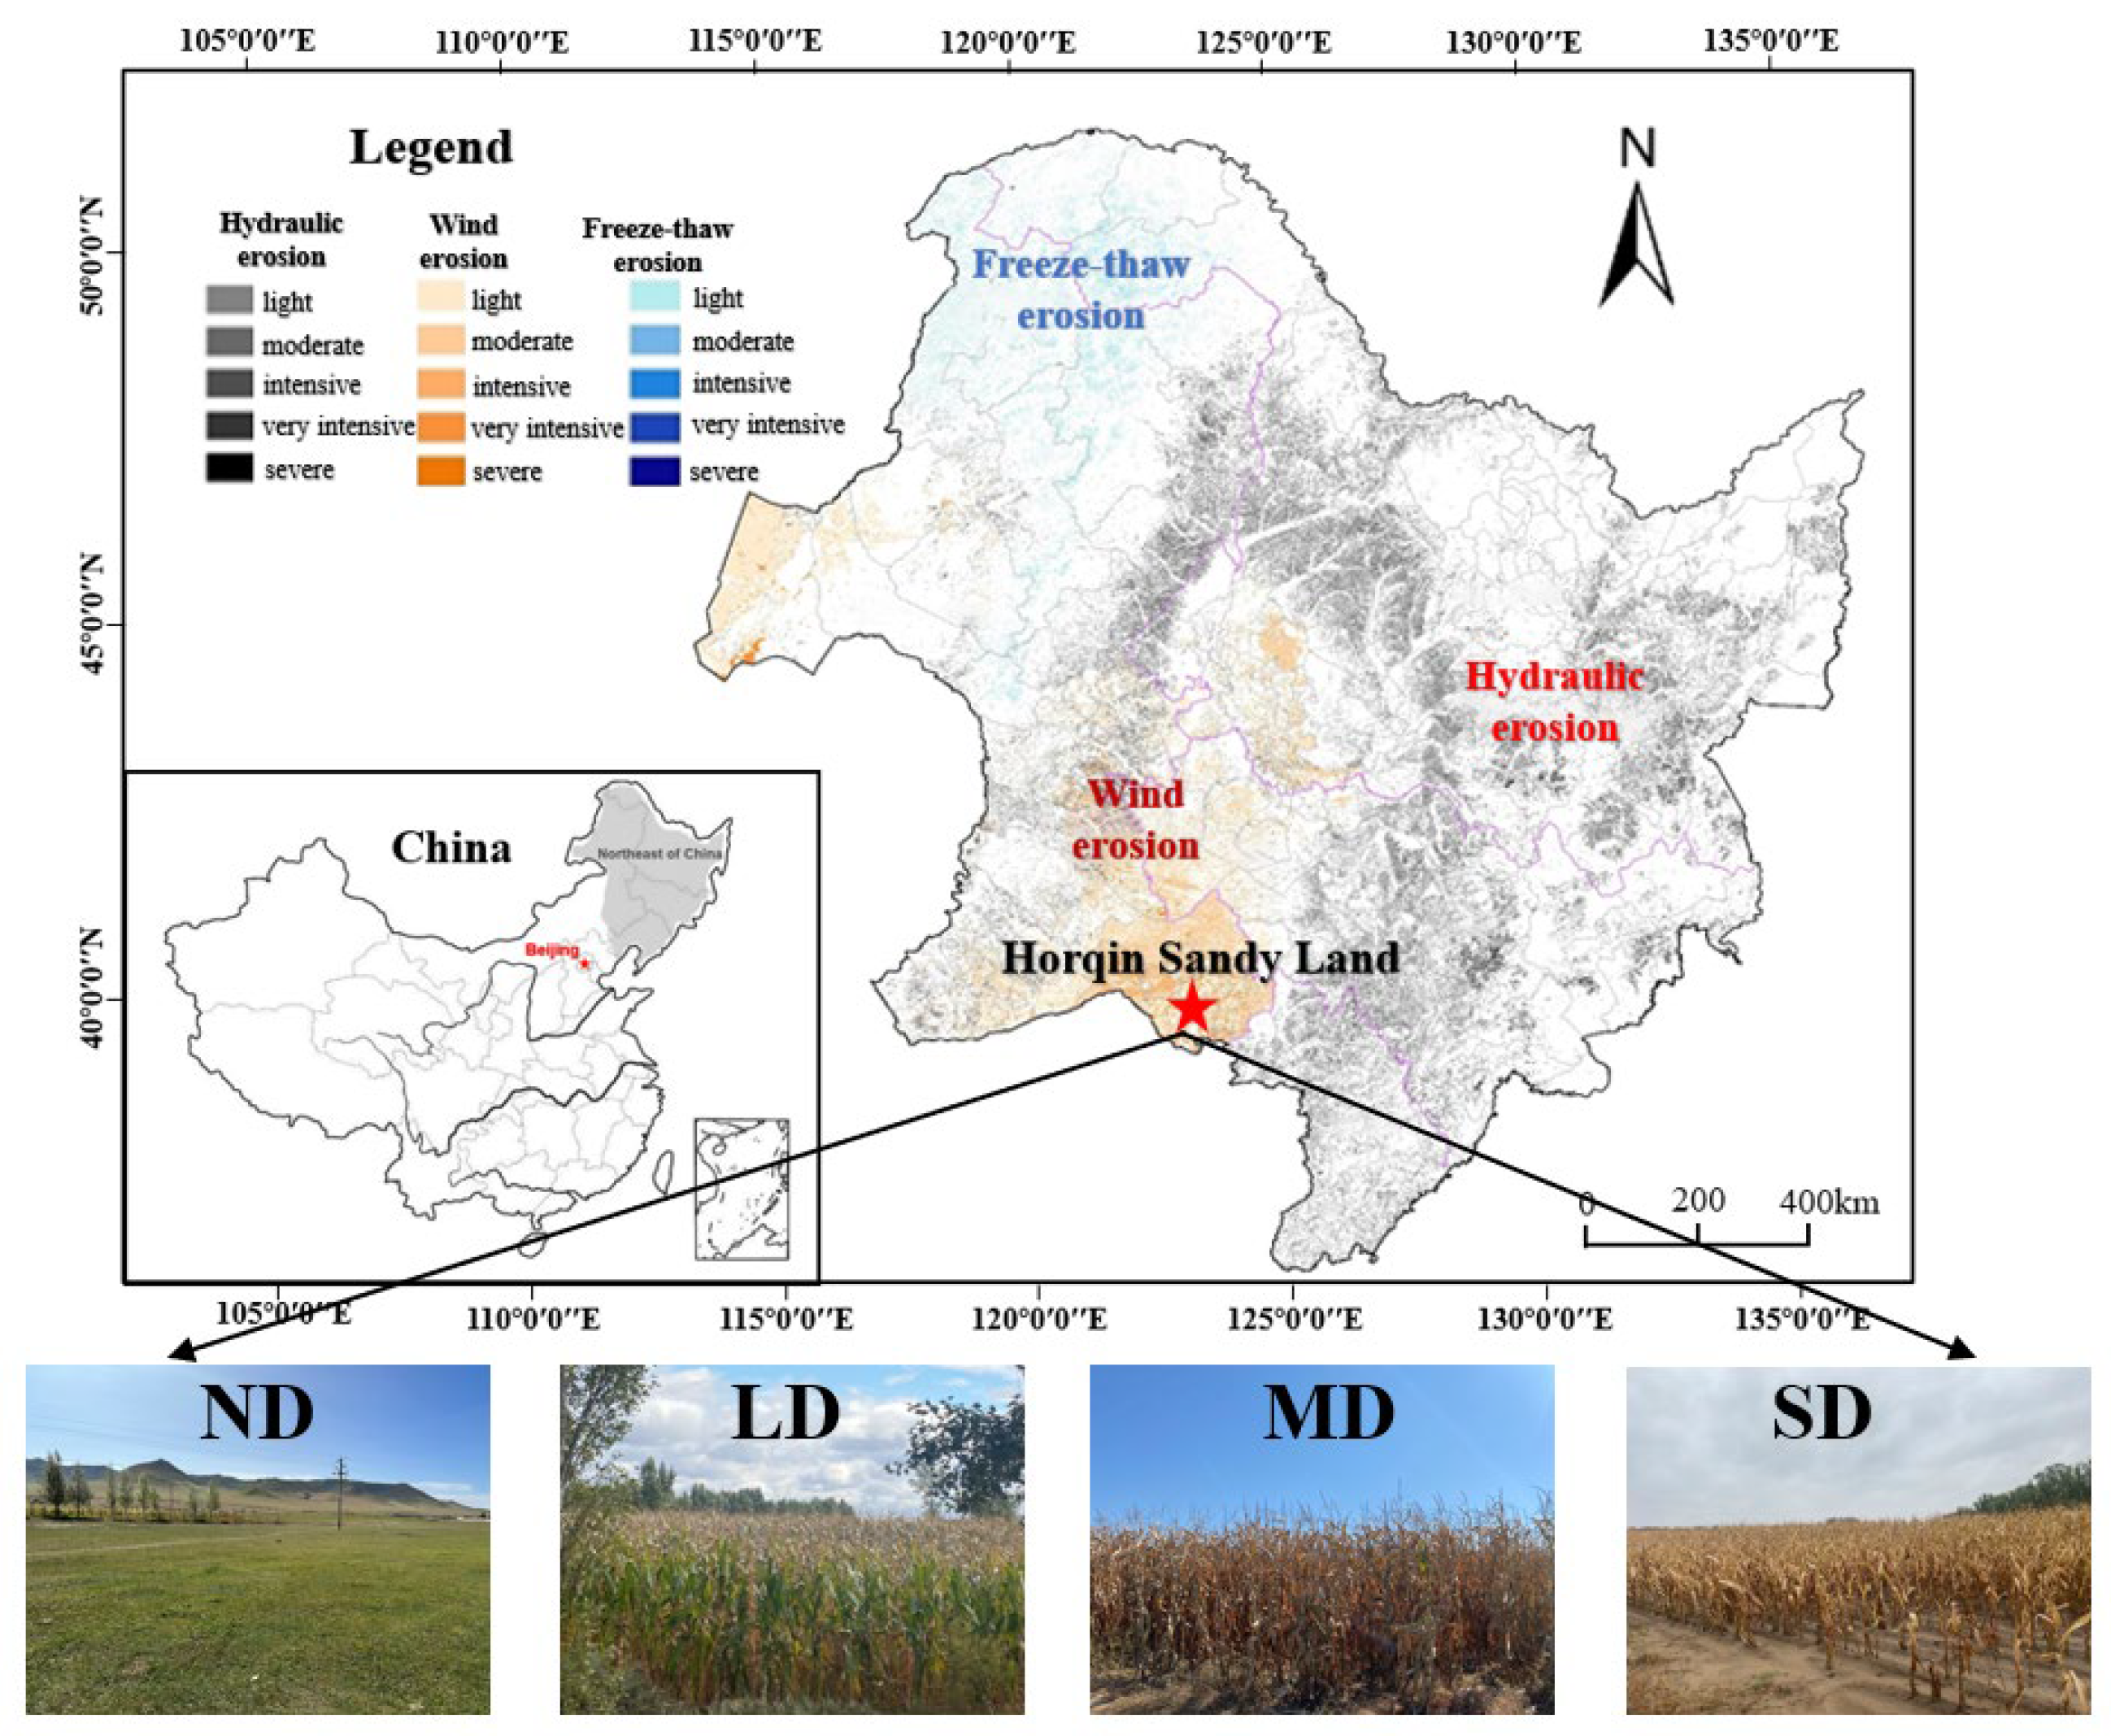
2.1. Study Site

This study was conducted in Horqin Sandy Land, which is located on Horqin Left Banner in Tongliao City of Mongolia Province in northeast China (42°15′–45°41′ N, 119°–123°43′ E). The region is a typical wind erosion area in the northern agricultural and pastoral belt [32]. The soil type is classified as Arenosol by the World Reference Base for Soil Resources. The region has an average annual temperature of 0–6 °C, precipitation of 350–400 mm, and a middle-temperate semiarid continental monsoon climate. The evaporation rate is approximately five times the precipitation rate, and the annual average wind speed is 3–4.4 m s−1. The number of days with strong wind (magnitude 8 or higher) is 20–30 days per year. Owing to grassland reclamation in the past 200 years, the original large-scale grassland has gradually been converted into cropland. The cropland area has increased because of agricultural development, which is particularly affected by wind erosion [33].

2.2. Soil Sampling

The croplands were characterised by varying degrees of wind erosion through field surveys. Soil loss was determined by 137Cs tracing analysis, which was performed using the Ortec GWL-120-15 (AMETEK ORTEC, Oak Ridge, TN, USA) well-type high-purity germanium detector [34]. In accordance with the types and degrees of land degradation standards (Table 1), we selected lightly degraded cropland (LD), moderately degraded cropland (MD), and severely degraded cropland (SD) along a transect in the study area [35,36]. The non-degraded natural grassland (ND) that has not been cultivated for decades in the transect was selected as the control (Figure 1). The average soil losses were calculated as 190, 600, 2400, and 6200 t km−2 a−1 at ND, LD, MD, and SD, respectively. The selected sites in the cropland were converted from grassland for crop production approximately 60 years ago, and maize (Zea mays L.) is the main crop, which has been cultivated continuously in this area for 20 years under the same regime, fertilisation, and weather conditions.
Soil samples were obtained at a depth of 0–20 cm in April 2022 (at the end of the fallow period after the corn harvest in 2021). A total of 10 independent plots (30 m × 30 m) for each degradation level (three locations for each plot) were selected as the experimental locations on flat land with slopes of less than 5° and elevation differences of up to 10 m. The distance between each plot did not exceed 5 km. In each subplot, composite samples (2–3 kg) of five random subsamples were collected with 5 cm-diameter hand-operated soil cores. In total, 120 soil samples were separated from roots and rocks and brought to the laboratory. The soil samples were passed through a 2 mm sieve and separated into three parts: (1) the fresh samples were stored at 4 °C for measurements of the soil dissolved organic carbon (DOC), MBC, and Br; (2) one subsample was transported to the laboratory with a cooler and stored at −80 °C for the measurement of PLFAs; and (3) the air-dried samples were used for other soil analyses. The criteria for evaluating the land degradation by wind erosion are shown in Table 1.

2.3. Soil Analyses

2.3.1. Soil Basic Physiochemical Properties Analysis

During the soil sampling, the soil bulk density (BD) was measured by the core method (10 cm diameter and 10 cm length), which is the mass per unit volume of dried soil. The soil water content (SWC) was obtained by weighing after drying at 105 °C to a constant weight. The soil pH was determined in accordance with the pH of the soil/water (1:2.5) extraction solution. After the removal of inorganic carbonates with 1 mol HCl, we determined the SOC and total nitrogen (TN) content with an elemental analyser (VarioMAX CN, Elementar Analysensysteme, Langenselbold, Germany). We measured the total phosphorus (TP) with sodium hydroxide fused molybdenum antimony colorimetry [37]. The total potassium (TK) was determined by the sodium hydroxide melt-atomic absorption method [38]. The cation exchange capacity (CEC) was measured by spectrophotometry using a hexamine cobalt trichloride solution [39]. The DOC was extracted with K2SO4 following Yang et al. [40].

2.3.2. FTIR Analyses of SOM Spectroscopic Properties

The FTIR absorbance spectra were determined in a Thermo Scientific Nicolet 6700 FTIR spectrometer (Thermo Fisher, Waltham, MA, USA) over a range of 400–4000 cm−1 [41]. The procedures for FTIR spectroscopy are shown in the Supplementary Methods. The relevant organic bands were determined through the spectrum characterisation of the curves and according to the literature [42]. In our study, bonds were identified in the 3620 and 3420 cm−1 regions, representing phenolic and alcoholic –OH, 2920 and 2850 cm−1 (aliphatic –CH) representing the coupling vibration of complex organic compounds, 1880 cm−1 (carbonyl), 1630 cm−1 (aromatic C=C), and 1035 cm−1 (polysaccharide C–O) [43]. The ratios of aliphatic to aromatic compounds (C=C/–CH) were calculated, and the structure stability of the SOM was evaluated. The SOM resistance to decomposition (F) was determined by the ratio between (C=C + –CH) and (C–O + –OH) [44].

2.3.3. Soil Microbial Properties Analyses

The MBC in the soil was determined by the fumigation extraction method, 0.45 was the conversion factor [45]. The soil Br was obtained by measuring the amount of CO2 released by the 25 °C soil samples in a laboratory culture after the soil sample was adjusted to 60% of the field water capacity [46]. The metabolic coefficient (qCO2) is an exponent of the mineralisation of substrate per unit of MBC, which is the Br–MBC ratio. The microbial coefficient (qMic) is expressed as the ratio of MBC to SOC [46]. Four enzyme activities, soil catalase activity (CAT; EC1.11.1.6), urease activity (S-UE; EC3.5.1.5), sucrase activity (S-SC; EC3.2.1.26), and soil alkaline phosphatase activity (S-AP), were measured by a soil enzyme activity assay kit (Uplc-MS Testing Technology Co., Ltd., Shanghai, China) using a microplate reader (BMG LABTECH, Ortenberg, Germany) based on the standard fluorescence method [47]. The microbial community structure was determined by the PLFA method described in the Supplementary Methods [24,29].

2.4. Maize Yield Measurement

At the end of harvest time in October 2022, crop samples were obtained by harvesting the three 2 m-long and 2.5 m-wide plots per sampling site, and then their fresh and dry weights were measured separately for the calculation of the annual average crop yield.

2.5. Statistical Analyses

The FTIR spectral features and relative peak areas of characteristic peaks were determined with Omnic 8.0, and differences in the soil properties, SOM chemical compositions, and microbial community structures at different levels of land degradation were verified with one-way ANOVA. SPSS 23.0 (IBM Corporation, New York, NY, USA) was used. Considerable differences among the means were determined, and the Duncan test was performed at p < 0.05. All figures were drawn in Origin 23.0 (OriginLab, Northampton, MA, USA). The major drivers affecting maize yield were determined with a random forest model and the R package ‘rfPermute’ in R (version 4.2.4), and the percentage increase in mean-squared error was used in estimating the importance of the variables [48]. A path diagram of the structural equation model (SEM) was performed with Amos 23.0 for the assessment of the direct and indirect influences of land degradation, soil physiochemical properties, SOM compositions, and microorganisms on the crop yield [31].

3. Results

3.1. Response of Soil Physiochemical Properties to Land Degradation

The soil physiochemical properties were altered significantly as land degradation increased (Table 2). Generally, land degradation had significant negative effects on the SWC, SOC, TN, CEC, and DOC; the soil BD and pH increased significantly (p < 0.05); and no significant difference in TK was found. In particular, the SOC decreased significantly with increasing land degradation; compared to the ND, the SOC decreased by 34.47%, 73.12%, and 82.59% in the LD, MD, and SD, respectively. The TP significantly decreased with an increasing level of land degradation in the degraded croplands, and the TP in the ND was significantly lower than that in the LD and MD and significantly higher than that in the SD (p < 0.05).

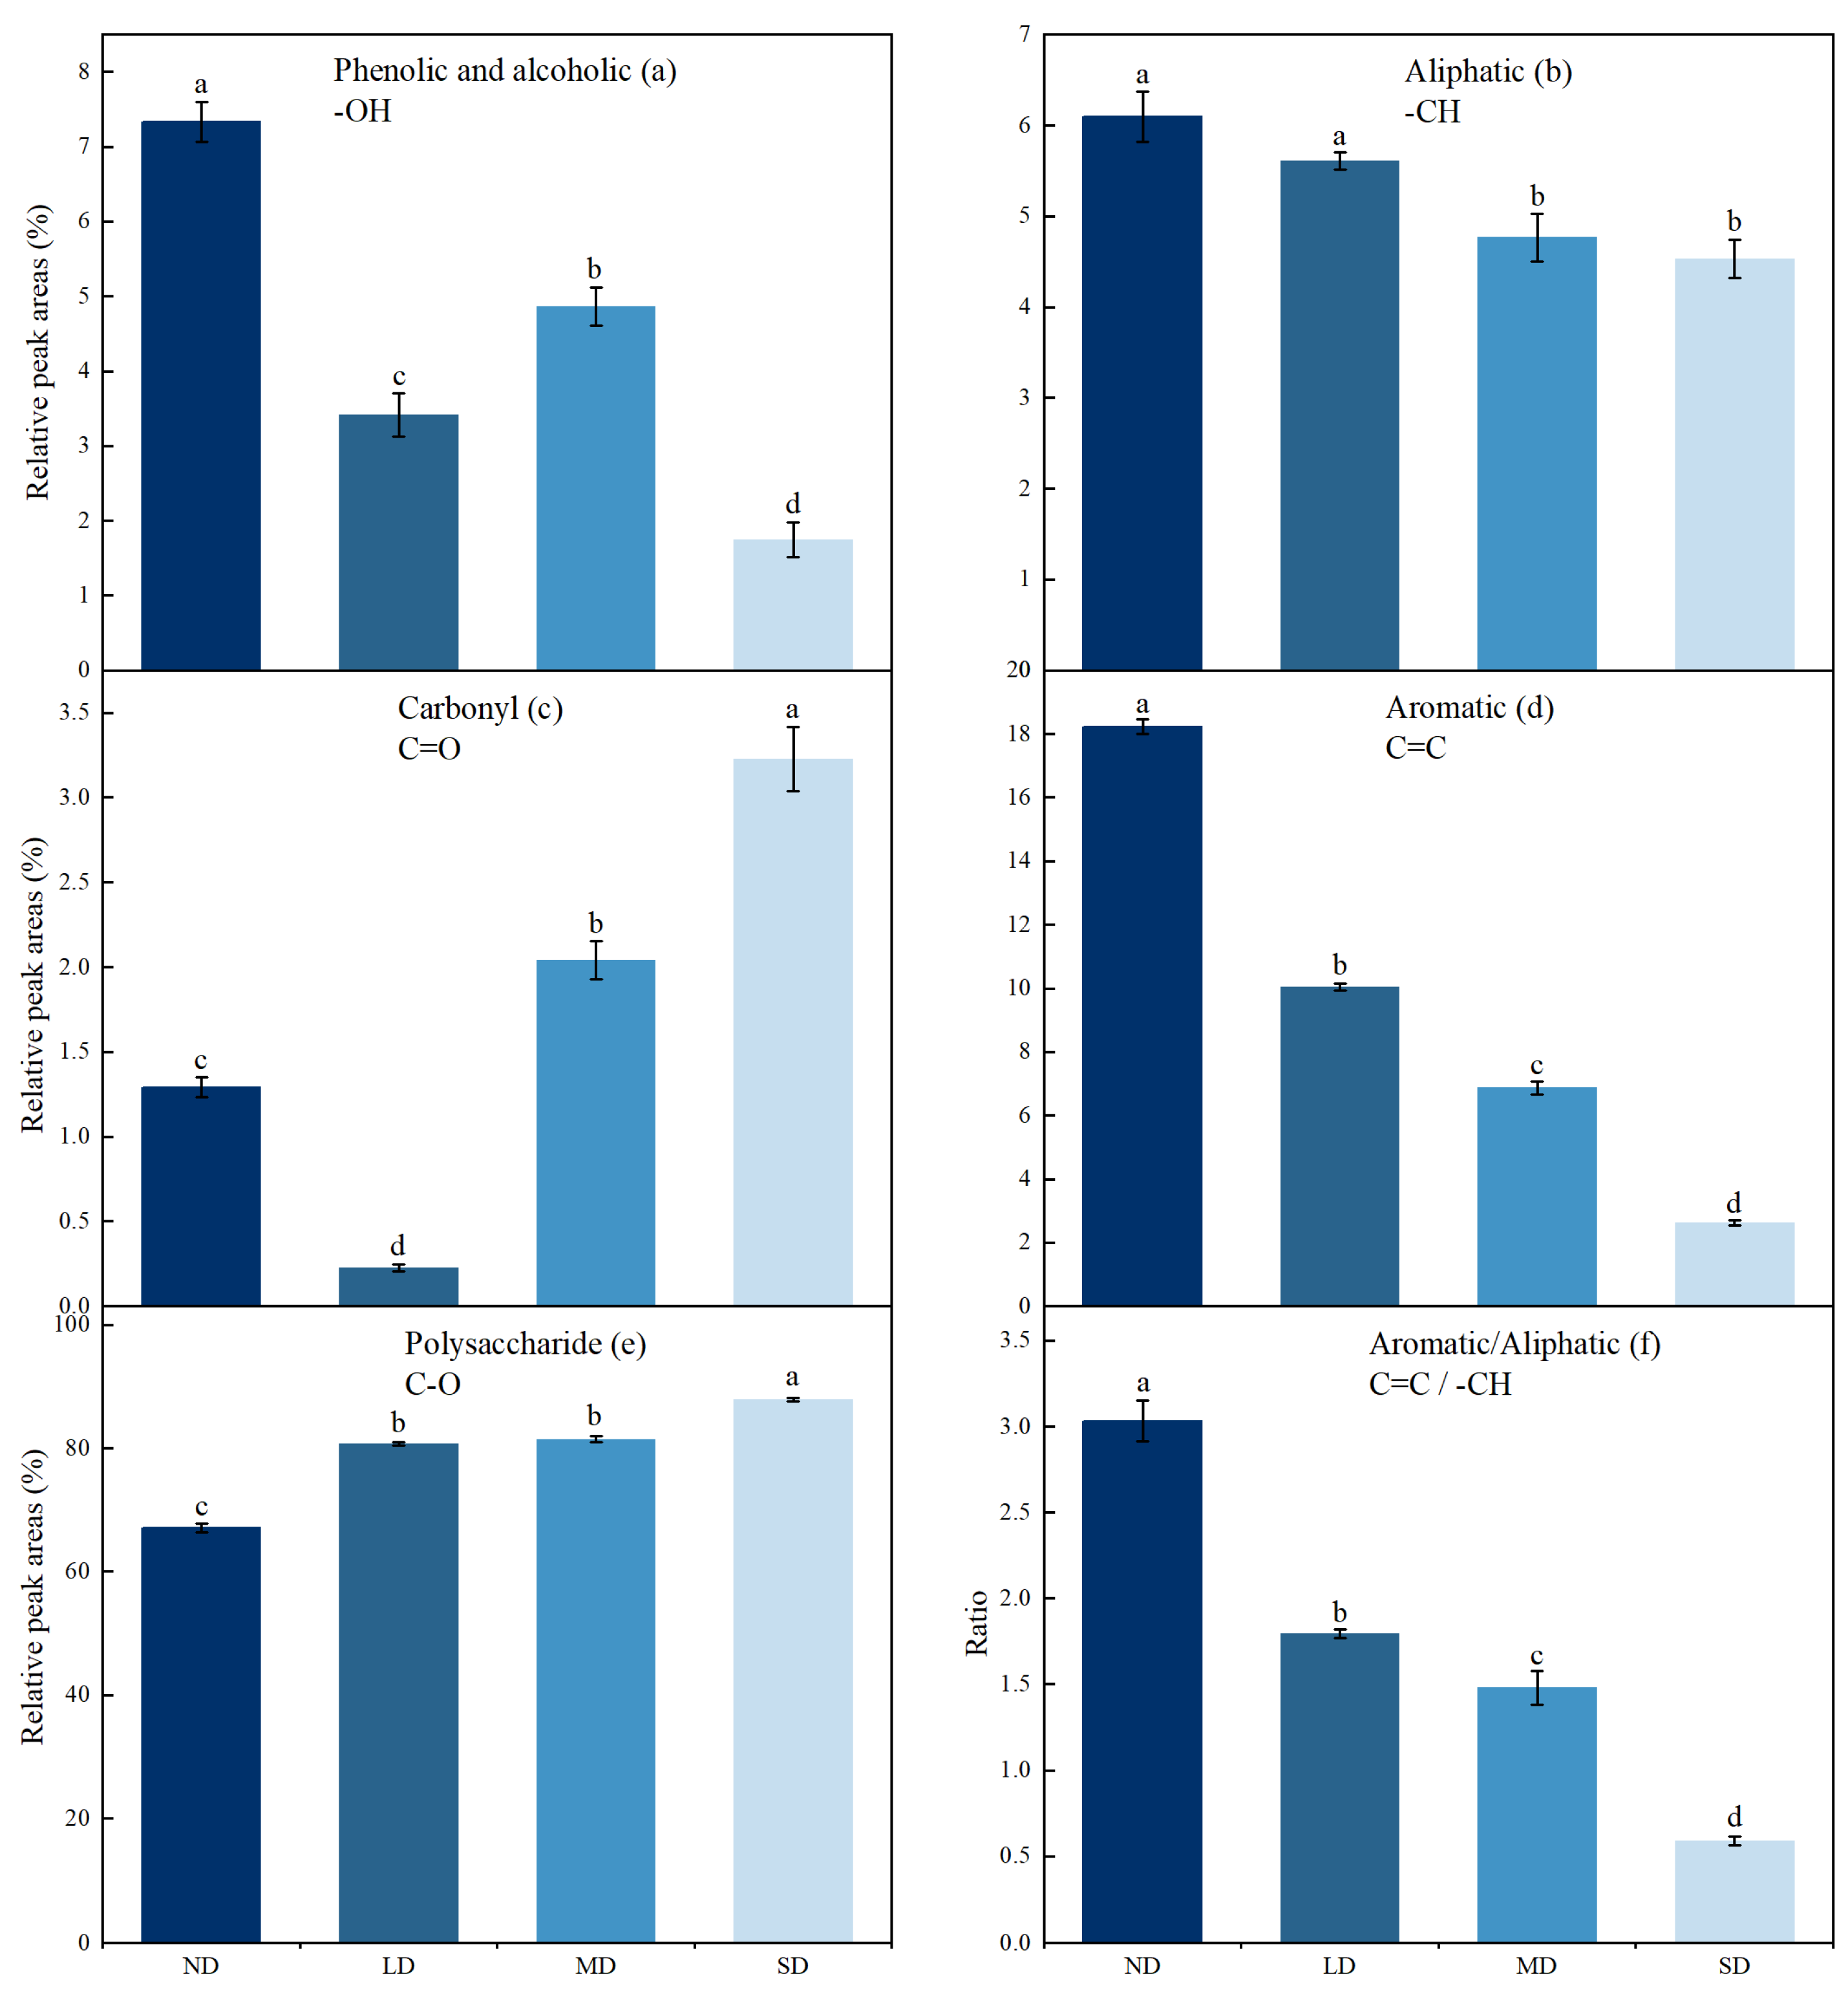
3.2. Response of SOM Functional Groups from FTIR to Land Degradation

Overall, the SOM infrared structural signature peaks were similar among treatments with different degrees of land degradation, but they differed in absorbance intensity (Figure 2 and Figure S1). Specifically, the relative abundances of the polysaccharide C–O groups accounted for 67.35–87.67% of the total abundance, and the carbonyl C=O groups had the lowest relative abundance, accounting for only 0.24–3.19%. The relative abundances of the phenolic and alcoholic –OH groups were significantly lower in the degraded croplands than in the ND (p < 0.05). With an increasing level of land degradation, the relative abundances of the aromatic C=C and aliphatic –CH groups decreased significantly, whereas the ratio of C=C to –CH increased significantly (p < 0.05). The relative abundances of the aromatic C=C groups declined by 44.74%, 62.26%, and 86.01% at the LD, MD, and SD, respectively, compared to those in the ND. In addition, relative to the ND, the relative abundances of polysaccharides C–O increased by 23.09% at the SD (p < 0.05). The F value significantly decreased with an increasing level of land degradation (Figure S2).

3.3. Response of Soil Microbial Properties to Land Degradation

Soil microbial properties differed among different levels of land degradation (Table 3). The soil MBC and Br affected by land degradation significantly decreased, and the highest and lowest values were obtained in the ND and SD plots, respectively (p < 0.05). The qCO2 values significantly decreased in the degraded croplands with increased levels of land degradation and were higher in the croplands than in the grasslands, whereas the qMic values showed the opposite trend. The enzymatic activities of CAT, S-SC, and S-UE were manifested as ND > LD > MD > SD. The SAP decreased significantly in the croplands with an increasing level of land degradation (p < 0.05). Land degradation significantly changed the PLFA contents (Table 3). The G+, G, fungi, bacteria, and total PLFAs decreased significantly in the LD, MD, and SD (p < 0.05). The ratios of bacteria to fungi of ND were higher by 10.21%, 17.50%, and 24.79% than those of the LD, MD, and SD, respectively, and the ratio of G+ to G increased significantly because of land degradation.

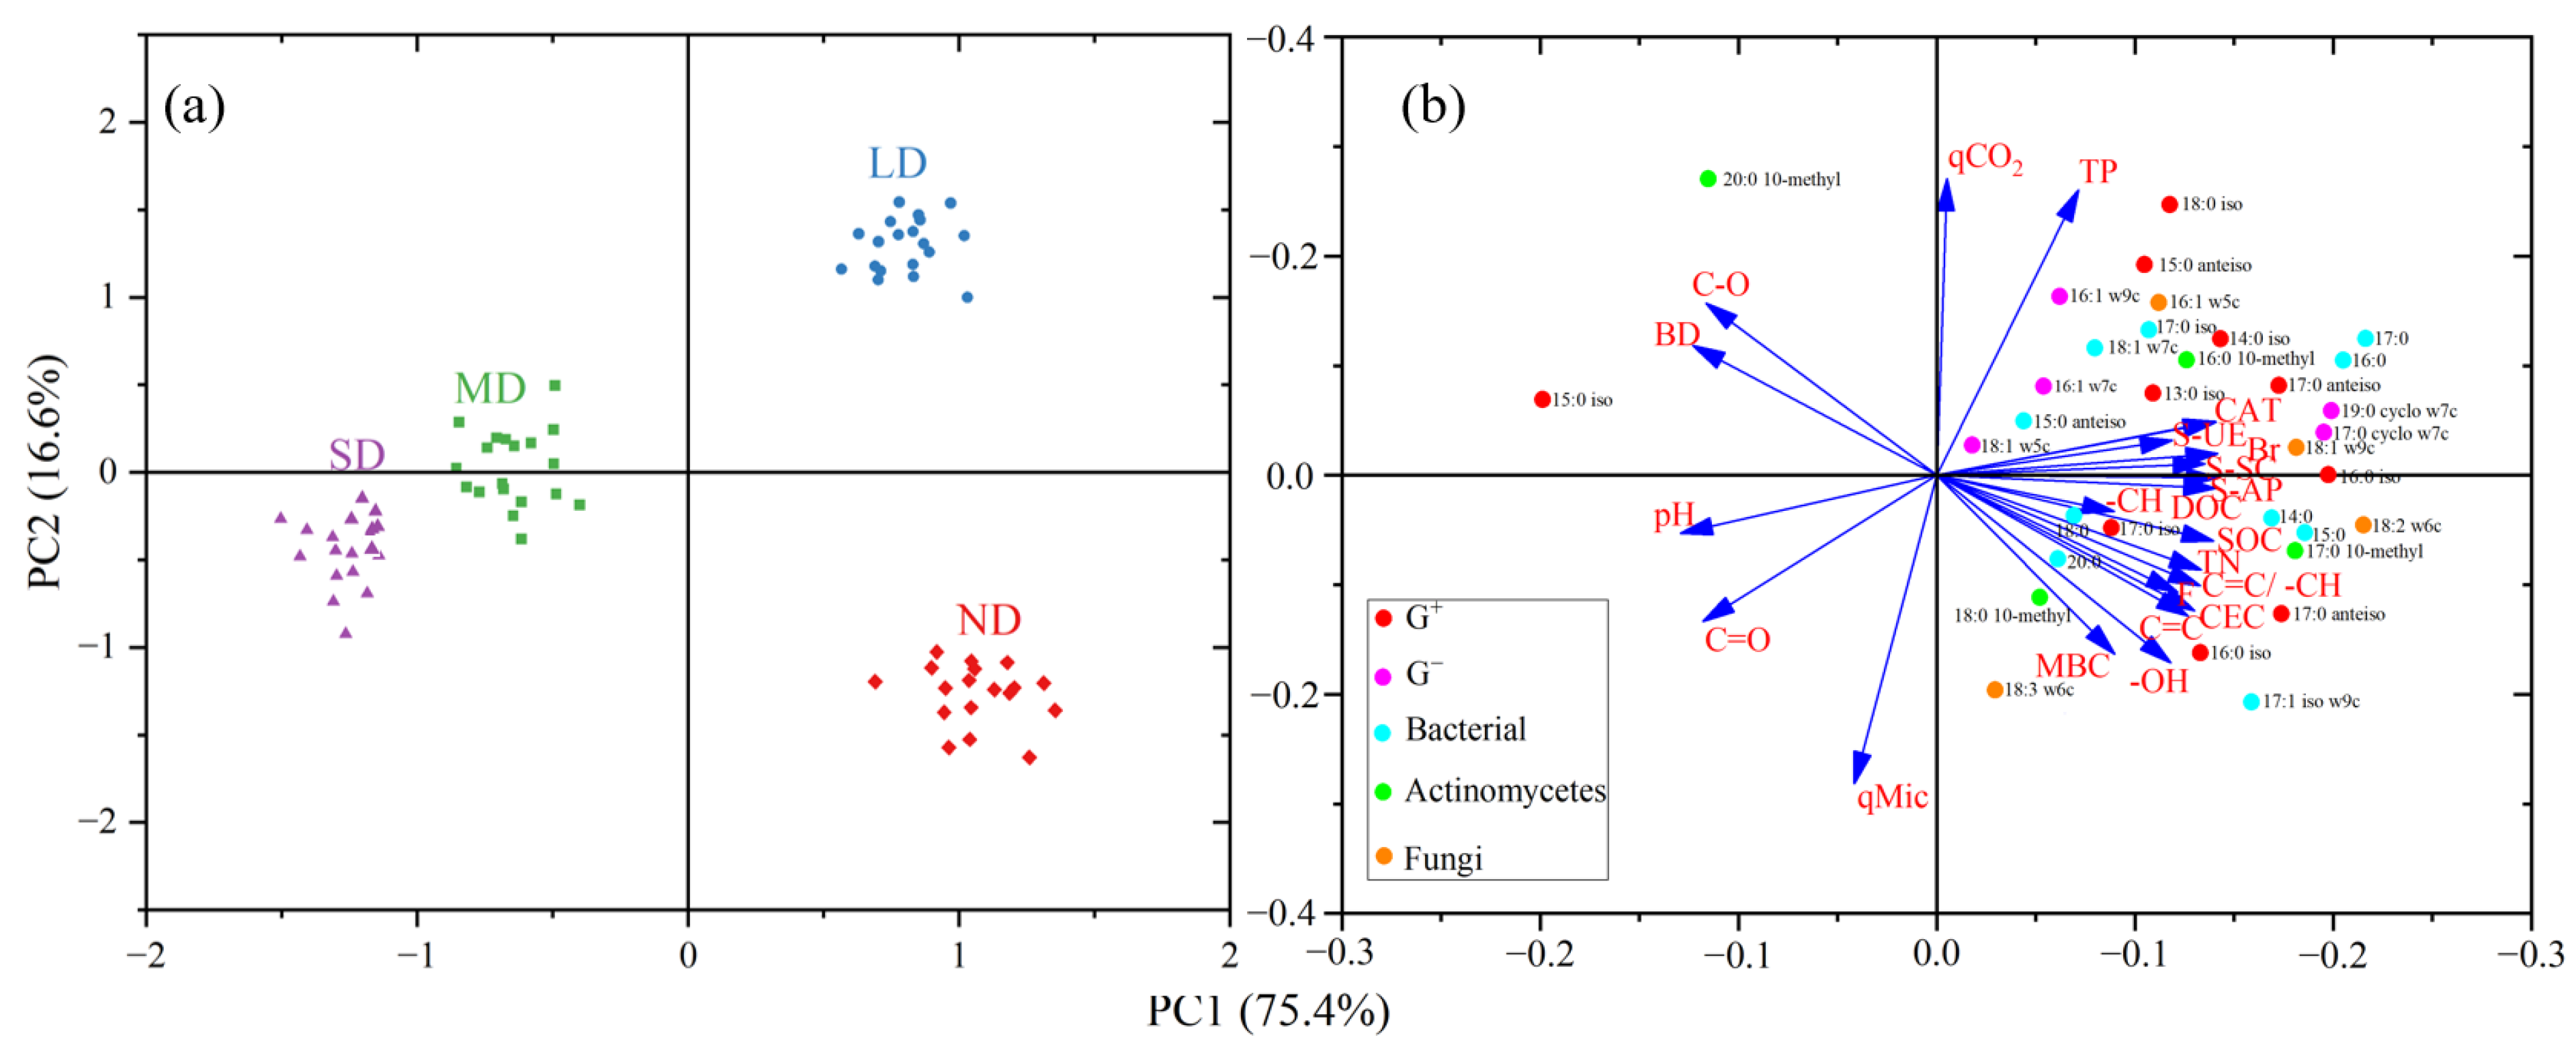
3.4. Relationship between Microbial Properties and SOM Composition

The influences of land degradation on the soil microbial community structure were determined through principal component analysis (Figure 3). PC1 and PC2 accounted for 75.4% and 16.6% of the total variance, respectively, indicating that land degradation altered the microbial community structure significantly (Figure 3a). All the treatments were separated obviously, and a shift from ND and LD to MD and ND was observed (p < 0.05). The loading values for the individual PLFA biomarkers under the different levels of land degradation are shown in Figure 3b. The separation among the sampling plots with different levels of degradation sampling plots was mainly due to bacteria and fungi; actinomycetes also provided a trivial contribution. The PLFA biomarkers associated with bacteria (14:0, 15:0, 18:0, 20:0, i17:1, i17:0, a17:0) and actinomycetes (17:0 10-methyl and 18:0 10-methy) were all more abundant in the ND treatment. Pearson correlation analysis showed a significant relationship between the soil microbial properties and the SOM chemical composition (Figure 4). The relative absorbance of aromatic C=C and F were significantly correlated with the MBC, Br, soil enzyme activity, PLFA content, G+/G, and bacteria/fungi (p < 0.001).

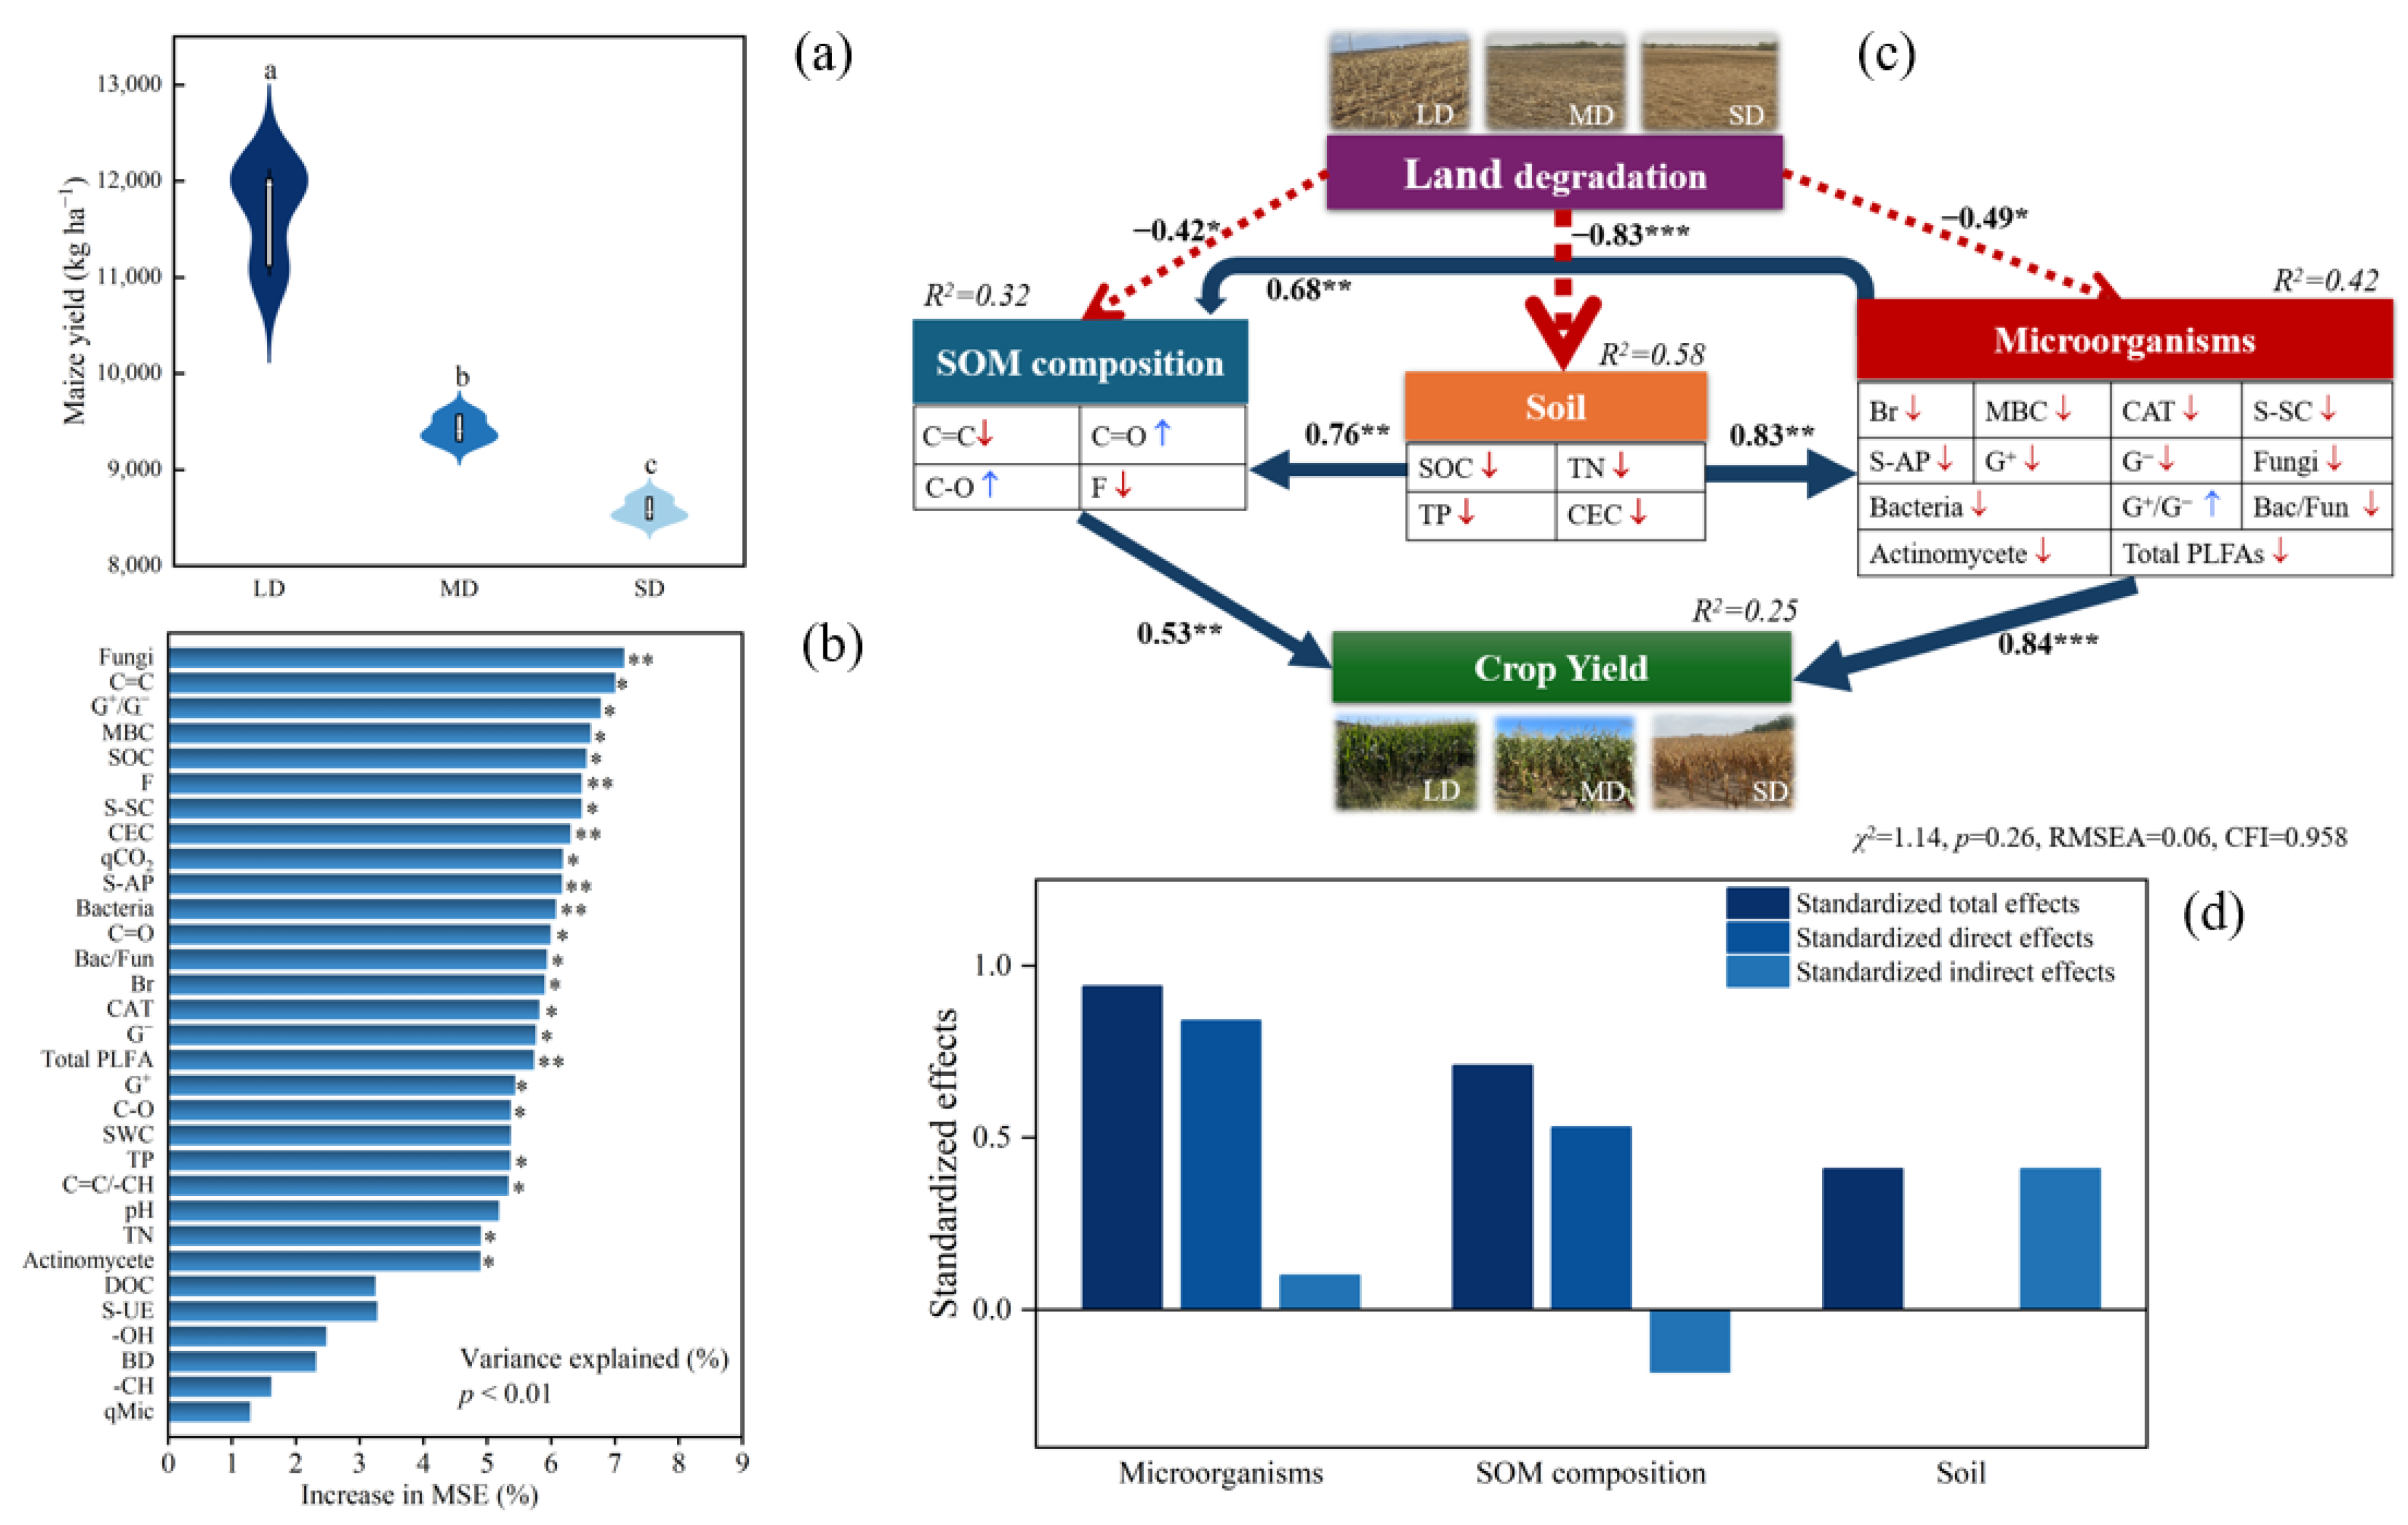
3.5. Maize Yield and Its Influencing Factors

We detected a significant decrease in maize yield with an increasing level of land degradation (p < 0.001; Figure 5a). The RFM model demonstrated the responses of all the variables of maize yield in the degraded croplands, and the fungi showed the highest explanatory effect (Figure 5b). We further constructed the path diagram of SEM by using variables with large effects to clarify the direct and indirect relationships. The final model met our significance criteria (χ2 = 1.14, p = 0.26, RMSEA = 0.06, GFI = 0.958; Figure 5c). The path diagram revealed that land degradation had significant direct effects on maize yield based on the SOM composition (β = −0.42 *; Figure 5d) and microorganisms (β = −0.49 *). Land degradation had a direct negative effect on the soil properties (β = −0.83 ***) and influenced maize yield through direct positive correlations with the SOM composition (β = 0.53 **) and microorganisms (β = 0.84 ***).

4. Discussion

4.1. Changes in SOM Composition under Land Degradation

The SOM composition is a sensitive indicator of land degradation [49]. FTIR spectroscopy data show that active polysaccharides increased with an increasing level of land degradation (p < 0.05; Figure 2) because land degradation weakened the activity of the soil microorganisms and reduced the C source required by the soil. This effect resulted in insufficient SOM replenishment and the accumulation of substances, such as sugars, which are easily decomposed by microorganisms [50,51]. Microbial residues are sources for functional groups in SOM [52]. This result was further confirmed by the significant SOM functional groups and soil microbial properties in the Pearson correlation analysis (Figure 4). In addition, the relative peaks of aliphatic and aromatic groups decreased significantly (p < 0.05). This result demonstrated that the aliphatic and aromatic groups were less susceptible to accumulation and mineralised in degraded soils. The recalcitrant lignin is the main source of aromatic substances in soi; it is difficult to accumulate due to land degradation and surface exposure due to wind erosion, leading to the decline of aromatic substances [53]. We found that F and SOM stability (C=C/–CH) decreased owing to the lack of protective mechanisms for the SOM and a decrease in the aromaticity with an increasing level of land degradation [54]. The SOM stability was generally lower in soils of croplands than in grasslands possibly because of the higher apoplastic content of grassland ecosystems, and long-term accumulation leads to a high conservation of lignin in the soil, resulting in a high structural stability of SOM. These findings are consistent with those of Baldock et al. and Liu et al. [55,56].

4.2. Microbial Property Responses to Land Degradation

Microorganisms mediate almost all soil biochemical processes and are key factors that are sensitive to the functional response of degraded ecosystems [57]. Our results indicate that the MBC, Br, and enzyme activity were significantly decreased in the croplands as the land degradation intensified (p < 0.05). The possible reason is that the degraded land reduced the intensity of the microbial activity and the soil matter metabolism. These results are consistent with those of Yao et al. and McCulley et al. [58,59].
Compared to the ND, the ratio of G+/G increased with an increasing level of land degradation, and the ratio of bacteria to fungi decreased (Table 3). Typically, G prioritises the use of fresh organic inputs as carbon sources, and G+ is considered a microbial community that favours the decomposition of low-quality or recalcitrant SOM [60]. Thus, our results reflect changes in the SOM quality and a decrease in the stability of microbial ecosystems. One reason is that most of the microbial communities responded to the carbon content and transited from commensal to oligotrophic groups (e.g., from G to G+, from bacteria to fungi) when the C availability in the soil decreased [61]. Wind erosion in the study area was of high intensity, and large aggregates of degraded soils were displaced because of the lack of physical protection of organic matter; thus, carbon content substantially decreased [62]. Another reason is that the soil pH increased because of land degradation, which in turn generated physiological pressure on the soil microorganisms, affecting their competition and reproduction [63]. Fungi are less responsive than bacteria to variations in the soil pH, and therefore, generally more resistant to an increased level of land degradation [64,65].

4.3. Relationships among SOM Composition, Microbial Properties, and Maize Yield

The microbial community structure changed with the level of land degradation (Figure 3). The soil microbial community structure changed from ND to LD, to MD, and eventually, to SD through PC1 (Figure 3a). The soil loss rates in the MD and SD were 10–30 times those in the ND and LD, accounting for the separation among soil treatments at different levels of land degradation. Correlation analyses provided further confirmation of the strong relationship between the soil microbial properties and the functional groups of SOM with PLFA subpopulations (Figure 3b and Figure 4). The segregation of ND from other land degradation treatments at PC2 was mainly due to G+ bacteria (i13:0, i14:0, a15:0, i16:0, and a17:0), G bacteria (the sum of cy17:0, 18:1 w5c, and cy19:0), fungi (16:1ω5c, 18:1ω9c, and 18:2ω6c), bacteria (14:0, 15:0, 15:0DMA, 16:0, 17:0, 18:0, and 20:0) and Actinomycetes (16:0 10-methyl and 17:0 10-methyl). This result is in agreement with the results of previous studies, which showed that bacterial and fungal biomarkers (viz., monounsaturated fatty acid) were more reactive to land degradation [24,66].
Land degradation reduces soil quality, resulting in a lower crop yield [67]. Our results show that the average maize yield significantly decreased under degradation (p < 0.05; Figure 5a). The soil properties affected the maize yield. We found that fungi and aromatic substances had a high contribution to the decline in crop yield, and they indicated a significant positive correlation in the Pearson correlation analysis (Figure 4 and Figure 5b), possibly because the fungal entanglement of the soil particles affected a wide range of soil functional changes, the land degradation reduced the fungal metabolism associated with biomass degradation, and the soil fungi preferred a high proportion of aromatic substances [68]. Path analysis provided conclusive evidence that the SOM composition and microorganisms controlled the maize yield under land degradation (Figure 5c). Overall, the microorganisms had larger positive effects on the maize yield than the SOM composition (Figure 5d), suggesting that soil microbial regulatory pathways are sensitive to land degradation and rapidly respond to environment variability by modifying their communities and functions [14]. Land degradation weakens the rate of nutrient decomposition and turnover by soil microorganisms, and thus, the soil lacks sufficient sources of nutrients and available nutrients for crop growth, especially nitrogen, phosphorus, and potassium [1]. In addition, the reduced activities of enzymes produced through microbial metabolism have a negative effect on the conversion of SOM, and this effect inhibits the production of mineral nutrients that can be absorbed by the root system [69]. The lack of microorganisms in degraded land reduces the secretion of growth regulators, such as vitamins, antimicrobials, growth hormones, and amino acids, thereby impeding plant growth and development and reducing defences against soilborne pathogens [70,71]. Thus, microorganisms are key agents in the impact of land degradation on maize yield. Path analysis revealed that microorganisms influenced the maize yield through significant positive effects on the SOM components (β = 0.68 **, p < 0.05). Soil microorganisms are important decomposers for SOC mineralisation [72]. Fan et al. [73] and Li et al. [74] confirmed the crucial role of microbial communities in relation to soil carbon fractions in the regulation of crop yields. Microorganisms cannot exist in isolation and can only fulfil important ecological functions, such as nutrient cycling, and thus, they have an impact on crop productivity yield if they form large and complex interactions with other microorganisms [75].

5. Conclusions

Our study provides insights into the impacts of different land degradation levels on SOM composition, soil microbial properties, and maize yield in Horqin Sandy Land in northeast China. Specifically, the stable aromatic substances in organic matter decreased by 86.01% with increasing land degradation, and the active polysaccharides increased, leading to a decrease in the stability and resistance to the decomposition of SOM. Land degradation decreased MBC, Br, and enzyme activity; PLFA content; and the ratio of bacteria to fungi significantly. The ratio of G+ to G increased in the croplands. The RFM showed that fungi were the key factors that affected the maize yield (7.15%, p < 0.05). Overall, land degradation reduced the soil physiochemical properties, resulting a in decrease in microorganisms, causing variations in the SOM chemical composition, and directly leading to a decrease in maize yield. In addition, microorganisms (β = 0.84 ***) showed a greater influence on maize yield than the SOM composition (β = 0.53 **). These findings contribute to our understanding of how SOM composition and microorganisms influence maize yield under land degradation and can be incorporated into ecosystem process models to predict the response of maize yield to land degradation in Horqin Sandy Land. Further studies investigating fungi, the diversity of microbial communities, and the turnover of SOM in Horqin Sandy Land soils are necessary to reveal the detailed variation in the soil microenvironment along land degradation and evaluate the sustainability of the cropland ecosystem.

Supplementary Materials

The following supporting information can be downloaded at: https://www.mdpi.com/article/10.3390/agronomy14071348/s1, Supplementary Methods: FTIR analyses and Soil microbial community analyses. Supplementary Figures: Figure S1. Infrared spectrum of surface soils as affected by land degradation; Figure S2. Changes in SOM resistance to decomposition (F) as affected by land degradation.

Author Contributions

Conceptualization, M.G., M.L. and S.W.; methodology, M.L., S.W. and X.L.; software, M.G., S.W. and X.L.; validation, M.G.; formal analysis, M.L.; investigation, M.G. and M.L.; resources, M.L.; data curation, M.G.; writing—original draft preparation, M.G.; writing—review and editing, M.G., M.L. and X.L.; visualization, M.G.; supervision, S.W.; project administration, S.W.; funding acquisition, M.L. All authors have read and agreed to the published version of the manuscript.

Funding

This research was funded by the Strategic Priority Research Program (XDA28070100) of the Chinese Academy of Sciences, and the National Key Research and Development Program (2021YFD1500702; 2021YFD1500801).

Data Availability Statement

The data that support the findings of this study are available from the corresponding author upon reasonable request.

Conflicts of Interest

The authors declare no conflicts of interest.

References

  1. Coban, O.; De Deyn, G.B.; van der Ploeg, M. Soil Microbiota as Game-Changers in Restoration of Degraded Lands. Science 2022, 375, eabe0725. [Google Scholar] [CrossRef] [PubMed]
  2. Lal, R. Restoring Soil Quality to Mitigate Soil Degradation. Sustainability 2015, 7, 5875–5895. [Google Scholar] [CrossRef]
  3. United Nations. World Soil Day. Available online: https://www.un.org/en/observances/world-soil-day (accessed on 6 June 2024).
  4. Lal, R. Soil Erosion and the Global Carbon Budget. Environ. Int. 2003, 29, 437–450. [Google Scholar] [CrossRef] [PubMed]
  5. Speth, J.G. Towards an Effective and Operational International Convention on Desertification; ESQUEL/PNUD/Governo do Ceará/BNB: Fortaleza, Brazil, 1994. [Google Scholar]
  6. Jiang, G.; Zhang, Y.; Wei, X.; Zhang, D.; Liu, S. The soil infrared spectral characteristics of soil organic matter under different Carbon saturation levels. Sci. Agric. Sin. 2018, 51, 3117–3129. [Google Scholar]
  7. He, Y.; Zhang, F.; Yang, M.; Li, X.; Wang, Z. Insights from Size Fractions to Interpret the Erosion-Driven Variations in Soil Organic Carbon on Black Soil Sloping Farmland, Northeast China. Agric. Ecosyst. Environ. 2023, 343, 108283. [Google Scholar] [CrossRef]
  8. Zhang, M. Physicochemical Properties and Spectral Characteristics of Soluble Organic Matter of Main Grassland Soils and Their Responses to the Utilization Patterns in Qinghai Province. Master’s Thesis, Gansu Agricultural University, Lanzhou, China, 2020. [Google Scholar]
  9. Liu, C.; Lu, M.; Cui, J.; Li, B.; Fang, C. Effects of Straw Carbon Input on Carbon Dynamics in Agricultural Soils: A Meta-Analysis. Glob. Change Biol. 2014, 20, 1366–1381. [Google Scholar] [CrossRef] [PubMed]
  10. Ellerbrock, R.H.; Gerke, H.H. Chapter Three—Characterization of Organic Matter Composition of Soil and Flow Path Surfaces Based on Physicochemical Principles—A Review. In Advances in Agronomy; Sparks, D.L., Ed.; Academic Press: Cambridge, MA, USA, 2013; Volume 121, pp. 117–177. [Google Scholar]
  11. Linker, R. Application of FTIR Spectroscopy to Agricultural Soils Analysis. In Fourier Transforms—New Analytical Approaches and FTIR Strategies; IntechOpen Limited: London, UK, 2011; ISBN 978-953-307-232-6. [Google Scholar]
  12. Margenot, A.J.; Calderón, F.J.; Bowles, T.M.; Parikh, S.J.; Jackson, L.E. Soil Organic Matter Functional Group Composition in Relation to Organic Carbon, Nitrogen, and Phosphorus Fractions in Organically Managed Tomato Fields. Soil Sci. Soc. Am. J. 2015, 79, 772–782. [Google Scholar] [CrossRef]
  13. Pandey, D.; Agrawal, M.; Singh Bohra, J.; Adhya, T.K.; Bhattacharyya, P. Recalcitrant and Labile Carbon Pools in a Sub-Humid Tropical Soil under Different Tillage Combinations: A Case Study of Rice–Wheat System. Soil Tillage Res. 2014, 143, 116–122. [Google Scholar] [CrossRef]
  14. Sun, T.; Mao, X.; Ma, Q.; Han, K.; Wang, X.; Cheng, Q.; Sheng, X.; Mi, W.; Wu, L. Response of Rice Yield to Organic Amendments Was Regulated by Soil Chemical Properties, Microbial Functional Genes and Bacterial Community Rather than Fungal Community. Appl. Soil Ecol. 2023, 188, 104923. [Google Scholar] [CrossRef]
  15. Gao, T.; Tian, H.; Wang, Z.; Shi, J.; Yang, R.; Wang, F.; Xiang, L.; Dai, Y.; Megharaj, M.; He, W. Effects of Atrazine on Microbial Metabolic Limitations in Black Soils: Evidence from Enzyme Stoichiometry. Chemosphere 2023, 334, 139045. [Google Scholar] [CrossRef]
  16. Mandal, D.; Chandrakala, M.; Alam, N.M.; Roy, T.; Mandal, U. Assessment of Soil Quality and Productivity in Different Phases of Soil Erosion with the Focus on Land Degradation Neutrality in Tropical Humid Region of India. Catena 2021, 204, 105440. [Google Scholar] [CrossRef]
  17. Liu, K.; Li, T.; Duan, X.; Zhang, S.; Chen, M.; Hou, H.; Wang, Z.; Yu, A.; Chen, D.; Zhang, X.; et al. The Degradation of Subalpine Meadows Significantly Changed the Soil Microbiome. Agric. Ecosyst. Environ. 2023, 349, 108470. [Google Scholar] [CrossRef]
  18. Cui, Y.; Wang, X.; Zhang, X.; Ju, W.; Duan, C.; Guo, X.; Wang, Y.; Fang, L. Soil Moisture Mediates Microbial Carbon and Phosphorus Metabolism during Vegetation Succession in a Semiarid Region. Soil Biol. Biochem. 2020, 147, 107814. [Google Scholar] [CrossRef]
  19. Yao, Y. Soil Aggregates Stability and Organic Carbon Content Changes and Its Mechanism in Horqin Degraded Grassland. Master’s Thesis, Northeast Normal University, Changchun, China, 2021. (In Chinese). [Google Scholar]
  20. Kasel, S.; Bennett, L.T. Land-Use History, Forest Conversion, and Soil Organic Carbon in Pine Plantations and Native Forests of South Eastern Australia. Geoderma 2007, 137, 401–413. [Google Scholar] [CrossRef]
  21. Breidenbach, A.; Schleuss, P.-M.; Liu, S.; Schneider, D.; Dippold, M.A.; de la Haye, T.; Miehe, G.; Heitkamp, F.; Seeber, E.; Mason-Jones, K.; et al. Microbial Functional Changes Mark Irreversible Course of Tibetan Grassland Degradation. Nat. Commun. 2022, 13, 2681. [Google Scholar] [CrossRef] [PubMed]
  22. Hartmann, M.; Six, J. Soil Structure and Microbiome Functions in Agroecosystems. Nat. Rev. Earth Environ. 2023, 4, 4–18. [Google Scholar] [CrossRef]
  23. Li, Y.; Wang, X.; Chen, Y.; Luo, Y.; Lian, J.; Niu, Y.; Gong, X.; Yang, H.; Yu, P. Changes in Surface Soil Organic Carbon in Semiarid Degraded Horqin Grassland of Northeastern China between the 1980s and the 2010s. Catena 2019, 174, 217–226. [Google Scholar] [CrossRef]
  24. Li, N.; Lei, W.; Sheng, M.; Long, J.; Han, Z. Straw Amendment and Soil Tillage Alter Soil Organic Carbon Chemical Composition and Are Associated with Microbial Community Structure. Eur. J. Soil Biol. 2022, 110, 103406. [Google Scholar] [CrossRef]
  25. Yang, F.; Tian, J.; Fang, H.; Gao, Y.; Xu, M.; Lou, Y.; Zhou, B.; Kuzyakov, Y. Functional Soil Organic Matter Fractions, Microbial Community, and Enzyme Activities in a Mollisol Under 35 Years Manure and Mineral Fertilization. J. Soil Sci. Plant Nutr. 2019, 19, 430–439. [Google Scholar] [CrossRef]
  26. Kochetov, I.S.; Belolyubtsev, A.I.; Chebanenko, S.I.; Grigorov, A.A. Influence of Soil-Protecting Treatment Procedures on the Dynamics, Composition of the Organic Matter of the Soil, and the Formation of the Farm Crop Yield. Russ. Agric. Sci. 2000, 5, 33–38. [Google Scholar]
  27. Mahmood, S.; Nunes, M.R.; Kane, D.A.; Lin, Y. Soil Health Explains the Yield-Stabilizing Effects of Soil Organic Matter under Drought. Soil Environ. Health 2023, 1, 100048. [Google Scholar] [CrossRef]
  28. Lehmann, J.; Bossio, D.A.; Kögel-Knabner, I.; Rillig, M.C. The Concept and Future Prospects of Soil Health. Nat. Rev. Earth Environ. 2020, 1, 544–553. [Google Scholar] [CrossRef] [PubMed]
  29. Dong, W.-Y.; Zhang, X.-Y.; Dai, X.-Q.; Fu, X.-L.; Yang, F.-T.; Liu, X.-Y.; Sun, X.-M.; Wen, X.-F.; Schaeffer, S. Changes in Soil Microbial Community Composition in Response to Fertilization of Paddy Soils in Subtropical China. Appl. Soil Ecol. 2014, 84, 140–147. [Google Scholar] [CrossRef]
  30. Liu, H.; Du, X.; Li, Y.; Han, X.; Li, B.; Zhang, X.; Li, Q.; Liang, W. Organic Substitutions Improve Soil Quality and Maize Yield through Increasing Soil Microbial Diversity. J. Clean. Prod. 2022, 347, 131323. [Google Scholar] [CrossRef]
  31. Li, M.; He, P.; Guo, X.-L.; Zhang, X.; Li, L.-J. Fifteen-Year No Tillage of a Mollisol with Residue Retention Indirectly Affects Topsoil Bacterial Community by Altering Soil Properties. Soil Tillage Res. 2021, 205, 104804. [Google Scholar] [CrossRef]
  32. Wan, W.; Liu, Z.; Li, B.; Fang, H.; Wu, H.; Yang, H. Evaluating Soil Erosion by Introducing Crop Residue Cover and Anthropogenic Disturbance Intensity into Cropland C-Factor Calculation: Novel Estimations from a Cropland-Dominant Region of Northeast China. Soil Tillage Res. 2022, 219, 105343. [Google Scholar] [CrossRef]
  33. Luo, Y.; Zhang, F.; Ding, J.; Bai, H.; Li, Y. Soil Respiration May Be Reduced by Wind via the Suppressing of Root Respiration: Field Observation in Maize Farmland in the Agro-Pastoral Transitional Zone, Northeastern China. Ecol. Indic. 2023, 146, 109824. [Google Scholar] [CrossRef]
  34. Walling, D.E.; He, Q. Mproved Models for Estimating Soil Erosion Rates from Cesium-137 Measurements. J. Environ. Qual. 1999, 28, 611–622. [Google Scholar] [CrossRef]
  35. Forestry Industry Standard of the People’s Republic of China Types and Degrees of Land Degradation 2022. Available online: https://www.samr.gov.cn (accessed on 18 June 2024).
  36. Shen, W.; Cao, X.; Shen, F. Classification and categorization of land degradation in China. J. Ecol. Rural Environ. 2006, 22, 88–93. [Google Scholar]
  37. Yang, Y.; Dou, Y.; An, S. Testing Association between Soil Bacterial Diversity and Soil Carbon Storage on the Loess Plateau. Sci. Total Environ. 2018, 626, 48–58. [Google Scholar] [CrossRef]
  38. Sawhney, B.L. Potassium and Cesium Ion Selectivity in Relation to Clay Mineral Structure. Clays Clay Miner. 1970, 18, 47–52. [Google Scholar] [CrossRef]
  39. Van Oost, K.; Quine, T.A.; Govers, G.; De Gryze, S.; Six, J.; Harden, J.W.; Ritchie, J.C.; McCarty, G.W.; Heckrath, G.; Kosmas, C.; et al. The Impact of Agricultural Soil Erosion on the Global Carbon Cycle. Science 2007, 318, 626–629. [Google Scholar] [CrossRef] [PubMed]
  40. Yang, X.; He, P.; Zhang, Z.; You, M.; Wu, X.; Li, L.-J. Straw Return, Rather than Warming, Alleviates Microbial Phosphorus Limitation in a Cultivated Mollisol. Appl. Soil Ecol. 2023, 186, 104821. [Google Scholar] [CrossRef]
  41. Pärnpuu, S.; Astover, A.; Tõnutare, T.; Penu, P.; Kauer, K. Soil Organic Matter Qualification with FTIR Spectroscopy under Different Soil Types in Estonia. Geoderma Reg. 2022, 28, e00483. [Google Scholar] [CrossRef]
  42. Tivet, F.; de Moraes Sá, J.C.; Lal, R.; Milori, D.M.B.P.; Briedis, C.; Letourmy, P.; Pinheiro, L.A.; Borszowskei, P.R.; da Cruz Hartman, D. Assessing Humification and Organic C Compounds by Laser-Induced Fluorescence and FTIR Spectroscopies under Conventional and No-till Management in Brazilian Oxisols. Geoderma 2013, 207–208, 71–81. [Google Scholar] [CrossRef]
  43. Nieder, R.; Benbi, D.K. Carbon and Nitrogen in the Terrestrial Environment; Springer: Dordrecht, The Netherlands, 2008; ISBN 978-1-4020-8432-4. [Google Scholar]
  44. Fontaine, S.; Barot, S.; Barré, P.; Bdioui, N.; Mary, B.; Rumpel, C. Stability of Organic Carbon in Deep Soil Layers Controlled by Fresh Carbon Supply. Nature 2007, 450, 277–280. [Google Scholar] [CrossRef] [PubMed]
  45. Joergensen, R.G. The Fumigation-Extraction Method to Estimate Soil Microbial Biomass: Calibration of the kEC Value. Soil Biol. Biochem. 1996, 28, 25–31. [Google Scholar] [CrossRef]
  46. Jenkinson, D.S.; Powlson, D.S. The Effects of Biocidal Treatments on Metabolism in Soil—I. Fumigation with Chloroform. Soil Biol. Biochem. 1976, 8, 167–177. [Google Scholar] [CrossRef]
  47. Liu, Z.; Gu, H.; Yao, Q.; Jiao, F.; Hu, X.; Liu, J.; Jin, J.; Liu, X.; Wang, G. Soil pH and Carbon Quality Index Regulate the Biogeochemical Cycle Couplings of Carbon, Nitrogen and Phosphorus in the Profiles of Isohumosols. Sci. Total Environ. 2024, 922, 171269. [Google Scholar] [CrossRef]
  48. Doetterl, S.; Stevens, A.; Six, J.; Merckx, R.; Van Oost, K.; Casanova Pinto, M.; Casanova-Katny, A.; Muñoz, C.; Boudin, M.; Zagal Venegas, E.; et al. Soil Carbon Storage Controlled by Interactions between Geochemistry and Climate. Nat. Geosci. 2015, 8, 780–783. [Google Scholar] [CrossRef]
  49. Obalum, S.E.; Chibuike, G.U.; Peth, S.; Ouyang, Y. Soil Organic Matter as Sole Indicator of Soil Degradation. Environ. Monit. Assess. 2017, 189, 176. [Google Scholar] [CrossRef] [PubMed]
  50. Heller, C.; Ellerbrock, R.H.; Roßkopf, N.; Klingenfuß, C.; Zeitz, J. Soil Organic Matter Characterization of Temperate Peatland Soil with FTIR-Spectroscopy: Effects of Mire Type and Drainage Intensity. Eur. J. Soil Sci. 2015, 66, 847–858. [Google Scholar] [CrossRef]
  51. Plante, A.F.; Sanderman, J.; Asanopoulos, C.H.; Bell, S.; Baldock, J. Interpreting Ramped Combustion Thermograms Using 13C NMR Spectroscopy to Characterize Soil Organic Matter Composition. Geoderma 2023, 432, 116415. [Google Scholar] [CrossRef]
  52. Guo, L.-J.; Zhang, Z.-S.; Wang, D.-D.; Li, C.-F.; Cao, C.-G. Effects of Short-Term Conservation Management Practices on Soil Organic Carbon Fractions and Microbial Community Composition under a Rice-Wheat Rotation System. Biol. Fertil. Soils 2015, 51, 65–75. [Google Scholar] [CrossRef]
  53. Ndzelu, B.S.; Dou, S.; Zhang, X. Corn Straw Return Can Increase Labile Soil Organic Carbon Fractions and Improve Water-Stable Aggregates in Haplic Cambisol. J. Arid Land 2020, 12, 1018–1030. [Google Scholar] [CrossRef]
  54. Fang, K.; Chen, L.; Qin, S.; Zhang, Q.; Liu, X.; Chen, P.; Yang, Y. Mineral and Climatic Controls Over Soil Organic Matter Stability Across the Tibetan Alpine Permafrost Region. Glob. Biogeochem. Cycles 2021, 35, e2021GB007118. [Google Scholar] [CrossRef]
  55. Baldock, J.A.; Preston, C.M. Chemistry of Carbon Decomposition Processes in Forests as Revealed by Solid-State Carbon-13 Nuclear Magnetic Resonance. In Carbon Forms and Functions in Forest Soils; McFee, W.W., Kelly, J.M., Eds.; Soil Science Society of America: Madison, WI, USA, 2006; pp. 89–117. ISBN 978-0-89118-869-8. [Google Scholar]
  56. Liu, Y.; Miao, H.; Chang, X.; Wu, G. Higher Species Diversity Improves Soil Water Infiltration Capacity by Increasing Soil Organic Matter Content in Semiarid Grasslands. Land Degrad. Dev. 2019, 30, 1599–1606. [Google Scholar] [CrossRef]
  57. Wei, Y.; Yu, L.-F.; Zhang, J.-C.; Yu, Y.-C.; Deangelis, D.L. Relationship Between Vegetation Restoration and Soil Microbial Characteristics in Degraded Karst Regions: A Case Study. Pedosphere 2011, 21, 132–138. [Google Scholar] [CrossRef]
  58. Yao, Y.; Chen, J.; Li, F.; Sun, M.; Yang, X.; Wang, G.; Ma, J.; Sun, W. Exchangeable Ca2+ Content and Soil Aggregate Stability Control the Soil Organic Carbon Content in Degraded Horqin Grassland. Ecol. Indic. 2022, 134, 108507. [Google Scholar] [CrossRef]
  59. McCulley, R.L.; Archer, S.R.; Boutton, T.W.; Hons, F.M.; Zuberer, D.A. Soil Respiration and Nutrient Cycling in Wooded Communities Developing in Grassland. Ecology 2004, 85, 2804–2817. [Google Scholar] [CrossRef]
  60. Seabloom, E.W.; Borer, E.T.; Hobbie, S.E.; MacDougall, A.S. Soil Nutrients Increase Long-term Soil Carbon Gains Threefold on Retired Farmland. Glob. Change Biol. 2021, 27, 4909–4920. [Google Scholar] [CrossRef] [PubMed]
  61. Fierer, N. Embracing the Unknown: Disentangling the Complexities of the Soil Microbiome. Nat. Rev. Microbiol. 2017, 15, 579–590. [Google Scholar] [CrossRef]
  62. Zhao, H.-L.; Zhou, R.-L.; Zhang, T.-H.; Zhao, X.-Y. Effects of Desertification on Soil and Crop Growth Properties in Horqin Sandy Cropland of Inner Mongolia, North China. Soil Tillage Res. 2006, 87, 175–185. [Google Scholar] [CrossRef]
  63. Dai, Z.; Liu, G.; Chen, H.; Chen, C.; Wang, J.; Ai, S.; Wei, D.; Li, D.; Ma, B.; Tang, C.; et al. Long-Term Nutrient Inputs Shift Soil Microbial Functional Profiles of Phosphorus Cycling in Diverse Agroecosystems. ISME J. 2020, 14, 757–770. [Google Scholar] [CrossRef] [PubMed]
  64. Rousk, J.; Bååth, E.; Brookes, P.C.; Lauber, C.L.; Lozupone, C.; Caporaso, J.G.; Knight, R.; Fierer, N. Soil Bacterial and Fungal Communities across a pH Gradient in an Arable Soil. ISME J. 2010, 4, 1340–1351. [Google Scholar] [CrossRef] [PubMed]
  65. Garcia-Franco, N.; Walter, R.; Wiesmeier, M.; Hurtarte, L.C.C.; Berauer, B.J.; Buness, V.; Zistl-Schlingmann, M.; Kiese, R.; Dannenmann, M.; Kögel-Knabner, I. Biotic and Abiotic Controls on Carbon Storage in Aggregates in Calcareous Alpine and Prealpine Grassland Soils. Biol. Fertil. Soils 2021, 57, 203–218. [Google Scholar] [CrossRef]
  66. Qin, C.; Zhu, K.; Chiariello, N.R.; Field, C.B.; Peay, K.G. Fire History and Plant Community Composition Outweigh Decadal Multi-factor Global Change as Drivers of Microbial Composition in an Annual Grassland. J. Ecol. 2020, 108, 611–625. [Google Scholar] [CrossRef]
  67. Bardgett, R.D.; Bullock, J.M.; Lavorel, S.; Manning, P.; Schaffner, U.; Ostle, N.; Chomel, M.; Durigan, G.; Fry, E.L.; Johnson, D.; et al. Combatting Global Grassland Degradation. Nat. Rev. Earth Environ. 2021, 2, 720–735. [Google Scholar] [CrossRef]
  68. Liu, C.; Wu, Z.; He, C.; Zhang, Y.; Dong, F.; Huang, W. Effect of Soil Microbial Community Structure on the Chemical Compositions of Different Soil Organic Matter Fractions in Land Uses of the Pearl River Estuary. Appl. Soil Ecol. 2024, 193, 105126. [Google Scholar] [CrossRef]
  69. Ivanov, V.; Chu, J. Applications of Microorganisms to Geotechnical Engineering for Bioclogging and Biocementation of Soil in Situ. Rev. Environ. Sci. Biotechnol. 2008, 7, 139–153. [Google Scholar] [CrossRef]
  70. Helliwell, J.R.; Miller, A.J.; Whalley, W.R.; Mooney, S.J.; Sturrock, C.J. Quantifying the Impact of Microbes on Soil Structural Development and Behaviour in Wet Soils. Soil Biol. Biochem. 2014, 74, 138–147. [Google Scholar] [CrossRef]
  71. Wu, Q.-S.; He, X.-H.; Zou, Y.-N.; He, K.-P.; Sun, Y.-H.; Cao, M.-Q. Spatial Distribution of Glomalin-Related Soil Protein and Its Relationships with Root Mycorrhization, Soil Aggregates, Carbohydrates, Activity of Protease and β-Glucosidase in the Rhizosphere of Citrus unshiu. Soil Biol. Biochem. 2012, 45, 181–183. [Google Scholar] [CrossRef]
  72. Ma, C.; Chen, X.; Zhang, J.; Zhu, Y.; Kalkhajeh, Y.K.; Chai, R.; Ye, X.; Gao, H.; Chu, W.; Mao, J.; et al. Linking Chemical Structure of Dissolved Organic Carbon and Microbial Community Composition with Submergence-Induced Soil Organic Carbon Mineralization. Sci. Total Environ. 2019, 692, 930–939. [Google Scholar] [CrossRef] [PubMed]
  73. Fan, K.; Delgado-Baquerizo, M.; Guo, X.; Wang, D.; Zhu, Y.-G.; Chu, H. Microbial Resistance Promotes Plant Production in a Four-Decade Nutrient Fertilization Experiment. Soil Biol. Biochem. 2020, 141, 107679. [Google Scholar] [CrossRef]
  74. Li, M.; Wang, G.; Kang, X.; Hu, H.; Wang, Y.; Zhang, X.; Sun, X.; Zhang, H.; Hu, Z.; Xi, B. Long-term Fertilization Alters Microbial Community but Fails to Reclaim Soil Organic Carbon Stocks in a Land-use Changed Soil of the Tibetan Plateau. Land Degrad. Dev. 2020, 31, 531–542. [Google Scholar] [CrossRef]
  75. Zhang, Z.; He, P.; Hao, X.; Li, L.-J. Long-Term Mineral Combined with Organic Fertilizer Supports Crop Production by Increasing Microbial Community Complexity. Appl. Soil Ecol. 2023, 188, 104930. [Google Scholar] [CrossRef]
Figure 1. Location and landscapes of soil sampling site. ND, non-degraded grassland; LD, lightly degraded cropland; MD, moderately degraded cropland; and SD, severely degraded cropland.
Agronomy 14 01348 g001
Figure 2. FTIR relative peak areas of SOM: Phenolic and alcoholic –OH, relative abundance at 3620 and 3420 cm−1 (a). Aliphatic –CH, relative abundance at 2920 and 2850 cm−1 (b). Carbonyl C=O, relative abundance at 1880 cm−1 (c). Aromatic C=C, relative abundance at 1630 cm−1 (d). Polysaccharide C–O, relative abundance at 1035 cm−1 (e). Ratios of aromatic and aliphatic bonds (f) among the sites of different degradation levels (n = 18). Different letters represent significant differences among treatments (p < 0.05).
Agronomy 14 01348 g002
Figure 3. Principal component analysis of microbial communities affected by land degradation (a); loading of individual PLFAs and soil properties to PC1 and PC2 (b).
Agronomy 14 01348 g003
Figure 4. Pearson’s correlation analysis between soil biological indicators and SOM components. Bac/Fun, the ratio of bacteria to fungi; F, SOM resistance to decomposition. (* p < 0.05, ** p < 0.01, and *** p < 0.001).
Agronomy 14 01348 g004
Figure 5. Box plots of maize yield in degraded croplands (a). Different letters denote statistically significant differences (p < 0.05). Prediction of the response of the SOM composition, microorganisms, and soil basic attributes to crop yield based on random forest regression analysis (b). Path diagram revealing the direct and indirect effects of land degradation, soil, SOC composition, and microbial properties on crop yield by the structural equation model (c). Land degradation = LD, MD, and SD. The width of the arrow shows the intensity of the causality. The figures in solid and dotted arrows indicate the positive and negative effects, respectively. * p < 0.05, ** p < 0.01, *** p < 0.001. ‘↑’ and ‘↓’ denote positive and negative relationships between the soil indicators and PC1, respectively. Standardised impacts on crop yield determined by the SEM (d).
Agronomy 14 01348 g005
Table 1. Criteria for evaluating land degradation by wind erosion.
Evaluation FactorsDegree of Land Degradation
Light DegradationModerate DegradationSevere DegradationExtremely Severe Degradation
Annual rate of expansion of wind-accumulated (wind-eroded) surfaces (%)<11~22~5>5
Vegetation cover (%)>5030~5010~30<10
Soil loss by wind erosion (t hm−2 a−1)<1010~5050~200>200
Annual wind erosion depth (mm)<0.50.5~3.03.0~10.0>10.0
Reduction in biological production (%)<1515~3535~75>75
Comprehensive characterization of the surface landscapeThe natural landscape has not yet been destroyed, with localised areas of patchy wind erosion and quicksand.Patchy distribution of quicksand or windswept ground with obvious signs of wind erosion and surface coarsening.Wind-eroded depressions and remnant mounds are evident, and wind erosion marks and rough sandy surfaces are widely distributed.Presence of dense mobile dunes or windswept areas.
Table 2. Changes in soil physicochemical properties in different land degradation grades in the study.
TreatmentBDSWCpHSOCTNTPTKCECDOC
(g cm−3)% (g kg−1)(g kg−1)(g kg−1)(g kg−1)(cmol kg−1)(mg kg −1)
ND1.21 ± 0.04 d26.33 ± 0.42 a7.83 ± 0.18 b13.84 ± 0.23 a1.92 ± 0.09 a0.28 ± 0.01 c22.50 ± 1.87 a23.73 ± 1.09 a260.26 ± 6.43 a
LD1.48 ± 0.03 c21.55 ± 1.86 b7.76 ± 0.03 b9.07 ± 0.29 b1.12 ± 0.02 b0.72 ± 0.03 a21.83 ± 0.69 a20.25 ± 0.19 b224.54 ± 4.53 b
MD1.56 ± 0.03 b8.01 ± 2.30 c8.50 ± 0.29 a3.72 ± 0.24 c0.47 ± 0.04 c0.34 ± 0.03 b22.02 ± 0.78 a13.56 ± 0.56 c134.94 ± 3.72 c
SD1.70 ± 0.02 a3.99 ± 0.93 d8.54 ± 0.07 a2.41 ± 0.22 d0.29 ± 0.02 d0.20 ± 0.01 d22.43 ± 0.43 a7.27 ± 0.29 d123.66 ± 1.21 c
ND, non-degraded grassland; LD, lightly degraded cropland; MD, moderately degraded cropland; and SD, severely degraded cropland. BD, bulk density; SWC; soil water content; SOC, soil organic carbon; TN, total nitrogen; TP, total phosphorous; TK, total potassium; CEC, cation exchange capacity; DOC, dissolved organic carbon. Different letters denote significant differences at p < 0.05 among land degradation treatments.
Table 3. Changes in soil microbial properties in different land degradation grades in this study.
Soil PropertiesNDLDMDSD
MBC
(mg kg−1)
518.89 ± 30.49 a115.31 ± 3.56 b103.93 ± 3.04 bc88.85 ± 3.81 c
Br
(mgCO2-C kg−1 h−1)
4.38 ± 0.42 a3.68 ± 0.23 b2.78 ± 0.16 c1.00 ± 0.09 d
qCO20.85 ± 0.08 d3.21 ± 0.29 a2.67 ± 0.10 b1.13 ± 0.11 c
qMic0.04 ± 0.00 a0.01 ± 0.00 c0.03 ± 0.00 b0.04 ± 0.00 a
CAT
(mmol d−1 g−1)
72.67 ± 4.24 a65.96 ± 4.31 a39.34 ± 1.39 b19.67 ± 2.28 c
S-SC
(U g−1)
14.17 ± 1.13 a12.32 ± 0.98 b4.18 ± 0.36 c2.38 ± 0.29 d
S-UE
(U g−1)
1714.99 ± 181.68 a1653.14 ± 61.10 a1333.92 ± 60.26 b533.62 ± 85.94 c
S-AP
(U g−1)
7.47 ± 0.24 a6.351 ± 0.22 b2.68 ± 0.48 c1.68 ± 0.13 d
G+
(nmol g−1)
4.53 ± 0.10 b5.83 ± 0.11 a2.50 ± 0.09 c1.86 ± 0.03 d
G
(nmol g−1)
5.62 ± 0.08 b6.77 ± 0.10 a2.82 ± 0.10 c2.01 ± 0.02 d
Fungi
(nmol g−1)
5.67 ± 0.09 a5.56 ± 0.09 a2.87 ± 0.05 b2.48 ± 0.04 c
Actinomycetes
(nmol g−1)
4.51 ± 0.07 a4.84 ± 0.04 a1.89 ± 0.26 b1.23 ± 0.14 c
Bacterial
(nmol g−1)
27.19 ± 0.37 a23.98 ± 0.37 b11.34 ± 0.33 c8.95 ± 0.09 d
Total PLFAs
(nmol g−1)
47.53 ± 0.61 a46.98 ± 0.70 a21.43 ± 0.66 b16.54 ± 0.29 c
G+/G0.81 ± 0.01 c0.86 ± 0.01 b0.89 ± 0.02 b0.92 ± 0.01 a
Bac/Fun4.80 ± 0.09 a4.31 ± 0.02 b3.96 ± 0.06 c3.61 ± 0.06 d
MBC, microbial biomass carbon; Br, soil basal respiration; qCO2, metabolic coefficient; qMic, microbial coefficient; CAT, soil catalase; S-SC, soil sucrase; S-UE, soil urease; S-AP, soil alkaline phosphatase; G+, Gram-positive bacteria; G, Gram-negative bacteria; Bac/Fun, ratio of bacteria and fungi. Different letters denote significant differences among different land degradation treatments at p < 0.05.
Disclaimer/Publisher’s Note: The statements, opinions and data contained in all publications are solely those of the individual author(s) and contributor(s) and not of MDPI and/or the editor(s). MDPI and/or the editor(s) disclaim responsibility for any injury to people or property resulting from any ideas, methods, instructions or products referred to in the content.

