Abstract
Conservation tillage, a crucial method for protecting soil fertility, depends heavily on maintaining adequate straw coverage. The current method of straw coverage detection relies primarily on manual measurement, which is both time-consuming and laborious. This paper introduces a novel straw coverage detection approach based on an improved mask regional convolutional neural network (Mask R-CNN) algorithm. Several images of wheat straw-covered fields were taken, and the dataset was augmented using techniques like image inversion, contrast enhancement, Gaussian noise addition, and translation after cropping the original images. These fields use a crop rotation cycle of wheat and corn. Subsequently, the straw images were annotated using the Labelme annotation tool to obtain the available straw instance segmentation dataset. The Mask R-CNN algorithm was improved by refining the mask generation network structure through a multi-feature fusion strategy, which interweaves features from both the encoder and the mask generation network, enhancing the model’s ability to capture detailed and shape information of the straw. Lastly, using the mask information output by the improved Mask R-CNN algorithm, the straw coverage was calculated by counting the proportion of pixels within each segmented region. In the results, compared to the original Mask R-CNN algorithm, our improved Mask R-CNN algorithm achieved an average improvement of 7.8% in segmentation accuracy, indicating that the improved Mask R-CNN algorithm offers superior segmentation performance. Thus, the new algorithm can achieve straw coverage detection with higher accuracy and can provide a reference for other agricultural applications.
1. Introduction
Straw returning to the field offers numerous benefits for agricultural sustainability, with improving soil fertility, moisture retention, erosion control, etc. [1]. However, the effectiveness of straw returning depends on the straw coverage rate. China promotes conservation tillage to reduce environmental pollution caused by straw burning. Research [2] indicates that among various types of crop residues, corn, rice, wheat, cotton, rapeseed, peanuts, legumes, potatoes, sugarcane, and other crops account for 39.51%, 22.44%, 17.23%, 2.68%, 2.57%, 1.81%, 2.52%, 1.77%, 3.50%, and 5.82% of the total straw, respectively. With the government increasingly intensifying the prohibition on burning, the amount of straw being burned has decreased to 7.8%, which is significantly lower than the previously estimated range of 17% to 22%. One of the key policies contributing to this reduction is the provision of subsidies based on the rate of straw coverage.
An accurate and efficient straw coverage detection method is important for promoting conservation farming. Traditional methods for assessing the straw coverage rate often involve manual measurements, such as the dot-grid method or the line intercept method [3,4]. While relatively simple, these methods are time-consuming, subjective, and prone to human error. One such method involves manually measuring straw coverage using a 2-meter rope marked at 10-centimeter intervals. The rope is laid diagonally across the field, and the number of marked points with straw is counted. The straw coverage rate is calculated by dividing the number of marked points with straw by the total number of marked points. Alternatively, in a designated field area, several ropes can be stretched horizontally and vertically. The number of straw nodes at the intersections of the ropes is then counted manually. Finally, the straw coverage rate is approximately calculated by dividing the number of nodes with straw by the total number of intersections.
Satellite hyperspectral and unmanned aerial systems are costly and involve complex data processing [5,6,7]. Therefore, with technological advancements, computer vision and machine learning have been employed to detect straw coverage rates. Zhou et al. proposed an algorithm for evaluating ground straw coverage under conservation tillage, employing a ResNet18-U-Net segmentation model to detect straw coverage in low-altitude drone images with a mean absolute deviation of 3.56% [8]. Riegler-Nurscher et al. proposed a random decision forest to classify residue in soil [9]. An et al. proposed a method using K-means clustering and zonal optimization, achieving accurate straw identification under diverse environmental conditions with a mean deviation of 6.8% [4]. Liu et al. addressed the limitations of threshold segmentation in complex scenes by developing DSRA-UNet, a semantic segmentation algorithm with an MIOU of 80.05%, few training parameters, and rapid execution [10]. Li et al. introduced a novel idea using time–frequency domain transformation for rapid extraction of straw information, achieving an error rate of about 4.55% [11]. They designed an integrated decision model combining FFT and SVM for straw recognition, achieving a 4.55% average recognition error; 0.05 s processing time per image; and robustness against light, furrows, ruts, shadows, and clods. Su et al. carried out the initial detection of complete straw coverage in small plots using an automatic threshold algorithm [12]. Yang et al. proposed an image processing algorithm incorporating straw image distortion correction and Otsu threshold segmentation, boasting a less than 5% actual measurement error [13]. Ma Qin et al. constructed a UNet-based straw detection model for scattered straw cover, diverse straw forms, and fine straw identification challenges [14]. Their model outperformed UNet with a 2.59% higher average intersection ratio and met time complexity requirements.
Using drone RGB images and hyperspectral images to detect straw coverage is costly and involves complex data processing, and it is significantly affected by weather and spatial resolution. Therefore, an image-based method for automatic detection of straw coverage is highly desirable. However, despite the advancements [15], complex field conditions like varying lighting, soil types, and crop residues still pose challenges for image-based analysis. Enhancing detection efficiency, accuracy, and adaptability for practical applications is the goal of continued research into straw coverage detection methods. Mask R-CNN is a deep learning model for image segmentation and object detection. Compared with traditional threshold-based segmentation methods, it is more robust to light changes and complex backgrounds. After optimization, the Mask R-CNN model can run in real time on images or video streams, which is suitable for straw coverage rate measurement on site.
Therefore, the purpose of the research is to develop a model for straw detection in fields. To this end, the specific objectives are to (1) collect data on the straw coving field after conservation tillage to create a dataset, (2) propose a straw segment model by improvement of the MaskR-CNN, and (3) test the robustness of the model and calculation of straw coverage.
2. Materials and Methods
2.1. Image Acquisition and Preprocessing
Straw images were captured between 9:00 a.m. and 2:00 p.m. in October 2022 on sunny and cloudy days using a smartphone (Apple iPhone 13) in the experimental field (117.16017 E, 36.15959 N) of Shandong Agricultural University (Figure 1), Shandong Province, China. The experimental field is located in Tai’an City, Tai’an District. This district features a geographically advantageous location with the northern part being mountainous and the southern part consisting of a piedmont plain. The area boasts rich water and thermal resources, beneficial for crop growth and development. The region experiences an average annual temperature of 12.9 °C and an average annual precipitation of 697 mm, characteristic of a continental semi-humid monsoon climate. The soil type is brown soil with a medium loam texture; deep soil layers; and good properties for aeration, water permeability, water retention, and temperature maintenance. The field is well equipped with irrigation and drainage infrastructure. The experimental area follows a standardized management system with wheat–corn rotation.
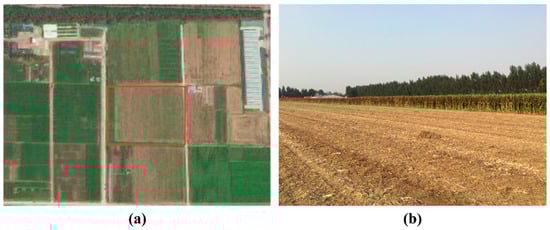
Figure 1.
Experiment Sit: (a) satellite map of the field; (b) the field under conservation tillage.
The camera lens was positioned 1.4 m above the ground to ensure high-quality, high-resolution images essential for detailed analysis and model development. The Apple iPhone 13’s primary camera features a 12-megapixel sensor and an f/1.6 aperture, providing clear and precise imaging capabilities. This study aimed to investigate methods for rapid and accurate detection of straw coverage based on RGB images. A total of 1000 images of straw returning to the field were captured, originally at a resolution of 4032 × 3024 pixels with an average size of 10 MB. We referred to many previous studies and conducted preliminary experiments [16,17,18], and we found that cutting the image to 1024 × 768 pixels can ensure recognition accuracy and speed. Therefore, to facilitate annotation and accelerate model training, these images were cropped to 1024 × 768 pixels. To ensure the reliability and generalizability of findings, 250 images were randomly selected and reserved as the test set. The remaining 750 images underwent augmentation techniques, namely image inversion, contrast enhancement, Gaussian noise addition, and translation. These methods were employed to simulate diverse visual conditions and enhance dataset variability. As a result, the final dataset comprised 3000 images, capturing variations in lighting and image quality encountered during the study period.
2.2. Data Annotation
The dataset was annotated using Labelme 5.3.1 [19], an open source MIT software. The straw area in the images was segmented by meticulously connecting points and lines. The criteria used for connecting these points and lines were carefully specified, guided by experts in agronomy, to ensure precise delineation of the straw regions. This approach included assigning preset labels to each segment, facilitating accurate labeling and segmentation of the straw in the returned imagery. Figure 2 illustrates the annotation process by Labelme, showcasing how JSON files were automatically generated to encapsulate annotation data such as mask box coordinates, object categories, and image channel counts.
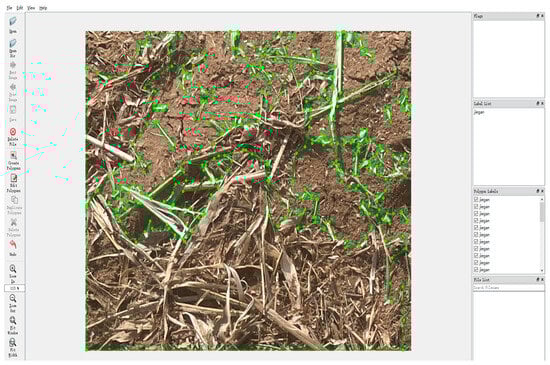
Figure 2.
Data annotation process by Labelme.
2.3. Improved Mask R-CNN Algorithm
Building upon Faster R-CNN’s [20] existing branches for classification and coordinate regression, Mask R-CNN adds a parallel branch for semantic segmentation. This elegant addition, resulting in only a minor computational overhead, empowers Mask R-CNN to perform both object detection and pixel-by-pixel segmentation simultaneously, thereby seamlessly identifying and differentiating individuals within detected object classes [21,22,23,24,25,26,27]. Its structure is shown in Figure 3.
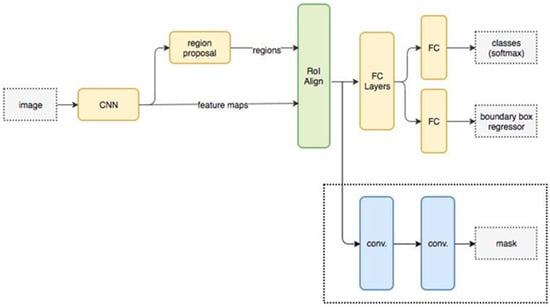
Figure 3.
The structure of Mask R-CNN. The input image is first processed by a convolutional neural network (CNN) to extract feature maps. These feature maps are then used by the proposed regional network to generate regions of interest. The regions undergo RoI Align before being fed into fully connected (FC) layers for classification (classes) and bounding box regression. Additionally, the feature maps are processed through convolutional layers to produce segmentation masks.
In conventional image instance segmentation models, encoders and decoders commonly are usually used to form the backbone of mask generation networks. Feature extraction typically relies on established networks like VGG16 [28] or ResNet101 [29]. However, this approach falls short when tackling challenges like the incomplete segmentation of straw instances. This study proposes an improved Mask R-CNN algorithm specifically designed to address these limitations. Figure 4 illustrates the architecture (note that RPN and RoI Align layers are omitted for clarity). Our key innovation lies in the revamped decoder structure, aiming to enhance model performance and overcome the issue of incomplete straw instance segmentation.
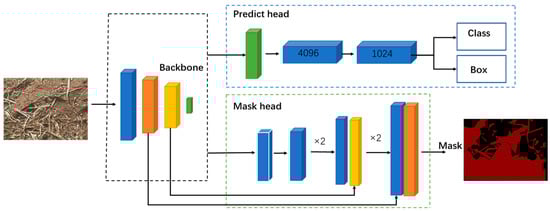
Figure 4.
The structure of the improved Mask R-CNN algorithm. The input field straw image is processed through convolutional layers to extract feature maps. These feature maps are then split into two branches. The upper branch involves classification and bounding box regression via fully connected layers, while the lower branch involves the generation of segmentation masks using convolutional layers to identify the coverage of straw in the image.
Our improved approach to instance segmentation integrates features extracted from the Backbone network into both the Predict Head and Mask Head branches. In the Predict Head branch, these features are utilized for tasks such as object detection and bounding box regression, while in the Mask Head branch, they are used for mask generation. Specifically, in the Mask Head branch, features from the Backbone network at two different scales undergo 3 × 3 convolutions before being fused with upsampled features to generate masks.
Unlike traditional methods that directly use features from the encoder in a separate decoder network [30,31], our approach abandons this direct backbone feature extraction method in favor of a multi-feature fusion strategy. This strategy involves iteratively integrating features from both the encoder and the mask generation network, establishing a tightly coupled architecture. During the mask generation stage, this iterative integration allows the decoder to accurately map the encoding process. By collaboratively utilizing features from different scales in the feature extraction network with those from the mask generation network, our model significantly improves the accuracy of instance segmentation. This multi-feature fusion design enhances the model’s ability to capture intricate details and shape information of the target objects, thereby generating finer instance masks [32].
2.4. Experimental Environment and Model Evaluation
The computer hardware included an Intel Core i5-11400F CPU @ 2.60 GHz and an NVIDIA GEFORCE GTX1660Ti graphics card. Python 3.7 was used as the main editor, Tensorflow-GPU1.13.2 was used to build and train the straw coverage detection model, CUDA 10.0 and Cudnn7.0 4.1.5 were used to speed up the training process, and Keras2.1.5 was used to build a convolution deep network model. The performance of the proposed improved Mask R-CNN model was evaluated using precision (P), recall (R), F1 score, and average precision (AP). These indicators were defined as follows [33]:
where TP, FP, and FN represented the true positives, false positives, and false negatives, respectively.
In this study, the intersection over union (IoU) ratio was used as a key metric for evaluating the model’s performance in predicting straw coverage. It quantifies the overlap between the predicted boundary and the ground truth boundary, with a higher IoU indicating a more accurate prediction. Specifically, the IoU score is calculated as the area of intersection divided by the area of their union [34].
For this straw coverage detection task in this paper, the evaluation model performance focused more on the evaluation of masks, using AP (average precision) as the evaluation indicator for mask IoU, which leverages the area under the precision–recall curve. We focused on AP because it can provide a holistic assessment of the model’s performance across diverse IoU thresholds, taking into account both recall and accuracy rates. AP50 and AP75 represent the AP values with IoU thresholds of 0.5 and 0.75, respectively. The three metrics AP, AP50, and AP75 were employed to gauge the effectiveness of our proposed methods in subsequent experiments.
2.5. Transfer Learning
COCO is a huge dataset for object detection and image segmentation, containing over 328,000 images categorized into 91 distinct classes. Each image has a corresponding annotation file, labeling the bounding box and category of each object. In addition, for instance, segmentation tasks and pixel-level mask annotation of each object are also provided. In this study, in order to shorten the training time of the model as much as possible, the idea of transfer learning was used to introduce the pretraining model based on the COCO dataset, and the pretraining model weight on the COCO dataset was used as the initial weight of Mask R-CNN [35].
3. Results and Discussion
3.1. Model Training
This study retained the highly effective multi-objective loss function originally employed by Mask R-CNN, which comprises classification loss, detection loss, and segmentation loss. The loss function is crucial in model training, as it measures the discrepancy between predicted and actual values. Both the original Mask R-CNN model and our enhanced version were trained on a custom straw dataset. Figure 5 illustrates the changes in the loss function for both models, with the x-axis representing training epochs and the y-axis showing loss values. Analyzing the curves, we found that although both models demonstrated rapid convergence over iterations, the enhanced Mask R-CNN converged more quickly and ultimately achieved a lower stabilized loss.
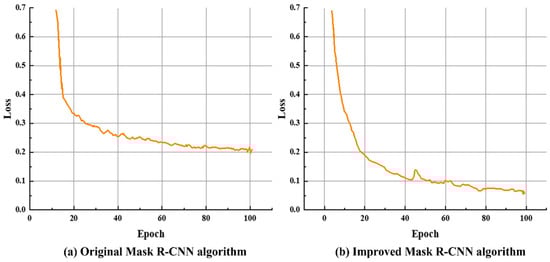
Figure 5.
Comparison of loss function of two models: (a) the loss curve of the original Mask R-CNN; (b) the loss curve of improved Mask R-CNN.
To evaluate the efficiency of the proposed improved Mask R-CNN algorithm, the trained model was tested on a separate test set. The segmentation performance of the original Mask R-CNN and our improved model is shown in Figure 6a and Figure 6b, respectively. As can be seen from Figure 6, the prediction results of the original Mask R-CNN had a certain degree of land misdetection, and the prediction results of the improved Mask R-CNN were more consistent with the straw target, with fewer missing and redundancy. In addition, the original Mask R-CNN had poor recognition of small-area finely chopped straw and a high rate of missed detection. From this, it can be seen that our improved Mask R-CNN achieved superior segmentation accuracy for straw objects, exhibiting fewer missed detections and false positives compared to the original Mask R-CNN algorithm.
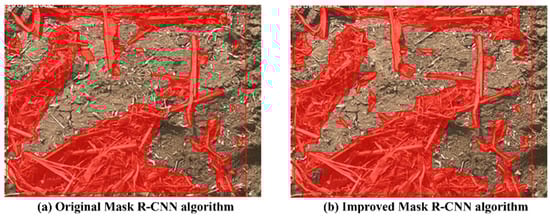
Figure 6.
Comparison of the prediction results of the two models: (a) the prediction results of the original Mask R-CNN; (b) the prediction results of improved Mask R-CNN.
Table 1 provides a comparative analysis of the original Mask R-CNN model and improved Mask R-CNN across various crucial performance metrics. The metrics evaluated include precision (P), recall (R), F1 score (F1), average precision (AP), and average precision at different IoU thresholds (AP50 and AP75). The improved Mask R-CNN model demonstrated substantial enhancements in all assessed metrics. Specifically, the precision (P) increased from 0.7825 to 0.8169, indicating a notable improvement of 4.4%. Similarly, recall (R) improved from 0.7731 to 0.7948, showing a 2.8% enhancement, while the F1 score (F1) increased from 0.7778 to 0.8057, representing a 3.5% increase. Most notably, the average precision (AP) improved significantly from 0.6728 to 0.7254, reflecting a substantial 7.8% enhancement. At an IoU threshold of 0.50 (AP50), the average precision increased from 0.7862 to 0.8127, demonstrating a 3.3% improvement, and at IoU 0.75 (AP75), it increased from 0.7191 to 0.7713, showing a 7.2% increase. These findings underscore the effectiveness of the enhancements implemented in the Mask R-CNN model, particularly in improving accuracy and robustness across varying evaluation criteria. It can be seen that the improved Mask R-CNN algorithm can provide more accurate straw segmentation.

Table 1.
Comparison of test parameters.
3.2. Evaluation of Model’s Adaptability to Varying Straw Coverage
To further compare the adaptability to varying straw coverage rates between the original and improved Mask R-CNN, comparative experimental analysis across three straw coverage rate intervals less than 35%, 35–65%, and greater than 65% was conducted. The segmentation results for each interval are depicted in Figure 7, Figure 8 and Figure 9, respectively. It is evident that the original Mask R-CNN algorithm exhibited land misdetection and missed detecting straw across all three coverage intervals. Conversely, the proposed improved Mask R-CNN demonstrated significant advancements in straw segmentation. It accurately distinguished land even when surrounded by large areas of straw, showing superior recognition of finely chopped straw compared to the former approach. This enhancement is crucial as finely chopped straw often appears in small areas, impacting the overall performance and utility of the model. Furthermore, the improved algorithm exhibited superior segmentation performance within the 35–65% straw coverage range, suggesting its potential for further optimization and refinement.
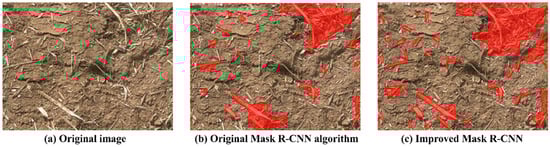
Figure 7.
Model segmentation results for straw coverage less than 35% interval.
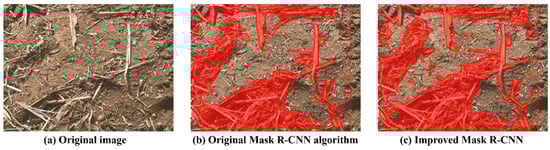
Figure 8.
Model segmentation results for the 35–65% interval of straw cover.
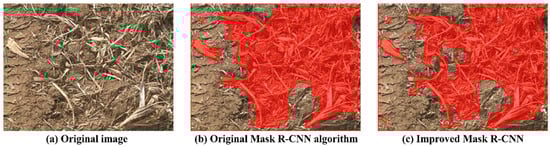
Figure 9.
Model segmentation results for straw coverage greater than 65% interval.
3.3. Calculation of Straw Coverage
After straw segmentation, the coverage rate was calculated by dividing the number of identified straw pixels by the total number of pixels in the image, as shown in Formula (5).
For the two trained algorithms mentioned above, the straw coverage calculation test was carried out with the testing set. The output results of the original Mask R-CNN algorithm and the improved Mask R-CNN algorithm proposed in this paper are shown in Figure 10. Figure 10a shows that the straw coverage calculation is 42.24% using the original Mask R-CNN algorithm, whereas Figure 10b shows that the straw coverage calculation is 49.95% using the improved Mask R-CNN algorithm.
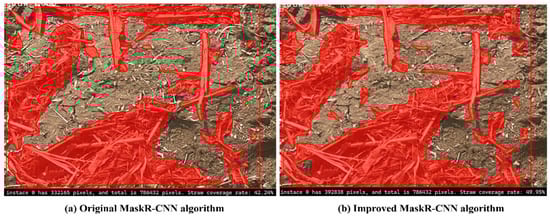
Figure 10.
Results of straw coverage calculation for two models.
3.4. Discussion
The enhanced Mask R-CNN algorithm demonstrated clear advantages in straw segmentation. It trained faster with lower losses compared to the original model. The evaluation of test data consistently showed improved metrics, notably increasing AP, AP50, and AP75 by 7.8%, 3.3%, and 7.2%, respectively. This enhancement effectively reduced missed detections and false positives, particularly for finely chopped straw fragments. Across various levels of straw coverage, the improved algorithm consistently outperformed the original, accurately segmenting finely chopped straw and maintaining superior performance. Additionally, when compared to manually measured ground truth (Figure 11), the improved Mask R-CNN achieved an average error of 3.2%.
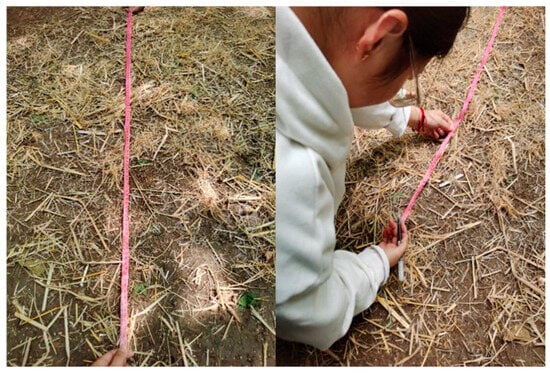
Figure 11.
Manual measurement of straw coverage rate.
When comparing several studies on straw coverage detection (Table 2), significant differences in average error rates are evident. Ma et al. (2023) [14] achieved an average error of 3.8% using the U-Net method. An et al. (2021) [3] employed K-means clustering, resulting in the highest average error of 6.8%. Yang et al. (2023) [15] utilized an improved Otsu method, achieving an average error of 3.9%. In contrast, our study, which used an improved Mask R-CNN method, achieved the lowest average error of 3.2%.
Table 2.
Compared with the existing study on straw coverage detection.
This comparison highlights that deep learning methods, such as U-Net and Mask R-CNN, perform exceptionally well in addressing the straw coverage detection problem, significantly outperforming traditional clustering methods and the improved Otsu method. Notably, our improved Mask R-CNN method demonstrated the highest accuracy with the lowest average error, indicating its superior effectiveness and accuracy in straw coverage detection.
In conclusion, the improved Mask R-CNN algorithm shows substantial promise for straw segmentation applications. Future efforts could focus on further optimizing the model’s performance across diverse environmental conditions and extending its utility to other related agricultural tasks. Additionally, in future studies, it may be beneficial to conduct research on straw estimation by classifying straw fields into categories of 25%, 50%, 75%, and 100% straw load for model formulation and validation. This approach could generate more accurate straw load prediction data and further enhance the model’s applicability and precision.
4. Conclusions
This study aimed to develop a model for calculating straw coverage, proposing an enhanced Mask R-CNN model. The results revealed a notable 7.8% average improvement in segmentation accuracy, underscoring the superior performance of the enhanced Mask R-CNN algorithm. Utilizing the mask information generated by this algorithm, the calculation of straw coverage was facilitated by assessing the proportion of pixels within each segmented region. In comparative experiments conducted on a custom straw instance segmentation dataset, the enhanced Mask R-CNN algorithm exhibited significant improvements. Specifically, its average precision (AP), AP50, and AP75 metrics surpassed those of the original Mask R-CNN model by 7.8%, 3.3%, and 7.2%, respectively, demonstrating its superior segmentation capabilities. Looking ahead, we plan to enhance the accuracy and efficiency of the enhanced Mask R-CNN algorithm by expanding our dataset to include diverse environmental conditions and types of straw materials, optimizing the model architecture and hyperparameters, implementing advanced postprocessing techniques, exploring cross-modal learning, and improving computational efficiency for real-world agricultural applications. These efforts aim to refine the model’s performance and ensure its reliability across various scenarios.
Author Contributions
Conceptualization, Y.S. and Z.H.; methodology, Y.S. and G.X.; software, X.L. and H.L.; validation, X.G., X.L. and H.L.; investigation, F.G. and X.L.; data curation, X.L. and F.G.; writing—original draft preparation, Y.S.; writing—review and editing, Y.S., X.G. and G.X.; supervision, Z.H.; funding acquisition, Y.S. All authors have read and agreed to the published version of the manuscript.
Funding
This research was funded by the Key Laboratory of Modern Agricultural Equipment, Ministry of Agriculture and Rural Affairs, P.R. China.
Data Availability Statement
Data are contained within the article.
Conflicts of Interest
The authors declare no conflicts of interest.
References
- Zhang, H.; Zhang, Y.; Yan, C.; Liu, E.; Chen, B. Soil nitrogen and its fractions between long-term conventional and no-tillage systems with straw retention in dryland farming in northern China. Geoderma 2016, 269, 139–144. [Google Scholar] [CrossRef]
- Shi, Z.; Jia, T.; Wang, Y.; Wang, J.; Sun, R.; Wang, F.; Li, X.; Bi, Y. Comprehensive utilization status of crop straw and estimation of carbon from burning in China. Chin. J. Agric. Resour. Reg. Plan. 2017, 38, 32–37. [Google Scholar]
- An, X.; Wang, P.; Luo, C.; Meng, Z.; Chen, L.; Zhang, A. A straw coverage calculation method based on K-means clustering and zoning optimization. Trans. Chin. Soc. Agric. Mach. 2021, 52, 84–89. [Google Scholar]
- Sun, L.; Gai, Z.; Wang, Q.; Zhang, J. Advances in straw mulch technology and its prospect in China. Anhui Agric. Sci. Bull. 2015, 21, 96–98. [Google Scholar]
- Yue, J.; Tian, Q. Estimating Fractional Cover of Crop, Crop Residue, and Soil in Cropland Using Broadband Remote Sensing Data and Machine Learning. Int. J. Appl. Earth Obs. Geoinf. 2020, 89, 102089. [Google Scholar] [CrossRef]
- Zhu, Q.; Xu, X.; Sun, Z.; Liang, D.; An, X.; Chen, L.; Yang, G.; Huang, L.; Xu, S.; Yang, M. Estimation of Winter Wheat Residue Coverage Based on GF-1 Imagery and Machine Learning Algorithm. Agronomy 2022, 12, 1051. [Google Scholar] [CrossRef]
- Memon, M.; Chen, S.; Niu, Y.; Zhou, W.; Elsherbiny, O.; Liang, R.; Du, Z.; Guo, X. Evaluating the Efficacy of Sentinel-2B and Landsat-8 for Estimating and Mapping Wheat Straw Cover in Rice–Wheat Fields. Agronomy 2023, 13, 2691. [Google Scholar] [CrossRef]
- Zhou, D.; Li, M.; Li, Y.; Qi, J.; Liu, K.; Cong, X.; Tian, X. Detection of ground straw coverage under conservation tillage based on deep learning. Comput. Electron. Agric. 2020, 172, 105369. [Google Scholar] [CrossRef]
- Riegler-Nurscher, P.; Prankl, J.; Vincze, M. Tillage Machine Control Based on a Vision System for Soil Roughness and Soil Cover Estimation. In Proceedings of the International Conference on Computer Vision Systems, Thessaloniki, Greece, 23–25 September 2019. [Google Scholar] [CrossRef]
- Liu, Y.; Zhou, X.; Wang, Y.; Yu, H.; Geng, C.; He, M. Detection of straw cover in conservation tillage fields using improved U-Net models. Opt. Precis. Eng. 2022, 30, 1101–1112. [Google Scholar] [CrossRef]
- Li, J.; Lü, C.; Yuan, Y.; Li, Y.; Wei, L.; Qin, Q. Automatic recognition of corn straw coverage based on fast Fourier transform and SVM. Trans. Chin. Soc. Agric. Eng. 2019, 35, 194–201. (In Chinese) [Google Scholar]
- Su, Y.; Zhang, D.; Li, H.; He, J.; Wang, Q.; Li, H. A straw coverage detection system based on automatic threshold segmentation algorithm. Agric. Mech. Res. 2012, 34, 138–142. [Google Scholar] [CrossRef]
- Yang, G.; Zhang, H.; Fang, T.; Zhang, C. Straw recognition and coverage detection technology based on improved AdaBoost algorithm. Trans. Chin. Soc. Agric. Mach. 2021, 52, 177–183. [Google Scholar]
- Ma, Q.; Wan, C.; Wei, J.; Wang, W.; Wu, C. Calculation method of straw coverage based on U-Net and feature pyramid network. J. Agric. Mach. 2023, 54, 224–234. [Google Scholar]
- Yang, X.; Zhang, W. Enhanced Detection of Straw Coverage Using a Refined AdaBoost Algorithm and Improved Otsu Method. Trait. Signal 2023, 40, 927–937. [Google Scholar] [CrossRef]
- Yan, E.; Ji, Y.; Yin, X.; Mo, D. Rapid estimation of camellia oleifera yield based on automatic detection of canopy fruits using UAV images. Trans. CSAE 2021, 37, 39–46. [Google Scholar]
- Rong, M.; Ban, B.; Wang, Z.; Guo, X.; Zhang, W. Measurement method of leaf circumference and area based on Mask R-CNN. Jiangsu Agric. Sci. 2022, 13, 199–206. [Google Scholar] [CrossRef]
- Zhao, Z.; Hicks, Y.; Sun, X.; Luo, C. Peach ripeness classification based on a new one-stage instance segmentation model. Comput. Electron. Agric. 2023, 214, 108369. [Google Scholar] [CrossRef]
- Torralba, A.; Russell, B.; Yuen, J. Labelme: Online image annotation and applications. Proc. IEEE 2010, 98, 1467–1484. [Google Scholar] [CrossRef]
- Sun, X.; Wu, P.; Hoi, S. Face detection using deep learning: An improved faster RCNN approach. Neurocomputing 2018, 299, 42–50. [Google Scholar] [CrossRef]
- Shu, J.; Nian, F.; Yu, M.; Li, X. An improved mask R-CNN model for multiorgan segmentation. Math. Probl. Eng. 2020, 2020, 8351725. [Google Scholar] [CrossRef]
- Gai, R.; Gao, J.; Xu, G. HPPEM: A High-Precision Blueberry Cluster Phenotype Extraction Model Based on Hybrid Task Cascade. Agronomy 2024, 14, 1178. [Google Scholar] [CrossRef]
- Liu, J.; Zhao, G.; Liu, S.; Liu, Y.; Yang, H.; Sun, J.; Yan, Y.; Fan, G.; Wang, J.; Zhang, H. New Progress in Intelligent Picking: Online Detection of Apple Maturity and Fruit Diameter Based on Machine Vision. Agronomy 2024, 14, 721. [Google Scholar] [CrossRef]
- Wang, S.; Sun, G.; Zheng, B.; Du, Y. A crop image segmentation and extraction algorithm based on mask RCNN. Entropy 2021, 23, 1160. [Google Scholar] [CrossRef] [PubMed]
- Zuo, L.; He, P.; Zhang, C.; Zhang, Z. A robust approach to reading recognition of pointer meters based on improved mask-RCNN. Neurocomputing 2020, 388, 90–101. [Google Scholar] [CrossRef]
- Jia, W.; Wei, J.; Zhang, Q.; Pan, N.; Niu, Y.; Yin, X.; Ding, Y.; Ge, X. Accurate segmentation of green fruit based on optimized mask RCNN application in complex orchard. Front. Plant Sci. 2022, 13, 955256. [Google Scholar] [CrossRef] [PubMed]
- Wang, D.; He, D. Fusion of Mask RCNN and attention mechanism for instance segmentation of apples under complex background. Comput. Electron. Agric. 2022, 196, 106864. [Google Scholar] [CrossRef]
- Yang, H.; Ni, J.; Gao, J.; Han, Z.; Luan, T. A novel method for peanut variety identification and classification by Improved VGG16. Sci. Rep. 2021, 11, 15756. [Google Scholar] [CrossRef] [PubMed]
- Zhang, Q. A novel ResNet101 model based on dense dilated convolution for image classification. SN Appl. Sci. 2022, 4, 9. [Google Scholar] [CrossRef]
- Singh, J.; Shekhar, S. Road damage detection and classification in smartphone captured images using mask R-CNN. arXiv 2018, arXiv:1811.04535. [Google Scholar]
- Danielczuk, M.; Matl, M.; Gupta, S.; Li, A.; Lee, A.; Mahler, J.; Goldberg, K. Segmenting unknown 3D objects from real depth images using mask R-CNN trained on synthetic point clouds. arXiv 2018, arXiv:1809.05825. [Google Scholar]
- Fang, S.; Zhang, B.; Hu, J. Improved mask R-CNN multi-target detection and segmentation for autonomous driving in complex scenes. Sensors 2023, 23, 3853. [Google Scholar] [CrossRef] [PubMed]
- Mu, X.; He, L.; Heinemann, P.; Schupp, J.; Karkee, M. Mask R-CNN based apple flower detection and king flower identification for precision pollination. Smart Agric. Technol. 2023, 4, 100151. [Google Scholar] [CrossRef]
- Balasubramanian, P.; Lai, W.; Seng, G.; Selvaraj, J. Apestnet with mask R-CNN for liver tumor segmentation and classification. Cancers 2023, 15, 330. [Google Scholar] [CrossRef]
- Khan, M.; Akram, T.; Zhang, Y.; Sharif, M. Attributes based skin lesion detection and recognition: A mask RCNN and transfer learning-based deep learning framework. Pattern Recognit. Lett. 2021, 143, 58–66. [Google Scholar] [CrossRef]
Disclaimer/Publisher’s Note: The statements, opinions and data contained in all publications are solely those of the individual author(s) and contributor(s) and not of MDPI and/or the editor(s). MDPI and/or the editor(s) disclaim responsibility for any injury to people or property resulting from any ideas, methods, instructions or products referred to in the content. |
© 2024 by the authors. Licensee MDPI, Basel, Switzerland. This article is an open access article distributed under the terms and conditions of the Creative Commons Attribution (CC BY) license (https://creativecommons.org/licenses/by/4.0/).