Article

Deficit Irrigation of Forage Cactus (Opuntia stricta) with Brackish Water: Impacts on Growth, Productivity, and Economic Viability under Evapotranspiration-Based Management

by
Francisco Mardones Servulo Bezerra
1,*,
Claudivan Feitosa de Lacerda
1,
Aelton Biasi Giroldo
2,
Eduardo Santos Cavalcante
1,
Nicola Michelon
3,
Giuseppina Pennisi
4,
Jonnathan Richeds da Silva Sales
1,
Carla Ingryd Nojosa Lessa
1,
Silvio Carlos Ribeiro Vieira Lima
5,
Fernando Bezerra Lopes
1,
Giorgio Gianquinto
4 and
Francesco Orsini
4
1
Agricultural Engineering Department, Federal University of Ceará, Fortaleza 60455-760, CE, Brazil
2
Federal Institute of Education, Science, and Technology of Ceará, Crateús 63705-260, CE, Brazil
3
Istituto Italo–Latino Americano, Via Giovanni Paisiello 24, 00198 Roma, Italy
4
Research Centre in Urban Environment for Agriculture and Biodiversity (ResCUE-AB), Department of Agricultural and Food Sciences (DISTAL), Alma Mater Studiorum University of Bologna, Viale Fanin, 44, 40127 Bologna, Italy
5
Secretariat of Economic Development of the State of Ceará, Fortaleza 60811-341, CE, Brazil
*
Author to whom correspondence should be addressed.
Agronomy 2024, 14(7), 1445; https://doi.org/10.3390/agronomy14071445
Submission received: 25 May 2024 / Revised: 23 June 2024 / Accepted: 29 June 2024 / Published: 2 July 2024
(This article belongs to the Special Issue Influence of Irrigation and Water Use on Agronomic Traits of Crop)

Abstract

:
Climate change significantly impacts agriculture and forage production, requiring the implementation of strategies toward increased water and energy use efficiency. So, this study investigated the yield of forage cactus (Opuntia stricta (Haw.) Haw) under different irrigation depths using brackish groundwater (1.7 dS m−1), whose management was based on reference evapotranspiration (ETo) estimated by the Hargreave–Samani (HS) and Penman–Monteith (PM) equations. The research was conducted in Independência, Ceará, Brazil, under the tropical semi-arid climate. A randomized block design in a 2 × 5 factorial scheme was employed, varying the ET0 estimation equations (HS and PM) and irrigation levels (0; 20; 40; 70; and 100% of total required irrigation—TRI). Growth, productivity, and water use efficiency variables were evaluated at 6, 12, and 18 months after treatment initiation. The economic analysis focused on added value, farmer income, and social reproduction level. The results showed no isolated effect of the equations or their interaction with irrigation depths on the analyzed variables, suggesting that irrigation management can be effectively performed using the simpler HS equation. Furthermore, there was no statistical difference between the means of 100% and 70% TRI as well as between 70% and 40% TRI for most variables. This indicates satisfactory crop yield under deficit irrigation. Dry matter productivity and farmer income at 12 months resulting from complementary irrigation with depths between 40% and 70% of TRI were significantly higher than under rainfed conditions. The 70% depth resulted in yields equivalent to those at 100% TRI, with the social reproduction level being achieved on 0.65 hectares in the second year.

1. Introduction

The escalating impact of climate change, characterized by global warming, has significantly affected agriculture, ecosystems, human survival, and development in recent decades [1,2,3], particularly in arid and semi-arid regions. These areas are experiencing rapid temperature increases, declining rainfall, and escalating soil erosion. Water scarcity has resulted in poverty and rural population migration [4] as environmental and human factors constrain agricultural practices [5].
Agriculture is confronted with the challenge of optimizing water and energy use, especially in regions with limited water resources, such as the tropical semi-arid zone. To achieve this, accurately determining plant water requirements is crucial for implementing an efficient irrigation schedule to enhance crop quality and productivity [6,7,8]. A pivotal component of this process is the determination of reference evapotranspiration (ET0) [9]. The Food and Agriculture Organization (FAO) of the United Nations (UN) has developed the FAO-56 Penman–Monteith model (FAO-56 PM) [10] and recommended it as the standard approach for estimating ET0 in diverse climatic regions worldwide [11,12,13]. Extensive comparisons with other empirical models under various climatic conditions and temporal scales have deemed this model superior, requiring no additional parameter calibration [14,15,16,17,18].
However, the Penman–Monteith (PM) model presents a significant obstacle: the frequent absence of data regarding meteorological parameters [18,19,20,21]. This fact relates to the availability but also the reliability of the dataset concerning radiation, air humidity, and wind speed in many regions around the globe, especially in developing countries [20]. As a result, further research aimed at developing simplified models that consider only one climatic variable (temperature) or two (temperature and relative humidity), although issues related to the overestimation or underestimation of crop water requirements have emerged, based on the specific geographic location [7,20].
Due to the challenges in obtaining and ensuring the reliability of data for use in the PM model, the Hargreave–Samani (HS) model has been recommended by the FAO as an alternative method. The HS model uses air temperature data and extraterrestrial solar radiation estimates and has shown reasonable ET0 results with global validity [10].
The ET0 can be combined with a crop coefficient (Kc), resulting in the Kc–ET0 method, which is then used to estimate crop evapotranspiration (ETc) at the field level [10]. ETc can be used to establish the time or frequency of water replenishment after an irrigation event, which must be estimated accurately [9]. However, such methods need to be associated with crops adapted or improved for different climatic conditions, aiming to increase agricultural yield, water productivity, and farmers’ income [3,22].
The cultivation of cactus (Opuntia sp. and Nopalea sp.) in semi-arid environments fits into this context, as the crop has anatomical and morphophysiological characteristics that confer adaptation to dry environments, with high resilience to climate change, high water use efficiency, and elevated production of energy-rich biomass. This helps reduce seasonal variation in food production (for animals or humans) in this region [23,24,25,26].
Deficit irrigation is also an important strategy for semi-arid regions, which can result in yields equivalent to those obtained with full irrigation and higher than production under rainfed conditions, such as forage crops [27,28,29,30,31,32]. Furthermore, forage cactus tolerates reasonable levels of irrigation with brackish waters, with threshold salinity values of approximately 3.0 dS m−1 [28,31,33,34,35]. These aspects represent a strategic advantage for this crop in the tropical semi-arid region, allowing for the use of brackish groundwater, which is more restrictive due to the low flow rate than the concentration of salts in the water [36].
The present study aimed at evaluating the productive and economic performance of forage cactus, subjected to deficit irrigation with brackish water and replenishment time established based on the estimated ET0 using the Penman–Monteith and Hargreaves–Samani equations in the conditions of the Brazilian semi-arid region. The research hypotheses are that deficit irrigation with moderately brackish water results in a high yield of forage cactus in the tropical semi-arid region and that the Penman–Monteith equation provides a more accurate estimate of irrigation replenishment time compared to Hargreaves–Samani, resulting in differences in the applied volume and yield of forage cactus.

2. Materials and Methods
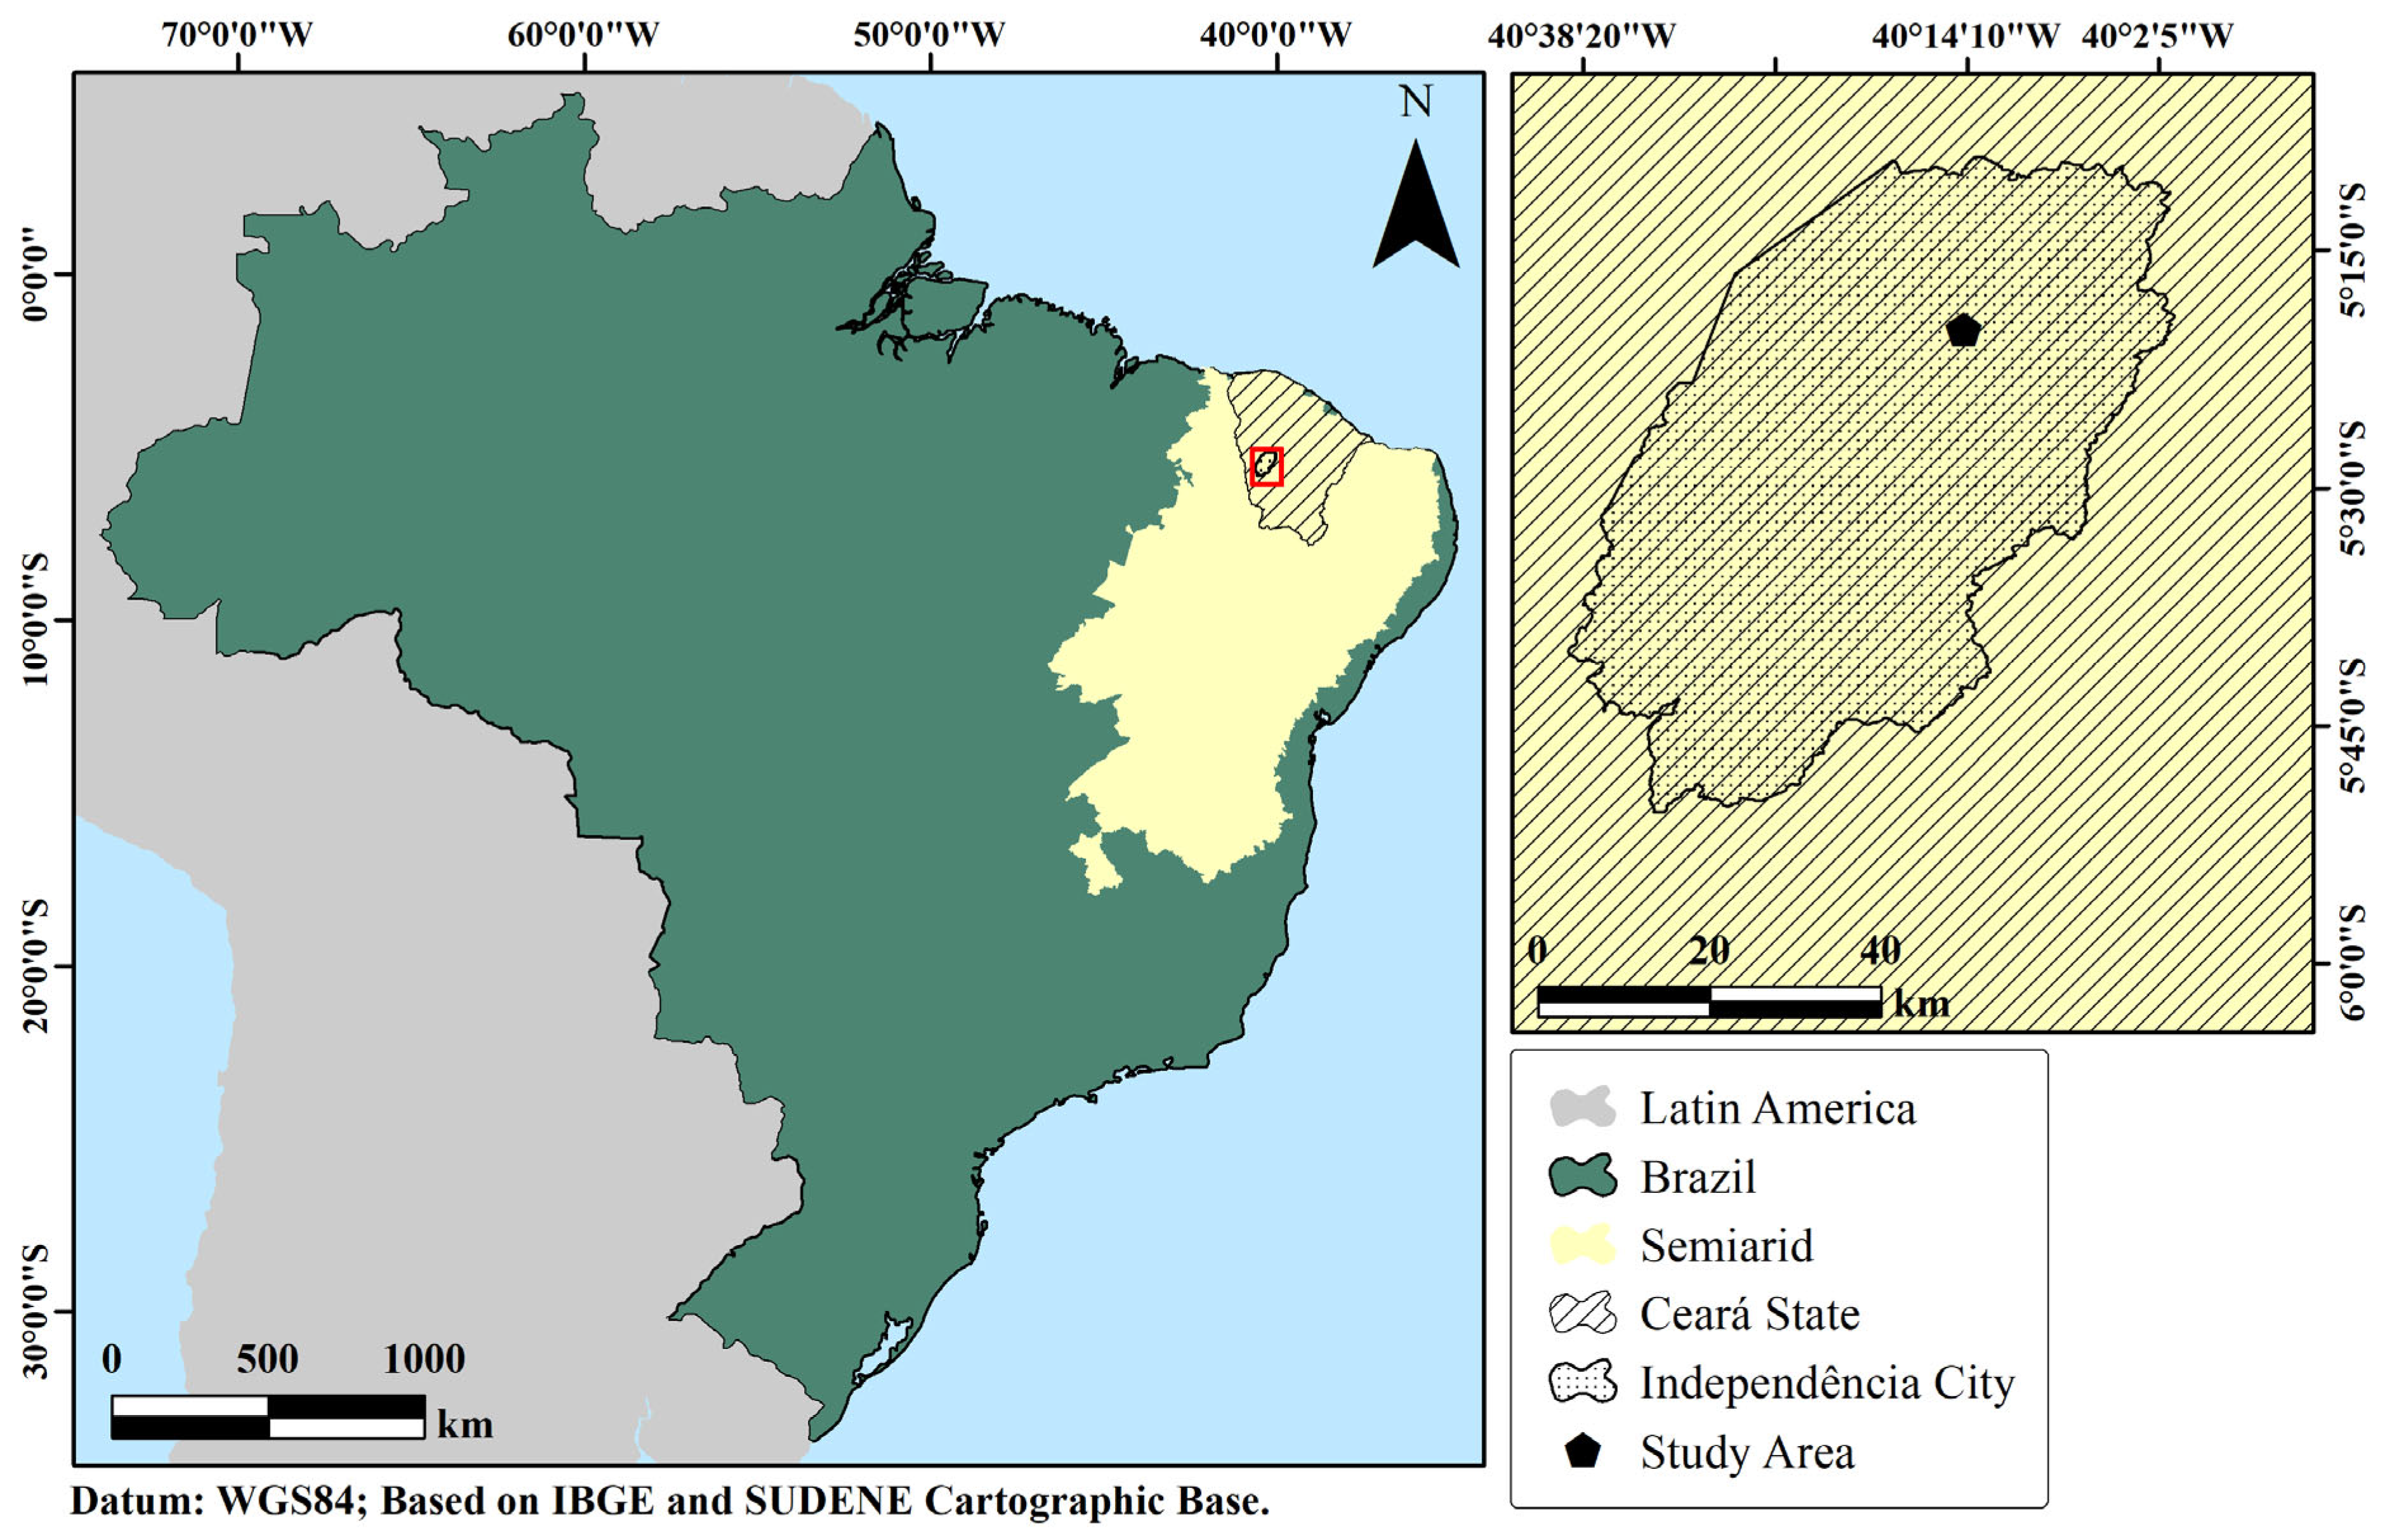
2.1. Study Area

The research was conducted in the experimental area of the Dom Fragoso Family Agricultural School (EFA D. Fragoso) in the municipality of Independência, Ceará, Brazil (Figure 1). The region’s climate, according to Köppen [37,38], is type BSh (tropical semi-arid), with an average annual precipitation of 760 mm, a rainy season concentrated in the first four months of the year.
Opuntia stricta (Haw.) Haw. (Cactaceae), cv. Mexican-Giant, was used for this study. This cultivar has greater resistance to the most important pest of the crop, which is the cochineal bug (Dactylopius opuntiae (Cockerell, 1896)-Hemiptera: Dactylopiidae), is also more tolerant to water deficit, and is becoming increasingly commonly cultivated in the region.
The crop establishment in the field took place in late November 2020. Planting was conducted using healthy cladodes from certified seed production origin from Vale Verde Agropecuária company, Russas, Ceará, Brazil. The cladodes were arranged in furrows parallel to each other at a depth of 0.15 m, spaced 0.3 m apart, and arranged in an east–west direction, with a planting density of 41,667 plants per hectare. The beginning of the treatment application occurred in August 2021 after a cut for standardization, keeping only the mother cladode. The experimental arrangement was in randomized blocks with four replications in a 5 × 2 factorial scheme relative to five irrigation levels (100, 70, 40, 20, and 0% of the total required irrigation—TRI, mm) and two methods of estimating reference evapotranspiration (Penman–Monteith—PM and Hargreaves–Samani—HS), thus constituting 40 experimental units. Each experimental unit had 5 rows of 9 m in length by 0.8 m spacing between them, totaling an area of 36 m2 and, therefore, a total area of 1440 m2 for the experiment.
The soil in the research area presented a sandy loam texture and the following chemical characteristics: water pH (6.0); electrical conductivity of saturation extract (ECe) (0.13 dS m−1); exchangeable cations (cmolc kg−1) Ca2+ (3.10), Mg2+ (0.4), Na+ (0.07), K+ (0.26), H+ + Al3+ (1.16), Al3+ (0.10), sum of bases (3.8), cation exchange capacity (5.0), base saturation (77%), aluminum saturation (3%), exchangeable sodium percentage (1); C (2.64 g kg−1), N (0.27 g kg−1), C/N (10), organic matter (OM) (4.55 g kg−1), assimilable P (2 mg kg−1).
The water used for irrigation came from a tilapia fish tank, which was supplied by a deep well with a flow rate of 1000 L h−1 and with brackish water. The results of the chemical analysis of the water used for irrigation (fish tank) were as follows: pH (7.2); electrical conductivity (ECw) (1.7 dS m−1); Ca2+ (4.5 mmolc L−1); Mg2+ (5.8 mmolc L−1); Na+ (6.1 mmolc L−1); K+ (0.3 mmolc L−1); Cl (15.4 mmolc L−1); HCO3− (1.2 mmolc L−1); P (0.58 mg L−1); and sodium adsorption ratio (1.91).
During the rainy seasons (January to June) of 2021 and 2022, a total of five physical weeding treatments were carried out. Irrigation events were performed during the dry seasons (July to December of 2021 and 2022) when three weeding treatments were performed. Also, during the rainy period of 2021, organic fertilization with cattle manure was applied at a rate equivalent to 30 t ha−1, as recommended for dense plantations of forage cactus [39].

2.2. Irrigation Levels

The total required irrigation depth (TRI) was obtained by the ratio between the actual necessary irrigation (ANI), according to Equation (1) [40], and the irrigation system efficiency (ISE), determined based on the flow test and distribution uniformity, which is displayed in percentage terms but, in the calculation, is inserted in decimal.
A N I = θ C C θ P M P × Z × f × 0.5
where θCC, θPMP, Z, and f are the soil moisture at field capacity, soil moisture at permanent wilting point, effective root zone depth, and soil water availability factor (f = 0.4), respectively. Furthermore, the value of the ANI was multiplied by a coefficient of 0.5 due to the effect of localized irrigation [40], which does not wet the entire area. Thus, the TRI was calculated according to Equation (2) [40]:
T R I = A N I I S E      
The values of soil moisture at field capacity and permanent wilting point were obtained through the soil water retention characteristic curve using the Richard chamber method [41]. The curves resulting from the determination process were adjusted [31], because once experimentally raised, it is necessary to define the best curve that fits the experimental data [41].
The soil moisture at field capacity and permanent wilting point for the sandy loam soil of the research area were 0.179 and 0.073 m3 m−3, corresponding to tensions of 10 and 1500 kPa, respectively. For forage cactus, the values of Z and f considered were 0.2 m [42,43] and 0.4 [10,44], respectively. The calculation of the ANI resulted in an irrigation depth of 4.24 mm, which, divided by an irrigation system efficiency (ISE) of 90%, resulted in a TRI depth of 4.71 mm.
The irrigation levels were established based on the TRI, with the first corresponding to 100% of the time needed for its replacement, the second represented by 70% of the time needed, the third represented by 40% of the time needed, and the fourth represented by 20% of the time needed. The fifth irrigation level had a value of zero, representing the rainfed farming. Irrigation control was carried out through controllers and solenoid valves, ensuring irrigation automation. The irrigation time (IT) was determined by Equation (3) [40]:
I T = I T N × E 1 × E 2 n × q
where IT is the irrigation time in hours, E1 and E2 represent the spacing between drippers (0.3 m) and between rows (0.8 m), n is the number of emitters per plant, and q is the emitter flow rate in L h−1. The average flow rate resulting from the flow rate test was 1.5 L h−1.
The irrigation timing was established based on crop evapotranspiration (ETc mm day−1), the product of reference evapotranspiration (ET0 mm day−1) multiplied by a crop coefficient (Kc) of 0.52 according to results formerly obtained for forage cactus [45]. ET0 was estimated using the Hargreaves–Samani (1985) and Penman–Monteith equations, respectively (Equations (4) and (5)), as follows:
E T 0   ( H S ) = α × ( ( T m a x T m i n ) β   ) × ( T m e d + 17.8 ) × R a × 0.408
E T 0   P M = 0.408 × Δ × R n G + y × 900 T m e d + 273 × v 2 × e s e a Δ + γ × 1 + 0.34 × v 2  
where Tmax and Tmin are the maximum and minimum temperatures in °C, respectively; α is an empirical parameter using its original value of 0.0023 [46]; β is an exponential empirical parameter with an original value of 0.5 [46]; Tmed is the mean temperature, the sum of the maximum and minimum divided by two; Ra is the extraterrestrial radiation, expressed in MJ m−2 day−1; Rn is the total net radiation of the grass in MJ m−2 day−1; G is the soil heat flux density in MJ m−2 day−1; v2 is the average daily wind speed at 2 m height in m s−1; es is the saturation vapor pressure in kPa; ea is the actual vapor pressure in kPa; Δ is the slope of the vapor pressure curve in kPa °C−1; and γ is the psychrometric constant in MJ kg−1. Temperature, relative humidity, wind speed, and radiation data were collected using an agrometeorological station (Precision Weather Station Vantage Pro2) located at the center of the experimental unit.
ET0 estimation calculations were performed using Microsoft Excel for the Hargreaves–Samani equation (1985) and the CROPWAT 8.0 software developed by the FAO for the Penman–Monteith equation. The daily irrigation requirement was based on the previous day’s ETc and residual soil moisture. In other words, ETc determined whether it was necessary to replenish the 4.71 mm TRI layer on a given day. If necessary, the full irrigation depth was applied along with any reductions as described earlier. This entire irrigation decision-making process was supported by a spreadsheet programmed for this purpose.
The weather conditions monitored during this study resulted in the following averages: maximum and minimum temperature (34.43 and 22.51 °C); average relative humidity (67.41%); and average wind speed (1.44 m s−1). The mean reference evapotranspiration estimated by the Penman–Monteith equation was 6.32 mm day−1, with a corresponding crop evapotranspiration of 3.21 mm day−1. The mean reference evapotranspiration estimated by the Hargreaves–Samani equation was 5.61 mm day−1, with a mean ETc of 2.89 mm day−1. Figure 2 shows the data of the ETc and ET0 as well as the meteorological conditions (rainfall and air temperature) throughout the research period.
Table 1 presents the data for the water supply applied to the crop during the research period, including irrigation and precipitation values at each evaluation time. The values for irrigation (I) and precipitation (P) at 12 and 18 months represent the cumulated events up to the respective time points.

2.3. Crop Evaluating Performance

The data collection process for evaluating crop performance occurred at 6, 12, and 18 months after the start of the treatment application, with these time points corresponding to January 2022, August 2022, and January 2023, respectively.
Morphological, productivity, and economic variables were analyzed. Morphological measurements were taken on two randomly selected useful plants within each experimental plot, representing the population, totaling 80 plants evaluated at each time. The measurements included plant width (in cm), used to calculate the soil coverage index; length and width of cladodes (in cm) for estimating cladode leaf area per plant (LA/P in cm2); and cladode thickness (CT in mm), which, when multiplied by LA/P, results in cladode volume per plant (VC/P in cm3). Plant width and length and width of cladodes were measured using a metal tape, while cladode thickness was measured using a digital caliper. For standardization purposes, cladode thickness was evaluated at the point where its width was determined, at the widest point.
Subsequently, the plants were harvested and weighed to determine the fresh and dry matter weight and, thus, crop productivity. Harvesting involved leaving only the basal or matrix cladode in the field. After weighing the fresh matter, a sample was taken, weighed again, placed in a properly labeled paper bag, and dried in a forced air circulation oven at 65 °C until a constant weight was reached after 72 h. The dry weight percentage of the sample was then used to calculate the dry matter weight of the plants, and fresh matter productivity (FMP in kg ha−1) and dry matter productivity (DMP in kg ha−1) were estimated by multiplying the respective values by the number of plants per hectare (41,667).
The area of each cladode (AC in cm2) was calculated using the equation (Equation (6)) formerly proposed for the Mexican-Giant [47], as shown below, and then summed to obtain LA/P:
A C = 0.7086 × ( 1 e x p × ( 0.000045765 × C L × L W ) ) 0.000045765
where CL and LW represent cladode length and width, respectively.
The soil cover index (SCI), presented as a percentage, represents the area occupied by the plant, considering its width and the spacing between rows, as detailed in Equation (7) [32]:
S C I = 100 × π × P W 2 4 π × 80 2 4  
where PW and 80 correspond to the plant width and spacing between planting rows in centimeters, respectively.
The physical water productivity (PWP) was estimated based on the dry matter. PWP (Equation (8)) represents the ratio between the biomass produced by the crop and the total water depth received (from precipitation and irrigation) or between the volume of water evapotranspired by the crop during the production cycle [22]. In this study, irrigation plus precipitation, expressed in millimeters, were considered and converted to a volume unit in cubic meters per hectare (m3 ha−1).
P W P P + I = Y a   k g   h a 1 P + I   m 3   h a 1
where Ya is productivity based on dry matter and P + I is precipitation plus irrigation.

2.4. Statistical Analysis

A descriptive statistical analysis of the response variables was conducted, including cladode thickness, cladode volume per plant, dry and fresh matter productivity, water use efficiency based on dry matter, leaf area per plant, and soil cover index. The data were presented as the mean and standard error. Analysis of variance (ANOVA) was used to assess the effects of irrigation levels, sampling time, and different equations on the response variables. The models were tested for residual normality and variance homoscedasticity, and deviations from normality and heteroscedasticity were addressed by log transformation when necessary. Additionally, coefficients of variation were verified for all models. When ANOVA detected significant differences between treatments, the Tukey post hoc test was used to verify significant differences in the means between pairs. The significance level for all tests was set at 5%.

2.5. Economic Analysis

The economic analysis was conducted using current values (December 2023) to estimate gross revenue and costs (fixed, variable, and equipment depreciation), expressed in Brazilian Reais (BRL), and the crop productivity at each irrigation level at 12 months (first year) after the start of the treatment application. Productivity data were used to estimate gross revenue, considering the price practiced in the State of Ceará for the sale of forage cactus at BRL 0.15 per kilogram of fresh matter paid to the farmer. Gross revenue was determined considering harvesting from primary cladodes, leaving only the basal cladode (matrix) in the area, as described above. The fixed cost for 1.0 hectare for all irrigation levels is presented in Table 2 and was considered as such only for irrigation materials. The total fixed cost was divided into ten years, as the farmer has the option to finance the materials over this period through a specific credit line to support investment in Brazilian family agriculture [48].
In terms of variable costs (Table 3), electricity expenses were calculated based on the irrigation level, with no cost for the rainfed treatment. Variable costs also included expenses for organic fertilizer and cladodes used as seeds for establishing the crop in the field. The depreciation value of the equipment was calculated by dividing the fixed cost investment (irrigation system) by its estimated useful life of ten years, resulting in a depreciation value of BRL 111.51.
The energy price was calculated considering the tariff for nighttime irrigation, according to Decree 7891 of the Federal Government of Brazil, for group B rural class with irrigation, equal to BRL 0.299 per kWh, multiplied by the energy consumption, in kWh, for the application of the respective irrigation depths over five months, the average irrigation period adopted in the research in the second semester of each year. The cost of organic fertilizer was obtained from the prices practiced by individuals who deliver manure in the Ibiapaba mountain range at an average price of BRL 340.02 per ton. Finally, the cost of seed cladodes was established based on the current price practiced in Ceará by forage cactus propagule producers, at BRL 0.29 per cladode.
To align with the farmer’s reality as closely as possible, this study considered that the costs were financed by the Bank of Northeast Brazil through the investment credit line called “Pronaf Mais Alimentos,” simulating a 10-year contract with an annual interest rate of 5% without a grace period. The bank interest rates for financing forage cactus cultivation varied according to the irrigation depths, annually presenting the following values: BRL 2236.50 (100%); 2235.57 (70%); 2235.03 (40%); 2234.83 (20%); and 1502.16 (0%).
With the cost and gross revenue values, the added value was calculated, which, according to economic literature, corresponds to the wealth resulting from the difference between the wealth generated in the production unit and the wealth distributed in the production process. In this way, it is possible, from the added value, to measure the income generation capacity of the production system for the farmer, since such income does not correspond to all the wealth generated but only to the part of that wealth that belongs to the economic agent who directly controls the production process, namely the farmer [49]. The added value of the production system was obtained for one hectare of forage cactus by Equation (9):
A V = G P V F C + V C + D
The variables are as follows: AV, added value; GPV, gross production value; FC, fixed costs associated with the production system; VC, variable costs associated with the production system, excluding labor; and D, equipment depreciation.
A linear relationship (AV = ax + b) was used to estimate the added value from two to five hectares for each irrigation depth, with added value on the ordinate axis and agricultural area on the abscissa axis. In this linear model, the marginal contribution per unit of equivalent area (FC + AV) is represented by “a”, and the fixed cost (FC) necessary for the implementation of the production system is represented by “b”.
The added value obtained for one hectare under each irrigation depth was used to estimate the farmers’ income, allowing for an assessment of the economic viability at the production unit level, as shown in Equation (10):
F I = A V I + W + T  
Variables are as follows: FI, farmer’s income; AV, added value; I, interest paid to the bank or another financial agent; W, wages paid to the workforce; and T, taxes and fees paid to the state.
The costs related to wages paid were for various activities, including tractor hours for land clearing, plowing, harrowing, and furrow opening, as well as daily wages for planting, organic fertilization, manual weeding, and irrigation system installation. These costs amounted to BRL 11,260.00 for the 100, 70, 40, and 20% irrigation depths, while for 0%, it was BRL 7760.01. These values correspond to the first year when the production area is established.
Building on the farmer’s income for one hectare, the farmer’s income for two to five hectares was calculated by constructing linear models (FI = ax + b) that describe the income variation under the different irrigation depths in relation to the agricultural area per unit of work. In this model, the farmer’s income is represented by FI, the marginal income contribution in relation to the area (FI + FC) is represented by “a”, and the fixed cost for implementing the production system is represented by “b”.
An analysis of the level of social reproduction (LSR) was carried out for each irrigation depth per agricultural area. The LSR is related to the income needed for social reproduction based on the minimum wage, which was adjusted to BRL 1320.00 through the Federal Government of Brazil Provisional Measure 1172/23, dated 1 May 2023. In this case, the LSR value represented in the graph refers to the sum of twelve minimum wages (1 year) of BRL 15,840.00, considering that, if the farmer was to rely exclusively on the forage cactus production system, this would be the minimum amount necessary to ensure their maintenance and interest in at least remaining in the activity [49].
Additionally, considering that forage cactus is a perennial crop, a simulation was performed that adjusts the added value and the farmer’s income in a second year of production (12 months after the previous harvest), as costs for seed cladodes, wages for tractor hours, and daily wages for planting and irrigation system installation will not be incurred. Therefore, it was considered that the crop’s productivity would be maintained from one year to the next, which was precisely the productivity obtained under irrigation levels at 12 months after the start of the treatment application.

3. Results

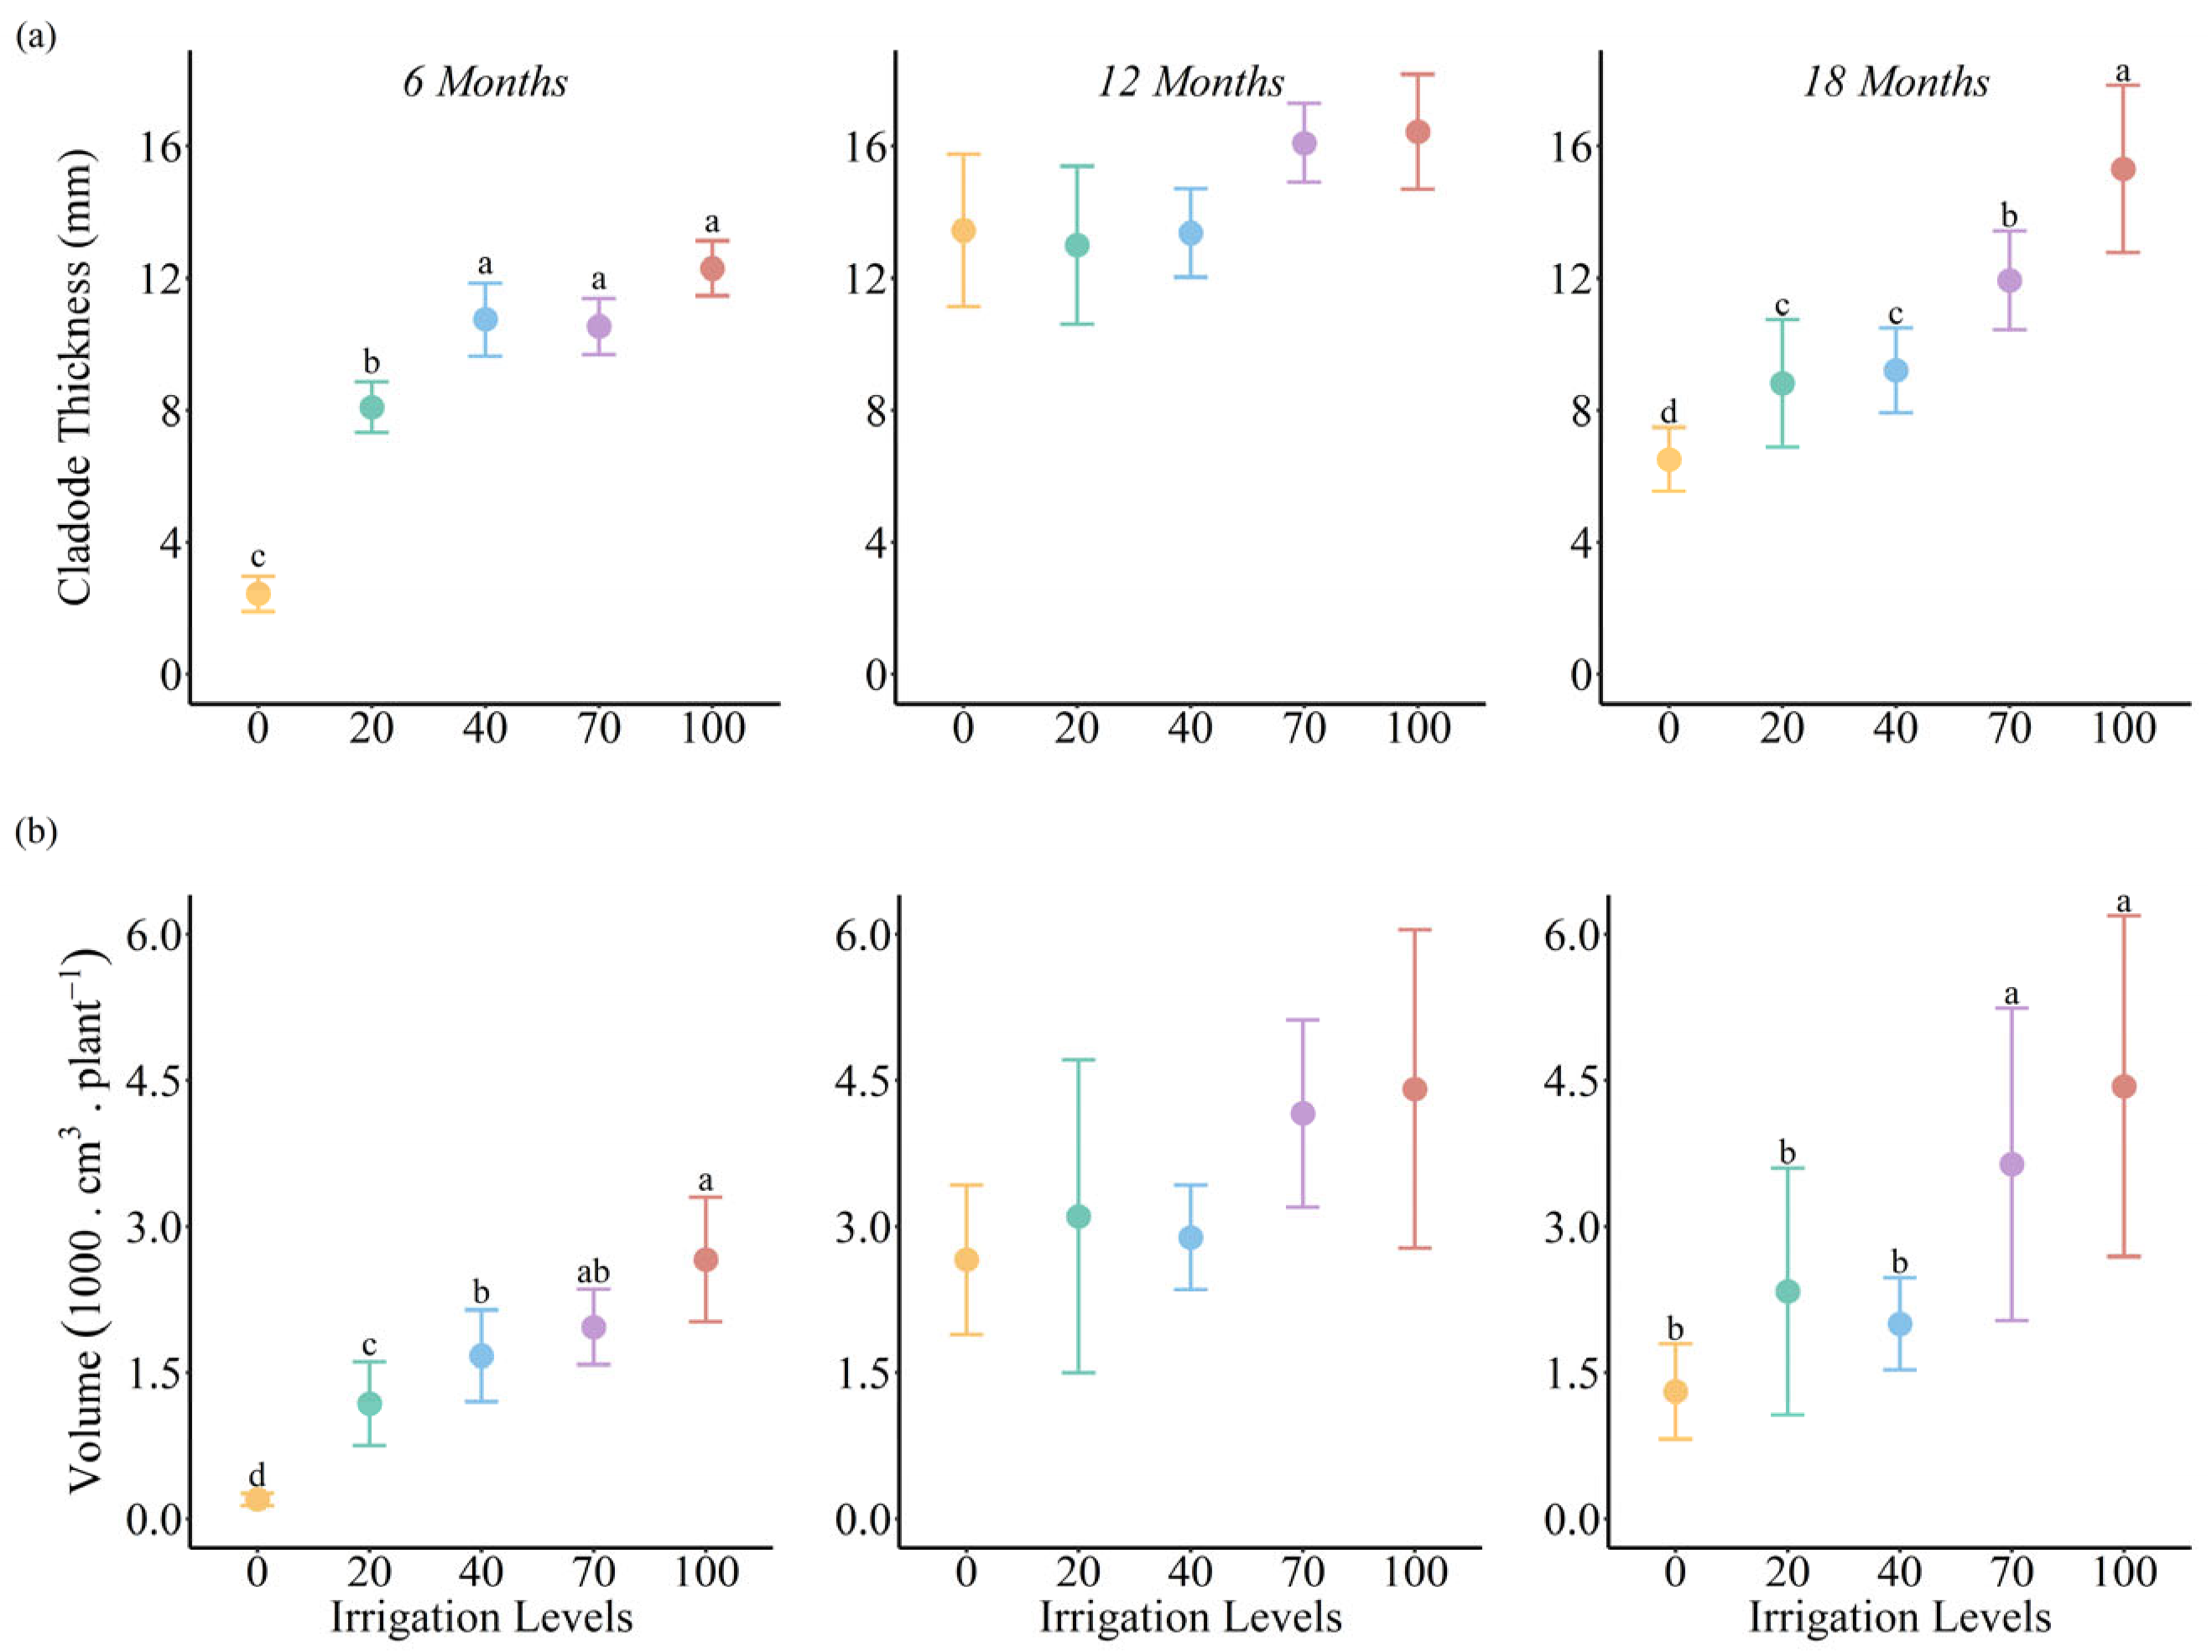
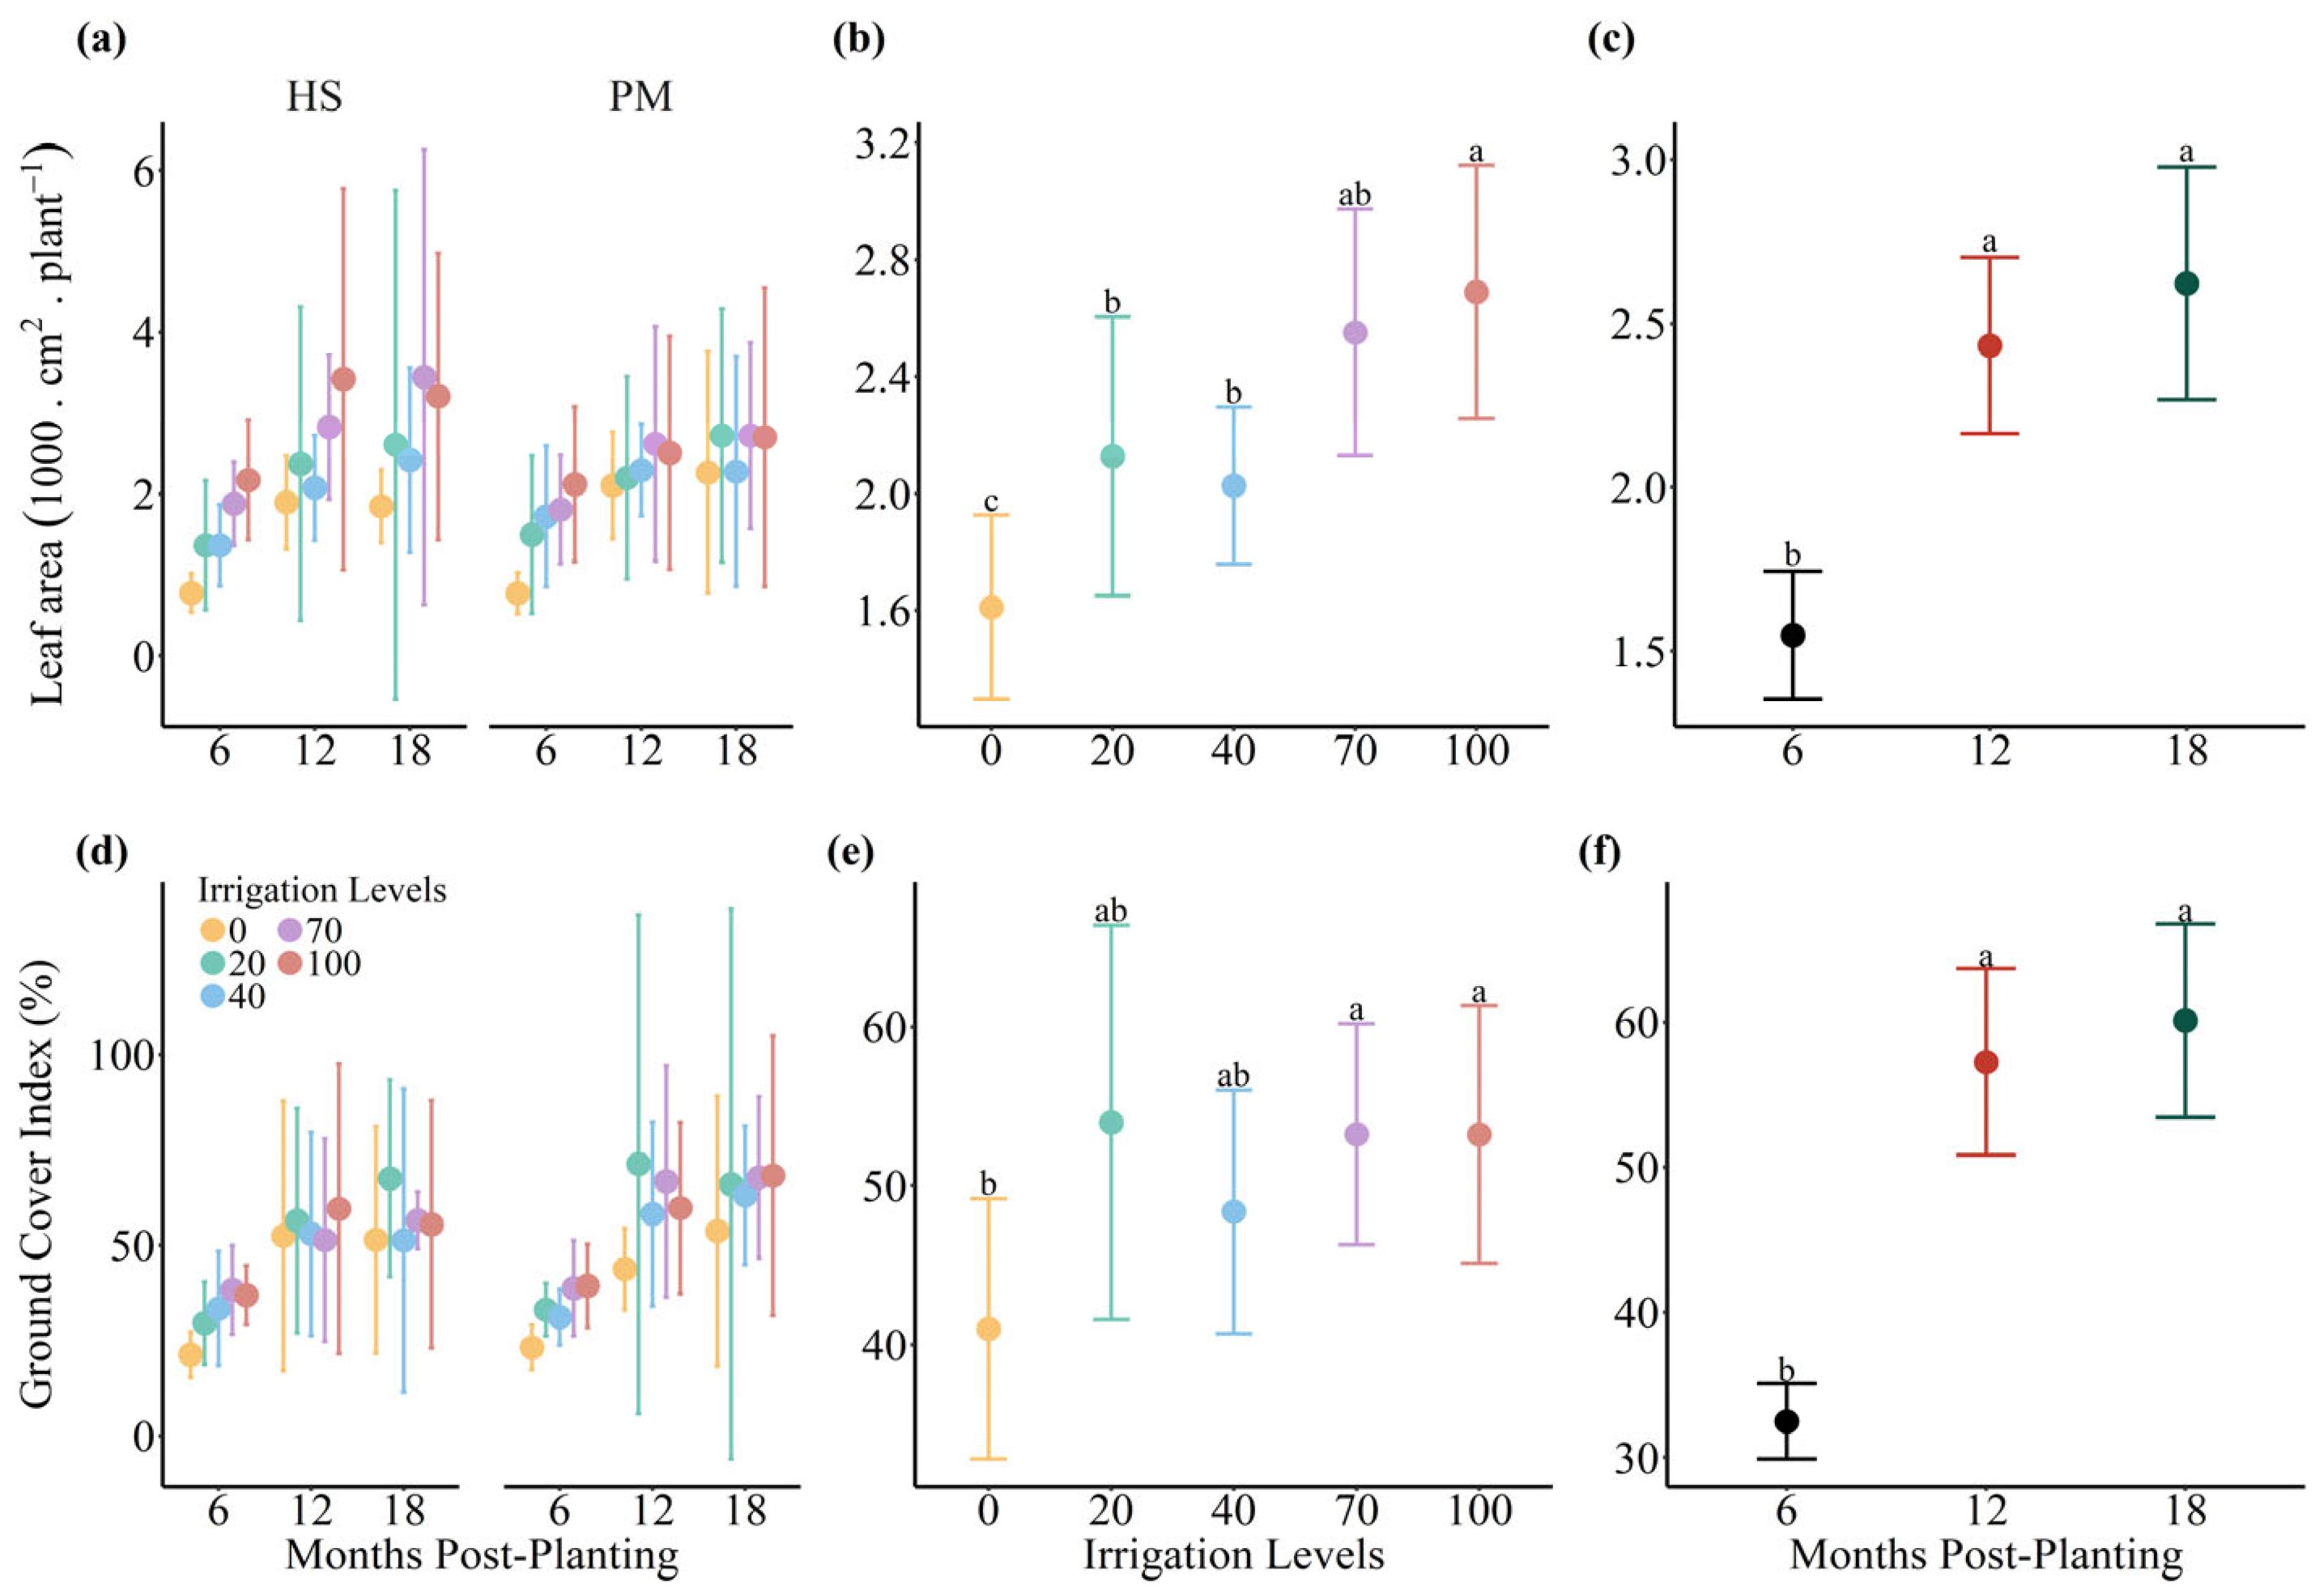
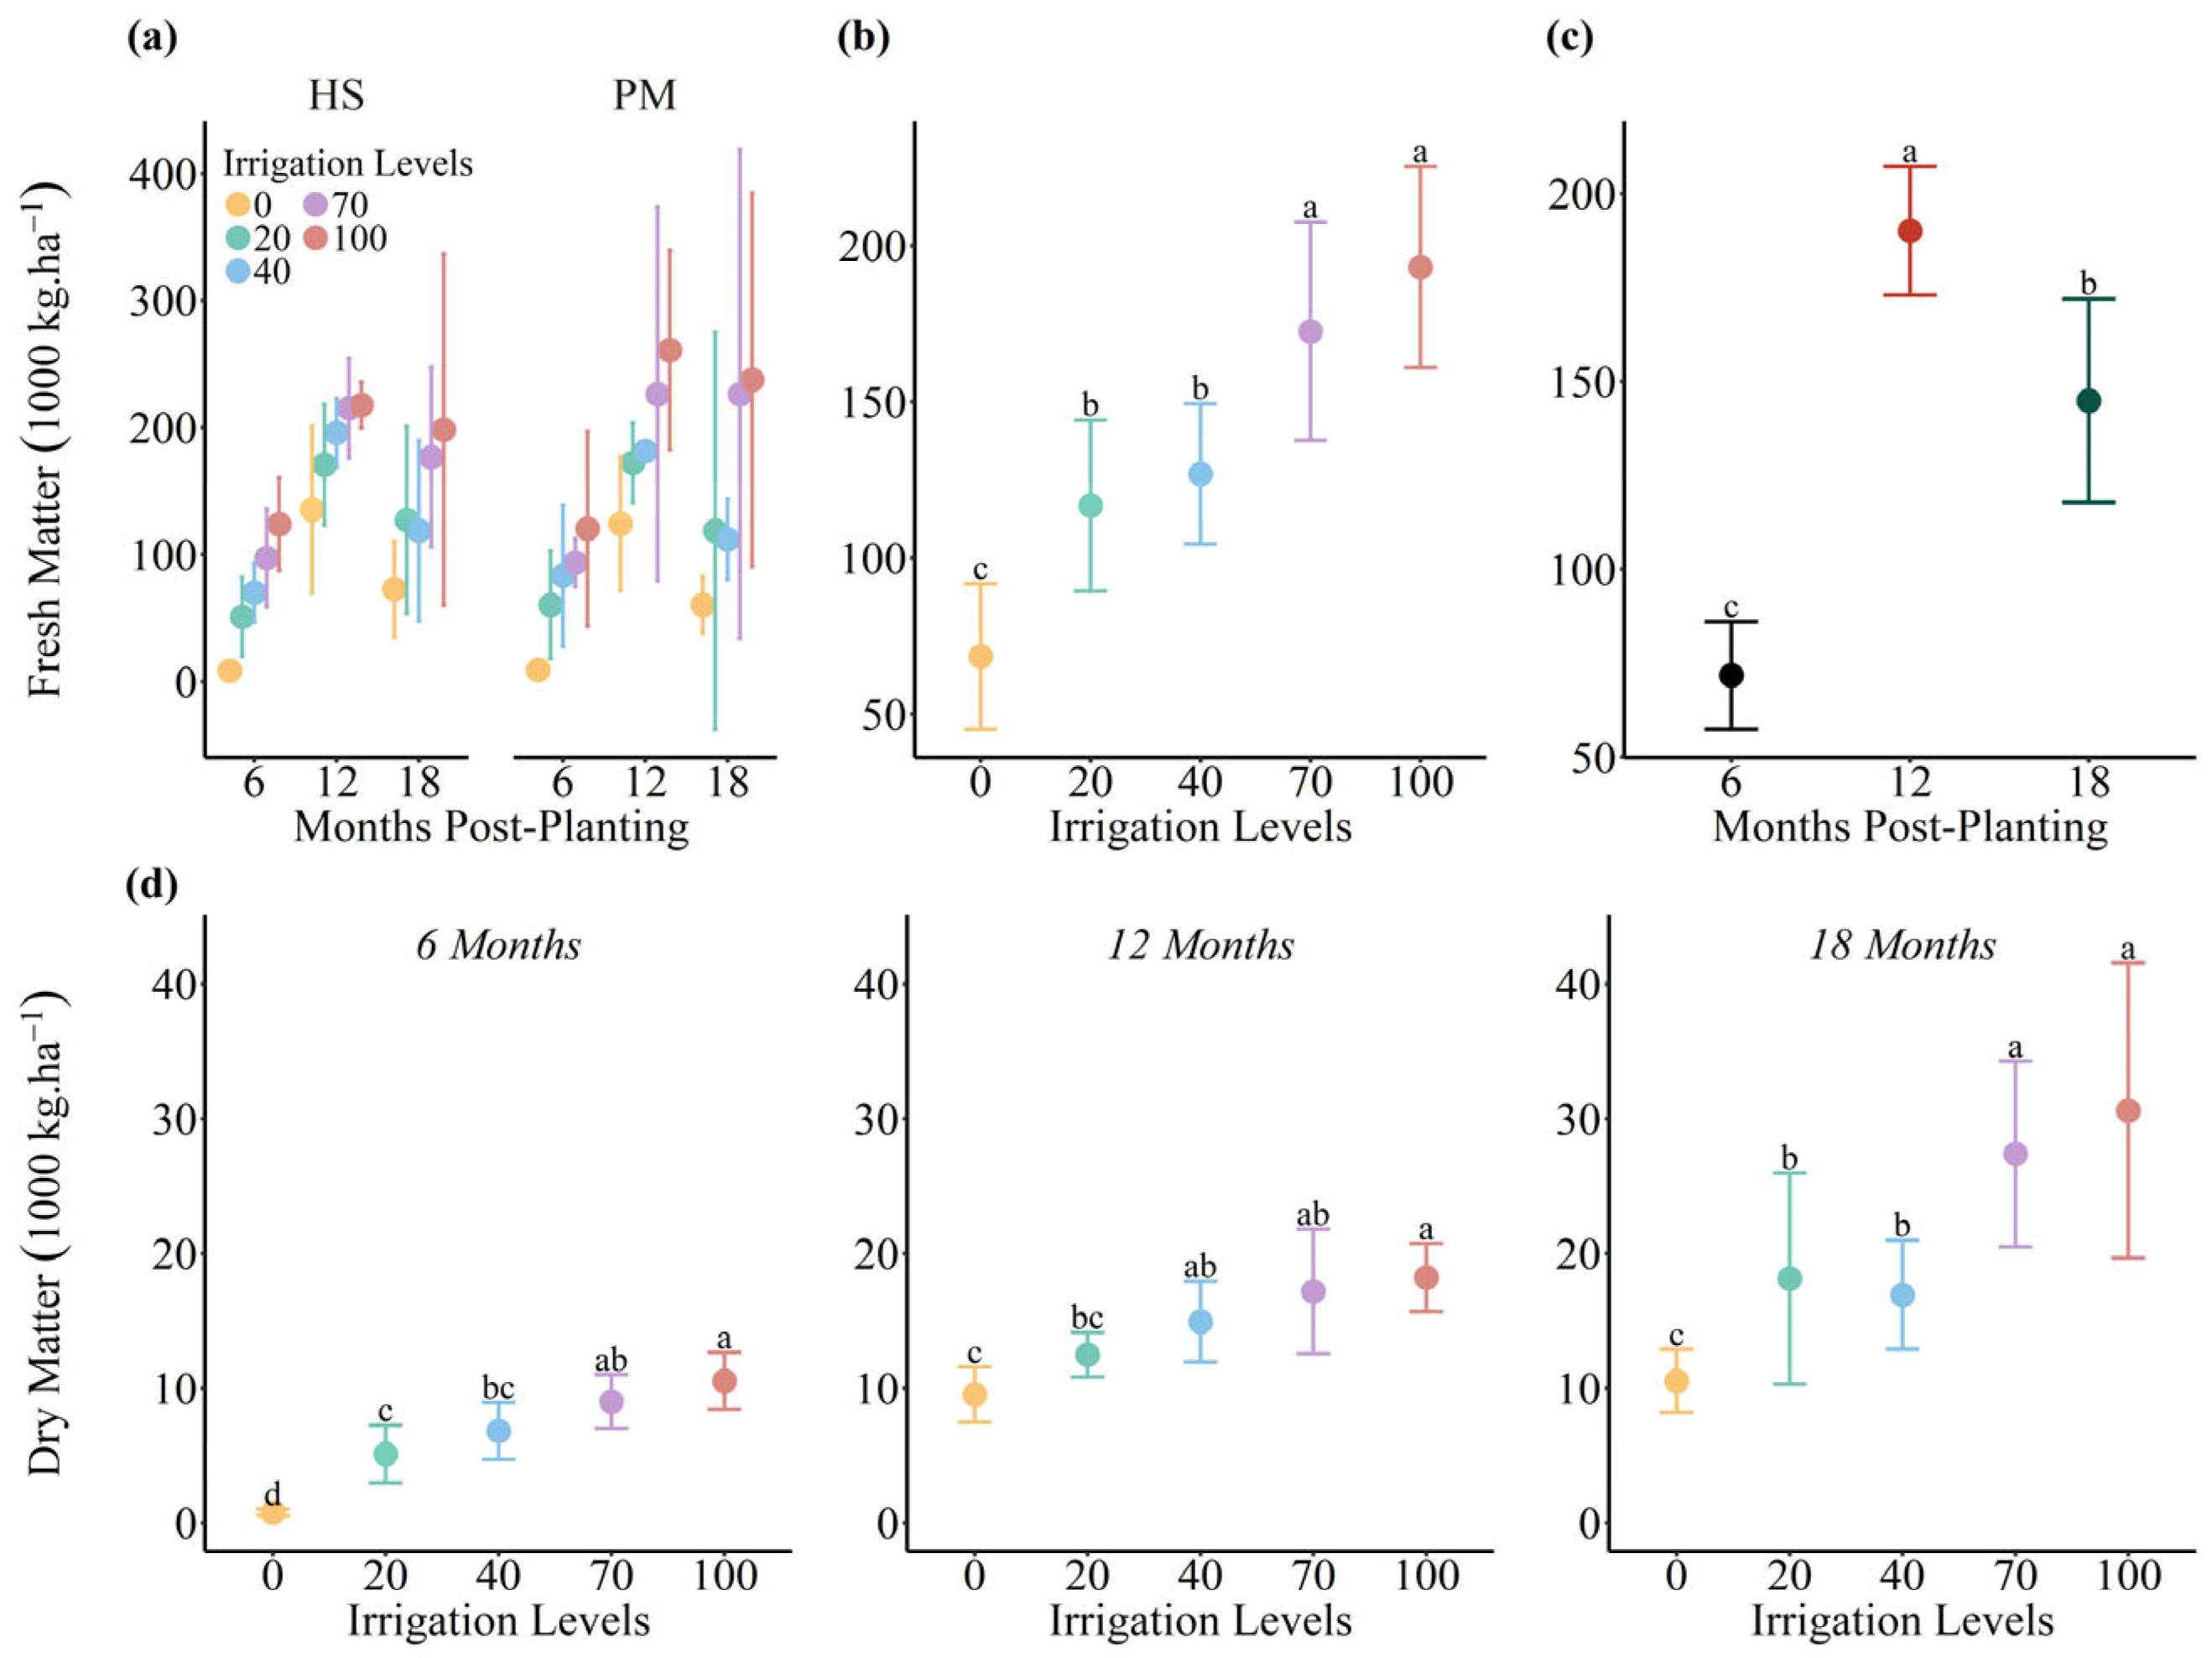
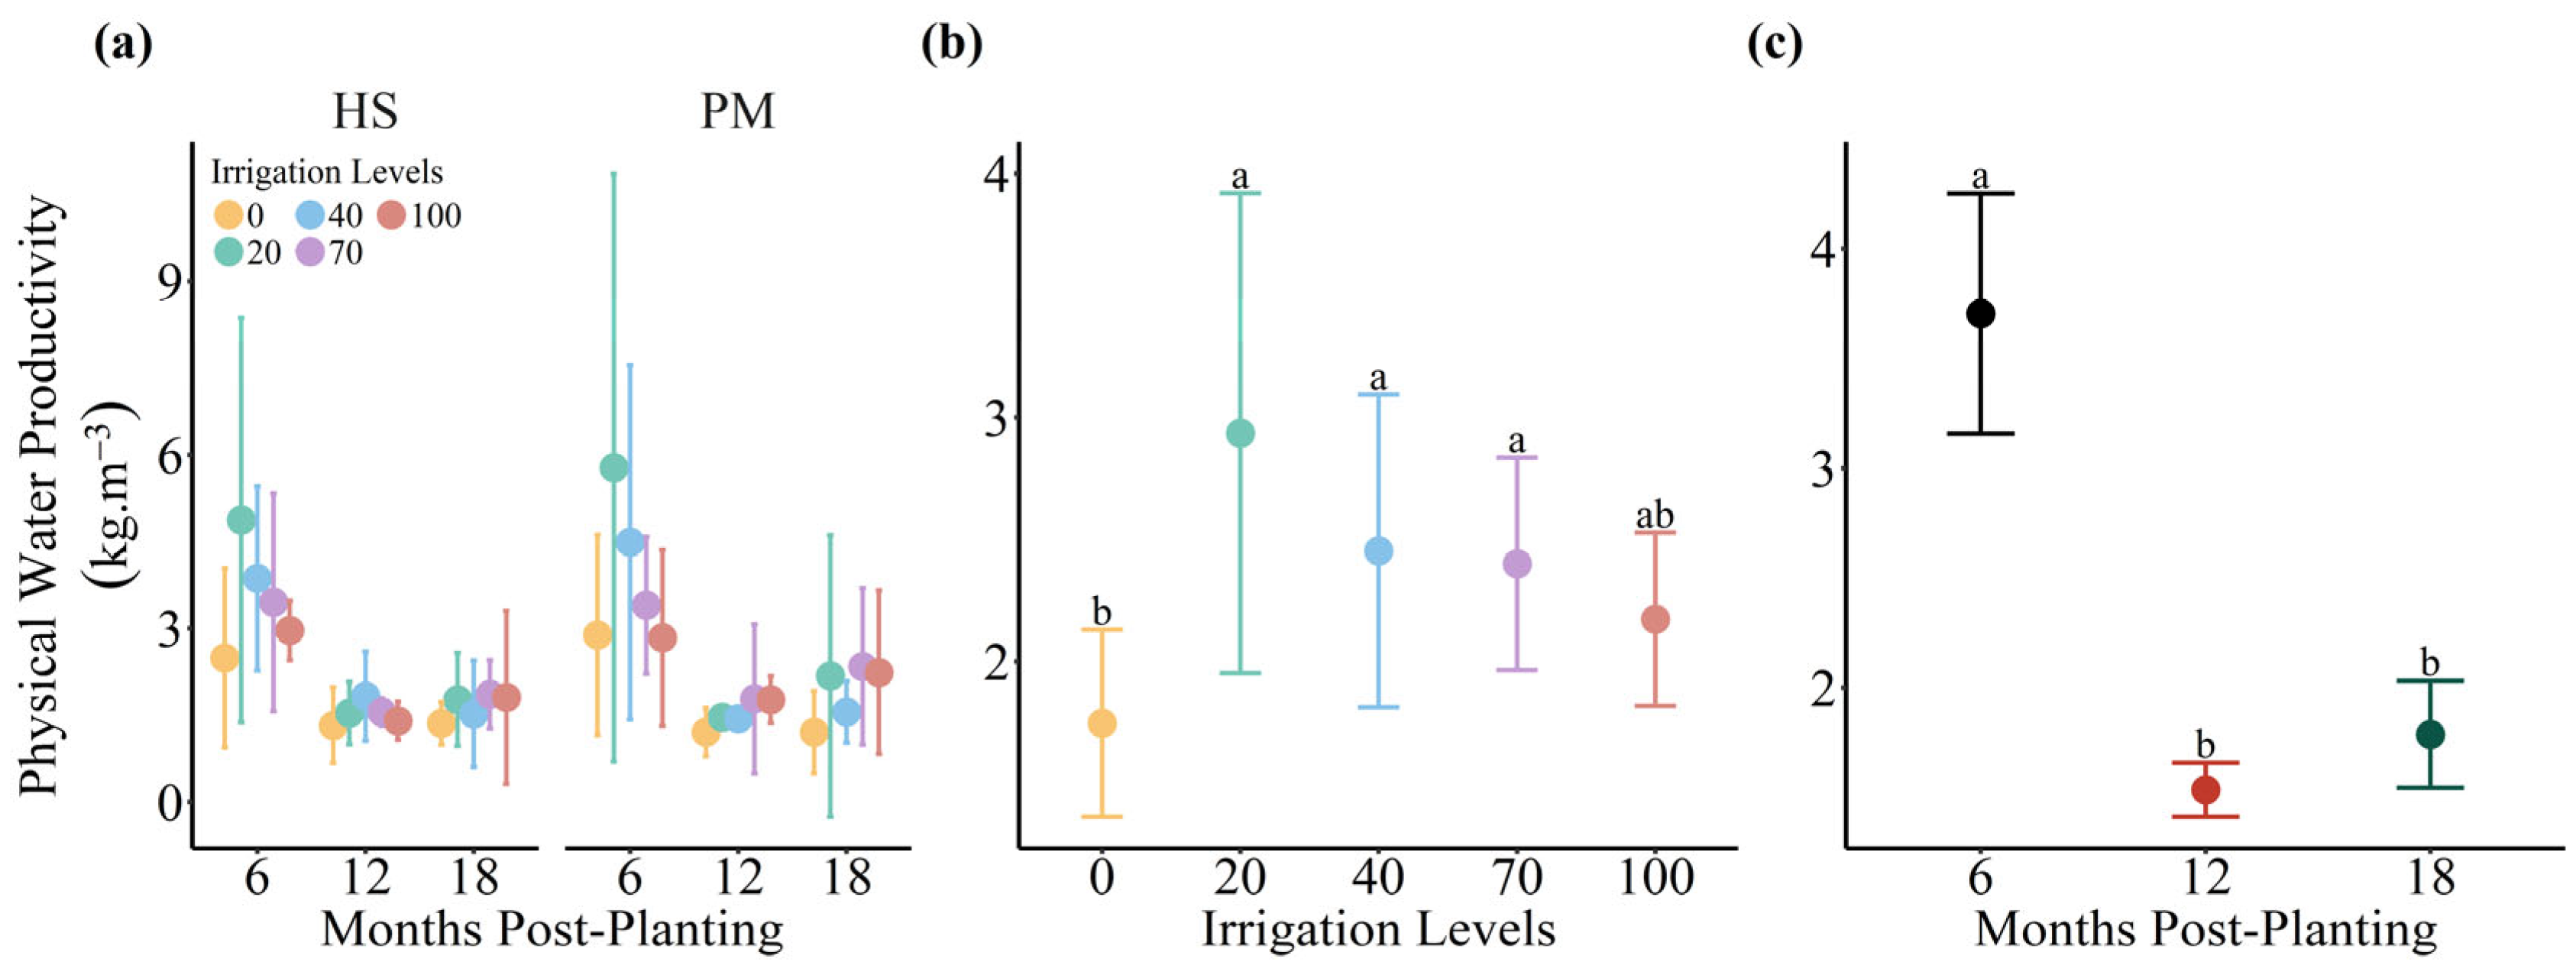
3.1. Crop Performance

There was no significant effect of the equations, either in isolation or in combination with irrigation levels, time, or their interaction, on the studied variables (p > 0.05) (Table 4). However, significant effects were observed for irrigation levels and time, both individually and in interaction, on all variables. This included an interaction effect between irrigation levels and time on cladode thickness, cladode volume per plant, dry matter productivity, and water use efficiency based on fresh matter.
The interaction between irrigation levels and time significantly influenced cladode thickness (Figure 3a). At the 12-month mark, no significant difference was observed among irrigation levels, resulting in an average thickness of 14.5 mm. However, at 6 and 18 months, distinct differences were noticeable among the irrigation levels, with the rainfed treatment showing the lowest thickness. At 6 months, the average cladode thickness was 2.4 mm for the 0% irrigation level and 8.1 mm for the 20% level. Interestingly, there was no significant difference among the 40%, 70%, and 100% levels, which showed averages of 11.2 mm, 359.1%, and 38.4% higher than the averages of the 0% and 20% levels, respectively. Moving to 18 months, the rainfed treatment exhibited a notably lower average thickness (6.5 mm), while no significant difference was noted between the 20% and 40% levels, which both averaged 9.0 mm. In contrast, the 70% and 100% levels differed significantly from each other and from the others, with averages of 11.9 mm and 15.3 mm, respectively.
In terms of the volume of cladodes per plant (Figure 3b), it is noteworthy that, at 12 months, there was no significant difference between the values found in the different irrigation levels, with an average of 3444 cm3 per plant. However, at 6 months, the averages in the 0% and 20% levels differ significantly from each other and from the others, showing the lowest values (194.4 and 1179 cm3 per plant, respectively). No difference was detected between the 40% and 70% levels (1828 cm3 per plant) nor between 70% and 100%, with an average of 2312 cm3 per plant. At 18 months, the volume of cladode per plant was not significantly different in the 0%, 20%, and 40% levels (1879 cm3 per plant), which differed from 70% and 100%, which featured an average of 4038 cm3 per plant.
The cladode leaf area per plant (LA/P) at 6 months (1549 cm2 per plant) was significantly lower than that observed at 12 and 18 months (average of 2528 cm2 per plant), while there was no difference between the latter two (Figure 4c). When comparing the levels, LA/P at the 0% level differed significantly from all other means, with an average value of 1611 cm2 per plant (Figure 4b). The average at the 100% level did not differ from that found at the 70% level, with a value of 2620 cm2 per plant, 62.6% higher than the average observed at the 0% level (Figure 4b). It is also noted that this variable did not differ between the 70%, 40%, and 20% levels, with an average of 2236 cm2 per plant, 38.8% higher than the average at the 0% level (Figure 4b).
For the soil cover index (ICS), no significant difference was found between the 12- and 18-month collection times, with an average value 80.6% higher than that observed at 6 months (Figure 4f). Considering the effect of irrigation levels, there was no statistical difference between the values observed at the 0%, 20%, and 40% levels, with an average of 47.8%. The 0% level differed only from 70% and 100% (Figure 4e). Additionally, there was no significant difference in the variable among the 20%, 40%, 70%, and 100% levels, with an average of 52.2% (Figure 4e).
Regarding fresh matter productivity (FMP), there was a statistical difference between the three collection times (Figure 5c), with the 12-month collection showing the highest average (190,041 kg ha−1), followed by the 18-month (144,887 kg ha−1) and 6-month (71,792 kg ha−1) sampling times. Productivity at 12 months was higher than that observed at 6 and 18 months by 164.7% and 31.2%, respectively.
Analyzing fresh matter productivity as a function of irrigation levels (Figure 5b), it was observed that, in rainfed cultivation, the lowest average was observed (68,497 kg ha−1), significantly different from the irrigated treatments. The result at the 20% level differed from that found at the 70% and 100% levels but did not differ from the 40% level, with an average of 121,829 kg ha−1, 77.9% higher than the productivity at 0% and 33.4% lower than the value found between the 70% and 100% levels, which did not differ and had an average of 182,856 kg ha−1. Finally, the average at the 40% level (126,901 kg ha−1) was significantly different from the averages at the 70% and 100% levels, being 85.3% higher than the average at the 0% level and 30.6% lower than the average at the 70% and 100% levels.
Dry matter productivity (DMP) increased across all evaluated periods with increasing water supply (Figure 5d). At 6 months, the average in rainfed cultivation was significantly lower than in irrigated plots, at 774.7 kg ha−1. In the 20% irrigation level, there was a significant difference compared to the 70% and 100% levels but not with the 40% level, resulting in an average of 5966 kg ha−1, which is 670.1% higher than the average at the 0% level. There was also no statistical difference between 40% and 70% as well as between 70% and 100%, with averages of 7913 and 9774 kg ha−1, respectively.
At 12 months, three aspects stand out: There was an absence of a statistical difference between the values found at the 0% and 20% levels, with an average of 11,000 kg ha−1, and in relation to the other levels, the result at the 0% level was significantly lower; the average at the 20% level differed only from the average at the 100% level, i.e., no difference between the 20%, 40%, and 70% levels, with an average of 14,874 kg ha−1; there was also no significant difference between the 40%, 70%, and 100% levels, with an average of 16,782 kg ha−1. At 18 months, DMP at the 0% level differed from the others, while there was no significant difference between the 20% and 40% levels (17,526 kg ha−1) nor between the 70% and 100% levels (29,000 kg ha−1).
Regarding the physical water productivity in terms of dry matter (PWP_DM), there was no significant difference between the collection times at 12 and 18 months, which differed from the value observed at 6 months, which had an average of 3.7 kg m−3, 117.6% higher than the average at 12 and 18 months (1.7 kg m−3) (Figure 6c). Among the irrigation levels (Figure 6b), it is observed that the average at the 0% level is significantly lower than the averages at the 20%, 40%, and 70% levels but does not differ from that found at the 100% level, with an average of 2.0 kg m−3. There is also no difference between the 20%, 40%, 70%, and 100% levels, with an average of 2.5 kg m−3, 47.1% higher than the average found only at the 0% level (1.7 kg m−3).

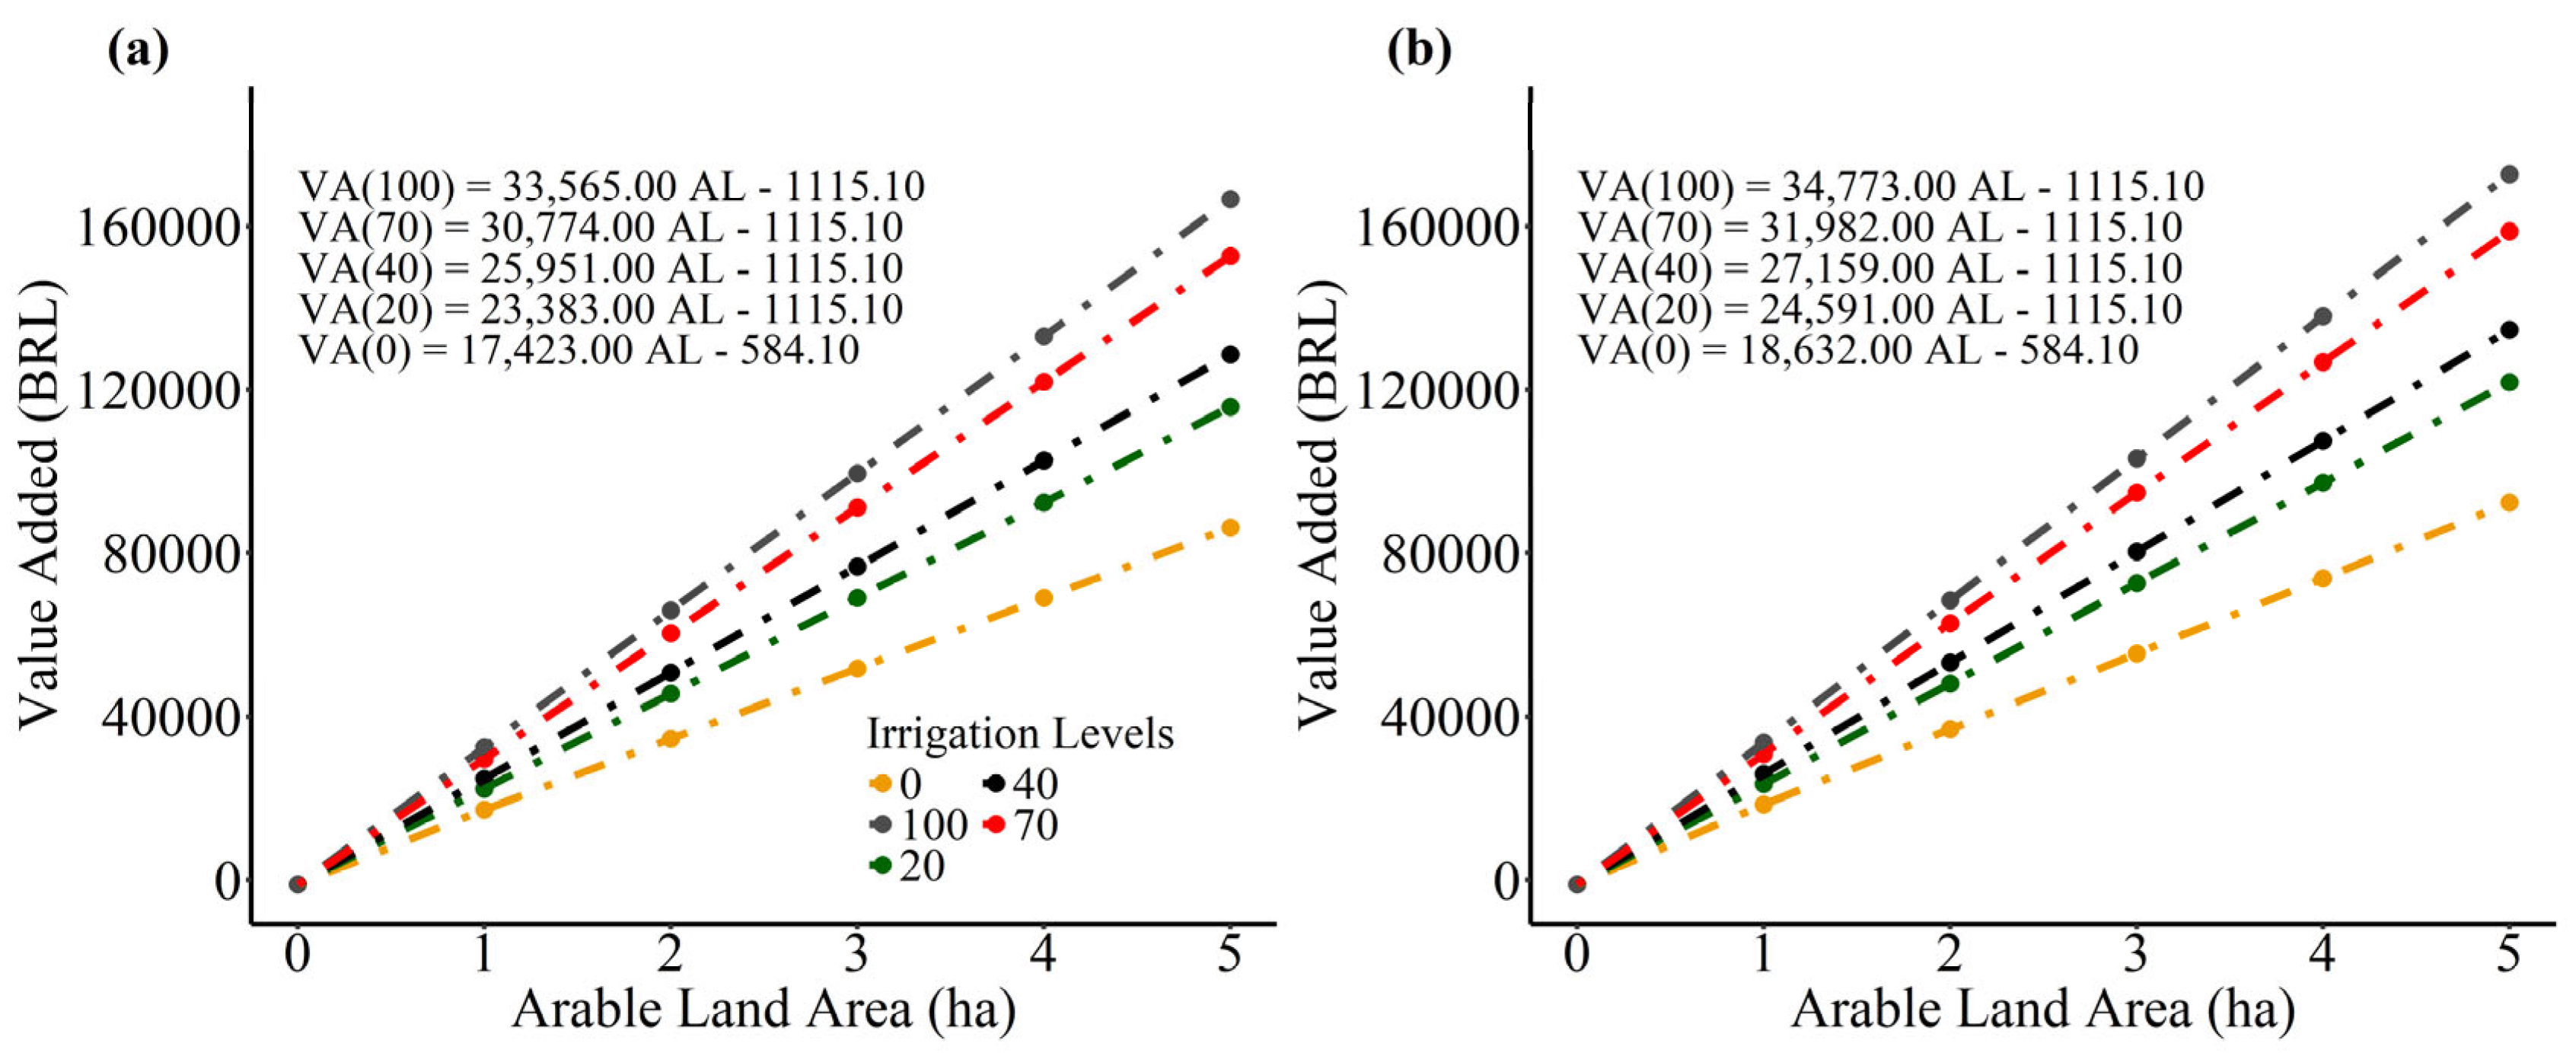
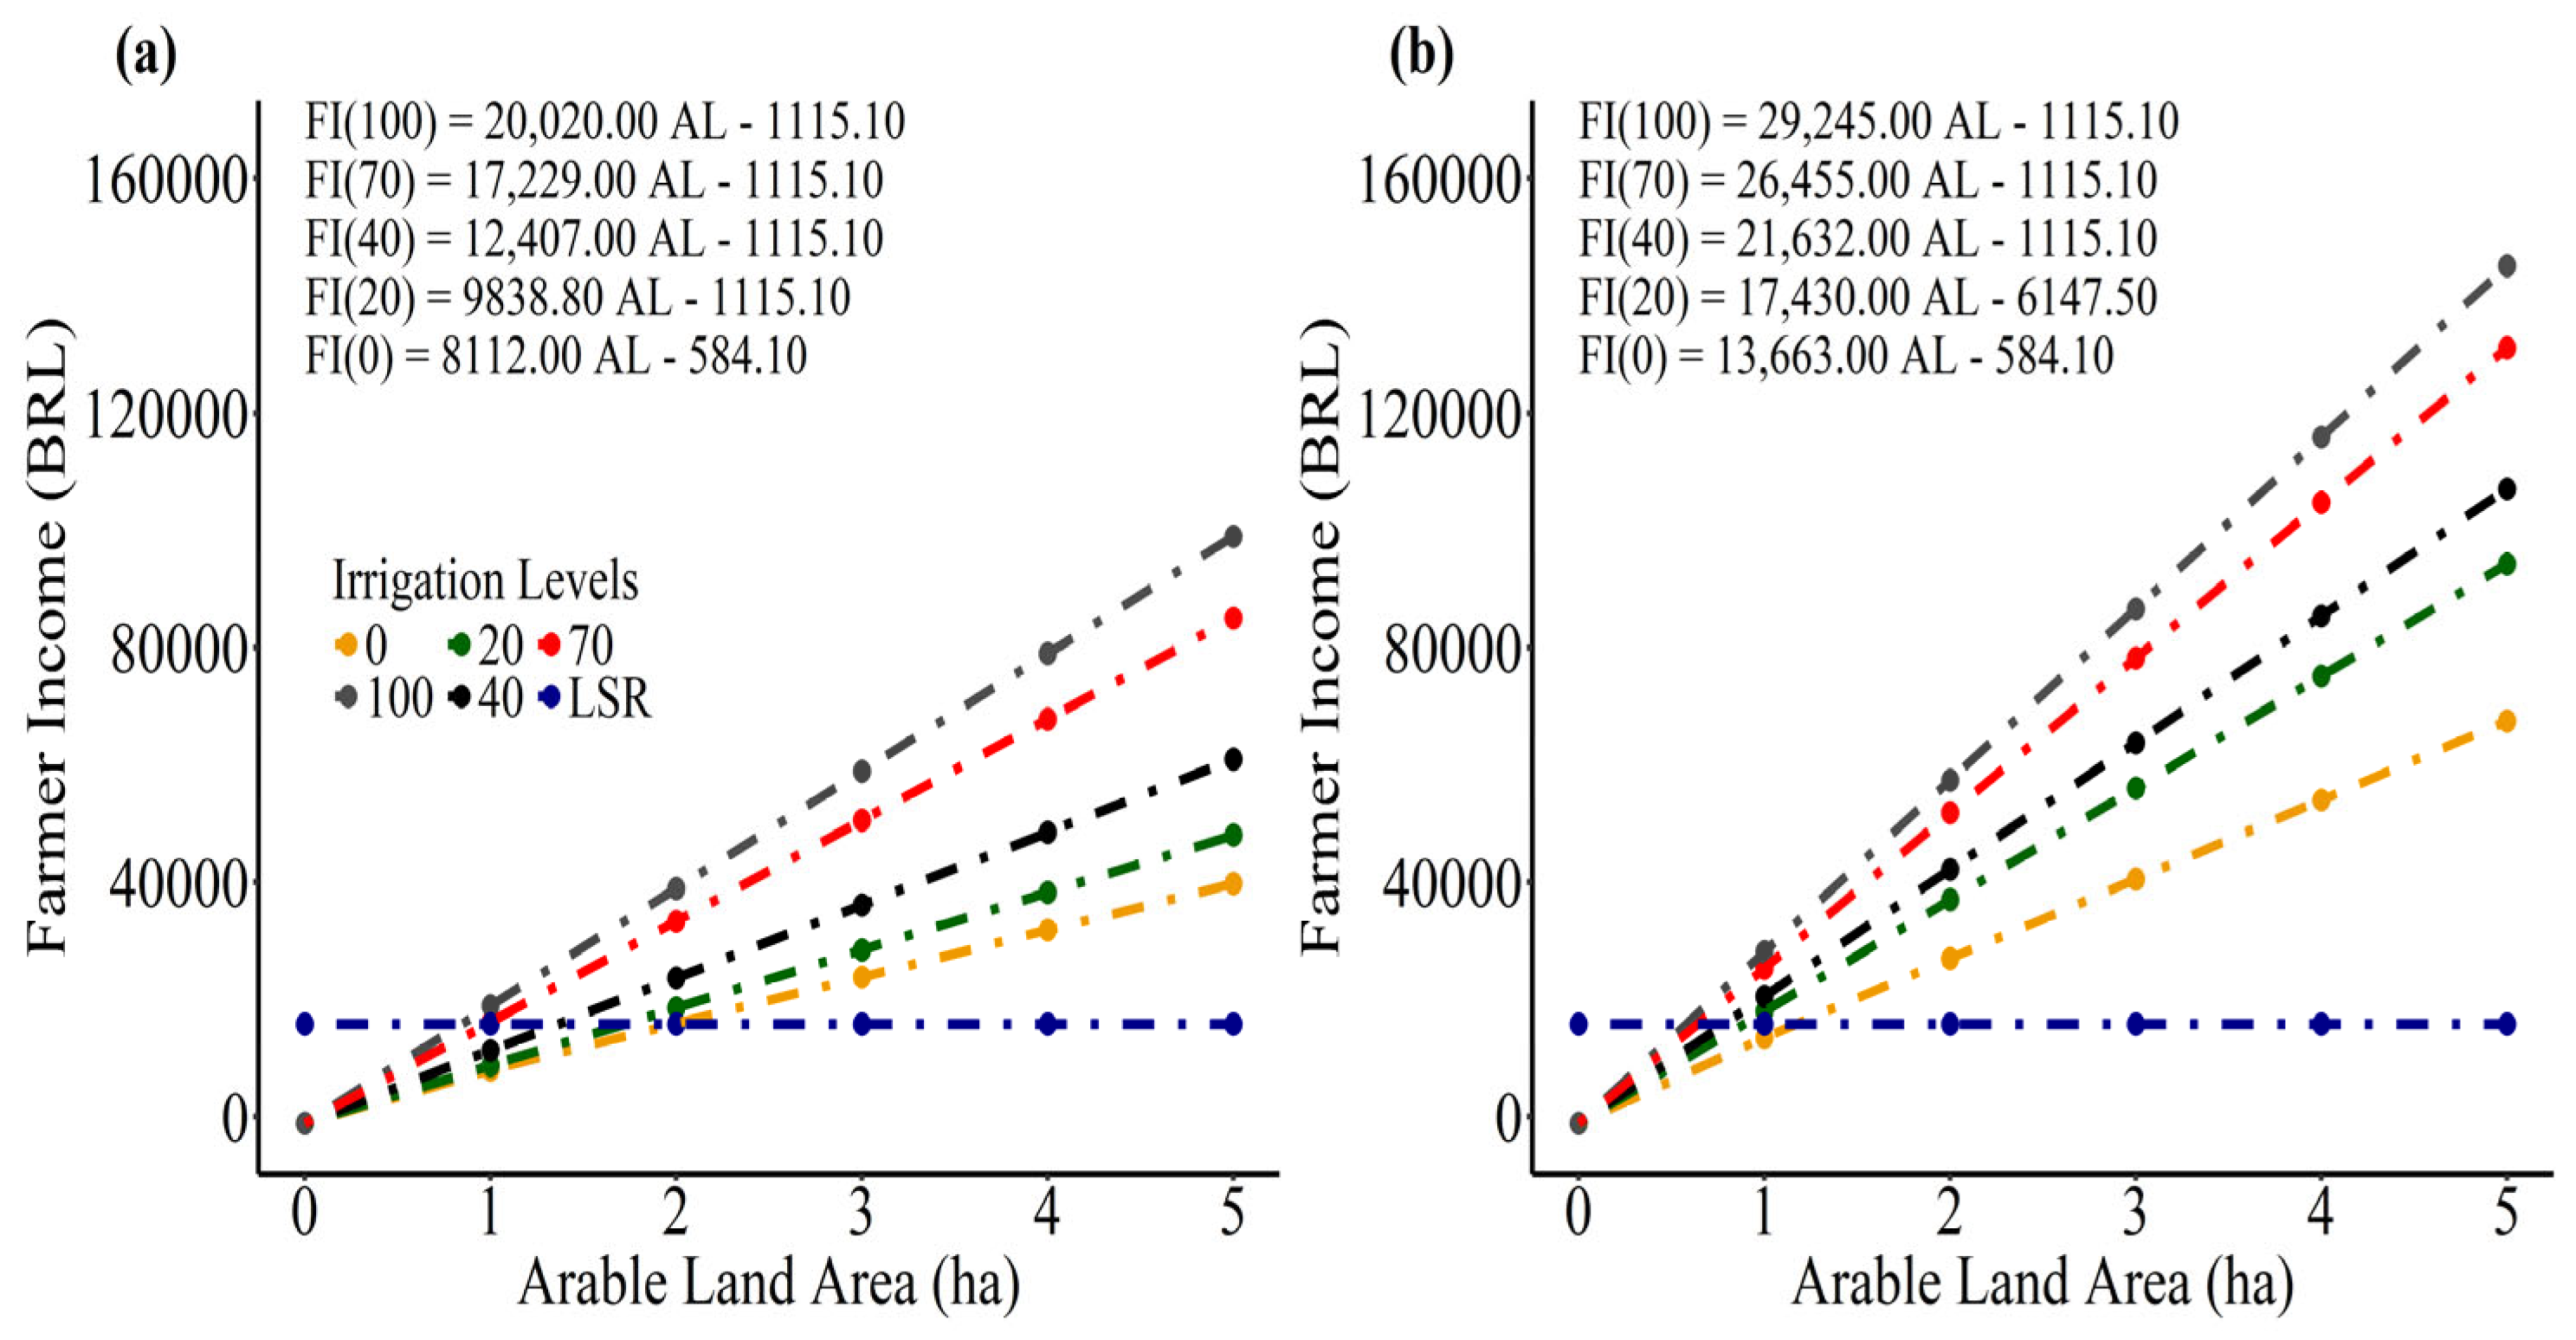
3.2. Economic Analysis

In terms of the economic analysis, at 12 months after the application of the irrigation treatments (first year) (Figure 7a), it is evident that the 70% and 100% levels exhibited the highest marginal contributions, consequently resulting in higher added values per hectare. There was only an 9.1% difference between the two levels in the analysis for five hectares. It is noteworthy that there is also a proximity of added values between the 20% and 40% levels, with only a 11.1% difference between the two in the analysis for five hectares. Additionally, the value at the 20% level is 34.% higher than the value observed at the 0% level. A similar percentage difference is observed regarding the estimated production 24 months after the start of the treatments (second year) (Figure 7b) but with higher added values due to the decrease in variable costs by not accounting for costs with cladode seeds in the second year of production. The difference in added value between the 70% and 100% levels on five hectares is 8.7%, while between the 20% and 40% levels on the same area, it is 10.5%. The added value at the 20% level is 31.9% higher than the value observed in the rainfed treatment.
Looking at the farmer’s income in the first year (Figure 8a), the level of social reproduction at irrigation levels of 100%, 70%, 40%, 20%, and 0% was achieved with 0.85, 1.0, 1.37, 1.75, and 2.0 hectares, respectively. In the second year (Figure 8b), this LRS was achieved with 0.6, 0.65, 0.8, 0.9, and 1.2 hectares, respectively.
The farmer’s income per hectare increased in the second year compared to the first year by 46.1%, 53.5%, 74.4%, 77.2%, and 68.4% for the 100%, 70%, 40%, 20%, and 0% levels, respectively. This increase was not due to higher productivity, as the same productivity as in the first year was assumed, but rather to reduced costs related to salaries and the absence of seed acquisition and planting in the second year.

4. Discussion

4.1. Crop Performance

The results obtained in this study show that irrigation with moderately brackish water is a good alternative for forage cactus production in the tropical semi-arid region, increasing the food supply for livestock. However, the responses of this crop are also impacted by the rainy season (January to June), which meets the crop’s demand even in drought years. For example, the lack of a difference in the irrigation depth treatments at 12 months, for both cladode thickness and volume, can be attributed to tissue hydration during the rainy season of 2022 (Figure 2b). Plants under rainfed conditions also showed a 451.4% increase in cladode thickness, while irrigated plants increased by an average of 42.9%, indicating a high rehydration capacity after a period of soil water scarcity [50,51].
The more limiting water condition at 6 and 18 months resulted in a better response to localized drip irrigation, representing an additional strategy for water absorption by the plants. In a previous study on the growth dynamics of cladodes in Opuntia ficus-indica under drought conditions [50], a reduction in soil water content during the day in two-year-old plants was observed, even with closed stomata and soil covered with aluminum foil in experimental pots. The mechanism of water absorption by roots is not solely driven by transpiration but may also be the result of delayed and gradual rehydration of cladode cells after nighttime transpiration, likely driven by the accumulation of osmotically active compounds [50,52]. In another research study [53] targeting soil water dynamics and evapotranspiration of forage cactus clones under dryland conditions, it was observed that the average soil cover index (SCI) increased during the rainy season (February to June, with 642 mm rainfall) and reached 32% for O. stricta, cv. Mexican-Giant, potentially contributing to an increased crop evapotranspiration rate. SCI is directly related to cladode area, which increased during this period. In our study, we obtained an average SCI of approximately 50%. This value helps to understand the result of physical water productivity (Figure 6b), since it depends on the volume of water evapotranspired by the crop. It is possible that the real evapotranspiration of the crop was higher at the highest irrigation levels, associated with the leaf area of the plants in these treatments (Figure 4b). This effect is also due to the high potential evapotranspiration and the irrigated surface limited by the effect of the location of the irrigation system [53,54]. In our study, the mean crop water demand (ETc) reached 2.89 and 3.21 mm day−1 when using the reference evapotranspiration estimated by the Hargreaves–Samani and Penman–Monteith equations, respectively. This 0.32 mm difference resulted in less water application to the plants managed using the Hargreave–Samani equation (Table 1). Since the HS equation relies solely on temperature and solar radiation data to estimate reference evapotranspiration, underestimation is expected under the research’s environmental conditions, as evapotranspiration is also influenced by relative humidity and wind speed [55,56]. However, irrigation management types based on reference evapotranspiration did not significantly differ for most variables of forage cactus, suggesting that any of the tested equations can be used. In addition, it is commonly recommended that farmers use the simplest and most cost-effective option, which in this case is the Hargreave–Samani equation.
The lower values obtained with the Hargreave–Samani equation can be partly attributed to the low relative humidity during the experimental period. In seasons with low relative humidity (<70%), the Hargreave–Samani equation tends to underestimate ET0. Lower humidity leads to higher evaporation rates due to the increased air vapor pressure deficit, which in turn raises the evapotranspiration demand [56,57]. The average relative humidity during the research period was 67.4%. Furthermore, the absence of the aerodynamic term, which is influenced by the various forms of advection, is another explanation for lower values of evapotranspiration in HS. The underestimation may have been mitigated by the absence of winds exceeding 4 m s−1, as wind speeds above this value tend to underestimate ET0 in the Hargreave–Samani equation [58,59]. In our study, the average wind speed was 1.44 m s−1, similar to other studies in semi-arid conditions [57,60].
Dry matter productivity increased over time (Figure 5d). This increases progressively with crop development, mainly due to the increase in the fibrous and lignin portion, resulting from the assimilation of carbon via the photosynthetic process and the decrease in water content [61]. According to previous reports [62], the application of an irrigation depth corresponding to 50% of ETc (499 mm year−1), with a frequency of seven days, resulted in the highest DM productivity (22,400 kg ha−1) after 12 months of treatment application in forage cactus, cv. Mexican-Giant. Under irrigation management via matric potential, an average dry biomass productivity of 25,322 kg ha−1 was obtained between potentials of −1.0 (94 mm year−1) and −0.2 (326 mm year−1) atm, adding to these irrigation depths an additional annual rainfall of 345 mm [31].
The fresh matter productivity at 70% and 100% depths at 12 months (Figure 5b,c) was similar to previously observed values [26], who also did not find significant effects of irrigation supply, with an equivalent average productivity of 194,000 kg ha−1 at 12 months. It was observed in semi-arid conditions in Mexico that irrigation above 30% of field capacity did not increase fresh matter production [30], and irrigation management via ET0 did not result in increased FM productivity when depths above 50% were applied [28]. As it is a perennial crop, most studies that have reported on forage cactus are also influenced by the local rainy season, which reduces the effects of irrigation on crop productivity.
The findings of our study suggest that crop yield can be maintained under deficit irrigation conditions. This is likely due not only to the crassulacean acid metabolism (CAM) mechanism but also to the morphological adaptations of the root system, cladodes, and trichomes along with the significant rainfall during their development. The root system of forage cactus is adept at rapidly absorbing water due to its predominantly horizontal and shallow distribution as well as its hydraulic strategy [63,64,65,66]. Studies on Opuntia ficus-indica (L.) and Opuntia robusta J.C.Wendl. have shown that 90% and 88% of their roots, respectively, are distributed within 2.5 m of the stem in the subsurface layer of soil at a depth of 15 cm, two years after planting, in South Africa’s semi-arid region [42], a pattern likely mirrored in O. stricta. Furthermore, the root–stem junction in the Opuntia species acts as a hydraulic safety valve, increasing water absorption and preventing loss by blocking water flow from the stem to the root under low soil water conditions, where root water potential may be lower than the stem’s potential filled with watery mucilage. Although the thickness of cortical cell layers varies with root diameter, Opuntia species exhibit minimal variation, with a regression line slope of 0.16, lower than that of other plant species [66]. This minor variation allows for water to quickly reach the xylem vessels from the root surface, as the hydraulic conductivity of the root is inversely related to the thickness of the cortical layer [67].
Another crucial aspect, particularly for plants grown in low soil moisture, is their ability to capture and transport condensed water via spines and trichomes, storing it in the mucilaginous stem [68,69,70]. In Opuntia microdasys (Lehm.) Pfeiff., a hydrophobic/hydrophilic layer exists at the trichome–stem contact region, facilitating the absorption of condensed water. It has been formerly described [70] that it takes a small water droplet 28 min to break the hydrophobic fraction of the layer and only 2 s to be absorbed by the mucilage-rich hydrophilic portion, eventually being stored in the stem. This mechanism plays a crucial role in the development of CAM plants, such as O. stricta.
On the other hand, increasing irrigation levels did not lead to a proportional increase in physical water productivity, which decreased over time (Figure 6c). This could be attributed to the fact that not all supplied water (irrigation and precipitation) is effectively utilized by the crop, although it is accounted for in the calculations. This is particularly evident when considering the impact of concentrated rainfall over a short period during the year. An analysis of fresh matter productivity at 12 and 18 months (Figure 5c) reveals a decrease in average productivity at 18 months, whereas the opposite is observed for dry matter productivity, albeit with higher water consumption (Figure 5d).
Water productivity results in forage cactus are variable in tropical semi-arid conditions, given different soil conditions, total rainfall plus irrigation, air temperature, harvesting time, and crop management. Ref. [71] obtained a value of 0.9 kg m−3 under rainfed cultivation conditions after 16 months of cultivation, a value 0.8 kg m−3 below the rainfed treatment in our study and almost three times lower than the average observed in irrigated treatments. On the other hand, [31] reported an average of 6.6 kg m−3, coming from total irrigation depths ranging from 50 to 326 mm year−1. The superior result obtained in this last study is probably explained by the lower precipitation than in our study. A third study, under the same environmental conditions as the previous ones, obtained an average of 2.58 kg m−3 after 12 months of treatment, with an irrigation depth of 50% of ETc [62], a result similar to that obtained in our study, in irrigated treatments.
The results of our study clearly indicate the significant impact of rainfall on the development and productivity of the crop as well as on water accumulation. This is particularly evident for higher values of fresh matter productivity, thickness, and volume of cladodes observed at 12 months compared to 18 months, with the percentage of stored water decreasing from 92.4% to 85% between these periods. The water volumes in the crop were 175,598 and 123,154 L ha−1, according to the fresh matter productivity, at 12 and 18 months, respectively, with a reduction of 52,444 L ha−1 at 18 months. Despite this reduction in water content, deficit irrigation during the dry season (70% of the TRI) would be the most recommended for the forage cactus, cv. Mexican-Giant, in areas of the tropical semi-arid region. The use of deficit irrigation results in positive responses in the growth and productivity of forage cactus, as also demonstrated in other studies [57,72,73].

4.2. Economic Analysis

The productivity increases between the irrigation and rainfed treatments clearly demonstrate the viability of investing in irrigation for forage cactus and the consequent increase in income generation. Considering the average fresh matter productivity of 243,622 kg ha−1 at 12 months, obtained between the 70 and 100% TRI levels, and its commercialization at a value of $0.15, the resulting gross income would be $36,543.30, 51% higher than the income obtained from rainfed cultivation, $18,652.50, resulting from a productivity of 124,350 kg ha−1. The estimated cost to establish one hectare of irrigated forage cactus, considering fixed costs, variables, and salaries paid, was $44,750.00. This proves that, in the first harvest cycle, 12 months after planting, approximately 82% of the investment could be recovered. The economic viability of producing irrigated forage cactus fruit through supplementary irrigation compared to total irrigation and rainfed cultivation was also confirmed for the Mexican semi-arid region, with net returns to the farmer increasing approximately 102% and 92% in plants of the “Cristalina” cultivar (Opuntia albicarpa Scheinvar) irrigated supplementally and totally, respectively, compared to non-irrigated plants. The labor productivity (number of hours invested to produce one ton of fruit) under supplementary and total irrigation conditions was equivalent to 90% of the productivity under rainfed conditions, indicating that less work hours are needed for supplementary irrigation to produce the same ton as in total irrigation and rainfed conditions [74].
The results of the added values and income in the first and, especially, in the second year demonstrate the potential of irrigation to ensure and expand the sustainability of small-scale farmers under water-limiting conditions, which is the reality of Brazilian family farming, especially in the semi-arid region. The level of social reproduction, both in the first and second year, was achieved in smaller areas when the crop was irrigated with moderately brackish water. This implies that the marginal contribution increased in relation to the area, and a smaller agricultural area will be necessary for each family farmer to receive sufficient income for their economical sustainability [75].

5. Conclusions

This study showed that managing irrigation based on reference evapotranspiration estimated by the Hargreave–Samani equation along with the corresponding crop evapotranspiration produced comparable results to using the Penman–Monteith equation. This approach achieved similar levels of productivity and economic efficiency while using less water. Dry matter productivity and income for farmers after 12 months of irrigation during the dry season, with depths ranging from 40 to 70% of the required irrigation, resulted in significantly higher yields compared to rainfed conditions. Notably, the 70% depth yielded the same results as the 100% depth. Furthermore, achieving the necessary social reproduction level with just 0.65 hectares in the second year supports the case for investing in deficit irrigation (at 70% capacity) for family farming. The positive economic outcomes, even on small landholdings, suggest that forage cactus cultivation is a viable option. It allows for the utilization of wells with brackish water in Brazil’s semi-arid regions, even those with low flow discharge, as long as the water does not exceed the salinity thresholds for this crop. This approach could contribute significantly to the sustainability of family farming in the semi-arid tropical region.

Author Contributions

Conceptualization, F.M.S.B., C.F.d.L., N.M. and F.B.L.; methodology, F.M.S.B., N.M., E.S.C., C.I.N.L. and J.R.d.S.S.; validation, F.M.S.B., C.F.d.L. and A.B.G.; formal analysis, F.M.S.B., C.F.d.L. and A.B.G.; investigation, F.M.S.B., N.M., E.S.C., C.I.N.L. and J.R.d.S.S.; resources, C.F.d.L., N.M. and S.C.R.V.L.; data curation, A.B.G.; writing—original draft preparation, F.M.S.B. and C.F.d.L.; writing—review and editing, F.M.S.B., C.F.d.L., A.B.G., F.B.L., S.C.R.V.L., N.M., G.P., G.G. and F.O.; visualization, A.B.G.; supervision, C.F.d.L.; project administration, C.F.d.L.; funding acquisition, C.F.d.L., N.M. and S.C.R.V.L. All authors have read and agreed to the published version of the manuscript.

Funding

This study was supported by the Autonomous Province of Trento (Italy) through the Brazil-Trentino Consortium in partnership with the Federal University of Ceará, We World GVC Brazil, Caritas Diocesan of Crateús, and Dom Fragoso Family Agricultural School as well as by the Coordination for the Improvement of Higher Education Personnel (CAPES, Finance Code 001).

Data Availability Statement

Data are contained within the article.

Acknowledgments

The authors thank the Coordination for the Improvement of Higher Education Personnel (CAPES) for granting scholarships to the students and the Autonomous Province of Trento (Italy) for funding the research. Acknowledgments are also due to the Agriculture Chief Scientist Program of the Ceará State Government (SDE/ADECE/FUNCAP) and to INCTAgriS (CNPq/FUNCAP/CAPES).

Conflicts of Interest

The authors declare no conflicts of interest.

References

  1. Sequeira, T.N.; Santos, M.S.; Magalhães, M. Climate Change and Economic Growth: A Heterogeneous Panel Data Approach. Environ. Sci. Pollut. Res. 2018, 25, 22725–22735. [Google Scholar] [CrossRef]
  2. Stocker, T.F.; Qin, D.; Plattner, G.K.; Tignor, M.; Allen, S.K. Contribution of Working Group I to the Fifth Assessment Report of the Intergovernmental Panel on Climate Change; Intergovernmental panel on climate change, 2013: The Physical Science Basis; Cambridge University Press: New York, NY, USA, 2013; p. 1535. Available online: https://scholar.google.com/scholar_lookup?title=Intergovernmental+panel+on+climate+change&author=TF+Stocker&publication_year=2013 (accessed on 28 June 2024).
  3. Melero-Meraz, V.; Zegbe, J.A.; Herrera, M.D.; Guzmán-Maldonado, S.H.; Medina-García, G.; Sánchez-Toledano, B.I.; Cruz-Bravo, R.K.; Servín-Palestina, M. On-Farm Supplemental Irrigation of ‘Roja Lisa’ Cactus Pear: Pre- and Postharvest Effects. Horticulturae 2022, 8, 483. [Google Scholar] [CrossRef]
  4. Nhemachena, C.; Nhamo, L.; Matchaya, G.; Nhemachena, C.R.; Muchara, B.; Karuaihe, S.T.; Mpandeli, S. Climate Change Impacts on Water and Agriculture Sectors in Southern Africa: Threats and Opportunities for Sustainable Development. Water 2020, 12, 2673. [Google Scholar] [CrossRef]
  5. Pereira, L.S. Water and Agriculture: Facing Water Scarcity and Environmental Challenges. Agric. Eng. Int. CIGR J. 2005, 7, 26. [Google Scholar]
  6. Kisi, O.; Alizamir, M. Modelling Reference Evapotranspiration Using a New Wavelet Conjunction Heuristic Method: Wavelet Extreme Learning Machine vs Wavelet Neural Networks. Agric. For. Meteorol. 2018, 263, 41–48. [Google Scholar] [CrossRef]
  7. Flores-Velazquez, J.; Akrami, M.; Villagrán, E. The Role of Radiation in the Modelling of Crop Evapotranspiration from Open Field to Indoor Crops. Agronomy 2022, 12, 2593. [Google Scholar] [CrossRef]
  8. Xiang, K.; Li, Y.; Horton, R.; Feng, H. Similarity and Difference of Potential Evapotranspiration and Reference Crop Evapotranspiration—A Review. Agric. Water Manag. 2020, 232, 106043. [Google Scholar] [CrossRef]
  9. Rodrigues, G.C.; Braga, R.P. A Simple Application for Computing Reference Evapotranspiration with Various Levels of Data Availability—ETo Tool. Agronomy 2021, 11, 2203. [Google Scholar] [CrossRef]
  10. Allen, R.G.; Pereira, L.S.; Raes, D.; Smith, M. Crop Evapotranspiration-Guidelines for Computing Crop Water Requirements-FAO Irrigation and Drainage Paper 56. Fao Rome 1998, 300, D05109. [Google Scholar]
  11. Ahmadi, S.H.; Javanbakht, Z. Assessing the Physical and Empirical Reference Evapotranspiration (ETo) Models and Time Series Analyses of the Influencing Weather Variables on ETo in a Semi-Arid Area. J. Environ. Manag. 2020, 276, 111278. [Google Scholar] [CrossRef]
  12. Tigkas, D.; Vangelis, H.; Tsakiris, G. Implementing Crop Evapotranspiration in RDI for Farm-Level Drought Evaluation and Adaptation under Climate Change Conditions. Water Resour. Manag. 2020, 34, 4329–4343. [Google Scholar] [CrossRef]
  13. Derakhshandeh, M.; Tombul, M. Calibration of Metric Modeling for Evapotranspiration Estimation Using Landsat 8 Imagery Data. Water Resour. Manag. 2022, 36, 315–339. [Google Scholar] [CrossRef]
  14. Trajkovic, S. Temperature-Based Approaches for Estimating Reference Evapotranspiration. J. Irrig. Drain Eng. 2005, 131, 316–323. [Google Scholar] [CrossRef]
  15. Allen, R.G.; Pruitt, W.O.; Wright, J.L.; Howell, T.A.; Ventura, F.; Snyder, R.; Itenfisu, D.; Steduto, P.; Berengena, J.; Yrisarry, J.B.; et al. A Recommendation on Standardized Surface Resistance for Hourly Calculation of Reference ETo by the FAO56 Penman-Monteith Method. Agric. Water Manag. 2006, 81, 1–22. [Google Scholar] [CrossRef]
  16. Adeboye, O.B.; Osunbitan, J.A.; Adekalu, K.O.; Okunade, D.A. Evaluation of FAO-56 Penman-Monteith and Temperature Based Models in Estimating Reference Evapotranspiration Using Complete and Limited Data, Application to Nigeria. Agric. Eng. Int. CIGR J. 2009, 11, 25. [Google Scholar]
  17. Sentelhas, P.C.; Gillespie, T.J.; Santos, E.A. Evaluation of FAO Penman–Monteith and Alternative Methods for Estimating Reference Evapotranspiration with Missing Data in Southern Ontario, Canada. Agric. Water Manag. 2010, 97, 635–644. [Google Scholar] [CrossRef]
  18. Yong, S.L.S.; Ng, J.L.; Huang, Y.F.; Ang, C.K. Estimation of Reference Crop Evapotranspiration with Three Different Machine Learning Models and Limited Meteorological Variables. Agronomy 2023, 13, 1048. [Google Scholar] [CrossRef]
  19. Michelon, N.; Pennisi, G.; Myint, N.O.; Orsini, F.; Gianquinto, G. Strategies for Improved Water Use Efficiency (WUE) of Field-Grown Lettuce (Lactuca sativa L.) under a Semi-Arid Climate. Agronomy 2020, 10, 668. [Google Scholar] [CrossRef]
  20. Rodrigues, G.C.; Braga, R.P. Estimation of Daily Reference Evapotranspiration from NASA POWER Reanalysis Products in a Hot Summer Mediterranean Climate. Agronomy 2021, 11, 2077. [Google Scholar] [CrossRef]
  21. Ling, Z.; Shi, Z.; Xia, T.; Gu, S.; Liang, J.; Xu, C.-Y. Short-Term Evapotranspiration Forecasting of Rubber (Hevea brasiliensis) Plantations in Xishuangbanna, Southwest China. Agronomy 2023, 13, 1013. [Google Scholar] [CrossRef]
  22. Frizzone, J.A.; Lima, S.C.R.V.; Lacerda, C.F.; Mateos, L. Socio-Economic Indexes for Water Use in Irrigation in a Representative Basin of the Tropical Semiarid Region. Water 2021, 13, 2643. [Google Scholar] [CrossRef]
  23. Júnior, J.D.; Filho, J.A.; Santos, M.; Lira, M.; Santos, D.; Pessoa, R. Adubação Mineral No Crescimento e Composição Mineral Da Palma Forrageira-Clone IPA-201. Rev. Bras. De Ciências Agrárias 2010, 5, 129–135. [Google Scholar] [CrossRef]
  24. Ramos, J.P.D.F.; Leite, M.L.D.M.V.; Junior, S.D.O.; do Nascimento, J.P.; Santos, E.M. Crescimento Vegetativo de Opuntia ficus-indica Em Diferentes Espaçamentos de Plantio. Rev. Caatinga 2011, 24, 41–48. [Google Scholar]
  25. Kumar, S.; Louhaichi, M.; Dana Ram, P.; Tirumala, K.K.; Ahmad, S.; Rai, A.K.; Sarker, A.; Hassan, S.; Liguori, G.; Probir Kumar, G.; et al. Cactus Pear (Opuntia ficus-indica) Productivity, Proximal Composition and Soil Parameters as Affected by Planting Time and Agronomic Management in a Semi-Arid Region of India. Agronomy 2021, 11, 1647. [Google Scholar] [CrossRef]
  26. Alves, H.K.M.N.; Silva, T.G.F.D.; Jardim, A.M.D.R.F.; De Souza, L.S.B.; Araújo Júnior, G.D.N.; De Souza, C.A.A.; De Moura, M.S.B.; De Araújo, G.G.L.; Campos, F.S.; Da Cruz Neto, J.F. The Use of Mulch in Cultivating the Forage Cactus Optimizes Yield in Less Time and Increases the Water Use Efficiency of the Crop. Irrig. Drain. 2023, 72, 75–89. [Google Scholar] [CrossRef]
  27. Pereira, M.C.D.A.; de Azevedo, C.A.V.; Neto, J.D.; Pereira, M.d.O.; Ramos, J.G.; Nunes, K.G.; Lyra, G.B.; Saboya, L.M.F. Production of Forage Palm Cultivars (Orelha de Elefante Mexicana, IPA-Sertânia and Miúda) under Different Salinity Levels in Irrigation Water. Aust. J. Crop Sci. 2021, 15, 977–982. [Google Scholar] [CrossRef]
  28. Castro, I.N.D.; Santos, S.R.D.; Kondo, M.K.; Maia, V.M.; Santos, C.C.R.D. Agronomic performance and water use efficiency of irrigated Cactus Pear cultivars. Rev. Caatinga 2020, 33, 529–540. [Google Scholar] [CrossRef]
  29. Cruz Neto, J.F.D.; Morais, J.E.F.D.; Souza, C.A.A.D.; Carvalho, H.F.D.S.; Rodrigues, C.T.A.; Silva, T.G.F.D. Aplicabilidade de Indicadores Agrometeorológicos Para Análise Do Incremento de Água Por Irrigação Em Sistemas de Produção Da Palma Forrageira, Cv. Miúda. J. Env. Anal. Progr. 2017, 2, 98–106. [Google Scholar] [CrossRef]
  30. Flores-Hernández, A.; Orona-Castillo, I.; Murillo-Amador, B.; Garcia-Hernandez, J.L.; Troyo-Dieguez, E. Yield and Physiological Traits of Prickly Pear Cactus ‘Nopal’ (Opuntia Spp.) Cultivars under Drip Irrigation. Agric. Water Manag. 2004, 70, 97–107. [Google Scholar] [CrossRef]
  31. Freitas Campos, A.R.; Pereira Da Silva, A.J.; De Jong Van Lier, Q.; Lima Do Nascimento, F.A.; Miranda Fernandes, R.D.; Nunes De Almeida, J.; Pedro Da Silva Paz, V. Yield and Morphology of Forage Cactus Cultivars under Drip Irrigation Management Based on Soil Water Matric Potential Thresholds. J. Arid. Environ. 2021, 193, 104564. [Google Scholar] [CrossRef]
  32. Queiroz, M.G.D.; Silva, T.G.F.D.; Zolnier, S.; Silva, S.M.S.E.; Lima, L.R.; Alves, J.D.O. Características Morfofisiológicas e Produtividade Da Palma Forrageira Em Diferentes Lâminas de Irrigação. Rev. Bras. Eng. Agricola E Ambient. 2015, 19, 931–938. [Google Scholar] [CrossRef]
  33. de Araujo, G.G.; Silva, T.G.; Campos, F.S.; Silva, T.G.F.; Uast, S.T.P.; Fleming, S.C. Agricultura Biossalina e Uso de Águas Salobras Na Produção de Forragem. 2021. In Agricultura Irrigada em Ambientes Salinos; Cerqueira, P.R.S., Lacerda, C.F., Araujo, G.L., Gheyi, H.R., Simões, W.L., Eds.; Companhia de Desenvolvimento dos Vales do São Francisco e Parnaíba: Brasília, Brazil, 2021; p. 363. [Google Scholar]
  34. Dantas, F.D.G.; dos Santos, M.V.F.; Lima, G.F.d.C.; Coêlho, J.J.; de Medeiros, J.F.; da Cunha, M.V. Drip Irrigation with Saline Water Combined with Mulch Cover as Strategies for Forage Cactus Production in Semi-Arid Zones. Irrig. Sci. 2023, 41, 295–308. [Google Scholar] [CrossRef]
  35. Fonseca, V.A.; Santos, M.R.D.; Silva, J.A.D.; Donato, S.L.R.; Santos Rodrigues, C.; Brito, C.F.B. Morpho-Physiology, Yield, and Water-Use Efficiency of Opuntia ficus-indica Irrigated with Saline Water. Acta Sci. Agron. 2019, 41, 42631. [Google Scholar] [CrossRef]
  36. Lessa, C.I.N.; De Lacerda, C.F.; Cajazeiras, C.C.D.A.; Neves, A.L.R.; Lopes, F.B.; Silva, A.O.D.; Sousa, H.C.; Gheyi, H.R.; Nogueira, R.D.S.; Lima, S.C.R.V.; et al. Potential of Brackish Groundwater for Different Biosaline Agriculture Systems in the Brazilian Semi-Arid Region. Agriculture 2023, 13, 550. [Google Scholar] [CrossRef]
  37. Koppen, W. Das Geographische System de Klimate. In Handbuch der Klimatologie; Gebrüder Borntraeger: Berlin, Germany, 1936; p. 44. [Google Scholar]
  38. Alvares, C.A.; Stape, J.L.; Sentelhas, P.C.; De Moraes Gonçalves, J.L.; Sparovek, G. Köppen’s Climate Classification Map for Brazil. Meteorol. Z. 2013, 22, 711–728. [Google Scholar] [CrossRef]
  39. Saraiva, F.M. Desenvolvimento e Acúmulo de Nutrientes de Palma Forrageira (Nopalea) em Diferentes Sistemas de Cultivo. Master’s Thesis, Universidade Federal Rural de Pernambuco, Recife, Brazil, 2014; p. 104. [Google Scholar]
  40. Salassier, B.; Soares, A.A.; Mantovani, E.C. Manual de Irrigação; Universidade Federal de Viçosa: Viçosa, Brazil, 2006. [Google Scholar]
  41. Reichardt, K.; Timm, L.C. Solo, Planta e Atmosfera: Conceitos, Processos e Aplicações; Manole: Barueri, Brazil, 2004. [Google Scholar]
  42. Snyman, H.A. Root Distribution with Changes in Distance and Depth of Two-Year-Old Cactus Pears Opuntia ficus-indica and O. robusta Plants. South Afr. J. Bot. 2006, 72, 434–441. [Google Scholar] [CrossRef]
  43. Crop Ecology, Cultivation and Uses of Cactus Pear, Final version; Inglese, P.; Mondragón-Jacobo, C.; Nefzaoui, A.; Sáenz, H.C. (Eds.) Food and Agriculture Organization of the United Nations, International Center for Agricultural Research in the Dry Areas: Rome, Italy, 2017. [Google Scholar]
  44. Mantovani, E.; Bernardo, S.; Palaretti, L. Irrigação: Princípios e Métodos. Atual; UFV: Viçosa, Brazil, 2009. [Google Scholar]
  45. Queiroz, M.G.D.; Silva, T.G.F.D.; Zolnier, S.; Silva, S.M.S.E.; Souza, C.A.A.D.; Carvalho, H.F.D.S. Relações hídrico-econômicas da Palma Forrageira cultivada em ambiente semiárido. Irriga 2018, 1, 141. [Google Scholar] [CrossRef]
  46. Hargreaves, G.H.; Samani, Z.A. Reference Crop Evapotranspiration from Temperature. Appl. Eng. Agric. 1985, 1, 96–99. [Google Scholar] [CrossRef]
  47. Silva, T.; Miranda, K.; Santos, D.; Queiroz, M.; Silva, M.; Neto, J.C.; Araújo, J. Área do Cladódio de Clones de Palma Forrageira: Modelagem, análise e aplicabilidade. Rev. Bras. Ciências Agrárias 2014, 9, 633–641. [Google Scholar] [CrossRef]
  48. Cavalcante, E.S.; Lacerda, C.F.D.; Costa, R.N.T.; Gheyi, H.R.; Pinho, L.L.; Bezerra, F.M.S.; Oliveira, A.C.D.; Canjá, J.F. Supplemental Irrigation Using Brackish Water on Maize in Tropical Semi-Arid Regions of Brazil: Yield and Economic Analysis. Sci. Agric. 2021, 78 (Suppl. S1), e20200151. [Google Scholar] [CrossRef]
  49. Neto, B.S.; Dezen, M.; dos Santos, P.E. O Conceito de Reprodução Social Na Análise de Unidades de Produção Agropecuária. Rev. Teor. E Evidência Econômica 2009, 15. [Google Scholar]
  50. Scalisi, A.; Morandi, B.; Inglese, P.; Lo Bianco, R. Cladode Growth Dynamics in Opuntia ficus-indica under Drought. Environ. Exp. Bot. 2016, 122, 158–167. [Google Scholar] [CrossRef]
  51. Pereira, P.D.C.; Silva, T.G.F.D.; Zolnier, S.; Silva, S.M.S.E.; Silva, M.J.D. Water balance in soil cultivated with Forage Cactus clones under irrigation. Rev. Caatinga 2017, 30, 776–785. [Google Scholar] [CrossRef]
  52. Lee, J.S. Stomatal Opening Mechanism of CAM Plants. J. Plant Biol. 2010, 53, 19–23. [Google Scholar] [CrossRef]
  53. Silva, T.G.F.D.; Primo, J.T.A.; Moura, M.S.B.D.; Silva, S.M.S.E.; Morais, J.E.F.D.; Pereira, P.D.C.; Souza, C.A.A.D. Soil Water Dynamics and Evapotranspiration of Forage Cactus Clones under Rainfed Conditions. Pesq. Agropec. Bras. 2015, 50, 515–525. [Google Scholar] [CrossRef]
  54. Barbosa, M.L.; Silva, T.G.F.D.; Zolnier, S.; Silva, S.M.S.E.; Araújo, G.D.N., Jr.; Jardim, A.M.D.R.F. Meteorological Variables and Morphological Characteristics Influencing the Evapotranspiration of Forage Cactus. Rev. Ceres 2017, 64, 465–475. [Google Scholar] [CrossRef]
  55. De Alencar, L.P.; Delgado, R.C.; Almeida, T.S.; Wanderley, H.S. Comparação de Diferentes Métodos de Estimativa Diária Da Evapotranspiração de Referência Para a Região de Uberaba. Rev. Bras. Ciências Agrárias 2011, 6, 337–343. [Google Scholar] [CrossRef]
  56. Shahidian, S.; Serralheiro, R.P.; Serrano, J.; Teixeira, J.L. Parametric Calibration of the Hargreaves–Samani Equation for Use at New Locations. Hydrol. Process. 2013, 27, 605–616. [Google Scholar] [CrossRef]
  57. Bezerra, B.G.; Araújo, J.S.; Pereira, D.D.; Laurentino, G.Q.; Silva, L.L.D. Zoneamento Agroclimático da Palma Forrageira (Opuntia Sp.) para o Estado da Paraíba. Rev. Bras. De Eng. Agricola E Ambient. 2014, 18, 755–761. [Google Scholar] [CrossRef]
  58. Temesgen, B.; Allen, R.G.; Jensen, D.T. Adjusting Temperature Parameters to Reflect Well-Watered Conditions. J. Irrig. Drain Eng. 1999, 125, 26–33. [Google Scholar] [CrossRef]
  59. Xu, C.-Y.; Singh, V. Cross Comparison of Empirical Equations for Calculating Potential Evapotranspiration with Data from Switzerland. Water Resour. Manag. 2002, 16, 197–219. [Google Scholar] [CrossRef]
  60. Arraes, F.D.D.; Junior, J.C.L.; de Oliveira, J.B.; de Macêdo, K.G.; de Sousa Couras, Y.; de Oliveira, W.C. Parametrização Da Equação de Hargreaves-Samani Para o Estado Do Pernambuco–Brasil. Rev. Bras. De Agric. Irrig. RBAI 2016, 10, 410–419. [Google Scholar] [CrossRef]
  61. Rocha, R.; Voltolini, T.; Gava, C. Características Produtivas e Estruturais de Genótipos de Palma Forrageira Irrigada Em Diferentes Intervalos de Corte. Arch. De Zootec. 2017, 66, 365–373. [Google Scholar] [CrossRef]
  62. Pereira, J.D.S.; Cavalcante, A.B.; Simões, W.L.; Voltolini, T.V. Forage Yield, Structural Responses and Chemical Composition of Spineless Cactus Orelha de Elefante Mexicana in Different Water Depths and Irrigation Frequencies. Cienc. Rural 2021, 51, e20200324. [Google Scholar] [CrossRef]
  63. Gibson, A.C.; Nobel, P.S. The Cactus Primer; Harvard University Press: Cambridge, MA, USA, 2013. [Google Scholar] [CrossRef]
  64. Drennan, P.M.; Nobel, P.S. Root Growth Dependence on Soil Temperature for Opuntia ficus-indica: Influences of Air Temperature and a Doubled CO2 Concentration. Funct. Ecol. 1998, 12, 959–964. [Google Scholar] [CrossRef]
  65. Rykaczewski, K.; Jordan, J.S.; Linder, R.; Woods, E.T.; Sun, X.; Kemme, N.; Manning, K.C.; Cherry, B.R.; Yarger, J.L.; Majure, L.C. Microscale Mechanism of Age Dependent Wetting Properties of Prickly Pear Cacti (Opuntia). Langmuir 2016, 32, 9335–9341. [Google Scholar] [CrossRef]
  66. Kim, H.; Kim, K.; Lee, S.J. Hydraulic Strategy of Cactus Root–Stem Junction for Effective Water Transport. Front. Plant Sci. 2018, 9, 799. [Google Scholar] [CrossRef]
  67. Rieger, M.; Litvin, P. Root System Hydraulic Conductivity in Species with Contrasting Root Anatomy. J. Exp. Bot. 1999, 50, 201–209. [Google Scholar] [CrossRef]
  68. Nobel, P.S. Environmental Biology of Agaves and Cacti; Cambridge University Press: Cambridge, UK, 2003. [Google Scholar]
  69. Ju, J.; Bai, H.; Zheng, Y.; Zhao, T.; Fang, R.; Jiang, L. A Multi-Structural and Multi-Functional Integrated Fog Collection System in Cactus. Nat. Commun. 2012, 3, 1247. [Google Scholar] [CrossRef]
  70. Kim, K.; Kim, H.; Ho Park, S.; Joon Lee, S. Hydraulic Strategy of Cactus Trichome for Absorption and Storage of Water under Arid Environment. Front. Plant Sci. 2017, 8, 1777. [Google Scholar] [CrossRef] [PubMed]
  71. Silva, T.G.F.; Primo, J.T.A.; Silva, S.M.S.E.; Moura, M.S.B.D.; Santos, D.C.D.; Silva, M.D.C.; Araújo, J.E.M. Indicadores de Eficiência Do Uso Da Água e de Nutrientes de Clones de Palma Forrageira Em Condições de Sequeiro No Semiárido Brasileiro. Bragantia 2014, 73, 184–191. [Google Scholar] [CrossRef]
  72. de Souza, L.; de Moura, M.; da Silva, T.; Soares, J.; do Carmo, J.; Brandão, E. Indicadores Climáticos Para o Zoneamento Agrícola Da Palma Forrageira (Opuntia Sp.). In Jornada de Iniciação Científica da Embrapa Semi-Árido; Embrapa Semi-Árido: Petrolina, Brazil, 2008. [Google Scholar]
  73. Voltolini, T. Sistema de Produção de Palma-Forrageira para o Estado da Paraíba; Embrapa Semiárido: Petrolina, Brazil, 2022. [Google Scholar]
  74. Sánchez-Toledano, B.I.; Zegbe, J.A. Economic Indices for the Application of Irrigation to Enhance Cactus Pear Fruit Yield. Asian J. Agric. Ext. Econ. Sociol. 2021, 39, 73–81. [Google Scholar] [CrossRef]
  75. Silva Neto, B. Agroecologia e análise econômica de sistemas de produção. In Uma Abordagem Baseada no Materialismo Histórico e Dialético; Universidade Federal da Fronteira Sul—UFFS: Chapecó, Brazil, 2016. [Google Scholar]
Figure 1. Experimental area location, highlighting the map of the Brazilian semi-arid region, the state of Ceará, the municipality of Independência, and the specific location of EFA Dom Fragoso.
Agronomy 14 01445 g001
Figure 2. Variation in the daily mean values of the variables minimum temperature (Tmin), maximum temperature (Tmax), and mean temperature (Tmean) (a); precipitation (P), reference evapotranspiration by Penman–Monteith (ET0 PM), crop evapotranspiration by Penman–Monteith (ETc PM), reference evapotranspiration by Hargreaves–Samani (ET0 HS), and crop evapotranspiration by Hargreaves–Samani (ETc HS) (b) throughout the research period.
Agronomy 14 01445 g002
Figure 3. Interaction between irrigation levels and time on the variables cladode thickness (CT) (a) and volume of cladodes per plant (CV/P) (b). Means marked with the same letters do not differ significantly according to Tukey’s test (p > 0.05).
Agronomy 14 01445 g003
Figure 4. Results for equations (a,d), isolated effects of irrigation levels (b,e), and times (c,f) on leaf area per plant (LA/P) and soil cover index (ICS%), respectively (means followed by the same letters do not differ according to Tukey’s test (p > 0.05)).
Agronomy 14 01445 g004
Figure 5. Results for the equations (a), the isolated effects of irrigation levels (b), and times (c) on fresh matter productivity (FMP), and the interaction between levels and times (d) on dry matter productivity (DMP). Means with the same letters do not differ significantly according to Tukey’s test (p > 0.05).
Agronomy 14 01445 g005
Figure 6. Results for the equations (a), isolated effects of irrigation levels (b), and times (c) on the physical water productivity based on dry matter (PWP_DM). Means followed by the same letters do not differ significantly according to Tukey’s test (p > 0.05).
Agronomy 14 01445 g006
Figure 7. Added value for different irrigation levels as a function of the usable agricultural surface in year 1 (a) and year 2 (b).
Agronomy 14 01445 g007
Figure 8. Farmer’s income for different irrigation levels based on the usable agricultural surface in year 1 (a) and year 2 (b). BRL = Brazilian Reais; LSR = level of social reproduction.
Agronomy 14 01445 g008
Table 1. Values of the water supply to the crop according to the equations, depths, and precipitation.
EquationTRI (%)6 Months12 Months18 MonthsCumulatedCumulated
IPIPIPIP
Mm
0028.80722.2069.00820.0
PM100353.228.871.3722.2315.669.0740.1820.0
70247.328.849.9722.2220.869.0518.0820.0
40141.328.828.5722.2126.269.0296.0820.0
2070.628.814.3722.263.169.0148.0820.0
HS100315.628.856.5722.2277.969.0650.0820.0
70220.928.839.6722.2194.569.0455.6820.0
40126.228.822.6722.2111.269.0260.2820.0
2063.128.811.3722.255.669.0130.0820.0
Table 2. Fixed cost related to 1 hectare cultivated with forage cactus. TRI = total required irrigation; BRL = Brazilian Reais.
Discrimination%TRI
Fixed Cost (BRL)1007040200
Irrigation11,150.9511,150.9511,150.9511,150.950.00
Loan installment1115.110.00
Table 3. Variable costs for one hectare of forage cactus according to irrigation levels.
Discrimination%TRI
Variable Cost (BRL)1007040200
Organic Fertilizer10,199.9810,199.9810,199.9810,199.9810,199.98
Cladodes Seeds12,083.4112,083.4112,083.4112,083.4112,083.41
Electricity35.3017.045.902.360.00
Total22,318.6922,300.4322,289.2922,285.7522,283.39
Financing installment2231.872230.042228.932228.582228.34
Table 4. Summary of the analysis of variance for isolated effects and interactions of treatments for cladode thickness (CT), cladode volume per plant (CV/P), dry matter productivity (DMP), leaf area per plant (LA/P), soil cover index (SCI), fresh matter productivity (FMP), and physical water productivity based on dry matter (PWP_DM).
Sources of VariationDFPr (<F)
CT (mm)CV/P (cm3 plant−1)DMP (kg ha−1)LA/P (cm2 plant−1)SCI (%)FMP (kg ha−1)PWP_DM (kg m−3)
Equations (E)10.538 ns0.982 ns0.498 ns0.871 ns0.170 ns0.418849 ns0.511 ns
Irrigation Levels (L)4<0.001 **<0.001 **<0.001 **<0.001**0.008 **<0.001 **0.002 **
Time (T)2<0.001 **<0.001 **<0.001 **<0.001 **<0.001 **<0.001 **<0.001 **
Blocks30.144 ns0.0065 **0.143 ns0.003 **0.122 ns0.0012 **0.143 ns
E × L40.762 ns0.454 ns0.882 ns0.528 ns0.923 ns0.697 ns0.873 ns
E × T20.542 ns0.972 ns0.605 ns0.849 ns0.905 ns0.913 ns0.870 ns
L × T8<0.001 **<0.001 **<0.001 **0.155 ns0.780 ns0.611 ns0.159 ns
E × L × T80.8580.987 ns0.968 ns0.987 ns0.888 ns0.939 ns0.929 ns
Residual90-------
CV (%) 7.625.593.754.278.3833.0311.55
** significant at 1%, ns: not significant.
Disclaimer/Publisher’s Note: The statements, opinions and data contained in all publications are solely those of the individual author(s) and contributor(s) and not of MDPI and/or the editor(s). MDPI and/or the editor(s) disclaim responsibility for any injury to people or property resulting from any ideas, methods, instructions or products referred to in the content.

