Article

Effects of Land Use Change on Soil Aggregate Stability and Erodibility in the Karst Region of Southwest China

by
Meiting Li
,
Keqin Wang
,
Xiaoyi Ma
,
Mingsi Fan
and
Yali Song
*
College of Soil and Water Conservation, Southwest Forestry University, Kunming 650224, China
*
Author to whom correspondence should be addressed.
Agronomy 2024, 14(7), 1534; https://doi.org/10.3390/agronomy14071534
Submission received: 19 June 2024 / Revised: 8 July 2024 / Accepted: 12 July 2024 / Published: 15 July 2024
(This article belongs to the Section Soil and Plant Nutrition)

Abstract

:
Differences in land use type and chronological age affect soil properties and plant community characteristics, which may influence soil structural stability and erodibility. However, knowledge on the effects of soil physicochemical properties on soil aggregate stability and erodibility at different land use years is limited. This study selected five land use types: corn field (Year 38th-y), corn intercropped with cabbage field (Year 38th-y + b), fruit and meridian forest (Year 6th-jgl), naturally restored vegetation (Year 6th-zr), and artificial forest (Year 7th-rgl) in the karst landscape of the Chishui River Basin in Yunnan Province. We aimed to identify the influencing factors of soil stability and erodibility under different land use time series. The results indicated that the mean weight diameter (MWD), the geometric mean diameter (GMD), and soil structural stability index (SSI values) were highest in Y6th-zr and lowest in Y7th-rgl. Conversely, the erodibility K value was lowest in Y6th-zr, suggesting that the soil structure in Y6th-zr exhibited greater stability, whereas soil stability in Y7th-rgl was lower. Redundancy and throughput analyses revealed that organic carbon and water-stable aggregates > 2.0 mm content had higher vector values. Soil bulk density, total nitrogen, organic carbon, and soil texture content were the main factors contributing to soil stability variation (0.338–0.646). Additionally, total nitrogen, organic carbon, total phosphorus, and soil texture content drove the variation in K values (0.15–1.311). Natural vegetation restoration measures can enhance soil structure to a certain extent. These findings highlight changes in soil aggregate stability and erodibility over different land use durations. The research results have important theoretical and practical significance for understanding the differences in soil erosion and soil restoration under different land use patterns in the karst landscapes of southwest China.

1. Introduction

Soil erosion severely damages soil structure, reduces soil fertility and quality, leads to the loss of land resources, and poses a major obstacle to agricultural and economic development, garnering worldwide concern [1,2,3]. Soil erosion is influenced by natural factors (climate, geomorphology, vegetation) and anthropogenic factors (land use changes, field management practices), directly affecting soil structure stability and erosion resistance [1]. Differences in land use types and duration cause variability in soil structure and quality, correlating with soil aggregate stability and erodibility [4], which are influenced by soil properties, especially soil organic carbon (SOC) and soil texture content [5]. Therefore, studying the effects of land use patterns and duration on soil properties with varying degrees of erodibility is essential to maintain ecosystem stability and enhance its services.
Soil aggregate stability and erodibility are important factors characterizing soil structure [6,7]. Land use changes and age can redistribute soil aggregate particle size by altering soil structure [8,9], thus affecting soil aggregate stability and erodibility. The composition of soil water-stable aggregates an important component of aggregate stability. This composition relates to soil aggregation, microstructure, and the degree of human disturbance [10,11]. SOC content and soil texture content may exhibit spatial variability due to different land use practices, leading to changes in soil structure stability and erodibility [1]. Research has indicated that soil aggregation and erosion resistance are closely related to soil texture. Soils with higher clay content exhibit greater aggregation and erosion resistance compared to those with higher sand content [12]. According to aggregation theory, the multistage aggregation process of soil aggregates is mainly controlled by adhesives (clay, multivalent cations, humus), which individually and interactively affect aggregate stability [5,13]. The distribution of SOC plays a crucial role in the stability of soil aggregates by influencing the composition of soil silt and clay particles [14]. Therefore, the structural stability index (SSI), determined by organic carbon and clay particles, has been widely used to study soil stability [15,16].
Numerous studies have shown that soil erodibility is primarily influenced by the physical and chemical properties of the soil, which vary with land use types [1,15]. Chen et al. identified soil bulk density and root mass density as the dominant factors affecting soil erodibility in small watersheds of the northeastern hilly region [1]. Wang et al. found that in the karst plateau mountainous area, the interaction between land use type and slope (>70%) is an important factor controlling soil erosion in areas of all landform types [15]. Okolo et al. reported that in semiarid areas, organic carbon is positively correlated with the soil SSI and aggregate stability index (ASI), indicating that organic carbon content influences soil stability. Research also suggests that soil aggregate stability and erodibility vary significantly under different land use durations and vegetation coverages [16]. Melese et al. observed that in the Blue Nile Basin of Ethiopia, soil erosion rates and soil aggregate stability in 2016 were significantly higher than those in 1995 and 2005 across various land uses, including forests, shrubs, swamps, grasslands, farmlands, buildings, and bare land [17]. Aneseyee et al. found that over the past 30 years in the Winike watershed of the Omo Gibe basin, vegetation cover directly increased soil structure stability, reducing soil erosion in areas with high vegetation cover, such as forests and pastures (both at 0.01 t/ha/year) [18]. In contrast, areas with lower vegetation cover, such as arable land and bare land, experienced significant increases in soil erosion and sediment yield (arable land and bare land increased from 0.01 t/ha/year to 1.37 t/ha/year and from 0.08 t/ha/year to 1.5 t/ha/year, respectively) [18]. Other studies have confirmed that soil erosion intensity is strongly influenced by land use types [1,10]. Therefore, the differences in land use types in different regions, along with changes in soil physical and chemical properties, vegetation, and land use duration, often lead to variations in soil stability and erodibility. Assessing these variations is essential for identifying appropriate land use types to mitigate soil erosion and land degradation.
Karst rocky desertification is the most severe ecological and geological problem in southwestern China [19,20]. Due to the unique geological background, the soil formation process in karst regions is prolonged and slow, resulting in shallow and discontinuous soil layers with high gravel content. Additionally, changes in land use are major driving factors of karst rocky desertification [15]. Research on soil erosion in China has mainly focused on arid and semiarid regions, such as the Loess Plateau [21] and the Northeast Hilly Region [1,14]. However, research on the impact of soil erosion in the karst regions of southwestern China is limited, particularly in relation to different land use types and usage duration. Yunnan Province, part of the plateau region, has a high proportion of sloping farmland (70%) and suffers from severe soil erosion [22,23]. Therefore, this study intends to take the Chishui River Basin in the southwest karst desertification region as the study area, and selects five typical land use years, including maize land and corn intercropped with cabbage land planted continuously for 38 years, meridian forest planted for 6 years, natural restoration of vegetation carried out continuously for 6 years, and planted forests for 7 years, to test the hypotheses that the stability of different soil aggregates and the resistance to erosion may be due to the differences in the timing of the land use years and the texture of the soils and the hypotheses that led to it. The specific objectives of this study were to (1) assess the effects of different land use years on soil aggregate content and stability using the wet sieve method, and (2) identify key factors that influence soil aggregate stability and erodibility. The findings of this study improve the understanding of the soil structure stabilization aspects of different land use years in the southwestern karst region.

2. Materials and Methods

2.1. Study Area

The study area was located in the Chishui River basin in the karstic rocky desertification region of southwest China (26°49′–28°54′ N, 104°09′–107°10′ E) [15,19,20], originating from Zhenxiong County, Yunnan Province, at the junction of Yunnan, Guizhou, and Sichuan provinces (Gosur Maps: https://coordinates-gps.gosur.com/cn/, 15 May 2024). The main stream stretches 436.5 km, covering a basin area of 18,932.2 km2. The terrain is high in the southwest and low in the northeast, with elevations ranging from 0.20 to 1.89 km. The middle and upper reaches belong to the Yungui Plateau, characterized by typical karst landforms, which comprise about 74% of the total basin area, mainly plateau mountains. The lower reaches are in the Sichuan Basin, characterized by Danxia landforms, accounting for about 26% of the total area, primarily hilly plains. Soil types include zonal yellow soil and yellow-brown soil, lithogenic lime soil and purple soil, cultivated rice soil, and dryland soil. The basin, situated in a transitional zone between plateaus and basins, experiences a continental climate, mostly in the middle subtropics of Central Asia. Winters are dry and cold, while summers are hot and humid, with temperatures ranging from −5 to 39 °C and an average temperature of 15 to 20° (National Meteorological Information Center, http://data.cma.cn, 13 May 2024). Annual precipitation ranges from 749 to 1286 mm, with an annual runoff of about 9.7 billion cubic meters and rainfall concentrated from June to September (National Meteorological Information Center, http://data.cma.cn, 13 May 2024). The main crops are corn and rice. Vegetation includes plantations such as Chinese fir (Cunningham IA lanceolata), sea buckthorn (Hippophage rhomboids), firethorn (Pyracantha fortune Ana), Stenoloma Fee, and naturally restored vegetation like Chinese ash (Fraxinus chinensis Roxb), rough-leaved hydrangea (Hydrangea aspera D. Don), mugwort (Artemisia argyi), and Artemisia dubia. The location of the research area is shown in Figure 1.

2.2. Experimental Design

In April 2023, an investigation was conducted on the regional characteristics and crop planting situation in the Chishui River Basin. The main cash crops are corn and kiwi fruit. However, with economic development and increased labor prices, many young and middle-aged rural laborers have shifted to working or engaging in business, moving away from agriculture as their primary income source [24]. Corn and other crops are now primarily used for poultry farming. Due to local production and living needs, vegetables and other crops are intercropped with corn. Since 1986, a terrace planting model has been implemented on sloping cultivated land to combat severe soil erosion and leakage in karst landforms. Natural vegetation recovers through natural succession in rugged and severely eroded areas, while artificial forests are established through planting and aerial seeding. The sampling site selection was based on field surveys and coverage area in the wilderness, with planting duration determined through interviews with farmers, consultations with experts, and analysis of annual vegetation rings. We selected a time series of land use years ranging from 6 to 38 years in the study area, including Year 6th-zr, Year 6th-jgl, Year 7th-rgl, Year 38th-y, and Year 38th-y + b. Vegetation surveys were conducted on two 20 m × 20 m standard plots. The dominant plant community was determined by calculating the relevant values of each plant species within the plots. Vertical photographs of the plots were analyzed using image processing software ImageJ (version 1.53e, National Institutes of Health, Bethesda, MD, USA) to obtain vegetation coverage. Table 1 details the basic information of the plots.
Fertilizer application: according to the local agricultural cultivation habits, maize land and maize-intercropped cabbage land are fertilized at the sowing period (the end of March every year), seedling period (mid-April every year), and growing period (mid-June every year); the meridian forests begin to be fertilized at the beginning of March every year; and the fertilizers used are urea (N(46%)) and compound (N(20%), P2O5 (10%), K2O (10%)) fertilizers. The specific fertilizer application rate is shown in Table 2.

2.3. Soil Sampling and Analysis

In April 2023, five sampling points were randomly set in each of the five land use types. Sampling was performed using the profile digging method at each point in the 0–10, 10–20, and 20–30 cm strata. To ensure that the soil aggregates for physicochemical analyses remained intact, in situ soils were collected using an aluminum box (31.4 cm3) and a ring cutter (100 cm3). During sampling, we collected three replicate samples for each same soil layer, 1 m apart horizontally. In the laboratory, soil samples were broken into small pieces (about 1 cm), with roots, stones, and other impurities removed, and then naturally air-dried for analysis of soil physical and chemical properties.
Water-stable soil aggregates were determined by using the wet sieve method. The sieve diameter of the wet sieving method was divided into four types, 0.25, 0.5, 1.0, and 2.0 mm, resulting in agglomerates of <0.25 mm, 0.25–0.5 mm, 0.5–1.0 mm, 1.0–2.0 mm, and >2.0 mm. Soil water content (RWC) was determined by using the drying method, soil bulk density (BD) by the ring knife method, and soil pH by the electrode method with a water–soil ratio of 2.5:1. Soil texture (sand, powder, and clay content) was determined by using the Malvern Laser Particle Meter, with soil particles graded according to the American system. External heating with potassium dichromate determined soil organic carbon content (SOC). Total nitrogen (TN) and total phosphorus (TP) were determined by Kjeldahl nitrogen fixation and perchloric acid-sulfuric acid decoction, respectively [6].

2.4. Calculation of Soil Aggregate Stability and Erodibility

The mean weight diameter (MWD) and geometric mean diameter (GMD) of soil water-stable aggregates were calculated using the following equations:
MWD = i = 1 n X 1 M i
GMD = exp [ i n M i ln ( X i ) ]
where n represents the number of sieves, Xi stands for the average diameter of the ith particle aggregate(mm), and Mi represents the proportion of the mass of the ith aggregate component to the total soil mass(%).
The soil structural stability index (SSI, %) reflects soil structure resilience and evaluates the effectiveness of SOM in maintaining structural stability [25]. The SSI is calculated as follows:
SSI = 100 × SOM CLAY + SILT
The soil organic matter content (SOM%) is obtained by multiplying the organic carbon content (SOC%) by the conversion factor 1.724. That is, SOM = SOC × 1.724. According to Pieri (1992), an SSI of 5% indicates that the soil structure is degraded due to severe soil erosion; an SSI between 5% and 7% indicates a higher risk of degradation; and an SSI of 7% or more indicates a lower risk of degradation [23].
Soil erodibility K values were calculated using the EPIC model proposed by Williams et al. (1983), which estimates K based on soil particle composition and soil organic carbon content [26]:
K EPIC = { 0.2 + 0.3 exp ( 0.0256 × SAN × ( 1 SIL 100 ) ) } × ( SIL CLA + SIL ) 0.3 × ( 1.0 0.25 × C C + exp ( 3.72 2.95 × C ) ) × ( 1.0 0.7 × SN 1 SN 1 + exp ( 5.51 + 22.9 × SN 1 ) )
where SANSAN, SIL, and CLA correspond to sand content (%), powder content (%), and clay content (%), respectively; C is the organic carbon content (%); SN1 = 1 − SAN/100.
The K value calculated from this equation is in U.S. customary units and needs to be converted to international units (t·hm2·h/(MJ·mm·hm2)) by multiplying by 0.1317. The K value, adapted for soil erodibility estimation in China, is corrected using the value proposed by Zhang et al., as follows [27]:
K = 0.01383 + 0.515751 K EPIC

2.5. Statistical Analysis

SPSS 25.0 was utilized to confirm the normal distribution of soil physicochemical properties, the percentage of water-stable aggregates for each particle size, MWD, GMD, and SSI values, and K values across various land use types. ANOVA was conducted to analyze the stability and erodibility indexes. Pearson correlation analysis was employed to investigate the relationship between soil physicochemical properties, soil aggregate percentages, MWD, GMD, and SSI values, and K values. Redundancy analysis (RDA) was carried out using Canoco 5.0 to elucidate the direction and strength of the impact of overall soil properties on the response variables, with a parametric replacement test for testing RDA significance. Stepwise regression analysis and path analysis were applied to identify and examine the key factors influencing soil aggregate stability and erodibility (K value), resulting in direct and indirect correlation coefficients. RDA graphs were generated using Canoco 5.0 (Canoco, NY, USA) while correlation plots were produced using ggplot in R. Other graphical representations were created using Origin 2022.

3. Results

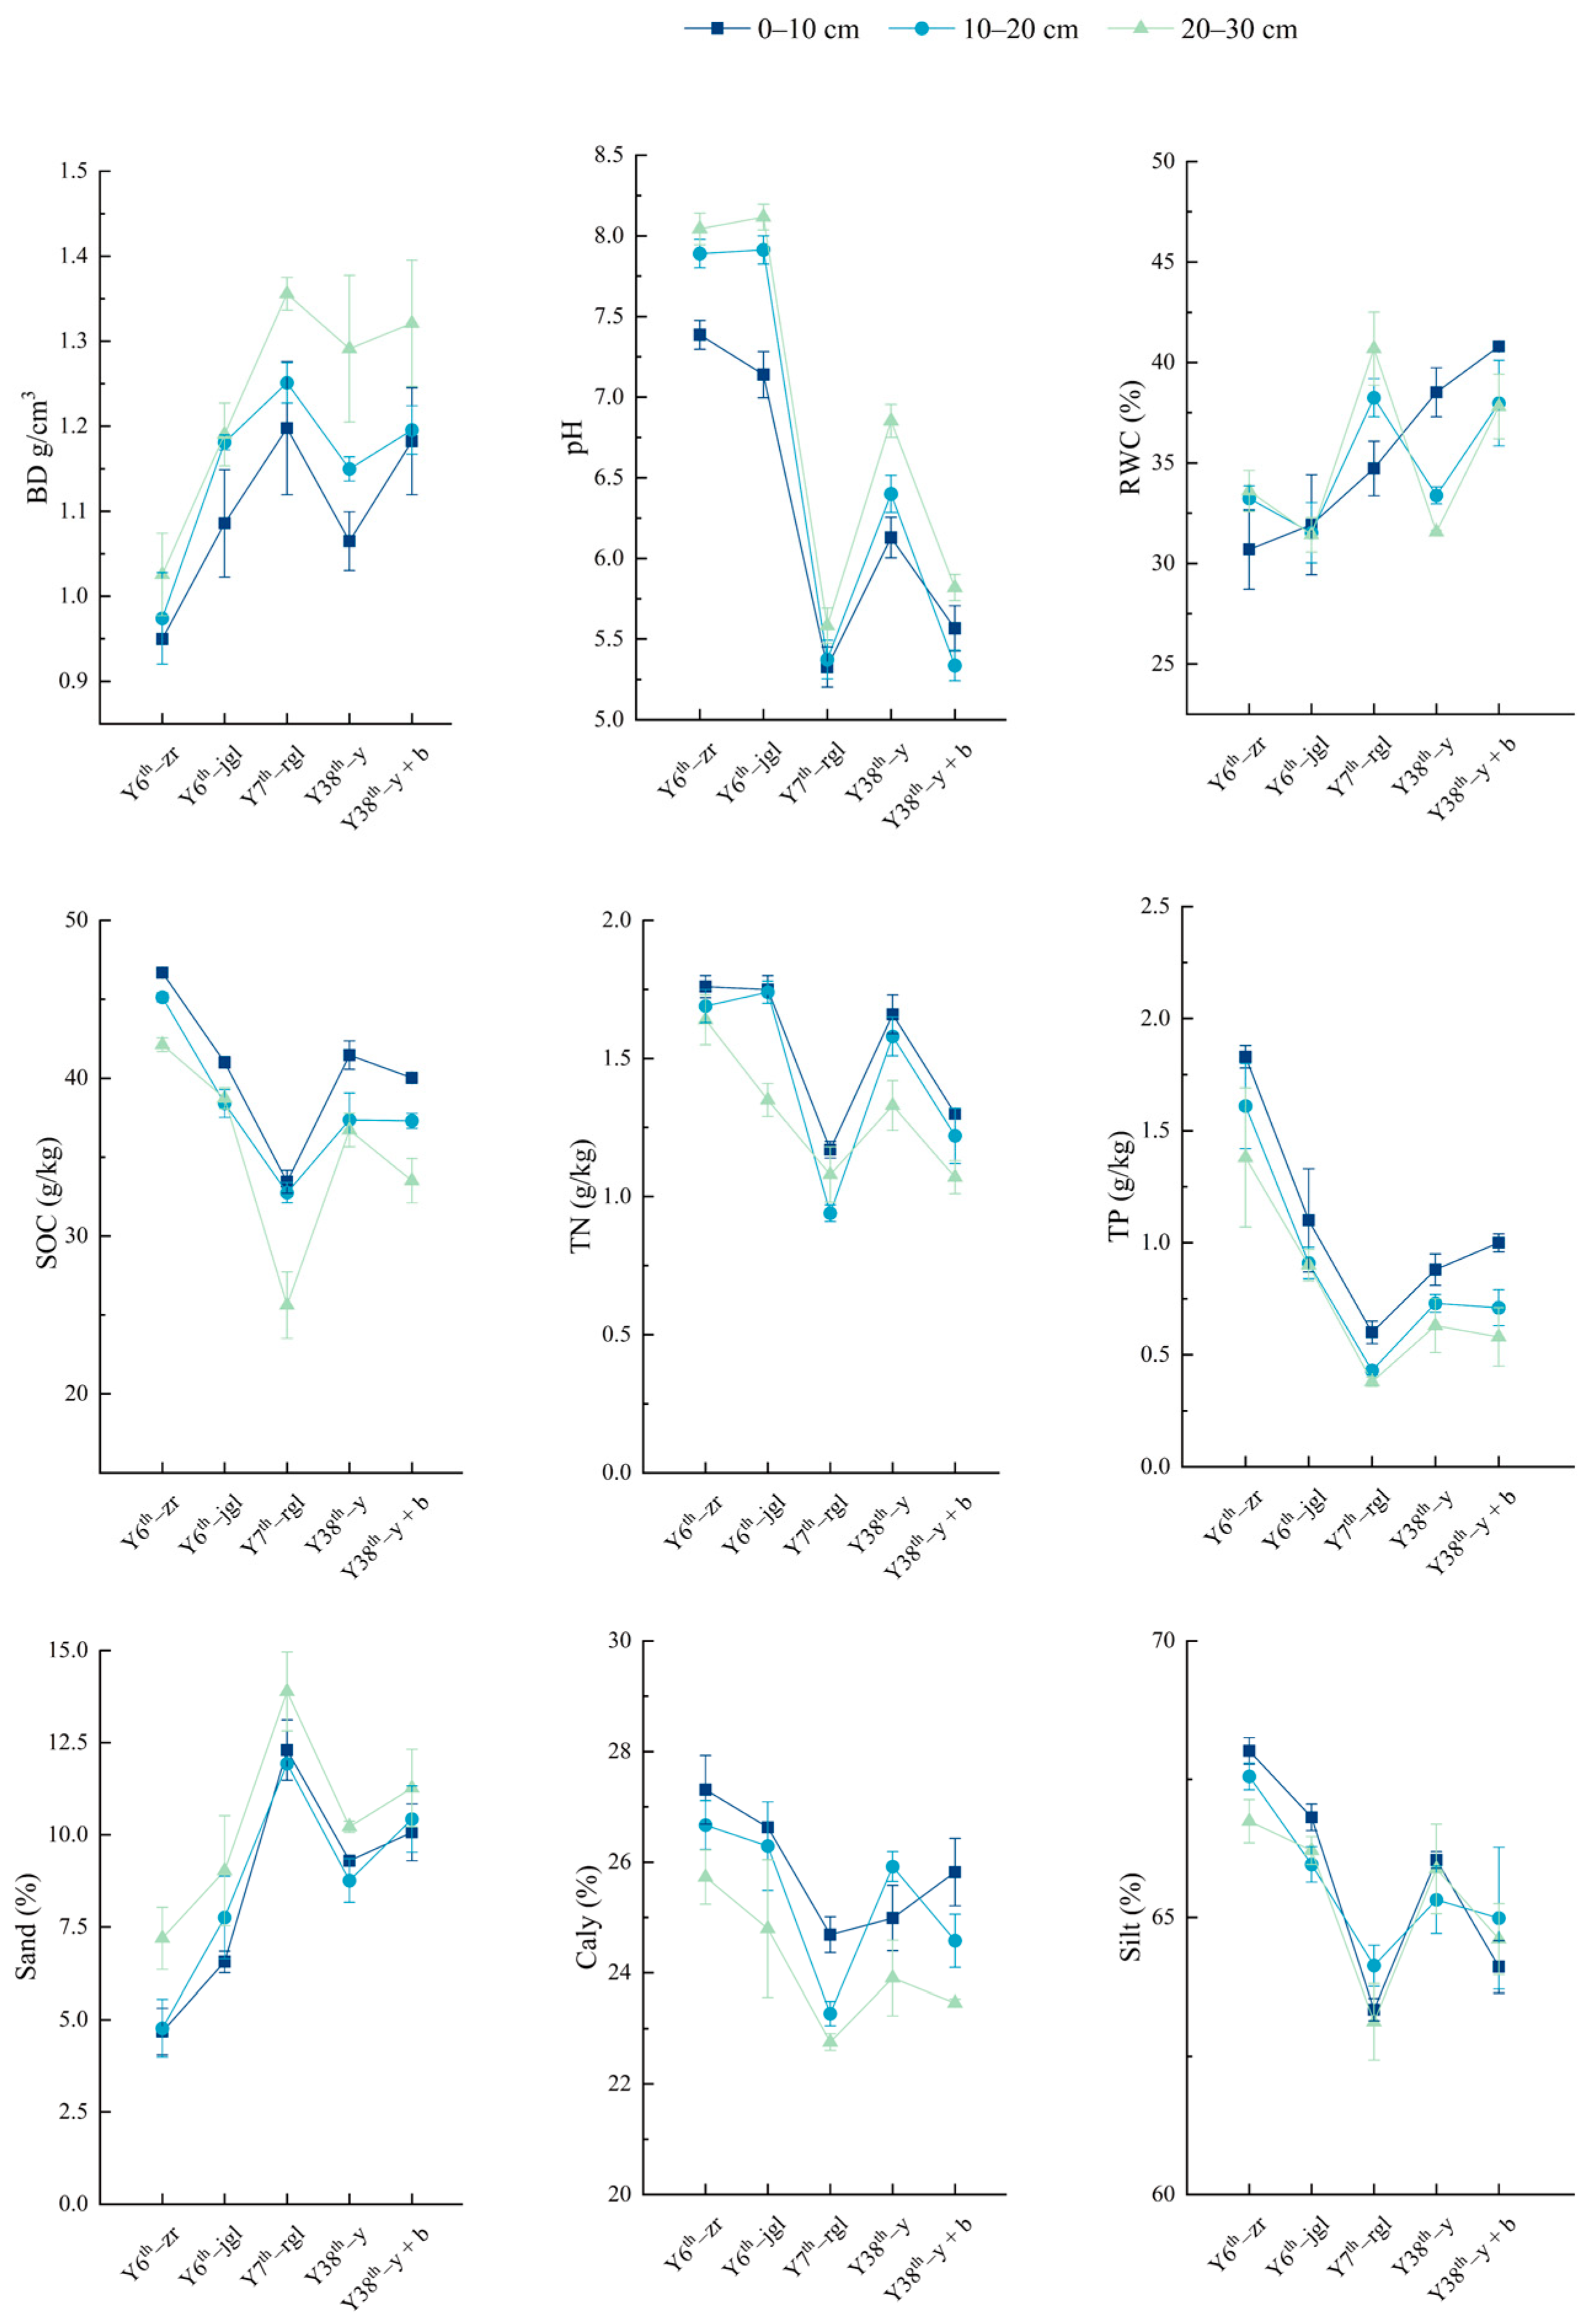
3.1. Impact of Land Use Type on Physical and Chemical Properties

The basic physicochemical properties of different land use types are shown in Figure 2. In the 0–10, 10–20, and 20–30 cm soil layers, the bulk density (BD) and pH of each land use type increased with soil depth, while the contents of SOC, TN, and TP decreased. The pattern of BD across the three soil layers for the five land use types followed the order: Y7th-rgl > Y38th-y + b > Y38th-y > Y6th-jgl > Y6th-zr. The pH values of Y7th-rgl, Y38th-y + b and Y38th-y were weakly acidic (5.33-6.85) (Figure 2), while those of Y6th-jgl and Y6th-zr were weakly alkaline (7.14-8.12). In the 0-10 cm range, Y6th-zr had the highest pH value (7.39), 1.4% higher than the lowest value observed in Y7th-rgl (5.33). The relative water content (RWC) of Y38th-y + b, Y38th-y, and Y6th-jgl increased with soil depth, while the opposite trend was observed for Y7th-rgl and Y6th-zr. SOC, TN, and TP varied between 46.69 and 18.85 g/kg, 0.51 and 1.8 g/kg, and 0.02 and 0.31 g/kg, respectively. The trend across different soil layers was Y6th-zr > Y6th-jgl > Y38th-y or Y38th-y + b > Y7th-rgl, with higher concentrations in the upper soil layers compared to the lower layers.
Regarding soil texture, all land use types showed more than 60% of the total soil particles as pulverized grain content (63.21 to 69.4%), followed by clay grain content (23.27 to 27.31%) and the least as sandy grain content (4.44 to 11.93%). The highest pulverized grain content was observed in Y6th-zr and the lowest in Y7th-rgl, whereas the opposite was true for sand grain content. The upper layer had a higher clay grain content than the lower layer, while the opposite was true for the pulverized grain content.

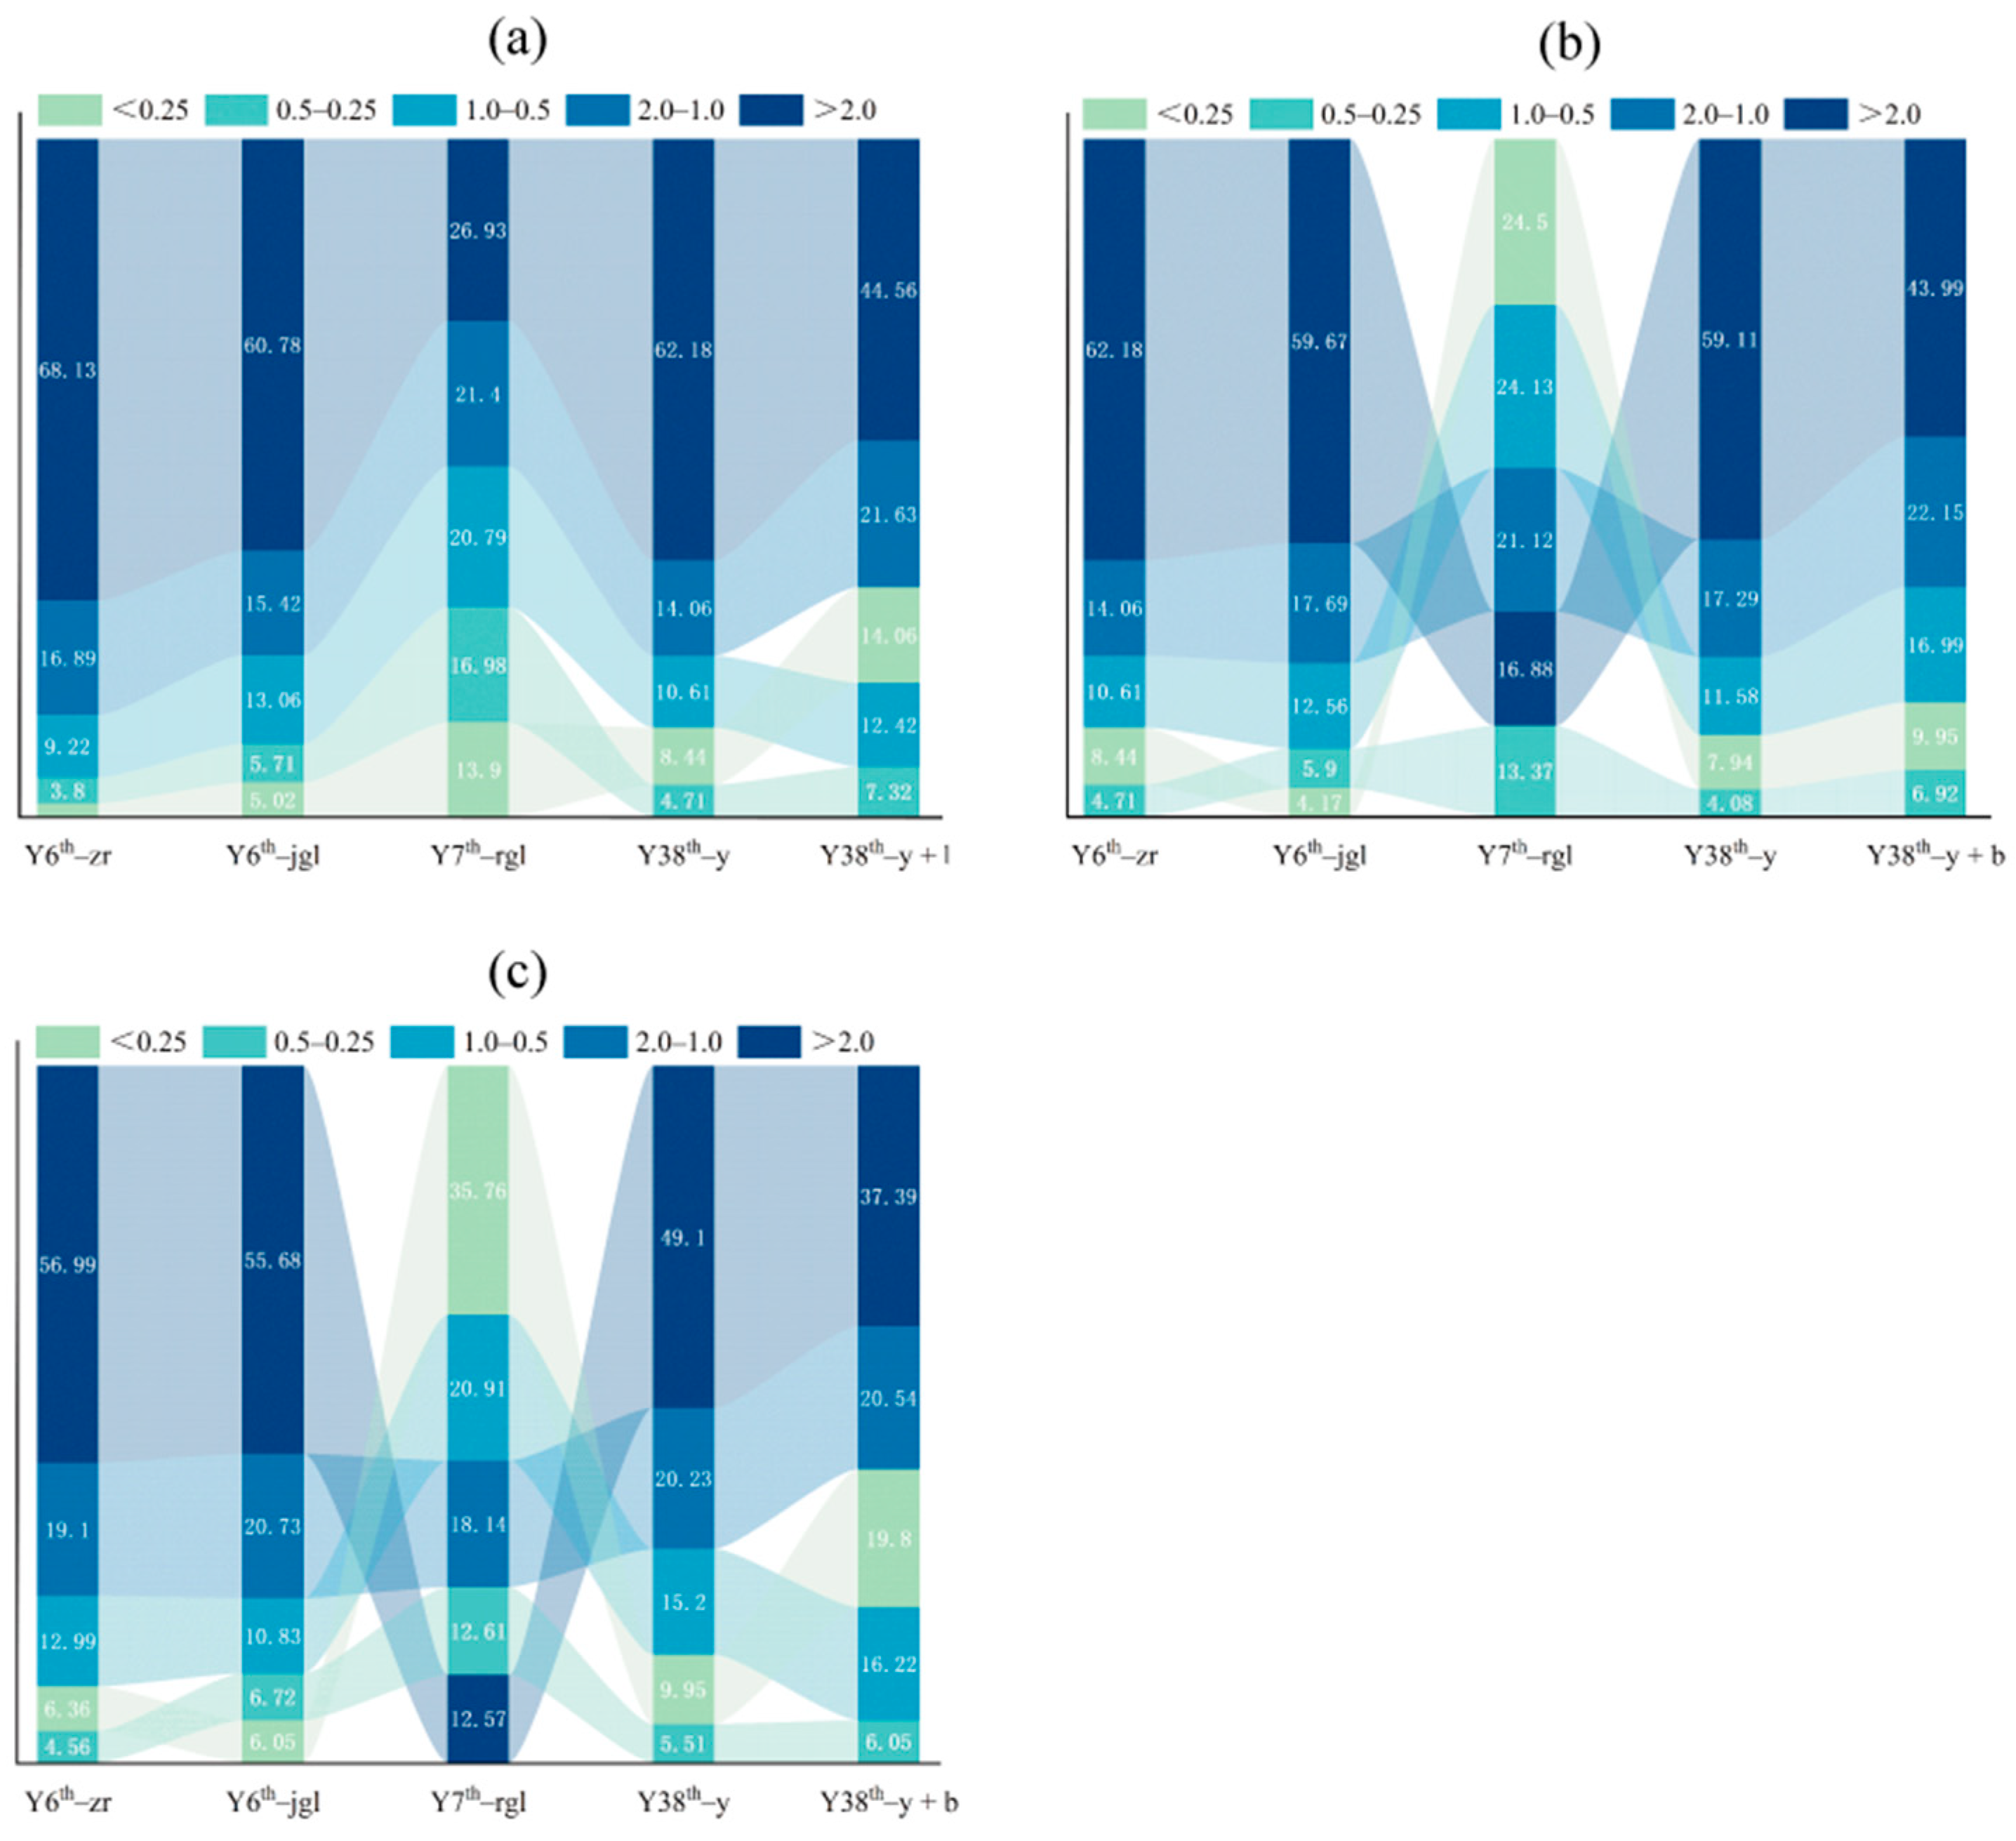
3.2. Distribution Characteristics of Soil Water-Stable Clusters under Land Use Practices

The distribution of water-stable aggregates in different land use types, as determined by the wet sieving method, is shown in Figure 3. In the 0–10 cm, 10–20 cm, and 20–30 cm soil layers, the proportion of aggregates larger than 2.0 mm was the highest in all land use types except Y7th-rgl. Y6th-zr had the highest proportion (mean value 62.43%) (Figure 3), 3.3 times higher than the lowest proportion in Y7th-rgl (18.79%). The trend for the mean value of aggregates larger than 0.25 mm (large aggregates) across the three soil layers was as follows: Y6th-jgl (94.92%) > Y6th-zr (94.42%) > Y38th-y (91.22%) > Y38th-y + b (85.39%) > Y7th-rgl (75.28%). Conversely, the trend for the mean value of aggregates smaller than 0.25 mm (microaggregates) was the opposite: Y7th-rgl (24.72%) > Y38th-y + b (14.61%) > Y38th-y (8.78%) > Y6th-zr (5.58%) > Y6th-jgl (5.08%). In the 0–10 cm layer, Y7th-rgl had the largest proportion of aggregates larger than 2.0 mm. However, in the 10–20 cm and 20–30 cm layers, Y7th-rgl had the highest proportion of microaggregates (24.5%). The percentage of microaggregates (< 0.25 mm) in all five land use types increased linearly with soil depth. The percentages of 2.0–1.0 mm, 1.0–0.5 mm, and 0.5–0.25 mm water-stable aggregates remained relatively stable across the three soil layers (3.80–24.13%).

3.3. Differences in Soil Structural Stability under Land Use Patterns

The mean weight diameter MWD, geometric mean diameter GMD, and soil structural stability index SSI of the water-stable aggregates are shown in Figure 4. Overall, the GMD, MWD, and SSI values exhibited similar trends, decreasing with soil depth across different land use practices. The MWD and GMD values for the five land use types ranged between 1.28 and 4.25 mm (Figure 4), and 0.54 and 3.14 mm, respectively. In the soil layers of 0–10 cm, 10–20 cm, and 20–30 cm, significant differences (p < 0.05) in the GMD and MWD values were observed between Y6th-zr and Y7th-rgl, while differences among the other land use types were not significant (p > 0.05). The mean values followed the pattern: Y6th-zr > Y6th-jgl > Y38th-y > Y38th-y + b > Y7th-rgl. Within the same soil layer, Y7th-rgl exhibited significantly different MWD and GMD values compared to the other four land use types (p < 0.05), with more pronounced differences among the three soil layers (p < 0.05).
In the 0–10 cm, 10–20 cm, and 20–30 cm soil horizons, the highest SSI values were consistently found in Y6th-zr, significantly higher than those in the other four land use types (p < 0.05), indicating the lowest risk of soil degradation (8.45%, 8.24%, and 7.89%)(Figure 4). The lowest SSI values were observed in Y7th-rgl, averaging 6.083%, indicating a high risk of soil degradation, followed by Y38th-y + b (6.18% on average). Y6th-zr and Y6th-jgl exhibited the highest SSI values, with averages of 8.19% and 7.40%, respectively.

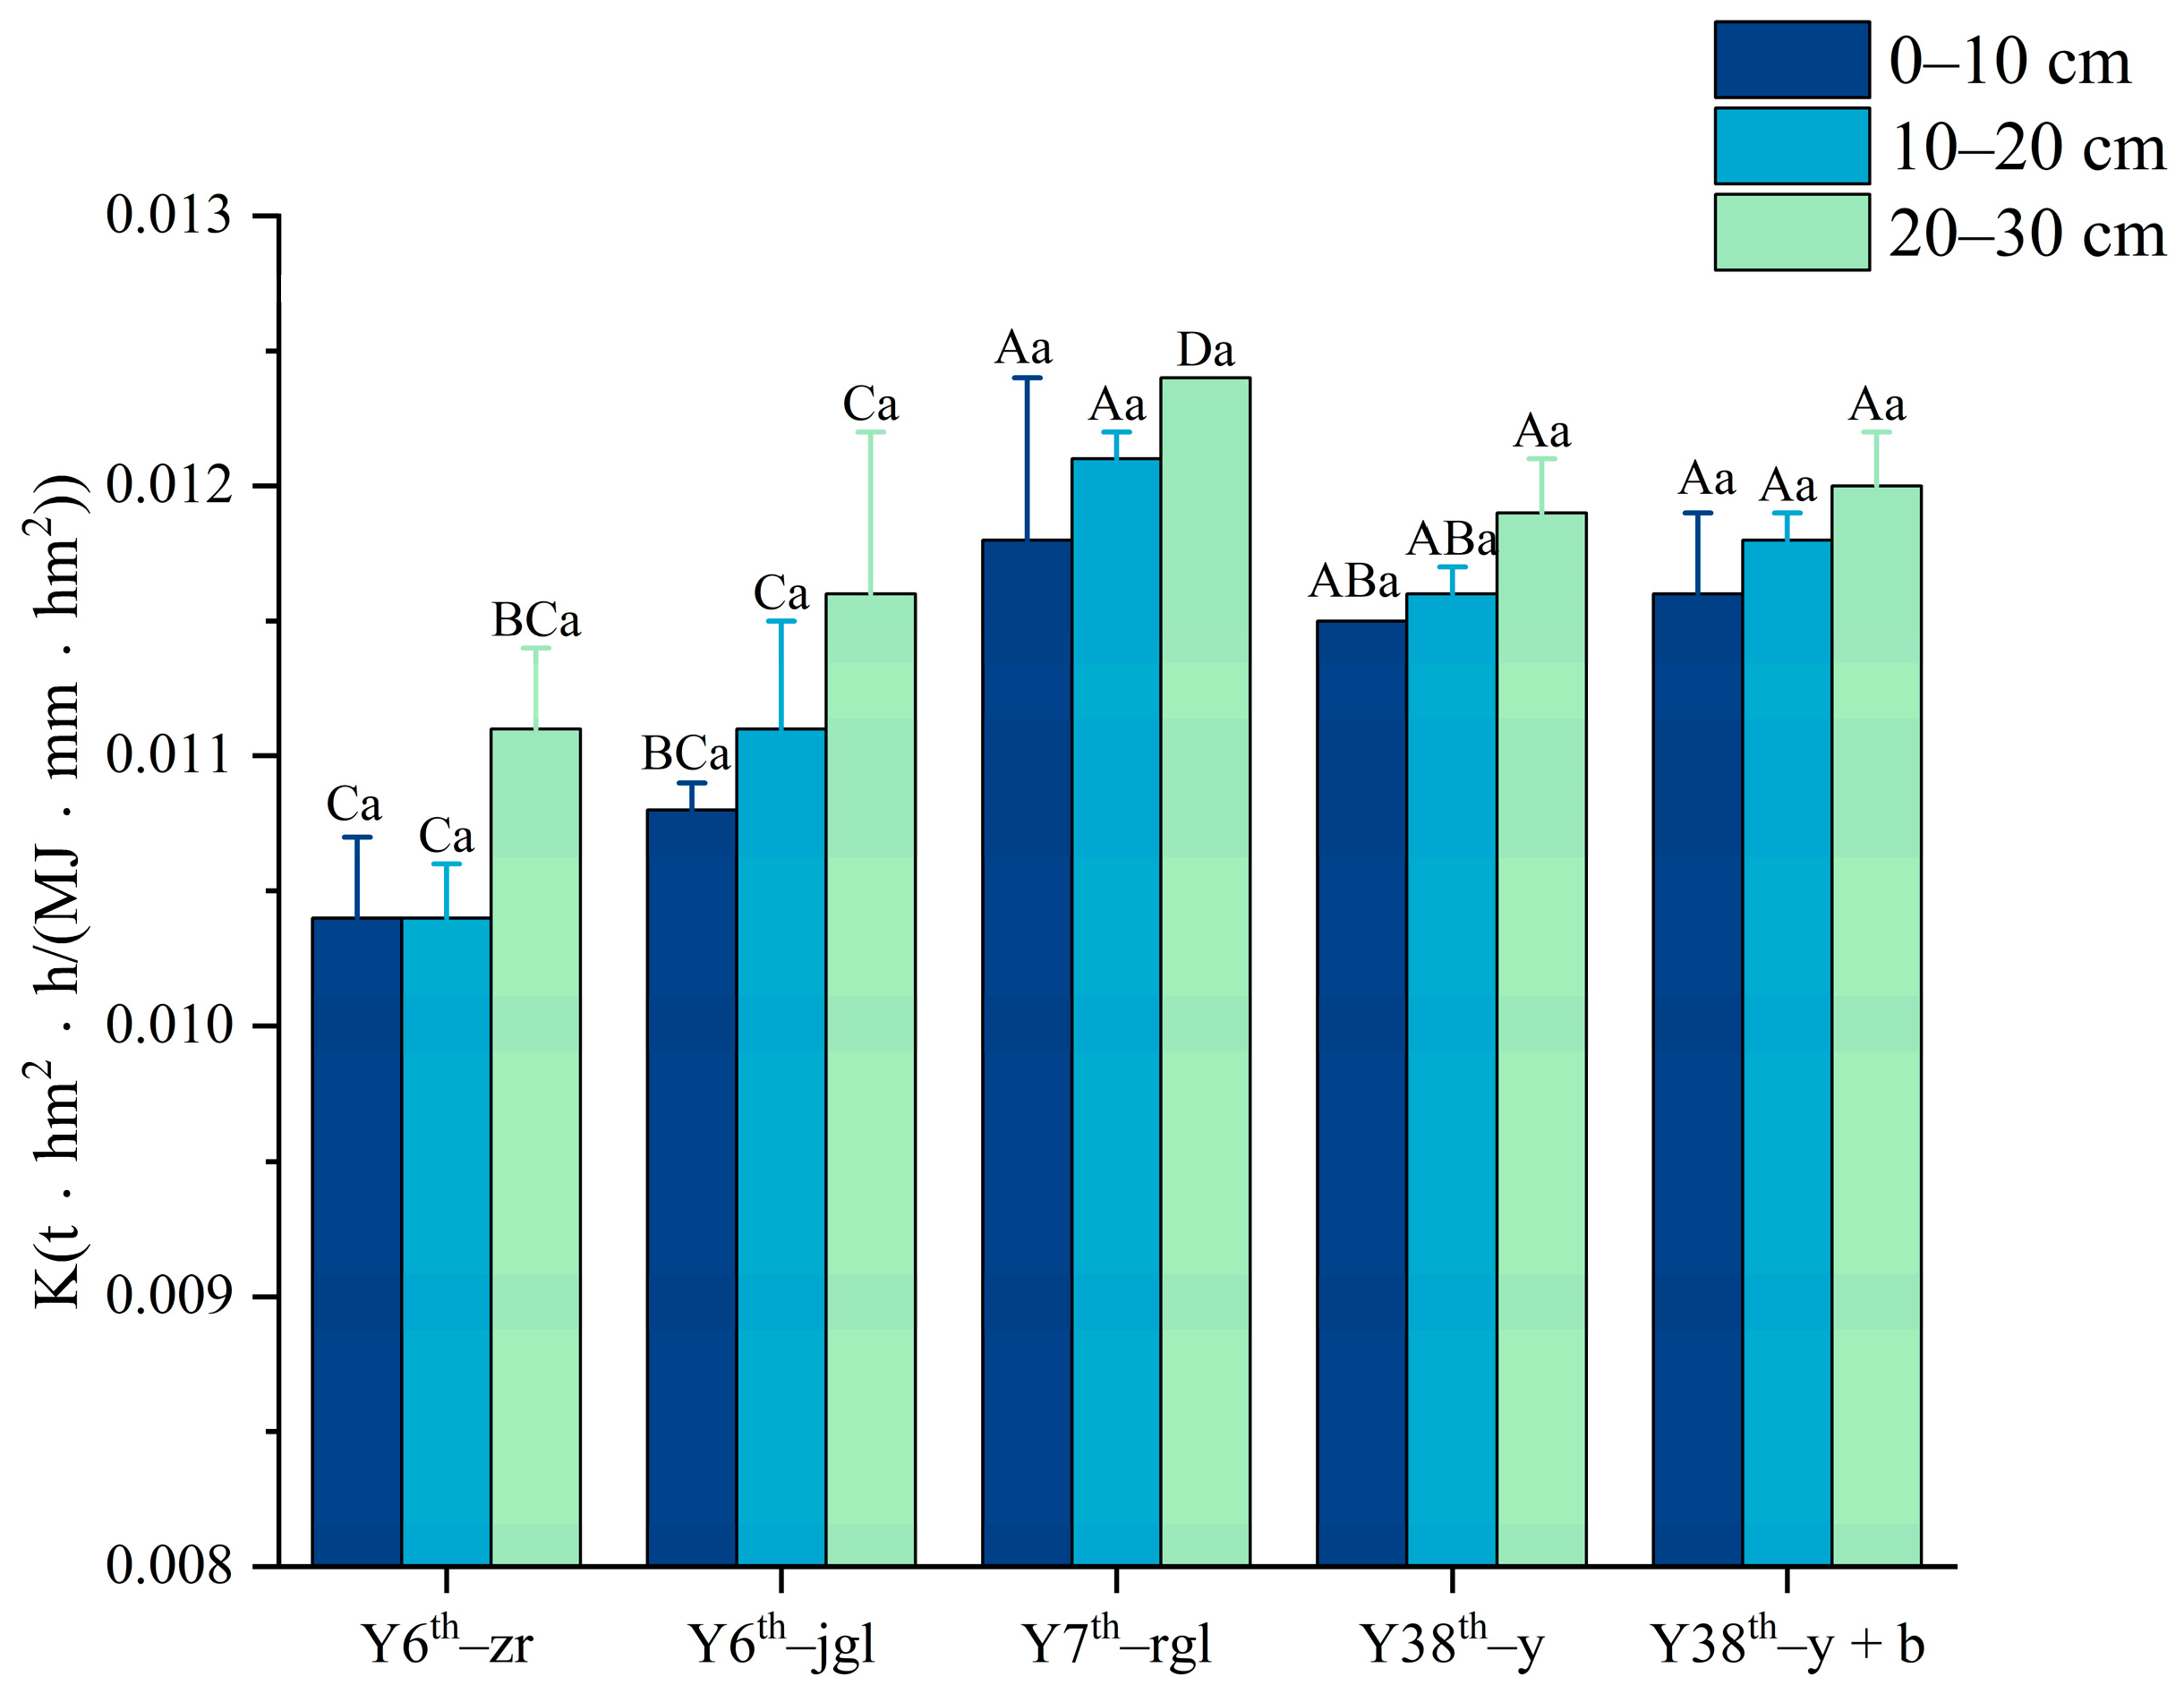
3.4. Effect of Land Use Practices on Soil Erodibility (K)

The soil erodibility K values obtained with the EPIC model are shown in Figure 5. The K values displayed an opposite trend to GMD, MWD, and SSI and were inversely proportional to soil depth, indicating that the topsoil layer was more resistant to erosion than the deeper layers, likely due to the higher organic carbon content in the top layer. In the 0–10, 10–20, and 20–30 cm soil horizons, Y6th-zr and Y6th-jgl had the lowest K values, averaging 0.0108 and 0.0114 t·hm2·h/(MJ·mm·hm2), respectively (Figure 5). Conversely, Y38th-y + b and Y7th-rgl had the highest K values (0.0121 t·hm2·h/(MJ·mm·hm2)), significantly higher than the other three land use categories (p < 0.05), indicating that Y6th-zr and Y6th-jgl had the strongest erosion resistance, while Y38th-y + b and Y7th-rgl had the weakest. The differences in K value changes among the five land use categories across the three soil layers were not significant (p > 0.05). The trends in K value changes were as follows: Y38th-y + b > Y38th-y > Y7th-rgl > Y6th-jgl > Y6th-zr.

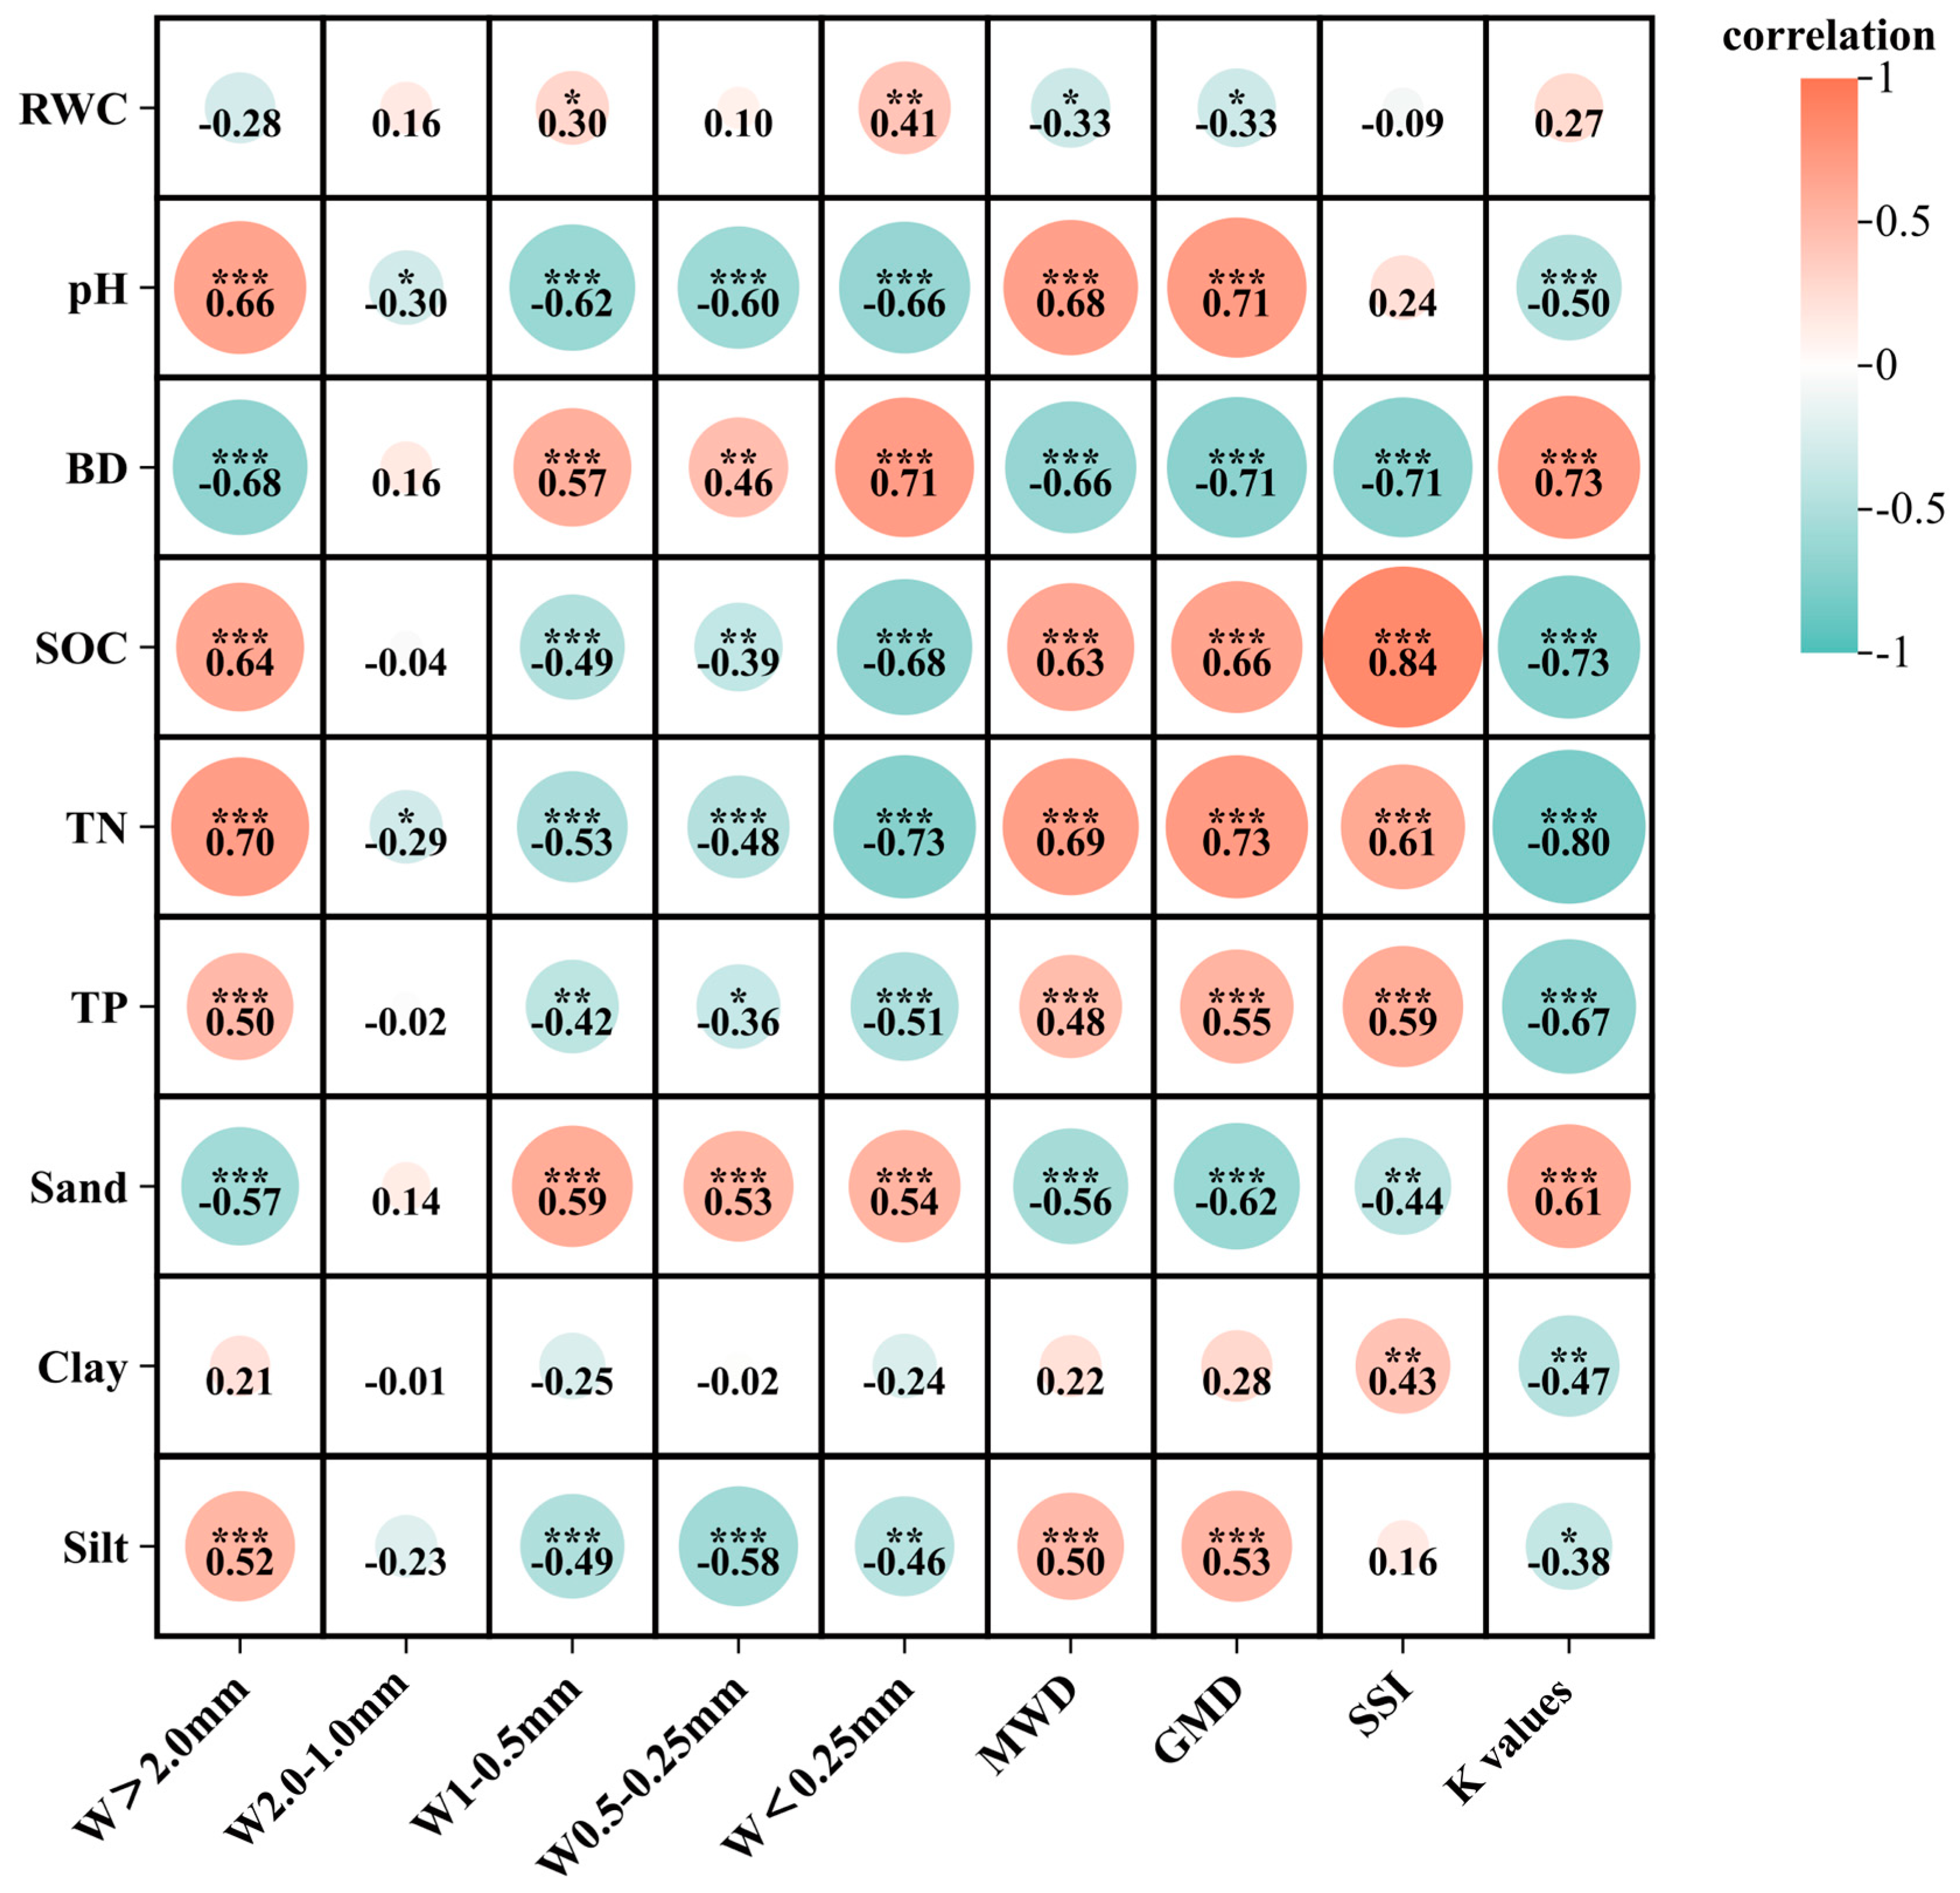
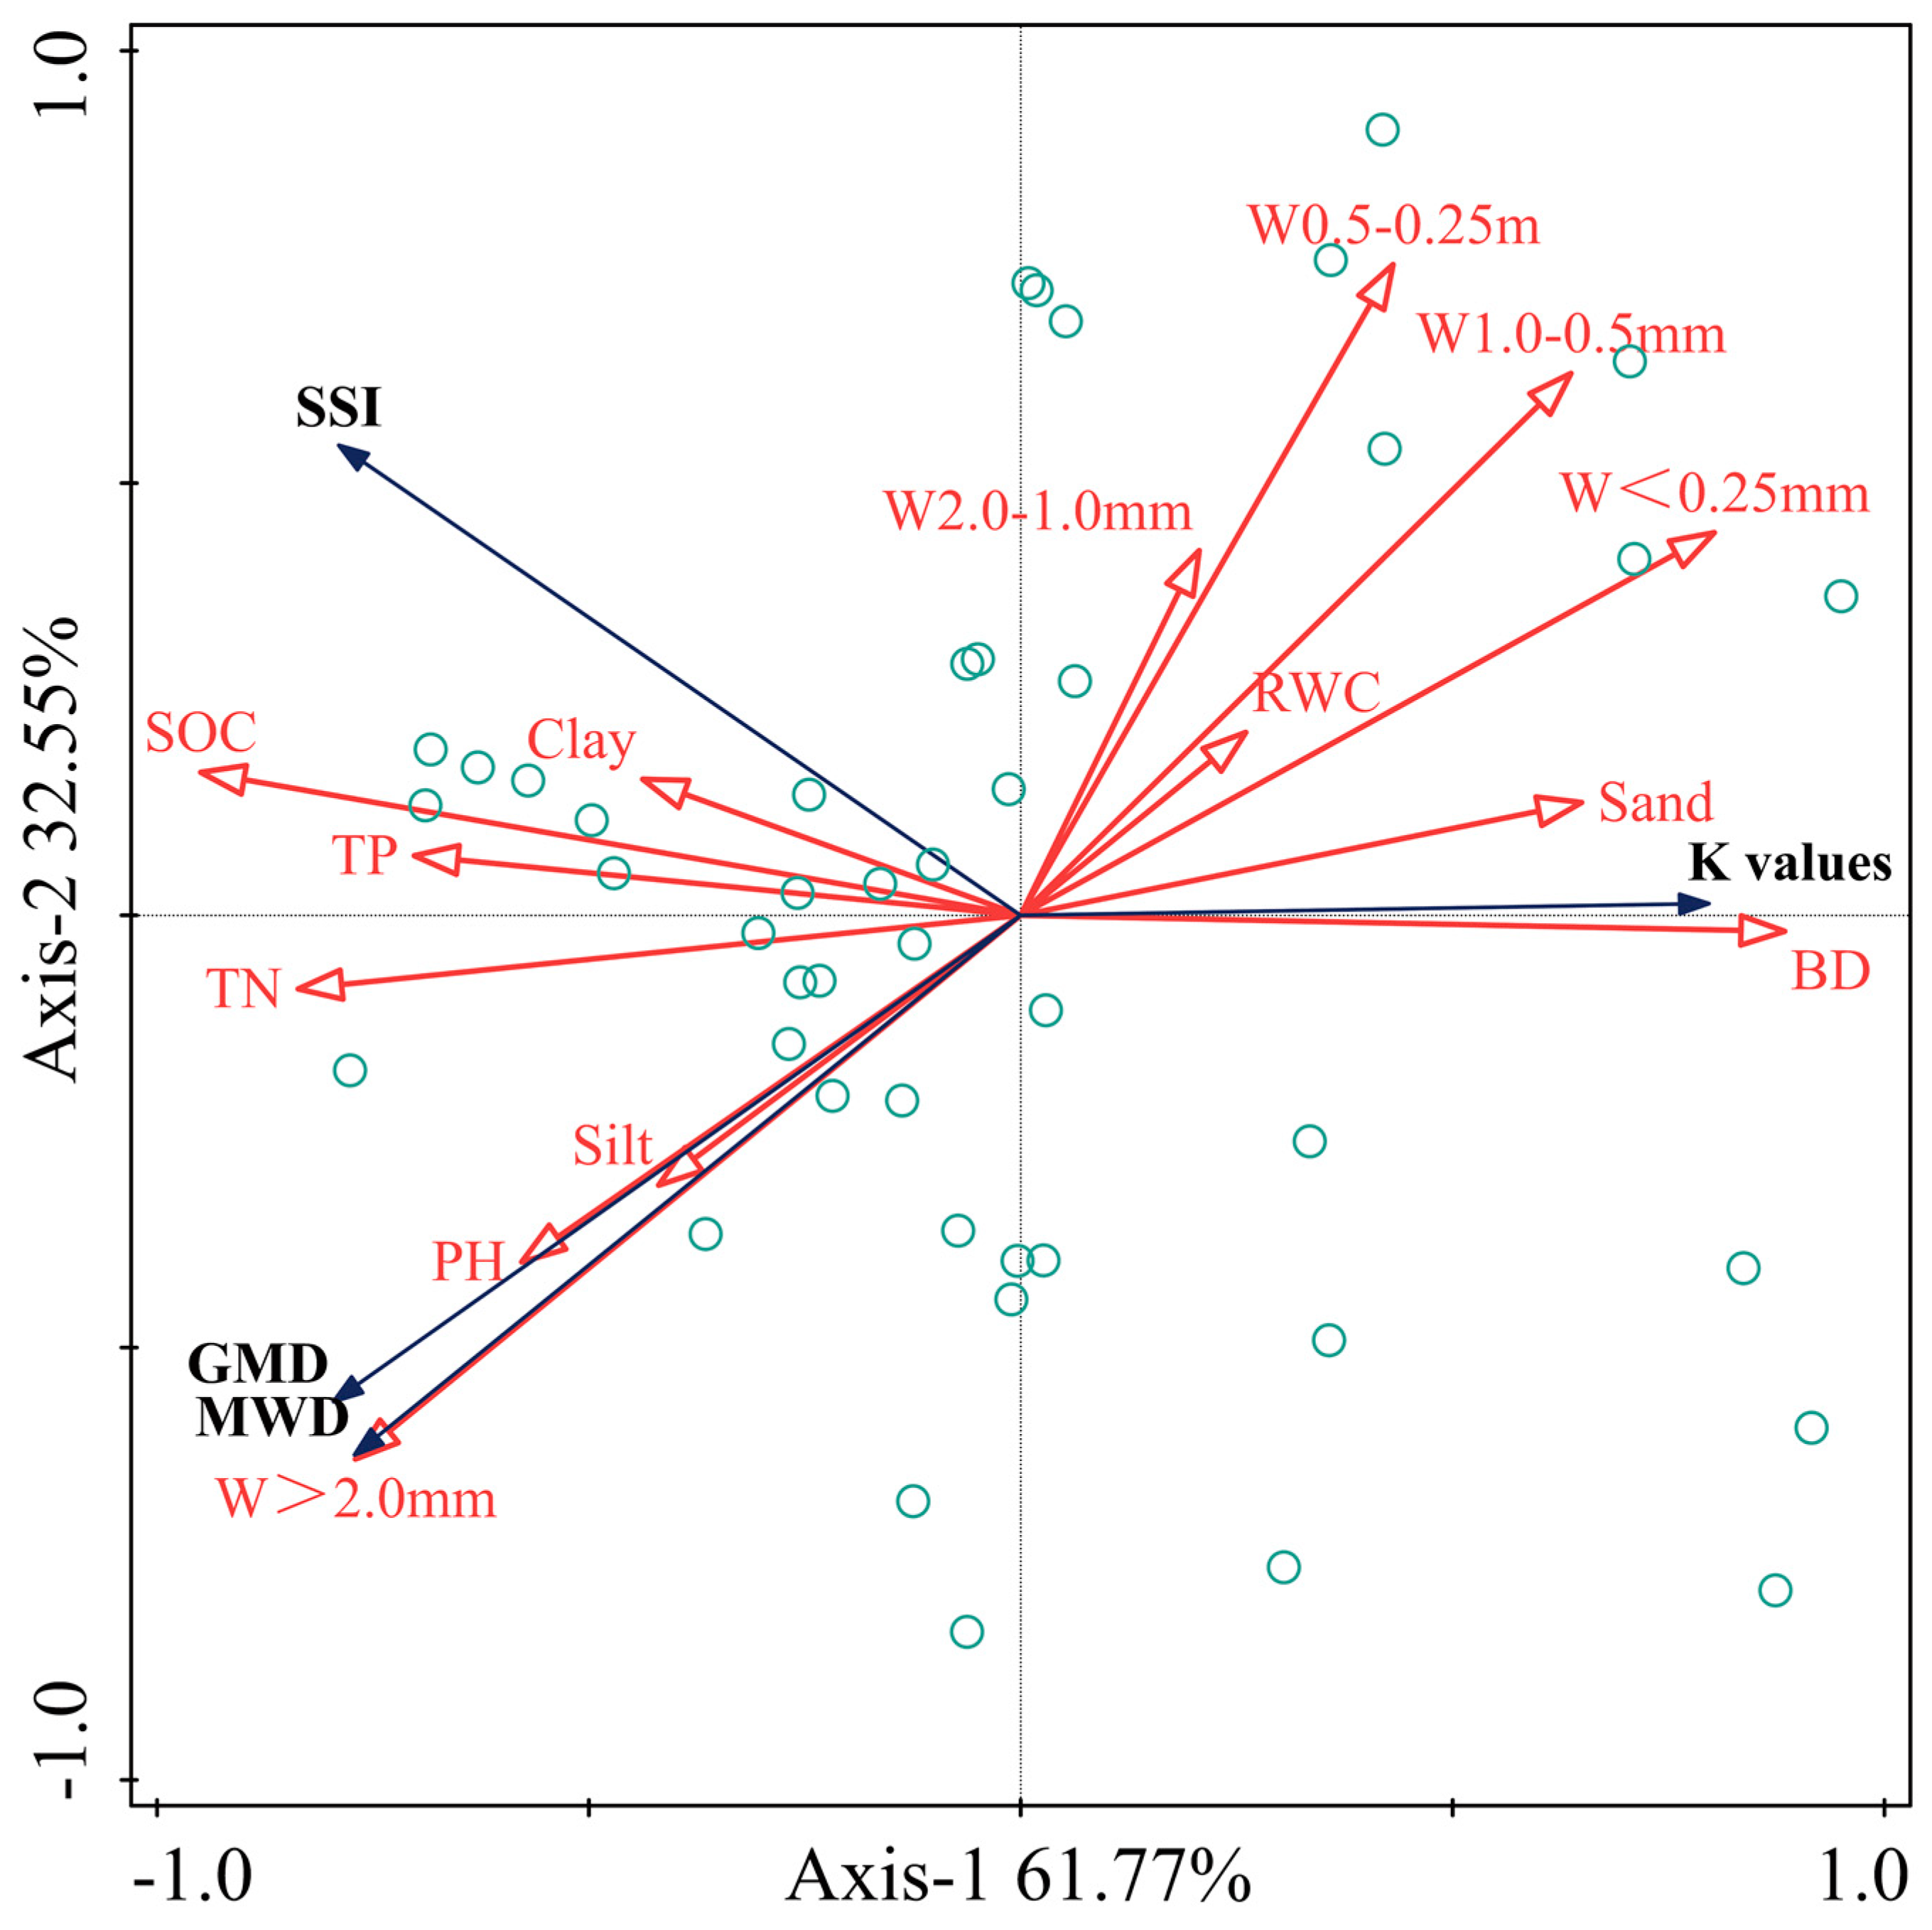
3.5. Correlation of Soil Aggregate Stability, Erodibility, and Soil Physical and Chemical Properties

The correlations between the percentage of water-stable soil aggregate fractions, MWD, GMD, K values, and soil properties are shown in Figure 6. SOC, TN, and TP exhibited highly significant positive correlations (p < 0.001) with the percentage of >2.0 mm soil aggregates, MWD, GMD, and SSI values, and significant negative correlations (p < 0.05) with the percentage of 2.0–0.25 mm soil aggregates and K values. Additionally, these factors had highly significant negative correlations (p < 0.001) with the percentage of <0.25 mm soil aggregates. This relationship is likely due to the higher carbon concentration in large aggregates, indicating that an increase in the proportion of macroaggregates significantly increases organic carbon content, as demonstrated by the high organic carbon and macroaggregate proportion in Y6th-zr in this study. RWC, BD, and sand content had highly significant negative effects (p < 0.001) on the proportion of >2.0 mm soil aggregates, MWD, GMD, and SSI values but significant positive effects (p < 0.01) on the proportions of 2.0–0.25 mm and <0.25 mm soil aggregates. Clay and silt contents positively influenced the proportion of >2.0 mm soil aggregates and had significant negative effects on the proportions of 2.0–0.25 mm and <0.25 mm soil aggregates, with the effect of silt content being particularly significant (p < 0.01). RWC, BD, and sand content also had highly significant positive correlations with K values (p < 0.001). These results indicate that SOC, TN, and silt content can enhance the stability of soil aggregates, while RWC and BD reduce aggregate stability and soil erosion resistance.
The results of the RDA for soil aggregate stability, erodibility, and soil physicochemical properties are shown in Figure 7. The cumulative explanation of soil physicochemical properties for aggregate stability and erodibility was 94.10%, with RDA1 explaining 61.77% of this cumulative explanation. The first two axes (RDA1 and RDA2) explained 99.76% of the total variation, indicating that RDA1 and RDA2 capture most of the effects of soil properties on soil aggregate stability and erodibility. SOC and the percentage of aggregates > 2.0 mm had high vector values. The explanatory rate of each factor for changes in aggregate stability and erodibility ranked in the following order: SOC > W>2.0 mm > W0.5–0.25 mm >Sand > W<0.25 mm > TN > TP > W2.0–1.0 mm > Clay > Silt > pH > BD > W1.0–0.5 mm > RWC.

4. Discussion

4.1. Impact of Land Use Patterns on Agglomerate Distribution

Water-stable aggregates are crucial in soil structure formation [28]. The content of large aggregates (>0.25 mm) is a key indicator for evaluating soil erosion: higher content of large aggregates indicates higher stability and lower erodibility, reducing the likelihood of erosion [16,17]. In this study, the percentage of macroaggregates was highest in Y6th-zr and lowest in Y7th-rgl, while microaggregates were highest in Y7th-rgl and lowest in Y6th-jgl (Figure 3). The results indicate that natural vegetation restoration and meridional forests exhibit optimal soil aggregate water stability, low structural damage rates, and more structurally stable soils. In contrast, plantation forests demonstrate poorer water stability and higher structural damage rates, which differs from the findings by Gan et al. [29]. The plantation forest soils had a higher sand content and lower powder and clay particle content (Figure 2), resulting in a looser soil structure. Conversely, Y6th-zr and Y6th-jgl soils had a lower sand content, higher powder and clay particle content, and more stable soil structures [12]. The >0.25 mm agglomerates of Y38th-y, Y38th-y + b, and Y6th-jgl were more stable than those of Y38th-y, Y38th-y + b, and Y6th-jgl. The 0.25 mm aggregates decreased with deeper soil layer depth, as is consistent with Ding et al. who studied macroaggregate content in cultivated purple soil slopes in Hechuan, Chongqing, and Chuxiong, Yunnan [30]. Fertilizer application in the 0–10 cm soil layer increases organic matter, which enhances soil particle aggregation [28]. In contrast, the 10–30 cm soil layer exhibits compaction, poor aeration and permeability, and low organic matter activity, inhibiting aggregate formation and poor water stability. Therefore, applying organic fertilizers to sloping farmland can improve soil structure and reduce disturbance from cultivation. Compared to macroaggregates and microaggregates, the change in 0.25–2.0 mm aggregates was relatively stable. Larger aggregates (>2.0 mm) are more likely to be decomposed by rain or wind erosion, which physically disrupts the formation of larger water-stable aggregates [31].

4.2. Impact of Different Land Uses on Stability

Soil aggregate stability plays a significant role in influencing the breakdown and dispersion of aggregates, leading to phenomena such as soil crusting, infiltration, and erosion [32]. MWD and GMD are crucial for assessing aggregate stability; higher values indicate more stable aggregates and greater erosion resistance [8,14]. In the present study, high GMD and MWD were prevalent in 0–10 cm (Figure 4), consistent with the findings of Peng et al. [14]. This may be attributed to the large proportion of macroaggregates (86.10–98.04%) in this soil layer. The presence of decomposing root matter and mycelium in the macroaggregates can increase the concentration of organic carbon [33]. Additionally, organic carbon and clay in the 0–10 cm layer are easily mined and migrated during soil erosion and deposition, weakening the aggregate effect and decreasing macroaggregate content with depth [34,35]. Therefore, GMD and MWD values are higher in the 0–10 cm layer, indicating a more stable soil structure. Soil aggregate stability was highest in Y6th-zr, followed by Y6th-jgl and farmland sequences, and lowest in Y7th-rgl, which may be due to the higher content of powder particles in Y6th-zr (Figure 2), which are key to forming microaggregates. Powder particles store particulate organic matter [28] and organic carbon [8], enhancing soil aggregation. In contrast, Y7th-rgl had a lower powder particle and organic carbon content, resulting in poorer soil aggregation and lower structural stability [28]. Plantation forests are subject to greater interference from anthropogenic activities during afforestation and forest management, resulting in lower soil structural stability. In the farmland sequence, soil stability in Y38th-y + b was significantly lower than in Y38th-y. This difference is due to tilling of the soil during the planting process (one month before the maturity period of maize, with intercropping cabbage), which led to a low content of organic carbon and macroaggregates. These were lost with slope runoff under conditions of loose soil, water erosion, and wind erosion. Additionally, the soil texture content of the soil itself (Figure 2: sandy grains, powdery grains, and clay particles) differed significantly between Y38th-y + b and Y38th-y (Figure 2), making Y38th-y + b’s soil structure more vulnerable. Therefore, natural vegetation restoration can protect the integrity of soil macroaggregates, thereby improving the stability of soil aggregates.
SSI, calculated from soil texture and organic matter, quantifies structural stability. Organic carbon and clay particles are essential components in the formation of soil aggregates [28,36]. In this study, except for Y6th-zr, which had an SSI value greater than 7%, all other land classes had SSI values lower than 7%, indicating that Y6th-zr had the lowest risk of soil structure degradation. The lower risk in Y6th-zr may be due to natural vegetation restoration measures that favored the production of cementing materials such as SOC, which improved soil aggregation [28], as was also confirmed by the highest organic carbon content found in Y6th-zr (Figure 2). Conversely, the higher risk of degradation in Y7th-rgl may be due to the critical role of organic carbon and total nitrogen in maintaining soil structure stability under erosion [37]. The low organic carbon and total nitrogen contents in Y7th-rgl and sloping cropland resulted in their low SSI values (Figure 2). It can be seen that the agricultural cultivation of land use for many years will lead to a decrease in soil stability, and appropriate fallow, that is, natural vegetation restoration, can be carried out after agricultural cultivation to enhance the cohesion of soil aggregates and improve soil stability.

4.3. Study of Soil Erodibility under Different Land Uses

The soil erodibility K value reflects the soil’s intrinsic properties and its sensitivity to external erosion forces, which are closely related to the stability of soil aggregates [38,39]. A larger K value indicates weaker soil erosion resistance [1]. In this study, Y7th-rgl and sloping cultivated land had the highest K values among the three different soil horizons, while Y6th-zr and Y6th-jgl had the lowest K values. Y38th-y + b had the highest K value among the sloping cultivated lands, followed by Y38th-y. These findings indicate that in the 0-30 cm soil layer, sloping cultivated land had the lowest soil erosion resistance, while Y6th-zr had the strongest. This is contrary to the results of a soil erodibility study of red soil in central Yunnan, which may be due to the fact that red soil in central Yunnan has a large content of powder and clay grains (80 to 90%) [40], whereas the soil structure is extremely unstable in karstic rocky desertification areas due to the high content of gravel and high content of sand grains [19,20], and sloping arable land has been greatly damaged by man-made (by conversion of slopes to terraces, fertilizer application, plowing, etc.) and natural factors (water erosion, wind erosion, etc.), with the destruction of agglomerations. Cultivated land lacks humus and organic matter, and the structure and stability of soil aggregates are poor, resulting in weakened soil erosion performance. The lack of humus and organic matter in cultivated land further weakens soil structure and stability, reducing erosion resistance. Y38th-y + b had the lowest erosion resistance due to differences in agricultural practices (tilling intercrop of cabbage one month before maize maturity) compared to Y38th-y. Y38th-y + b had lower sand and macroaggregate contents than Y38th-y (Figure 2 and Figure 3), resulting in poorer soil aggregate cohesion and weaker erosion resistance [41,42]. Y6th-zr had a higher vegetation cover (76%), which helped prevent soil structure damage and enhanced structural stability. The growth of plant root systems facilitated the production of cementing materials [28], improving soil organic matter content and contributing to the production of powder and clay content (Figure 3), which enhanced the soil consolidation capacity and resistance to erosion.

4.4. Correlation of Soil Aggregate Characteristics with Erodibility

In this study, SOC and TN contents had a significant positive effect on the proportion of >2.0 mm soil aggregates while negatively affecting < 0.25 mm aggregates, consistent with the findings of Dou et al. [8]. The formation of soil aggregates involves roots and mycelium bonding to form macroaggregates, with microaggregates forming at the center. Over time, roots and mycelium decompose, and their residues become covered by mucus and clay, eventually forming microaggregates within macroaggregates [17]. The water stability of macroaggregates relies on temporary binding agents (roots and mycelium), whereas the water stability of microaggregates depends on persistent organic binding agents (polyvalent cations and organic acids) [16]. A well-developed plant root system increases SOC, promoting the formation of large aggregates. Thus, organic carbon positively affects macroaggregate formation across different land types. RWC had a highly significant positive effect on the proportion of 2.0–0.25 mm and <0.25 mm soil aggregates. At higher RWC, water enters soil pore spaces, causing the macroaggregate structure to break down due to extrusion and collision from moisture absorption [43]. However, RWC had a significantly negative correlation with MWD and GMD (p < 0.05) and a significantly positive correlation with K values. Higher RWC leads to a sparser soil structure, decreasing soil aggregate stability and weakening erosion resistance, resulting in the loss of the soil’s physical structure [8]. A stable soil structure condenses and releases fewer soil particles [44]. Organic carbon content showed a highly significant positive correlation with MWD, GMD, and SSI, as well as a negative correlation with K. The higher organic matter content likely results in more frequent microbial activities in the soil, leading to a faster refinement rate of soil particles and a lower soil bulk density. These conditions contribute to the gelling action of soil aggregates, increasing the chances of aggregate formation, their number, and stability, thereby enhancing the soil’s erosion resistance [45].

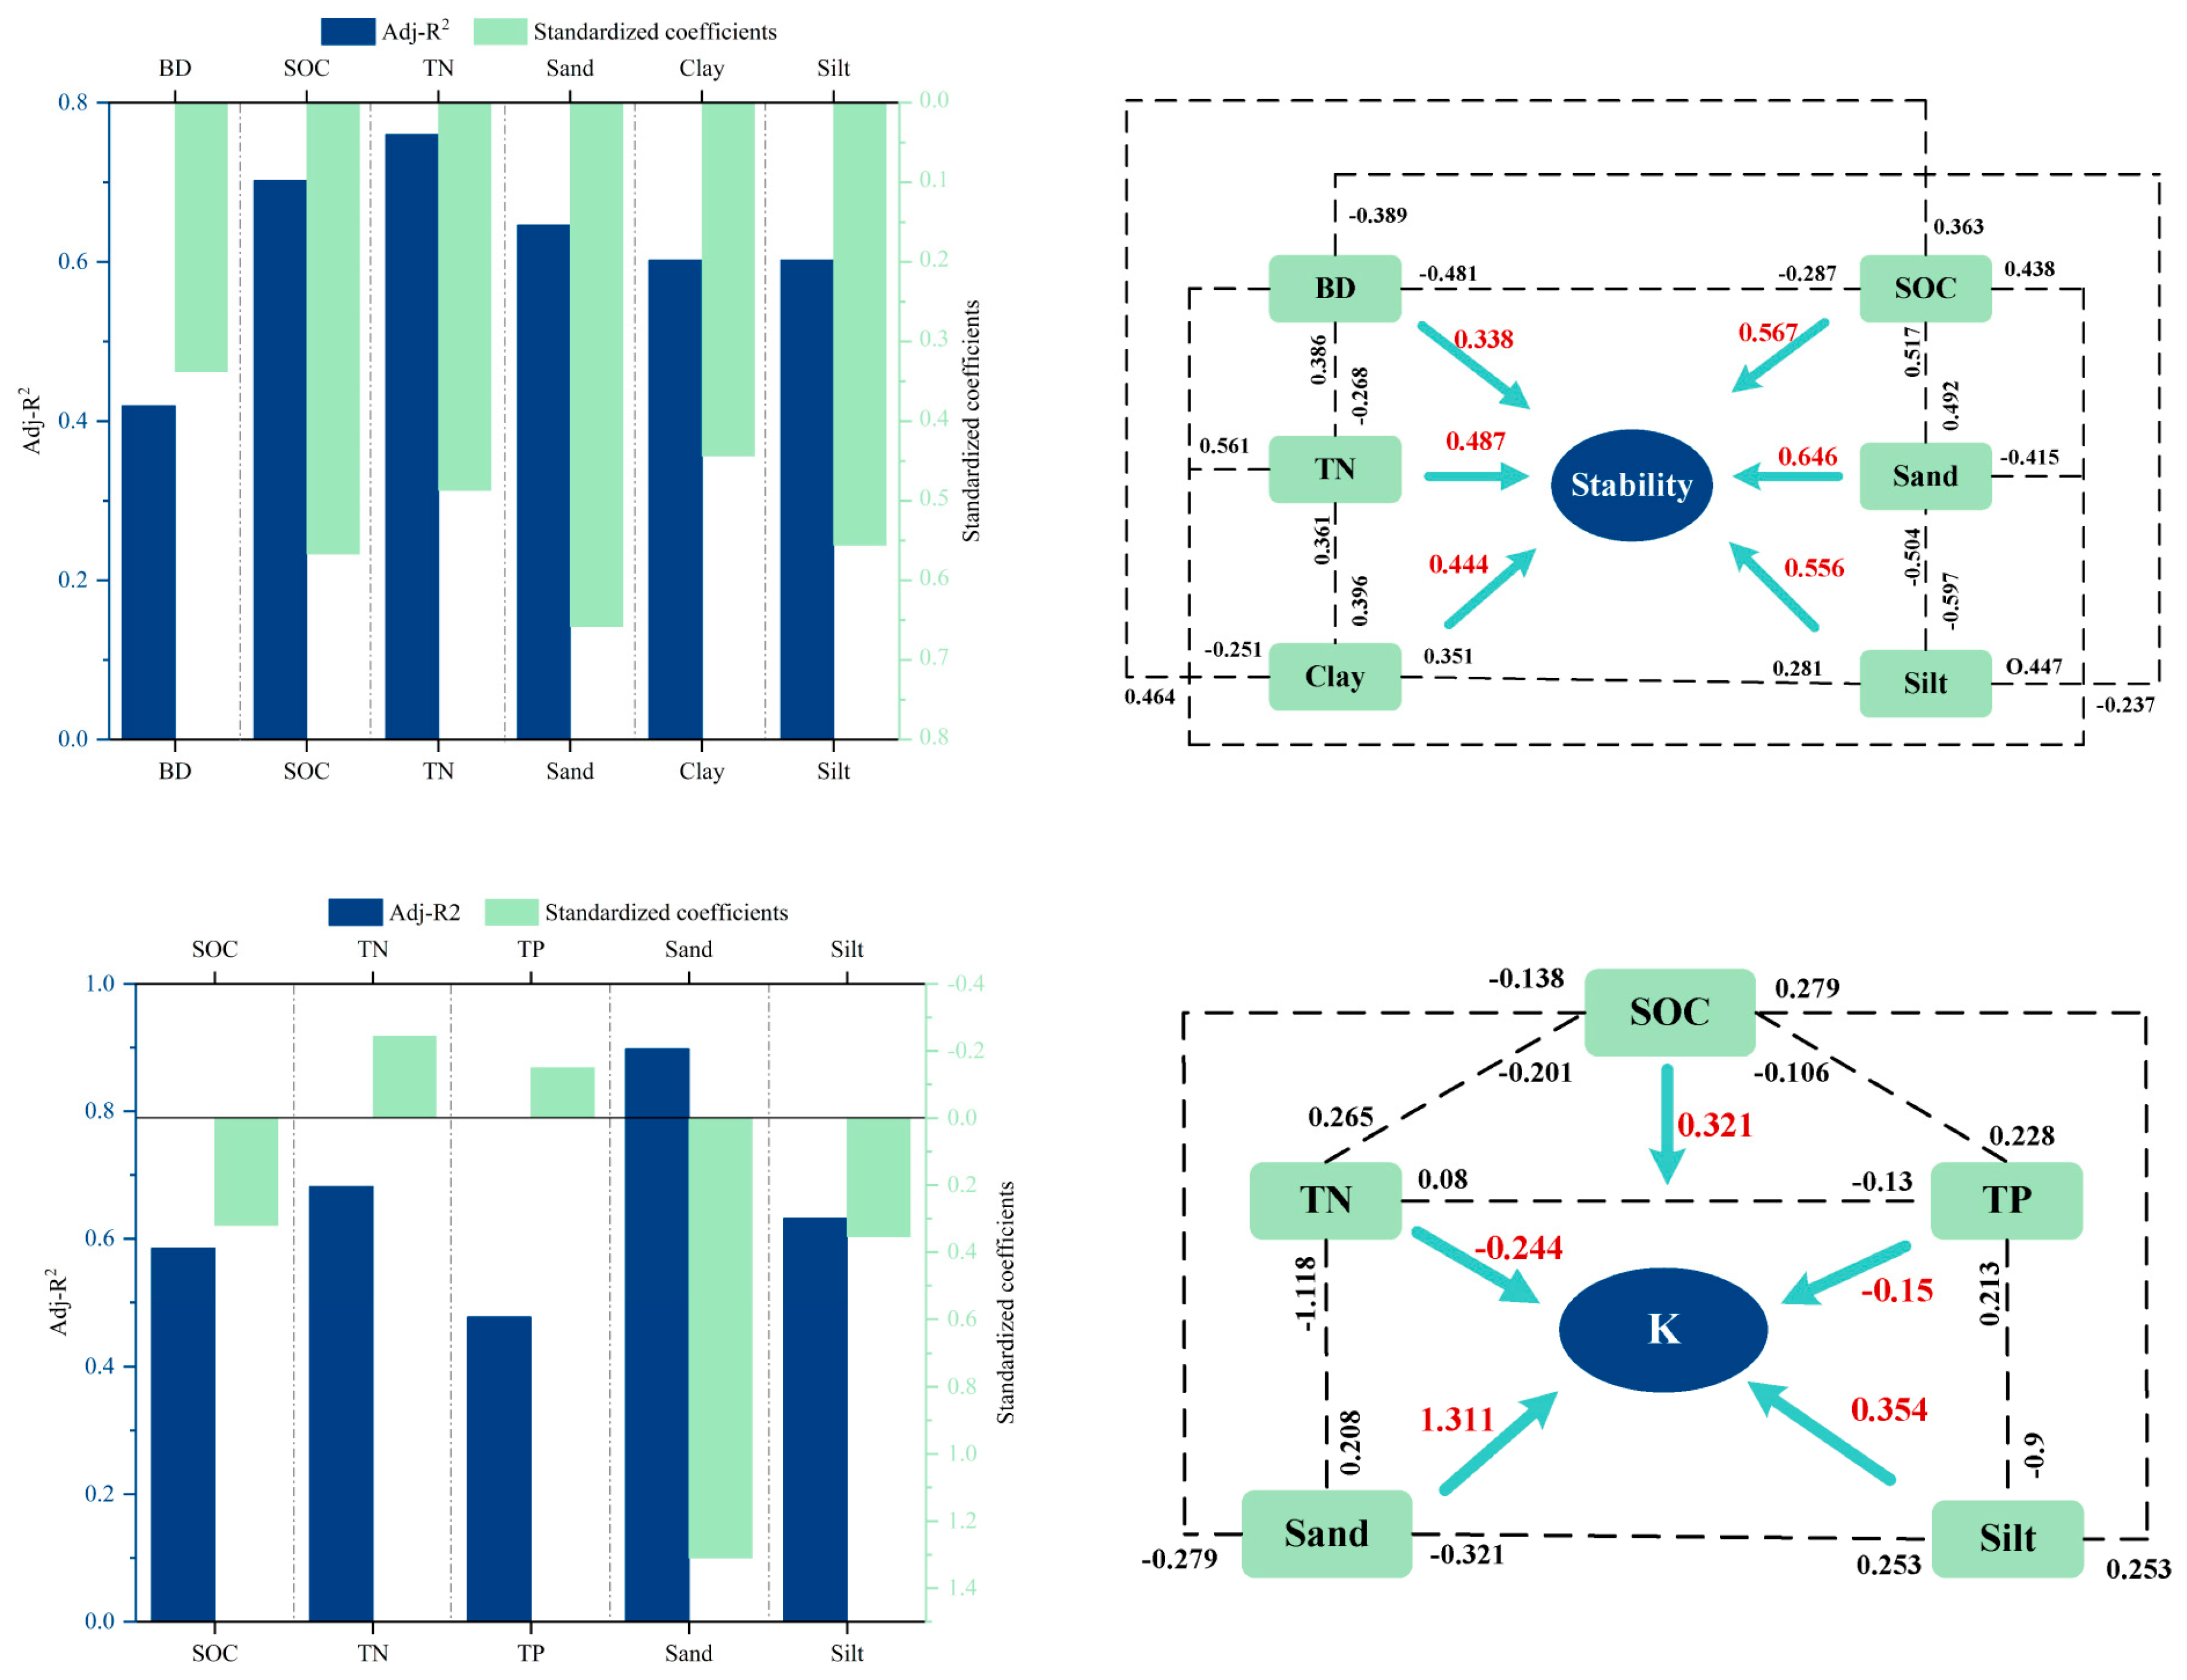
4.5. Key Factors Affecting the Stability and Erodibility of Soil Aggregates

According to the explanatory rate of each soil factor on the changes in soil aggregate stability and erodibility, the importance of each factor was as follows: SOC > W>2.0 mm > W0.5–0.25 mm > Sand > W<0.25 mm > TN > TP > W2.0–1.0 mm > Clay > Silt > pH > BD > W1.0–0.5 mm > RWC (Figure 7). However, the covariance between these factors needs to be addressed. In this study, regression and path analyses were used to identify the specific soil factors affecting soil aggregates’ stability and K value. When we carried out the determination of key variables, we considered that there was a serious multicollinearity problem between two variables with R > 0.8, such as SOC and SSI values; in order to determine the variables affecting the stability and erodibility more precisely, we increased the sample size and carried out regression analysis and through-trail analysis again, and we finally came up with the key variables affecting the stability coefficients and the erodibility, as shown in Figure 8. Among them, sand and SOC had the greatest influence on stability, with direct path coefficients of 0.646 and 0.567, respectively. The effective specific surface area and adsorption capacity of clay bind soil particles and microaggregates, accelerating the formation of large aggregates and enhancing soil aggregate stability. A decrease in soil bulk density is often accompanied by an increase in organic carbon and total nitrogen content [8] (which was also confirmed in the present study (Figure 2), demonstrating that SOC and TN are positively correlated with >2.0 mm agglomerate content, while BD negatively correlates with it, thereby affecting soil aggregate stability [46].
Sand and silt content had the largest direct path coefficients on K values, 1.311 and 0.354, respectively, which were much higher than other factors (TN, TP, and SOC), further proving the important roles of soil sands and silts in determining soil erodibility. The high indirect path coefficient of TN affecting K values through sand (−1.118) suggests that TN primarily acts through binding with sand, and this effect may be mitigated by the high permeability properties of sandy soil particles [47].
Therefore, maintaining higher inputs of organic carbon is beneficial for promoting the formation and structural stabilization of macroaggregates, improving aggregate stability, enhancing soil erosion resistance, and reducing soil erodibility under different land use practices.

5. Conclusions

In this study, soil stability and erodibility were investigated under five different land use types in the Chishui River Basin in the karstic rocky desertification region of southwest China, and the results showed that different land use modes had a significant effect on soil aggregate stability and erodibility, in which the natural vegetation restoration (Yera 6th-zr) helped to improve the stability of the soil structure; the plantation forest (Year 7th-rgl) land use type has weaker aggregate stability and erodibility, and needs measures to improve it. For example, natural vegetation restoration measures can be carried out to increase vegetation cover and improve soil structure; organic carbon (SOC), total nitrogen (TN), phosphorus (TP), bulk density (BD), sand, clay, and silt in the soil are the main factors affecting soil stability and erodibility. The results of this study provide important information for understanding the changes in soil erodibility and aggregate stability under different land use practices in southwest China. Considering the transition zone between the study areas, more soil samples and different land use time series need to be analyzed in the future to determine the dominant factors and their mechanisms affecting soil erodibility under different cropping time series.

Author Contributions

Y.S. conceived and designed study; M.L. and X.M. performed the experiments; M.L. and M.F. analyzed data; M.L. and K.W. contributed reagents/methods/analysis tools; M.L. and Y.S. wrote the paper. All authors have read and agreed to the published version of the manuscript.

Funding

This research was supported by Science and Technology Project of Yunnan Province (202203AC100001-03), the First-Class Discipline Construction Project of Yunnan Province ([2022] No. 73), and The National Undergraduate Innovation and Entrepreneurship Training Program (202310677012).

Data Availability Statement

The data presented in this study are available on request from the corresponding author (The data are not publicly available due to privacy or ethical restrictions).

Acknowledgments

The authors thank the following people for their help with this research: Wen Chen, Zheng Hou, Donghui Zhang, Lirong Shi, and Ao Li provided field assistance.

Conflicts of Interest

The authors declare no conflicts of interest.

References

  1. Chen, S.; Zhang, G.; Zhu, P.; Wang, C.; Wan, Y. Impact of Land Use Type on Soil Erodibility in a Small Watershed of Rolling Hill Northeast China. Soil Till Res. 2023, 227, 105597. [Google Scholar] [CrossRef]
  2. Li, Q.; Lu, G.; Han, X.; Zhou, Z.; Zeng, T.; Yu, M.; Wang, H. Responses of Storm-Based Soil Erosion Processes to Land Use Changes in the Upper Huaihe River Basin, China. Environ. Earth Sci. 2020, 79, 375. [Google Scholar] [CrossRef]
  3. Keesstra, S.; Mol, G.; De Leeuw, J.; Okx, J.; Molenaar, C.; De Cleen, M.; Visser, S. Soil-Related Sustainable Development Goals: Four Concepts to Make Land Degradation Neutrality and Restoration Work. Land 2018, 7, 133. [Google Scholar] [CrossRef]
  4. Zhang, W.C.; Wu, W.; Liu, H.B. Planting Year-and Climate-Controlled Soil Aggregate Stability and Soil Fertility in the Karst Region of Southwest China. Agronomy 2023, 13, 2962. [Google Scholar] [CrossRef]
  5. Anderson, R.; Brye, K.R.; Wood, L.S. Soil Aggregate Stability as Affected by Land use and Soil Properties in the Lower Mississippi River Valley. Soil Sci. Soc. Am. J. 2019, 83, 1512–1524. [Google Scholar] [CrossRef]
  6. Li, Y.; Yu, P.; Shen, L. Changes in Soil Aggregate Stability and Aggregate-Associated Organic Carbon during Old-Field Succession in Karst Valley. Environ. Monit. Assess. 2022, 194, 15. [Google Scholar] [CrossRef] [PubMed]
  7. Nie, X.; Li, Z.; Huang, J.; Liu, L.; Xiao, H.; Liu, C.; Zeng, G. Thermal stability of organic carbon in soil aggregates as affected by soil erosion and deposition. Soil Till Res. 2018, 175, 82–90. [Google Scholar] [CrossRef]
  8. Dou, Y.; Yang, Y.; An, S.; Zhu, Z. Effects of Different Vegetation Restoration Measures on Soil Aggregate Stability and Erodibility on the Loess Plateau, China. CATENA 2020, 185, 104294. [Google Scholar] [CrossRef]
  9. Canisares, L.P.; Cherubin, M.R.; Da Silva, L.F.S.; Franco, A.L.C.; Cooper, M.; Mooney, S.J.; Cerri, C.E.P. Soil Microstructure Alterations Induced by Land Use Change for Sugarcane Expansion in Brazil. Soil Use Manag. 2020, 36, 189–199. [Google Scholar] [CrossRef]
  10. Wang, H.; Wang, J.; Zhang, G. Impact of Landscape Positions on Soil Erodibility Indices in Typical Vegetation-Restored Slope-Gully Systems on the Loess Plateau of China. CATENA 2021, 201, 105235. [Google Scholar] [CrossRef]
  11. Tisdall, J.M.; Oades, J.M. Organic matter and water—Stable aggregates in soils. J. Soil Sci. 1982, 33, 141–163. [Google Scholar] [CrossRef]
  12. Liu, Y.; Ma, M.; Ran, Y.; Yi, X.; Wu, S.; Huang, P. Disentangling the effects of edaphic and vegetational properties on soil aggregate stability in riparian zones along a gradient of flooding stress. Geoderma 2021, 385, 114883. [Google Scholar] [CrossRef]
  13. Chen, S.; Zhang, G.; Zhu, P.; Wang, C.; Wan, Y. Impact of Slope Position on Soil Erodibility Indicators in Rolling Hill Regions of Northeast China. CATENA 2022, 217, 106475. [Google Scholar] [CrossRef]
  14. Peng, J.; Wang, J.; Yang, Q.; Long, L.; Li, H.; Guo, Z.; Cai, C. Spatial Variation in Soil Aggregate Stability and Erodibility at Different Slope Positions in Four Hilly Regions of Northeast China. CATENA 2024, 235, 107660. [Google Scholar] [CrossRef]
  15. Wang, H.; Gao, J.B.; Hou, W.J. Quantitative attribution analysis of soil erosion in different geomorphological types in karst areas: Based on the geodetector method. J. Geogr. Sci. 2019, 29, 271–286. [Google Scholar] [CrossRef]
  16. Okolo, C.C.; Gebresamuel, G.; Zenebe, A.; Haile, M.; Eze, P.N. Accumulation of Organic Carbon in Various Soil Aggregate Sizes under Different Land Use Systems in a Semi-Arid Environment. Agric. Ecosyst. Environ. 2020, 297, 106924. [Google Scholar] [CrossRef]
  17. Melese, T.; Senamaw, A.; Belay, T.; Bayable, G. The Spatiotemporal Dynamics of Land Use Land Cover Change, and Its Impact on Soil Erosion in Tagaw Watershed, Blue Nile Basin, Ethiopia. Glob. Chall. 2021, 5, 2000109. [Google Scholar] [CrossRef] [PubMed]
  18. Aneseyee, A.B.; Elias, E.; Soromessa, T.; Feyisa, G.L. Land Use/Land Cover Change Effect on Soil Erosion and Sediment Delivery in the Winike Watershed, Omo Gibe Basin, Ethiopia. Sci. Total Environ. 2020, 728, 138776. [Google Scholar] [CrossRef] [PubMed]
  19. Liang, P.; Wang, X.; Xu, Q.; Zhang, J.; Fang, R.; Fu, Z.; Chen, H. Lithology-mediated soil erodibility characteristics after vegetation restoration in the karst region of Southwest China. Land. Degrad. Dev. 2024, 35, 1074–1086. [Google Scholar] [CrossRef]
  20. Chang, J.; Li, Q.; Zhai, L.; Liao, C.; Qi, X.; Zhang, Y.; Wang, K. Comprehensive assessment of rocky desertification treatment in Southwest China karst. Land. Degrad. Dev. 2024, 35, 3461–3476. [Google Scholar] [CrossRef]
  21. Wang, H.; Zhang, G.; Wang, J. Plant community near-surface characteristics as drivers of soil erodibility variation along a slope gradient in a typical semiarid region of China. CATENA 2022, 212, 106108. [Google Scholar] [CrossRef]
  22. Zhang, K.Q.; Xu, M.; Jia, Z.L. The quantitative assessment of the ecological assets of plateau mountain cities based on GIS and remote sensing: A case study of Kunming, Yunnan Province, China. Ecol. Sci. 2023, 42, 124–134. [Google Scholar] [CrossRef]
  23. Chen, Z.F.; Li, J.; Duan, Q.S.; Wang, Y.; Xiang, B.; Ning, D.W. Evaluation of soil erosion and nutrient loss of slope farmland in Yunnan Province using USLE model, China. Trans. Chin. Soc. Agric. Eng. 2022, 38, 124–134. [Google Scholar] [CrossRef]
  24. Li, X.Z.; Hu, C.Y.; Yang, F.; Han, G.Z. Influence of Land Use Changes on Evolution of Different K Forms in Purple Paddy Soils, China. Acta Pedol. Sin. 2023, 60, 685–693. [Google Scholar] [CrossRef]
  25. Pieri, C. Fertility of soils. In A Future for Farming in the West African Savannah; Springer: Berlin/Heidelberg, Germany, 1992; p. 348. [Google Scholar]
  26. Williams, J.R.; Renard, K.G.; Dyke, P.T. EPIC: A new method for assessing erosion’s effect on soil productivity. J. Soil Water Conserv. 1983, 38, 381–383. [Google Scholar]
  27. Zhang, K.L.; Shu, A.P.; Xu, X.L.; Yang, Q.K.; Yu, B. Soil erodibility and its estimation for agricultural soils in China. J. Arid Environ. 2008, 72, 1002–1011. [Google Scholar] [CrossRef]
  28. Liu, Y.L.; Wang, P.; Wang, J.K. Formation and Stability Mechanism of Soil Aggregates: Progress and Prospect, China. Acta Pedol. Sin. 2023, 60, 627–643. [Google Scholar] [CrossRef]
  29. Gan, F.; Shi, H.; Gou, J.; Zhang, L.; Dai, Q.; Yan, Y. Responses of Soil Aggregate Stability and Soil Erosion Resistance to Different Bedrock Strata Dip and Land Use Types in the Karst Trough Valley of Southwest China. Int. Soil Water Conserv. Res. 2023, 12, 684–696. [Google Scholar] [CrossRef]
  30. Ding, W.B.; Jiang, D.M.; Shi, D.M.; Chang, S.G.; Liu, Z.P. The study of soil and water conversation and tilth characteristics of cultivated-layer in purple soil farmland, China. Int. Soil Water Conserv. Res. 2016, 30, 24–29. [Google Scholar] [CrossRef]
  31. Aoubi, S.; Mokhtari, J.; Mosaddeghi, M.R.; Zeraatpisheh, M. Erodibility of Calcareous Soils as Influenced by Land Use and Intrinsic Soil Properties in a Semiarid Region of Central Iran. Environ. Monit. Assess. 2018, 190, 192. [Google Scholar] [CrossRef]
  32. Ananyeva, K.; Wang, W.; Smucker, A.J.M.; Rivers, M.L.; Kravchenko, A.N. Can Intra-Aggregate Pore Structures Affect the Aggregate’s Effectiveness in Protecting Carbon? Soil Biol. Biochem. 2013, 57, 868–875. [Google Scholar] [CrossRef]
  33. Xu, X.R.; Wang, J.K. A review on different stabilized mechanisms of soil aggregates and organic carbon, China. Chin. J. Soil Sci. 2017, 48, 1523–1529. [Google Scholar] [CrossRef]
  34. Zhang, J.; Chi, F.; Wei, D.; Zhou, B.; Cai, S.; Li, Y.; Li, L.J. Impacts of long-term fertilization on the molecular structure of humic acid and organic carbon content in soil aggregates in black soil. Sci. Rep. 2019, 9, 11908. [Google Scholar] [CrossRef] [PubMed]
  35. Zhao, F.Z.; Fan, X.D.; Ren, C.J.; Zhang, L.; Han, X.H.; Yang, G.H.; Doughty, R. Changes of the organic carbon content and stability of soil aggregates affected by soil bacterial community after afforestation. CATENA 2018, 171, 622–631. [Google Scholar] [CrossRef]
  36. Halder, M.; Ahmad, S.J.; Rahman, T.; Joardar, J.C.; Siddique, M.A.B.; Islam, M.S.; Peng, X. Effects of straw incorporation and straw-burning on aggregate stability and soil organic carbon in a clay soil of Bangladesh. Geoderma Reg. 2023, 32, e00620. [Google Scholar] [CrossRef]
  37. Zhang, Y.; Li, Y.; Ma, Z.; Cui, Z.; Sheng, H.; Li, R. Different Land-Use Effects on Soil Aggregates and Aggregate-Associated Organic Carbon in Eastern Qinghai-Tibet Plateau. Agronomy 2024, 14, 990. [Google Scholar] [CrossRef]
  38. Corral-Pazos-de-Provens, E.; Rapp-Arrarás, Í.; Domingo-Santos, J.M. The USLE soil erodibility nomograph revisited. Int. Soil Water Conserv. Res. 2023, 11, 1–13. [Google Scholar] [CrossRef]
  39. Tian, Z.; Zhao, Y.; Cao, L.; Zhao, Y.; Liang, Y. Assessing the declining trend in soil erodibility across China: A comparison of conventional and digital K-factor maps. Int. Soil Water Conserv. Res. 2024, in press. [Google Scholar] [CrossRef]
  40. Zhang, H.Y.; Wang, K.Q.; Song, Y.L. Soil erosion resistance under different land use types in Jianshan River watershed in middle Yunnan Province. J. Soil Water Conserv. 2019, 33, 50–57. [Google Scholar] [CrossRef]
  41. Almajmaie, A.; Hardie, M.; Acuna, T.; Birch, C. Evaluation of methods for determining soil aggregate stability. Soil Till Res. 2017, 167, 39–45. [Google Scholar] [CrossRef]
  42. Ghosh, B.N.; Meena, V.S.; Alam, N.M.; Dogra, P.; Bhattacharyya, R.; Sharma, N.K.; Mishra, P.K. Impact of conservation practices on soil aggregation and the carbon management index after seven years of maize-wheat cropping system in the Indian Himalayas. Agric. Ecosyst. Environ. 2016, 216, 247–257. [Google Scholar] [CrossRef]
  43. Liu, Y.; Ma, M.H.; Wu, S.J.; Ran, Y.G.; Wang, X.X.; Huang, P. Progress and prospect of soil aggregates stability induced by wetting and drying cycles. Soils 2018, 50, 853–865. [Google Scholar] [CrossRef]
  44. Yao, Y.; Liu, J.; Wang, Z.; Wei, X.; Zhu, H.; Fu, W.; Shao, M. Responses of Soil Aggregate Stability, Erodibility and Nutrient Enrichment to Simulated Extreme Heavy Rainfall. Sci. Total Environ. 2020, 709, 136150. [Google Scholar] [CrossRef] [PubMed]
  45. Arunrat, N.; Sereenonchai, S.; Kongsurakan, P.; Hatano, R. Soil Organic Carbon and Soil Erodibility Response to Various Land-Use Changes in Northern Thailand. CATENA 2022, 219, 106595. [Google Scholar] [CrossRef]
  46. Ndzelu, B.S.; Dou, S.; Zhang, X. Corn Straw Return Can Increase Labile Soil Organic Carbon Fractions and Improve Water-Stable Aggregates in Haplic Cambisol. J. Arid. Land 2020, 12, 1018–1030. [Google Scholar] [CrossRef]
  47. Li, Z.X.; Cai, C.F.; Shi, Z.H.; Wang, T.W.; Ding, S.W. Aggregate stability and its relationship with some chemical properties of Red soils in subtropical China. Pedosphere 2005, 15, 129–136. [Google Scholar] [CrossRef]
Figure 1. Location of the study area.
Agronomy 14 01534 g001
Figure 2. Physical-chemical properties of different land use types at 0–30 cm of the soil layer.
Agronomy 14 01534 g002
Figure 3. Percentage of soil water-stable aggregate fractions from 0 to 30 cm under different land use practices. (a) The 0–10 cm soil layer, (b) represents the 10–20 cm soil layer, and (c) represents the 20–30 cm soil layer.
Agronomy 14 01534 g003
Figure 4. GMD, MWD, and structural stability index SSI under different land uses. Different capital letters indicate significant differences (p < 0.05) between different sites of the same soil layer, and different lowercase letters indicate significant differences (p < 0.05) between different soil layers of the same site.
Agronomy 14 01534 g004
Figure 5. K values for different land uses. Different capital letters indicate significant (p < 0.05) differences between different land use types for the same soil layer, e.g., B and C; different lowercase letters indicate significant (p < 0.05) differences between different soil layers for the same land use type, e.g., a and c.
Agronomy 14 01534 g005
Figure 6. Correlation of soil aggregate fraction, MWD, GMD, SSI, and K values with soil physicochemical properties. * indicates p < 0.05, ** indicates p < 0.01, and *** indicates p < 0.001. Note: W>2.0 mm, W2.0–1.0 mm, W1.0–0.5 mm, W0.5–0.25 mm, and W<0.25 mm represent the wet sieving percentages of aggregates >2.0, 2.0–1.0, 1.0–0.5, 0.5–0.25, and <0.25 mm, respectively. The same applies below.
Agronomy 14 01534 g006
Figure 7. Specific factors affecting the stability and erodibility of soil aggregates. The colored circles in the figure indicate the distribution of samples.
Agronomy 14 01534 g007
Figure 8. Pass-through analysis of the main influences on stability and K. Arrows indicate the direct influence coefficients of physical and chemical properties on stability or susceptibility to erosion; the larger the value, the greater the influence. Dotted lines indicate the indirect influence coefficients of physical and chemical properties on stability and susceptibility to erosion; the larger the value, the greater the influence.
Agronomy 14 01534 g008
Table 1. Basic information of the sample site.
Site CodeAltitude (m)Slope (°)AspectPlanting Year (a)Average Tree Height (m)Vegetation Coverage
(%)
Dominant Community
Y6th-zr144628West61.576Fraxinus chinensis Roxb, Hydrangea aspera, Artemisia argyi, Artemisia dubia
Y6th-jgl144425West61.853Kiwi
Y7th-rgl146324Southeast7668Cunninghamia lanceolata, Hippophage rhamnoides, Pyracantha fortuneana, Stenoloma Fee
Y38th-y139520West38--Maize
Y38th-y + b144124North38--Maize, Cabbage
Table 2. Fertilizer application rate.
Site CodeFertilizers Rate (kg/ha)Application
Methods
NCompound Fertilizer
Sowing PeriodSeedling StageGrowing PeriodSowing PeriodSeedling StageGrowing Period
Y6th-zr000000-
Y6th-jgl000002300Hole fertilization
Y7th-rgl000000-
Y38th-y012.52575037.50Hole fertilization, surface fertilization
Y38th-y + b012.52575037.50Hole fertilization, surface fertilization
Disclaimer/Publisher’s Note: The statements, opinions and data contained in all publications are solely those of the individual author(s) and contributor(s) and not of MDPI and/or the editor(s). MDPI and/or the editor(s) disclaim responsibility for any injury to people or property resulting from any ideas, methods, instructions or products referred to in the content.

