Article

Multi-Omics Analysis Reveals the Transcriptional Regulatory Network of Maize Roots in Response to Nitrogen Availability

1
Jiangsu Key Laboratory of Crop Genetics and Physiology, Key Laboratory of Plant Functional Genomics of the Ministry of Education, Jiangsu Key Laboratory of Crop Genomics and Molecular Breeding, Agricultural College, Yangzhou University, Yangzhou 225009, China
2
Jiangsu Co-Innovation Center for Modern Production Technology of Grain Crops, Yangzhou University, Yangzhou 225009, China
*
Authors to whom correspondence should be addressed.
Agronomy 2024, 14(7), 1541; https://doi.org/10.3390/agronomy14071541
Submission received: 16 June 2024 / Revised: 11 July 2024 / Accepted: 13 July 2024 / Published: 16 July 2024

Abstract

:
Nitrogen (N) availability determines higher plant productivity and yield. However, the molecular mechanisms governing N acquisition and utilization remain largely unknown in maize. In this study, ATAC-seq, RNA-seq, and Ribo-seq analyses were conducted in maize roots under different N supply conditions. A set of differentially expressed genes enriched in N and phenylpropanoid metabolisms at both the transcription and translation levels were highlighted. Interestingly, less than half of low-N responsive genes were shared between transcription and translation. The alteration of translational efficiency (TE) is also an important mechanism by which maize responds to LN. In addition, we identified low-N-induced open chromatin regions (OCRs) and observed an enrichment of transcription factor (TF) binding motifs. Furthermore, we constructed a transcriptional regulatory network for maize roots subjected to low-N. These findings extend our understanding of N availability response and provide new insights for improving N use efficiency (NUE).

1. Introduction

Nitrogen (N) is a major constituent of various biological molecules such as nucleotides, proteins, and chlorophyll, as well as a key determinant for plant growth and crop production [1,2]. N is typically one of the most critical limiting factors for plant growth, and N deficiency is a common issue that plants frequently encounter in their natural growing environments [3]. The application of inorganic N fertilizer makes a significant contribution to the continuous rise of crop yield and global food security [4,5]. However, most crops can only take up roughly 30% to 50% of the N input [6], and the intensive use of N fertilizers also led to ever-growing environmental problems worldwide, such as greenhouse gas emissions and water eutrophication [7]. Maize, a major cereal crop cultivated worldwide, plays pivotal roles in human and animal nutrition, as well as in the manufacturing of alcoholic beverages, bioethanol, and biogas [8]. The prominence of corn as a staple is increasing, propelled by the expansion of its cultivation in response to global warming. Its beneficial chemical composition and nutritional characteristics, including high starch content and low fiber content, make it especially valuable, particularly in poultry feed [9]. Nevertheless, its high yield heavily depends on the unsustainable levels of fertilizer use [10]. Therefore, improving N use efficiency (NUE) is crucial for sustainable high crop yields and environmental benefits, and unveiling the molecular mechanisms of N nutrition is necessary for achieving this goal [11,12].
NUE is inherently complex and significantly influenced by the N uptake efficiency, which is, in itself, predominantly governed by the root system, the principal organ responsible for the absorption of N [13]. Vascular plants mainly absorb N from soil in inorganic forms such as nitrate (NO3) and ammonium (NH4+), as well as amino acids in organic forms, and NO3 is a dominant N form in aerobic soils [14,15]. NO3 is actively obtained by the roots via specific NO3 transporter (NRT) [16]. Once inside the root cell, NO3 is firstly reduced to nitrite (NO2) by nitrate reductase (NR) in the cytoplasm, and then the produced NO2 is transported to the plastid or chloroplast and further reduced to NH4+ by nitrite reductase (NiR) [1,17]. NH4+ is assimilated into glutamine (Gln) by glutamine synthetase (GS) and finally converted into glutamate (Glu) by glutamate synthase (GOGAT) [18,19].
The molecular mechanism of NO3 acquisition by the roots has been investigated in-depth over the past 30 years. Several genes involved in N uptake and assimilation, as well as N-responsive transcription factors (TFs) have been identified. AtNRT1.1 has been proven to be the central component in NO3 uptake, transport, as well as signaling [20]. OsNRT1.1B participates in both NO3 uptake and root-to-shoot transportation [21]. ZmNPF6.4 and ZmNPF6.6 are homologs of AtNRT1.1 that display distinct substrate affinity for NO3 and chloride in regulating N transport [22]. ZmNRT1.1B modulates high-affinity NO3 uptake and signaling, which, therefore, contributes to enhanced NUE and grain yield [23]. AtNLP7, a master regulator of NO3 metabolism in Arabidopsis roots, directly activates the expression of AtNIR1, AtNR1, AtNRT2.1, and AtNRT2.2 [24]. AtTCP20 modulates AtNRT1.1, AtNRT2.1, and AtNIA1, which are critical for a systemic signaling pathway that controls root foraging [25]. AtLBD37, AtLBD38, and AtLBD39 are shown to be transcriptional repressors in N availability signals [26]. Moreover, AtNAC4 [27,28], AtHRS1 [29], AtHHO1 [29], AtSPL9 [30], and AtNRG2 [31] were proposed to participate in NO3 response. In maize, ZmNLP5 acts as a central hub in the regulation network of N metabolism and directly regulates the expression of ZmNIR1.1 via binding the NO3-responsive cis-element [32]. ZmTMM1 modulates lateral root development, and overexpression of ZmTMM1 effectively rescued the defective growth of lateral roots exhibited by the Arabidopsis anr1 agl21 double mutant [33]. The ZmNLP3.2-ZmARF19-ZmAux/IAA14 molecular module is responsible for regulating maize root biomass in response to nitrogen limitation [34]. Nevertheless, the molecular mechanisms governing NO3 assimilation and signaling, in particular, the key regulators of NO3 responses, remain enigmatic [35,36].
To date, transcriptomics has been increasingly applied to explore how maize responds to N availability, and a series of genes associated with N availability and their corresponding metabolic pathways have been identified. Ma et al. have demonstrated that genes associated with nutrient utilization and hormones are differentially expressed under N deficiency [37]. A transcriptomic survey of maize roots subjected to differing N supplies highlighted that biosynthesis of several phytohormones, cytoskeleton activation and cell wall modification closely related to the responses to NO3 availability [38]. The regulation of gene expression in eukaryotes is a highly intricate and flexible process that occurs at various levels, ranging from chromatin architecture to protein production. A series of TFs have been characterized as key regulators involved in NO3 response, such as bZIP1, TGA1, TGA4, and TCP20, which can directly bind to the promoters and control the expression of genes involved in NO3 transport, reduction, nitrate assimilation [24,25,26,39]. OsSNAC1 plays a positive role in regulating NUE by directly binding to the promoter region of OsNRT2.1/2.2 and OsNRT1.1A/1.1B and activating their expression [40]. Nine NLPs in Arabidopsis can bind the NO3-responsive cis-element (NRE) and are thought to contribute to the N response [41]. The binding of TFs to cis-elements is closely linked to chromatin accessibility [42]. Therefore, identification of accessible chromatin regions throughout the genome will improve our understanding of chromatin accessibility, TF binding, and gene expression regulation. ATAC-seq is a high-throughput sequencing technique that employs Tn5 transposases to investigate chromatin accessibility and has been increasingly utilized in plants [43,44,45]. Translational regulation contributes to precisely controlling the spatial and temporal expression of genes. In response to external stimuli, ribosomes can not only block translation elongation but also separate from mRNA, resulting in dramatic changes in protein abundance without substantial change in mRNA levels [46]. Ribosome profiling sequencing (Ribo-seq) has emerged as a crucial tool for investigating comprehensive translation regulation, especially in response to various stresses, including studies of drought, heat, and chilling stress [47,48,49]. For instance, maize roots can respond to drought stress through highly dynamic translational regulation in synergy with transcriptional regulation. The latest research in rice has pinpointed Ospep5, a key salt-tolerant small peptide, through an integrated approach combining translatome and transcriptome [50]. Similarly, in cotton, a key development-regulating factor, GhKCS6, has been identified by combining transcriptional and translational profiling [51]. However, the overall understanding of the translational response of most crops remains poorly studied.
Here, we employed ATAC-seq, RNA-seq, and Ribo-seq under NO3 deficiency to address the knowledge gap regarding the response of maize roots to low N (LN) supply. The study aims to achieve the following objectives: (1) to examine the chromatin accessibility, transcriptional, and translational landscapes of maize roots under LN conditions; (2) to identify key genes involved in the response to LN; (3) to construct a transcriptional regulatory network underlying LN response.

2. Materials and Methods

2.1. Plant Materials and Growth Conditions

B73 was the first maize inbred line to undergo sequencing, and its genome is now extensively utilized as a reference in various studies [52]. B73 is also a representative maize inbred line belonging to the heterotic group known as Reid. In this study, B73 was used for multi-omics analysis. The seeds of maize inbred line B73 were sterilized in 10% H2O2 (v/v) for 20 min, followed by rinsing with sterile distilled water and soaked in a saturated CaSO4 solution for 6 h. Afterward, the seeds were placed between damp filter papers and incubated in darkness at 28 °C for germination. Two days later, every eight germinated seeds were positioned vertically 2 cm below the top edge of two layers of moistened germination paper, and then we rolled them up after covering them with another paper. Six paper rolls were transferred into a plastic tub (16 × 14 × 13 cm, length × width × height) containing 1 L nutrient solution, which was renewed every two days [53]. For CK treatment, the composition and concentration of the nutrient solution are based on previous reports [54]. For LN treatment, 1.0 mM Ca(NO3)2 was replaced with no added Ca(NO3)2, and the Ca2+ concentration was adjusted by adding CaCl2 to match that of CK. Seven days following treatment, the primary roots were harvested for further analysis. Three biological repeats were performed for both CK and LN, and at least 48 primary roots were collected for each biological replicate. 158 maize inbred lines for transcriptome sequencing were grown using the paper roll system as described above (Table S1). At least 30 primary roots were sampled and immediately frozen in liquid nitrogen.

2.2. RNA-Seq Analysis of Maize Roots under CK and LN

Total RNA was isolated from maize roots under CK and LN using the RNeasy Plant Mini kit (Qiagen, Shanghai, China). The sequencing was conducted using the Illumina HiSeq2000 platform, and the reads were mapped to the maize B73 reference genome (Zm-B73-REFERENCE-NAM-5.0) by Hisat2 (v 2.1.0) with default parameter settings after removing adapters and low-quality reads [55]. Fragments per kilobase of transcript per million fragments (FPKM) were determined using StringTie (v 1.3.1) [56]. Differentially expressed genes (DEGs) were obtained using the DEseq with p < 0.05 and fold change ≥ 1.5 [57]. KEGG enrichment analysis was performed on the OmicShare website (http://www.omicshare.com/tools, accessed on 28 April 2023). Three biological repeats were performed for each treatment.

2.3. Ribo-Seq Analysis of Maize Roots under CK and LN

The maize roots under CK and LN were ground into powder in liquid nitrogen and then dissolved in 400 µL of lysis buffer. 10 µL RNase I (NEB, Ipswich, MA, USA) and 6 µL DNase I (NEB, Ipswich, MA, USA) were added to 400 µL of lysate, followed by incubation for 45 min. The nuclease digestion was halted by the addition of SUPERase·In RNase inhibitor (Ambion, Austin, TX, USA). The digested ribosome footprints (RFs) were added to the size exclusion columns (illustra MicroSpin S-400 HR Columns; GE Healthcare, Los Angeles, CA, USA; catalog no. 27-5140-01) and centrifuged at 600× g for 2 min. RFs larger than 17 nt were collected through the RNA Clean and Concentrator-25 kit (Zymo Research, Irvine, CA, USA; R1017). rRNA was digested with RNase H (NEB, Ipswich, MA, USA) and purified RFs were further obtained through magnet beads (Vazyme, Nanjing, Jiangsu, China). Adapters were attached to the ends of RFs, and then subjected to reverse transcription and PCR purification. The PCR products ranging from 140 to 160 bp were amplified to generate cDNA libraries and subsequently sequenced on Illumina HiSeqTM X10 by Gene Denovo Biotechnology Co. (Guangzhou, China). Three biological repeats per sample were used for the Ribo-Seq experiment.

2.4. Ribo-Seq Data Analysis

Low-quality reads and adapters were removed by fastp [58]. Reads that map to rRNAs, transfer RNAs (tRNA), small nuclear RNAs (snRNA), small nucleolar RNAs (snoRNA), and miRNA were filtered out using Bowtie2 [59]. The remaining reads were aligned to the maize B73 reference genome (Zm-B73-REFERENCE-NAM-5.0) by STAR [60]. Reads counts within the ORF were calculated by RSEM and normalized as FPKM [61]. DEGs were identified by edgeR with fold change ≥1.5 and p < 0.05 [62]. KEGG enrichment analysis was performed on the OmicShare website (http://www.omicshare.com/tools, accessed on 28 April 2023).

2.5. Analysis of Translational Efficiency (TE)

TE refers to the ratio of translating mRNAs to total mRNAs of a gene. The TE of genes was calculated as follows: TE = (FPKM in Ribo-seq)/(FPKM in RNA-seq). Genes with significant differences in TE were obtained with RiboDiff (fold change ≥ 1.5 and p < 0.05) [63]. The sequence stability of the secondary structure was assessed using Normalized minimal free energy (NMFE), and the NMFE was calculated by RNAfold and then normalized by the length of the sequence.

2.6. Analysis of Upstream Open Reading Frames (uORFs)

Among the alternative splicing of each gene, the longest transcript was selected for further analysis. Then, we conducted a custom ORFfinder search in 5′ untranslated region (UTR), and the translated uORFs were defined by FPKM ≥ 1.

2.7. Library Preparation and Open Chromatin Regions (OCRs) Identification of ATAC-Seq

The samples used for ATAC-seq were the same as those for RNA-seq and Ribo-Seq, with three biological replicates for CK and LN treatment. According to the sucrose precipitation method, as previously reported, we isolated nuclei from freshly collected B73 maize roots [64]. The nuclei suspension was incubated in Transposition Mix containing transposase. Transposase entered the open region of chromatin to fragment the DNA, and the adapters were added to the end of the DNA fragment. The transposition reaction was incubated at 37 °C for 30 min, and the products were purified using a QIAGEN minielute kit, followed by sequencing on Illumina HiSeqTM 4000 by Gene Denovo Biotechnology Co. (Guangzhou, China). The ATAC-seq raw reads containing adapters, more than 10% unknown sequence (N), and reads with more than 50% low-quality bases (Q-value ≤ 20) were removed. The remaining clean reads were aligned to the maize B73 reference genome (Zm-B73-REFERENCE-NAM-5.0) by Bowtie2 (v 2.2.8), and reads mapped to the mitochondria or chloroplasts were filtered [59].
Genome-wide peak calling was performed using MACS (v 2.1.2), and the region would be defined as a peak when the q-value < 0.05 [65]. ChIPseeker (v 1.16.1) was used to identify the OCR-related genes and determine the distribution of OCRs in the genome [66]. DiffBind (v 2.8.0) was used for the identification of differential enrichment peaks across CK and LN with fold change values ≥ 1.5 and p < 0.05. MEME was used to detect the motifs in OCR regions [67].

2.8. Regulatory Network Construction Based on Transcriptome Data

To construct a transcriptional regulatory network of LN response, RNA-seq was performed on maize roots from 158 inbred lines under NO3 deficiency. A total of 111 transcription factors exhibiting differential expression were identified based on the transcriptome data of B73 roots under LN. Among them, 35 TFs with no or weak expression in roots from 158 inbred lines were filtered out, resulting in 76 TFs for subsequent analysis. Seventeen structural genes involved in N metabolism (ZmNRT1.1B, ZmNRT2.1, ZmNRT2.2, ZmNIAC, ZmNIAD, ZmNIRA, ZmNIRB, ZmGLN2, and ZmAsnS3) and phenylpropanoid metabolism (Zm00001eb381290, Zm00001eb109910, Zm00001eb328780, Zm00001eb058250, Zm00001eb328810, Zm00001eb390690, Zm00001eb017950, and Zm00001eb017960) that were significantly downregulated at both the transcription and translation levels under LN have been selected for investigation into the association with 76 TFs. The R package GENIE3, based on random-forest regression, was used to infer regulatory network mediating NO3 responses [68]. The weight > 0.2 was set as the threshold to obtain significant interactions between the TFs and targets. The transcriptional regulatory network was constructed using Gephi 0.9.2 [69].

2.9. Dual Luciferase Assay

The transient dual luciferase assay was conducted to assess the interactions between ZmABI37, ZmWRKY27, and ZmNRT2.1. 2000 bp promoter of ZmNRT2.1 was amplified from maize B73 DNA and inserted into the pGreenII0800-LUC vector, while the ORF of ZmABI37 and ZmWRKY27 was cloned into the vector pGreen II 62-SK, respectively. The resulting vectors were transferred into Agrobacterium tumefaciens strain GV3101. The Agrobacteria harboring reporter and effector were transformed into four-week-old Nicotiana benthamiana leaves. After three days, the infiltrated areas of leaves were collected for total protein extraction. The fluorescence intensity of LUC and Renilla (REN) luciferase was detected by the dual luciferase reporter assay system kit (Promega, E1910, Madison, WI, USA).

2.10. Reverse Transcription Quantitative PCR (RT-qPCR)

Total RNA extracted from maize roots under both normal and LN conditions was reverse transcribed using the cDNA synthesis kit (AT341, TransGen, Beijing, China), followed by RT-qPCR as per the manufacturer’s instructions (AQ601, TransGen, Beijing, China). The maize ZmTubulin1 (Zm00001eb215710) was utilized as an internal control, and relative expression levels were determined using the 2−ΔCT method. Each sample included three biological replicates, with primer details delineated in Supplementary Table S2.

2.11. Statistical Analysis

For comparisons between two groups, including RT-qPCR analyses, characteristics between translated and untranslated uORFs, and relative LUC activity, significant differences were determined using a two-tailed Student’s t-test. In cases of multiple groups, a one-way ANOVA complemented by Duncan’s post hoc test was applied for pairwise evaluations, respectively. Different letters indicate statistically significant differences at p < 0.05.

3. Results

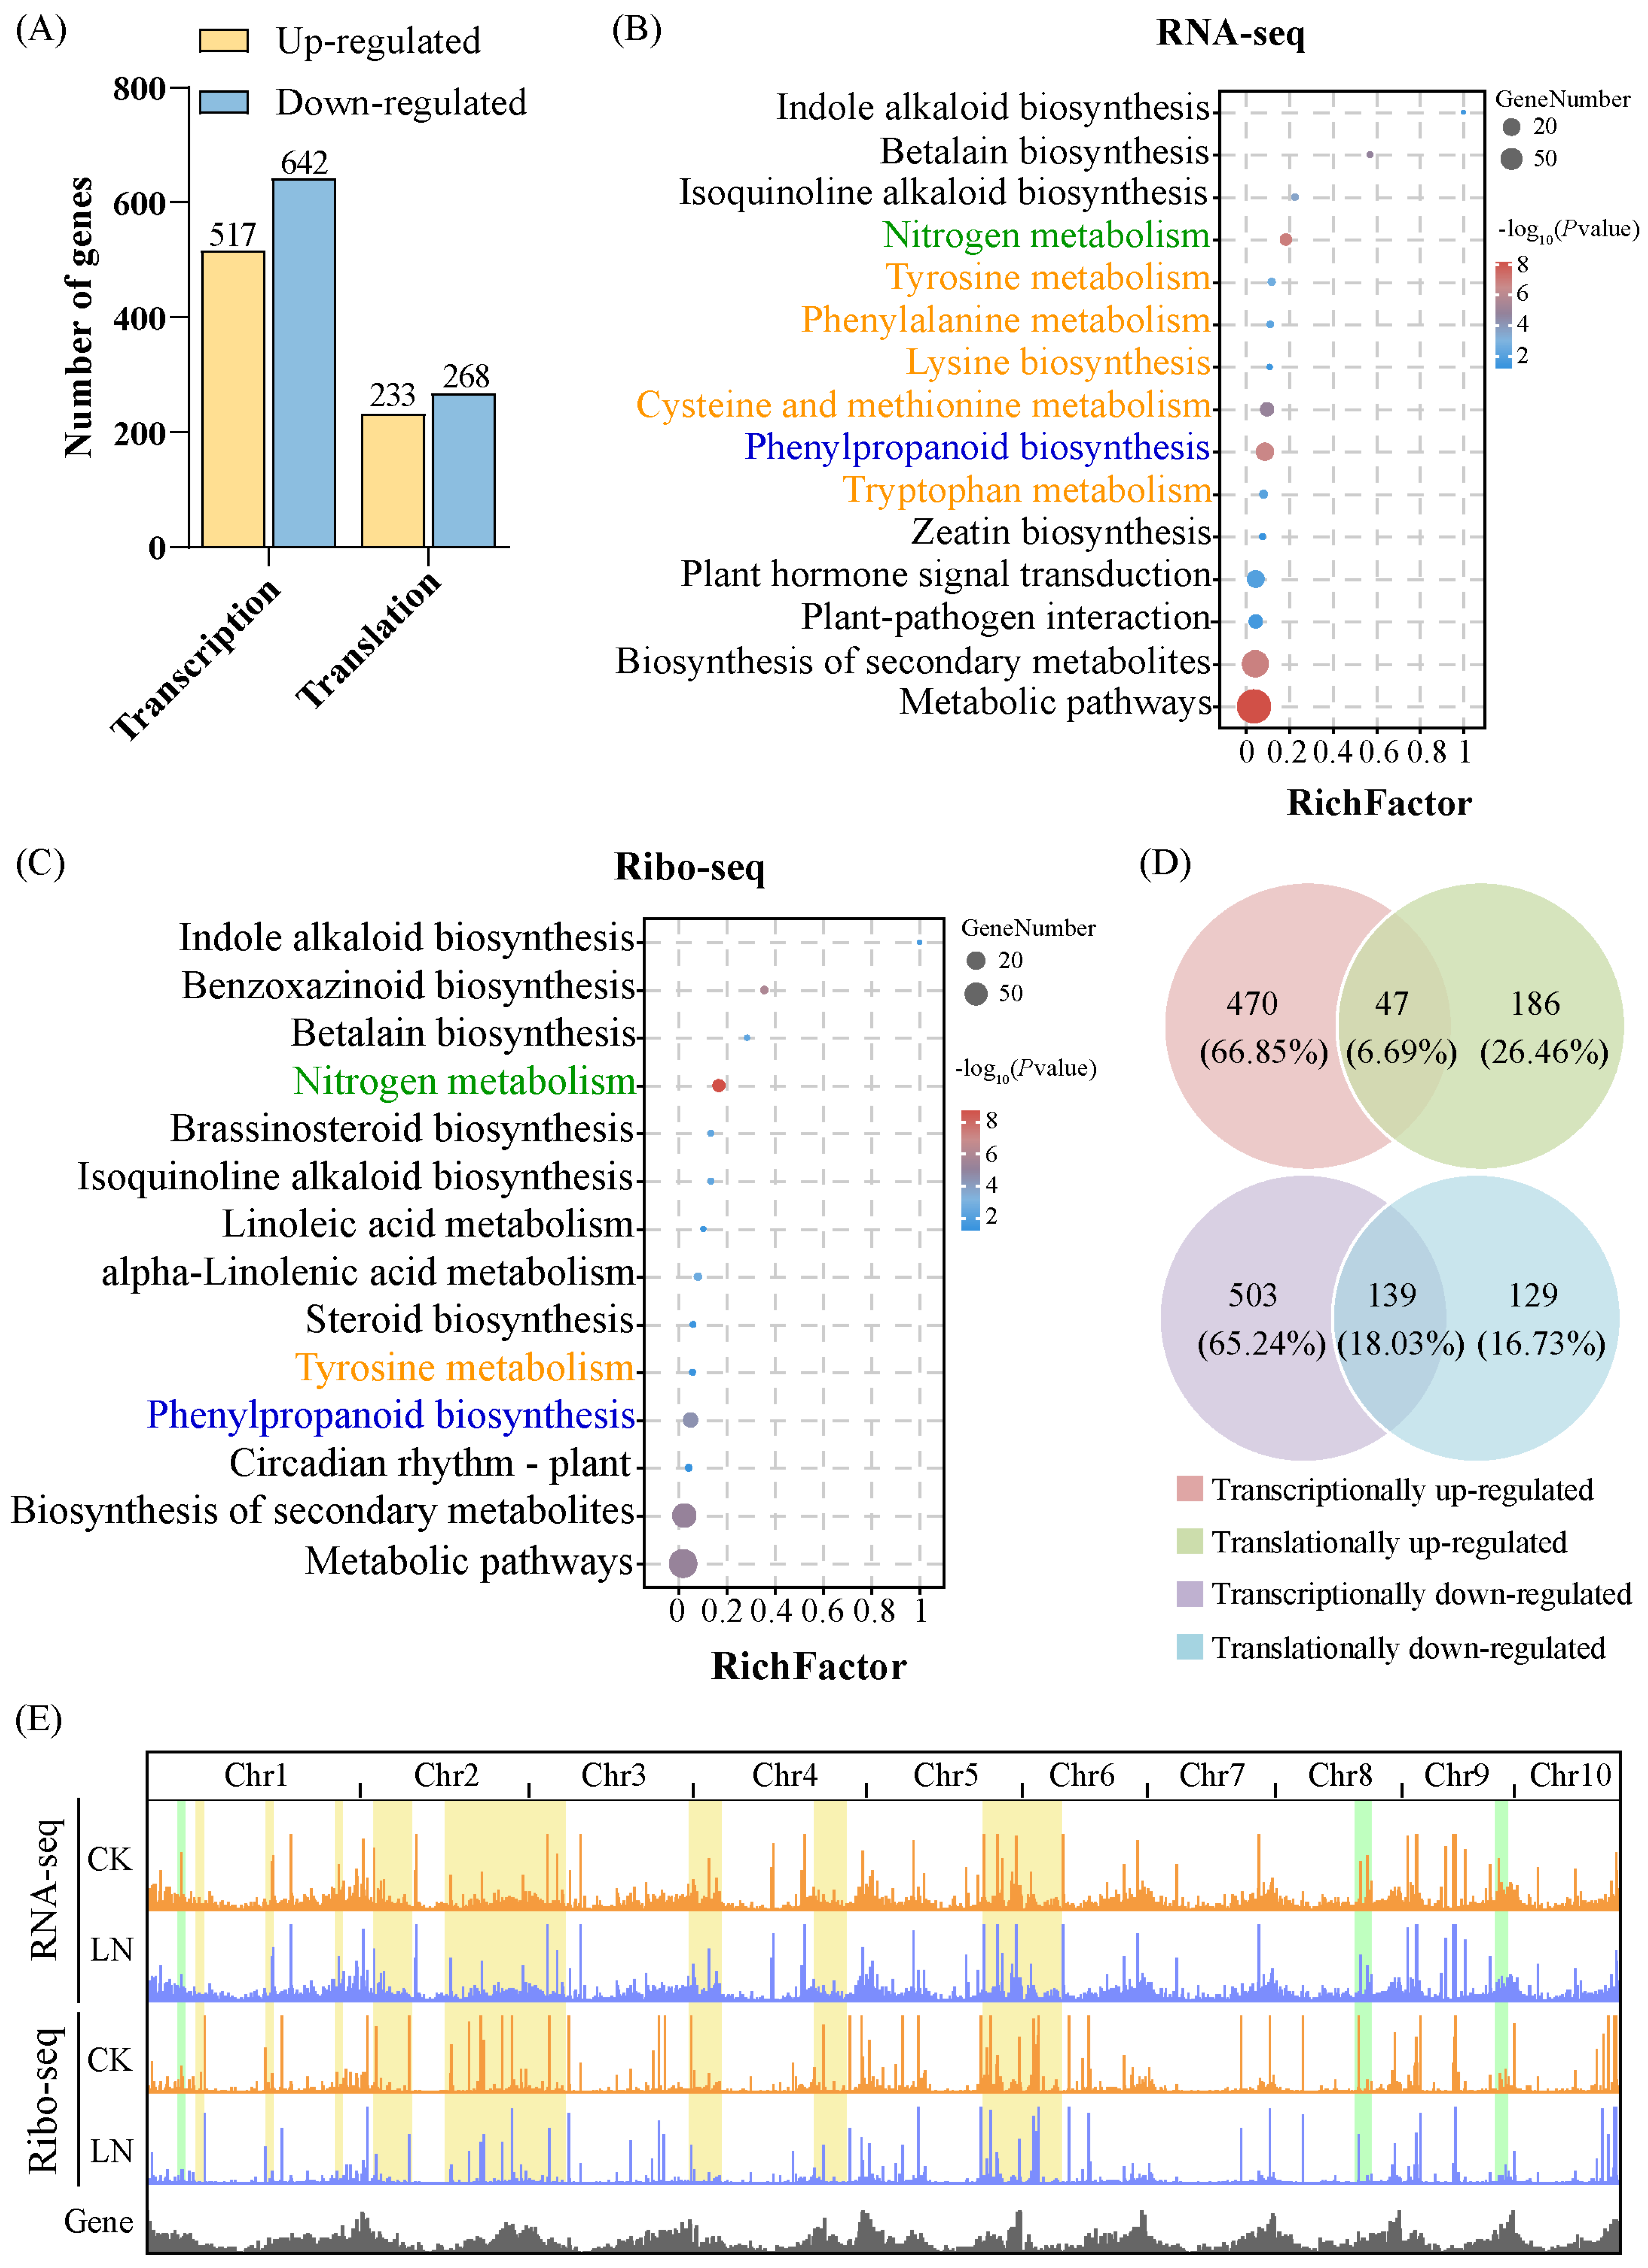
3.1. Characteristics of RNA-Seq and Ribo-Seq

To gain a comprehensive understanding of the maize roots’ response to LN supplement from transcriptional and translational aspects, we conducted RNA-seq and Ribo-seq analyses on roots under both CK and LN conditions. We first evaluated several features to determine the quality of Ribo-seq and further investigate the differences between CK and LN. The RFs length of the CK and LN was approximately 30 nt (Figure S1A). More than 90% of the RFs were distributed in the CDS region, with 2.6%, 4.0%, and 3.0% located in the 5′UTR, 3′UTR, and introns, respectively (Figure S1B). Overall, there was no significant difference in the expression abundance between CK and LN in Ribo-seq and RNA-seq (Figure S1C). Interestingly, the Pearson correlation coefficient between gene transcription and translation levels under LN increased from 0.51 to 0.56, suggesting the synergistic effect of transcription and translation under LN conditions (Figure S1D).
DEGs were screened at the transcription and translation levels to explore the molecular mechanism of the root response to LN. We identified 1159 DEGs at the transcription level, consisting of 517 upregulated and 642 downregulated genes (Figure 1A, Table S3). A total of 501 DEGs were obtained at the translation level, among which 233 genes were upregulated, and 268 genes were downregulated (Figure 1A, Table S4). A total of 111 TFs (covering 30 families) and 32 TFs (covering 13 families) were identified among DEGs at transcriptional and translational levels under LN supply, respectively (Figure S2). DEGs at the transcription level were mainly enriched in N metabolism, phenylpropanoid biosynthesis, and metabolism of various amino acids, including cysteine and methionine metabolism, tyrosine metabolism, phenylalanine metabolism, and tryptophan metabolism (Figure 1B, Table S5). It is worth noting that the KEGG-enriched pathways at the translation level largely overlapped with those at the transcription level, enriched in N metabolism, phenylalanine metabolism, and amino acid metabolism (Figure 1C, Table S6).

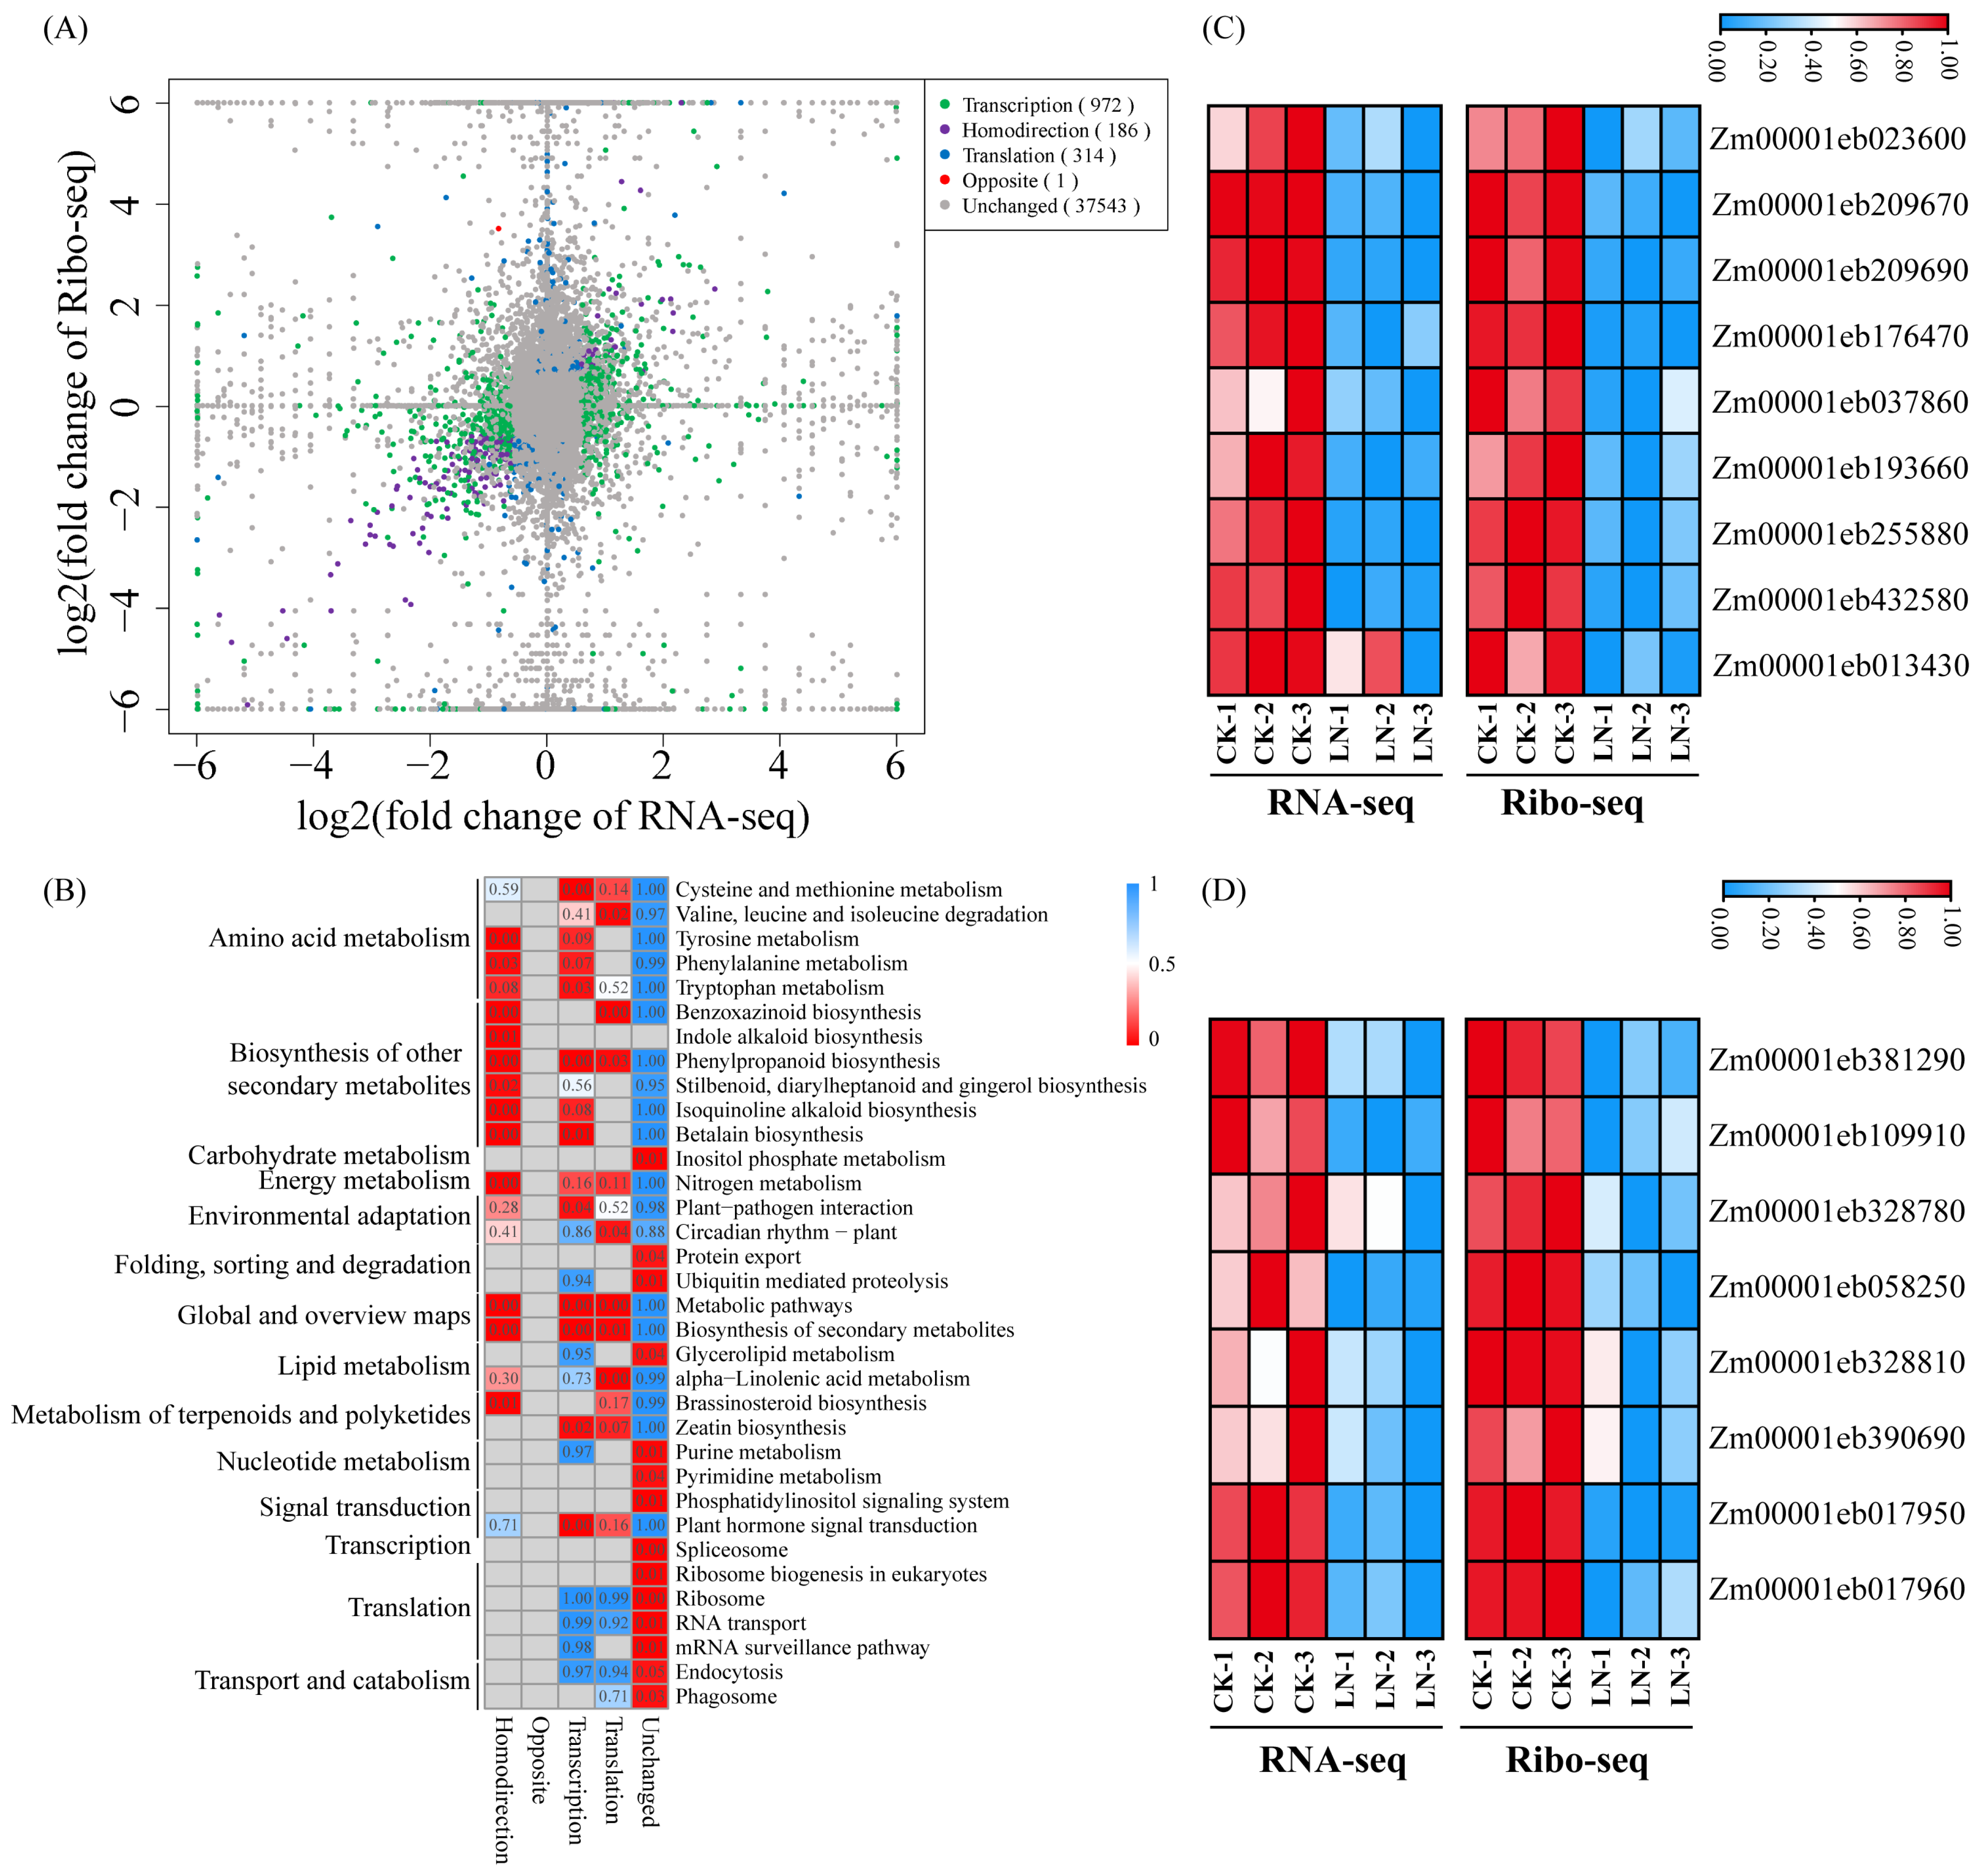
3.2. Response to LN Supplementation at the Transcription and Translation Levels

Importantly, less than half of the responsive genes (6.69% of the upregulated genes and 18.03% of the downregulated genes) exhibited consistent responses at both transcriptional and translational levels, highlighting the intricate regulatory mechanism underlying the response to LN (Figure 1D). A comprehensive analysis of RNA-seq and Ribo-seq abundance across 10 chromosomes indicated that the response of maize roots to LN occurs at various levels (Figure 1E). For instance, Zm00001eb256260 encodes an NIA that was significantly downregulated at the translation level without any significant difference in the transcription abundance. Zm00001eb381300 (Peroxidase) was clearly observed to be repressed at only the transcription level (Figure S3).
To demonstrate the response to LN in a more nuanced and coherent manner, all genes were classified into five groups: Ι, genes differentially expressed only at the transcription level, referred to as the transcription group (972 genes); II, genes that show significant changes only at the translation level, referred to as the translation group (314 genes); III, genes that exhibit significant changes at both the transcription and translation levels with consistent trend, referred to as the homo-directional group (186 genes); IV, genes that show marked changes at both the transcription and translation levels but exhibit inconsistent trends, referred to as the opposite group (1 gene); V, genes did not change at either transcriptional or translational level, referred to as the unchanged group (37,543 genes) (Figure 2A).
KEGG enrichment analysis showed that genes in the transcription group were mainly involved in the pathways related to the biosynthesis of secondary metabolites, plant hormone signal transduction, phenylalanine metabolism, cysteine, and methionine metabolism. Genes in the translation group were enriched in the phenylalanine metabolism, alpha-linolenic acid metabolism, benzoxazinoid biosynthesis, valine, leucine, and isoleucine degradation pathways. Genes in the homo-directional group were significantly enriched in N metabolic pathway, as well as the metabolic pathways of phenylalanine metabolism, brassinosteroid biosynthesis, and biosynthesis of secondary metabolites (Figure 2B, Table S7).
Remarkably, several genes involved in N uptake and assimilation, including three NRTs (Zm00001eb023600, ZmNRT1.1B; Zm00001eb209670, ZmNRT2.1; Zm00001eb209690, ZmNRT2.2), two NRs (Zm00001eb176470, ZmNIAC; Zm00001eb037860, ZmNIAD), two NIRs (Zm00001eb193660, ZmNIRA; Zm00001eb255880, ZmNIRB), GS (Zm00001eb432580, ZmGLN2), and Asparagine Synthetase (Zm00001eb013430, ZmAsnS3) were significantly suppressed at both the transcription and translation levels, indicating their crucial roles in the LN response (Figure 2C). Additionally, we observed significant downregulation of genes involved in phenylpropanoid biosynthesis under LN, particularly peroxidases related to the polymerization of lignin monomers, including Zm00001eb381290, Zm00001eb109910, Zm00001eb328780, Zm00001eb058250, Zm00001eb328810, Zm00001eb390690, Zm00001eb017950, and Zm00001eb017960, which indicates that LN inhibits lignin synthesis (Figure 2D). Furthermore, we selected several LN-responsive genes to validate their expression levels using RT-qPCR and confirmed their consistency with the RNA-seq data (Figure S4).

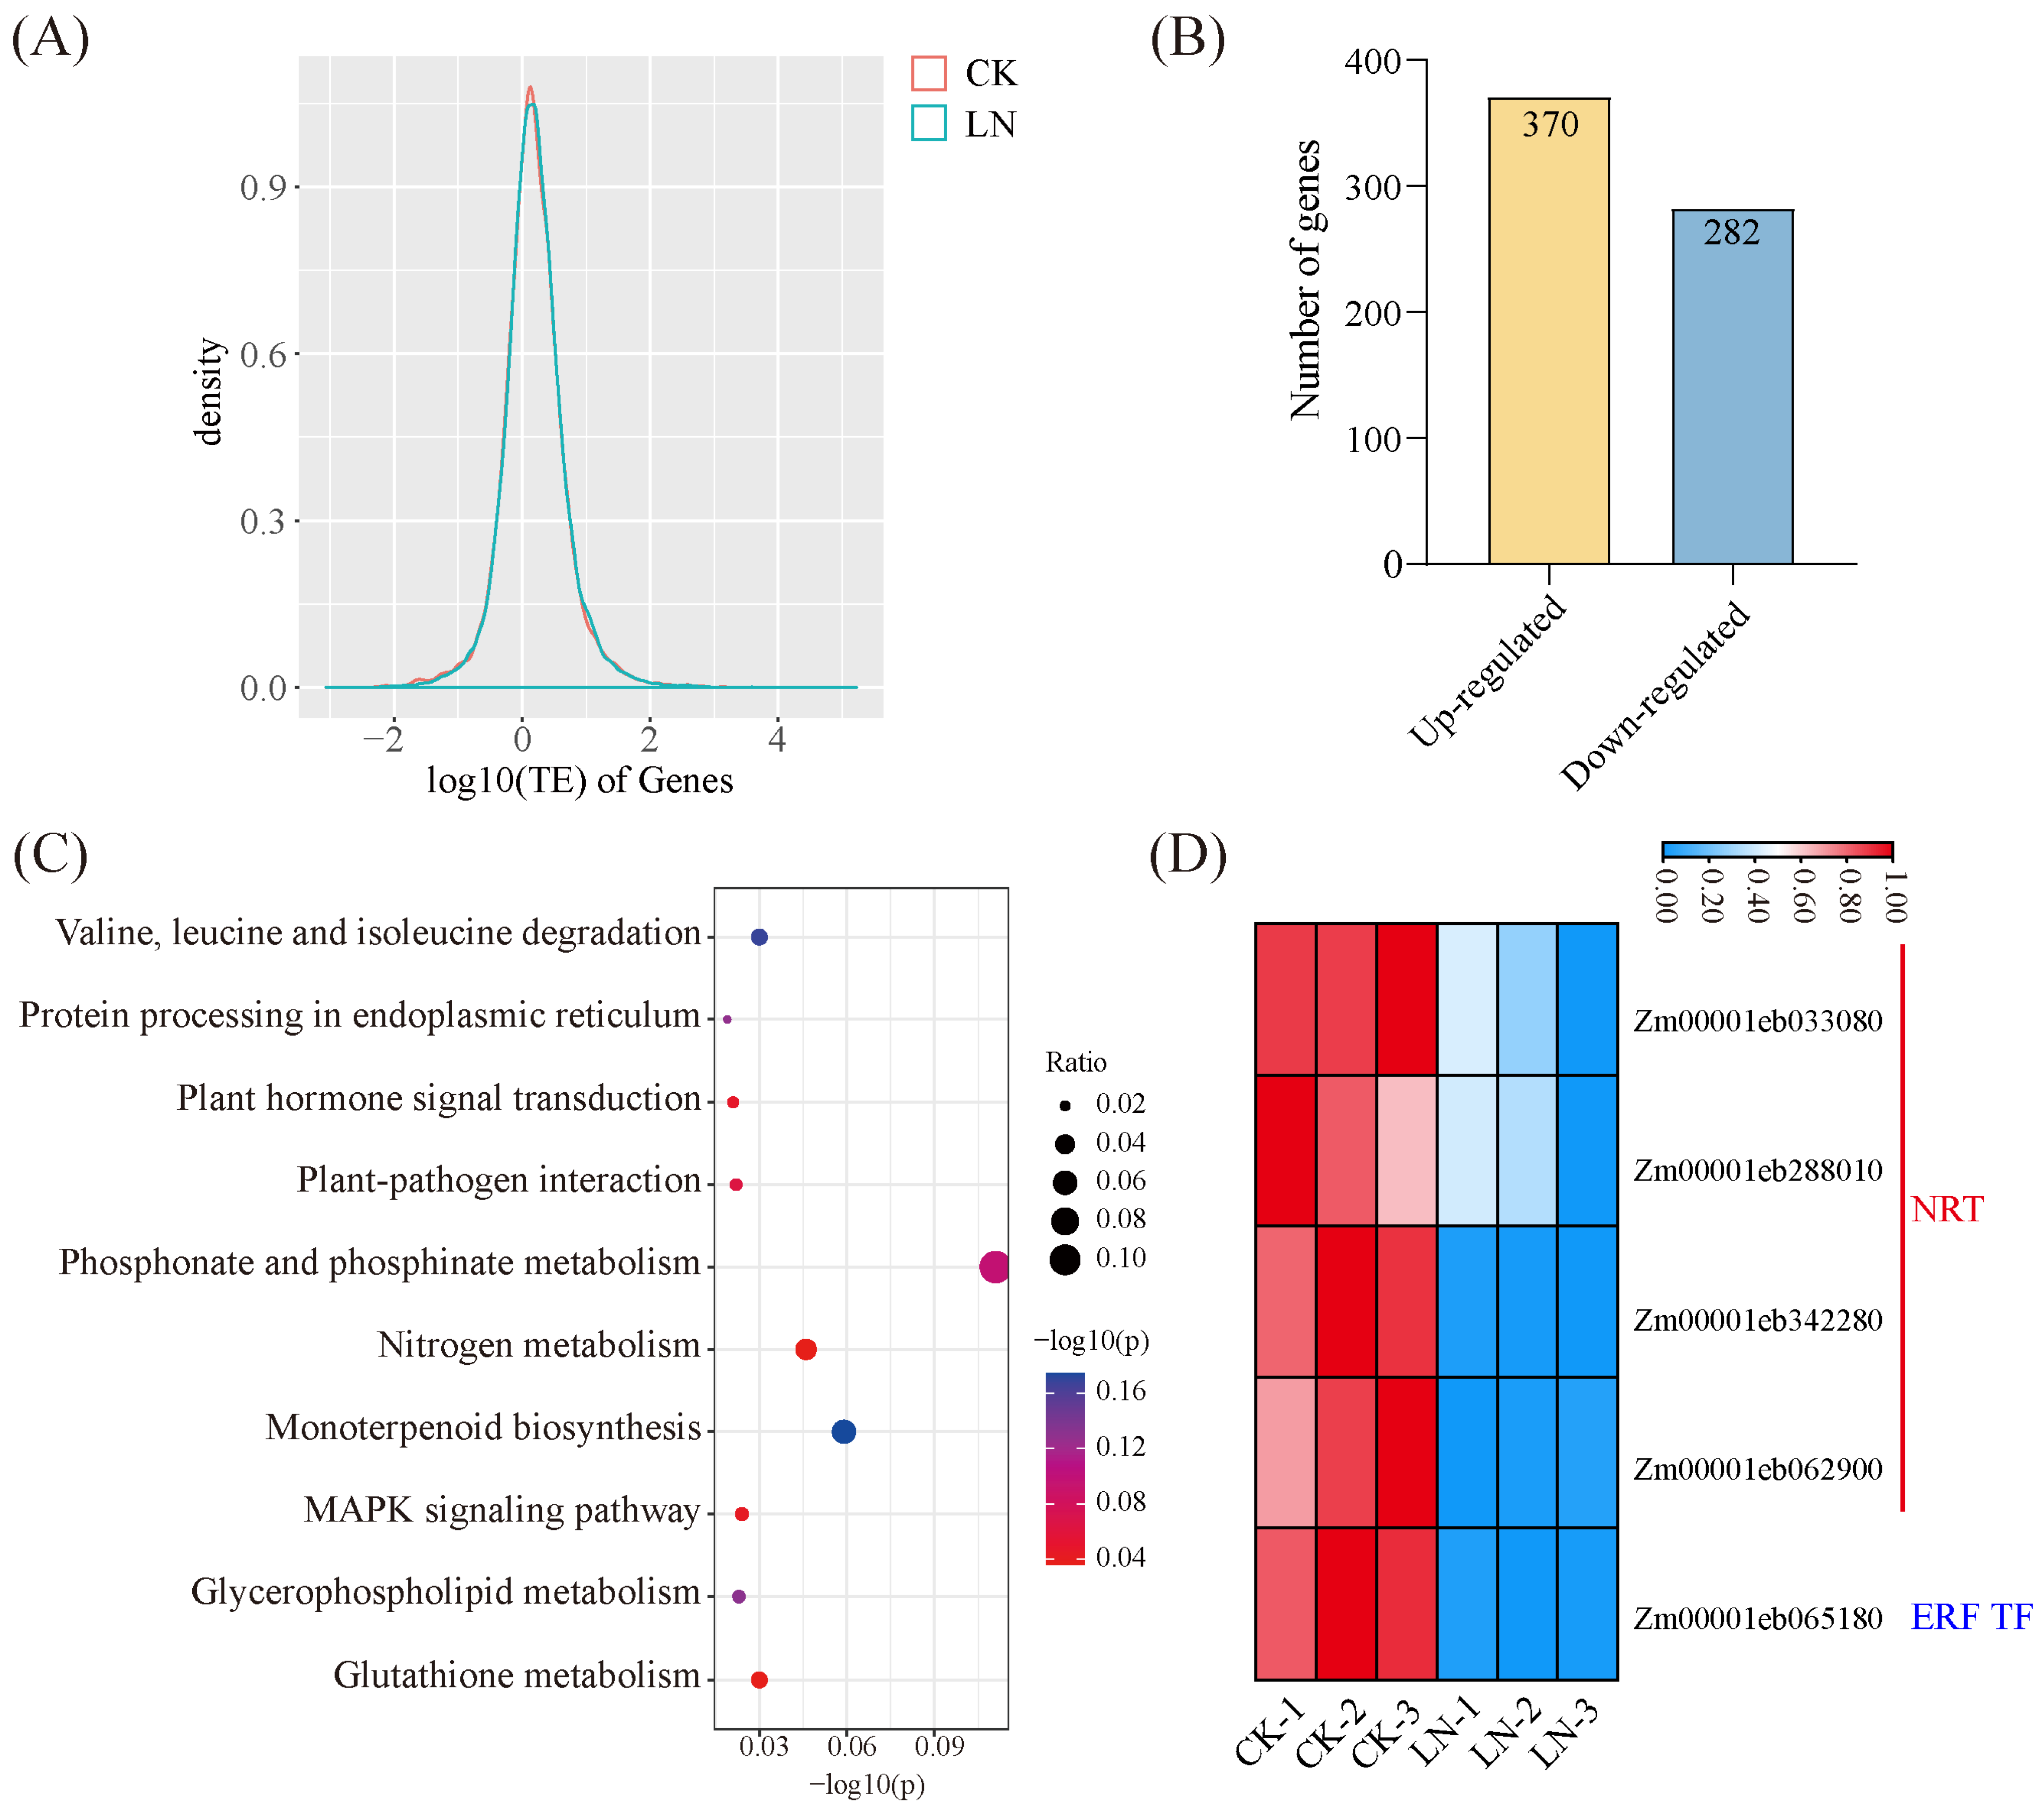
3.3. LN Triggers Altered TE

TE, calculated as FPKM Ribo-seq/FPKM RNA-seq, is considered an important index of RNA utilization efficiency and translation. We first assessed whether maize roots could cope with LN conditions by altering the TE. The overall distribution of TE indicated that the median TE under LN was lower than that of CK, which suggests that LN inhibited TE of genes in maize roots (Figure 3A). We identified 652 genes with significant differences in TE, among which 370 genes with elevated TE and 282 genes with reduced TE (Figure 3B, Table S8).
The TE-changed genes were mainly involved in N metabolism, glutathione metabolism, MAPK signaling pathway, and plant hormone signaling (Figure 3C). Looking more deeply, we checked the distribution of genes with changed TE in the previously determined 5 categories, 263 genes (40%) displayed significantly altered abundance at transcription or translation level, while the expression level of 398 genes (60%) did not change at either at transcription or translation level (Table S8). Several NRTs, including Zm00001eb033080, Zm00001eb288010, Zm00001eb342280, and Zm00001eb062900 exhibited reduced TE under N deficiency (Figure 3D). Zm00001eb065180, an ERF family TF, its homologous in Arabidopsis have been shown to play pivotal roles in N assimilation [70], and its TE is significantly reduced (Figure 3D). Collectively, adjusting TE may be a necessary way in responding to LN conditions in maize roots.
Indeed, several studies have demonstrated that sequence features affect the TE of genes [47]. To fully understand the effect of sequence characteristics in translational regulation in maize, we examined three sequence characteristics (sequence length, GC content, and NMFE) of the CDS, 5′UTR, and 3′UTR. Both for CDS, 5′UTR, and 3′UTR, genes with higher TE (log2(TE) > 1) tend to have a shorter length, lower GC content, and higher NMFE under N demand (Figure S5A–C). The general trends of sequence features of corresponding genes in CK were consistent with the trends in LN (Figure S5D–F).

3.4. Global Identification of uORFs and Their Influence on the Translation of mORFs

uORFs are sequences defined by short protein-coding elements located in the 5′ UTR of main ORFs (mORFs) and correlated with reduced mRNA translation [71]. However, genome-wide identification of uORFs in maize and whether these annotated uORFs participate in translation regulation remains elusive.
A total of 27,922 uORFs were identified in the 5′UTR of 9362 genes, with an average length of 143 nt. Based on the Ribo-seq data, 7368 (Figure 4A) and 7331 (Figure S6A) translated uORFs in the CK and LN samples were obtained, respectively. To further understand the characteristic differences between translated and untranslated uORFs, three parameters, including uORF length, 5′UTR length, and NMFE were compared. The results showed that the translated uORFs were longer and exhibited stronger folding capability compared with the untranslated uORFs, with no significant difference in the length of 5′UTR (Figure 4B–D). Additionally, the relative distance from the uORF to the start codon and of mORF in translated uORFs were shorter (Figure 4E). Given that the Kozak consensus sequence around the start codon is critical for translation initiation, we compared the base frequencies in this region for translated and untranslated uORFs. A significantly higher GC content of the flanking sequence in translated uORFs was observed (Figure 4F,G). The trend of the variation of sequence characteristics between translated and untranslated uORFs in CK was consistent with that in LN (Figure S6B–G).
Furthermore, we evaluate the effect of uORF on downstream mORF translation. We divided genes into three categories: genes with untranslated uORFs, genes containing one, and multiple translated uORFs. Obviously, genes with translated uORFs displayed decreased TE compared to those with untranslated uORF, and the increased number of translated uORFs further aggravated the decrease of TE (Figure 4H and Figure S6H). The above results were consistent under CK and LN conditions, reflecting that translated uORFs inhibit the translation of mORF. In total, 89 differentially expressed uORFs were identified between CK and LN conditions, with 45 uORFs downregulated and 44 uORFs that were upregulated, suggesting that these uORFs may be involved in the response to N deficiency in maize roots (Table S9). We also examined the TE of uORFs under both CK and LN conditions, and no significant difference was observed, which suggested that changes in the TE of uORFs throughout the whole genome may not be the primary mechanism by which maize roots respond to LN (Figure 4I).

3.5. ATAC-Seq Reveals Changes in Chromatin Accessibility under LN Condition

To elucidate the genome-wide chromatin accessibility characteristics of maize roots, we conducted ATAC-seq under both CK and LN conditions. A total of 60,927 and 60,771 OCRs were identified under CK and LN, respectively, with 55,097 OCRs shared between the two conditions (Figure 5A, Table S10). Most of the OCRs were located in intergenic regions, followed by the 2 kb upstream promoter regions of genes (Figure 5B). As expected, OCR signals were primarily enriched at the transcription start site (TSS) (Figure 5C).
OCRs were categorized into local and distal OCRs, of which local OCRs refer to OCRs located within 2 kb upstream at the TSS to 500 bp downstream of the transcription termination site (TTS), while distal OCRs were located outside of these regions. To assess the impact of local and distal OCRs on gene expression, we categorized genes into three groups: genes with only distal OCRs, genes with exclusively local OCRs, and genes with both types of OCRs. Genes with only distal OCRs showed the lowest expression level, whereas genes with both local and distal OCRs exhibited significantly higher expression levels compared to genes with only local or distal OCRs, thus indicating that both local and distal OCRs are crucial in regulating gene expression (Figure S7A,B).
Significant differences were observed in the chromatin landscape under LN conditions (Figure 5D). To further understand variation in chromatin accessibility under N deficiency, we identified differential enrichment of OCRs (DOCRs) between CK and LN. Overall, 11,992 DOCRs to 9498 genes were obtained, consisting of 2492 DOCRs in 2 kb upstream promoters, 1622 DOCRs in the downstream of TTSs, 5996 DOCRs in the gene body, 668 DOCRs in the 5′UTR and 1214 DOCRs in the 3′UTR. Given that gene expression is closely related to chromatin accessibility in the promoter region, we focused on 2492 DOCRs to 2397 genes in the 2 kb upstream of TSSs. Utilizing the MEME suite, we conducted an analysis of TF-binding motifs within 2492 DOCR regions. We found that the predominant motifs identified are associated with the ERF family, with DREB, MYB, and LBD families also being significantly represented (Table S11). The integration analysis of ATAC-Seq, RNA-Seq, and Ribo-Seq reveals that 107 DOCRs-associated genes displayed significant changes at either transcription or translation level or both (Table S12). For example, the chromatin accessibility in the upstream promoter of ZmNRT2.1 was significantly reduced following LN treatment. Additionally, ZmNRT2.1 displayed sharp reductions (over 90%) in expression level under LN (Figure 5E). Zm00001eb328810, a peroxidase, showed decreased chromatin accessibility, and the gene expression level was notably downregulated (Figure 5F). These genes were mainly involved in N metabolism, biosynthesis of secondary metabolites, and plant hormone signal transduction, which overlapped with the enrichment results of DEGs at the transcription and translation level (Figure S8).

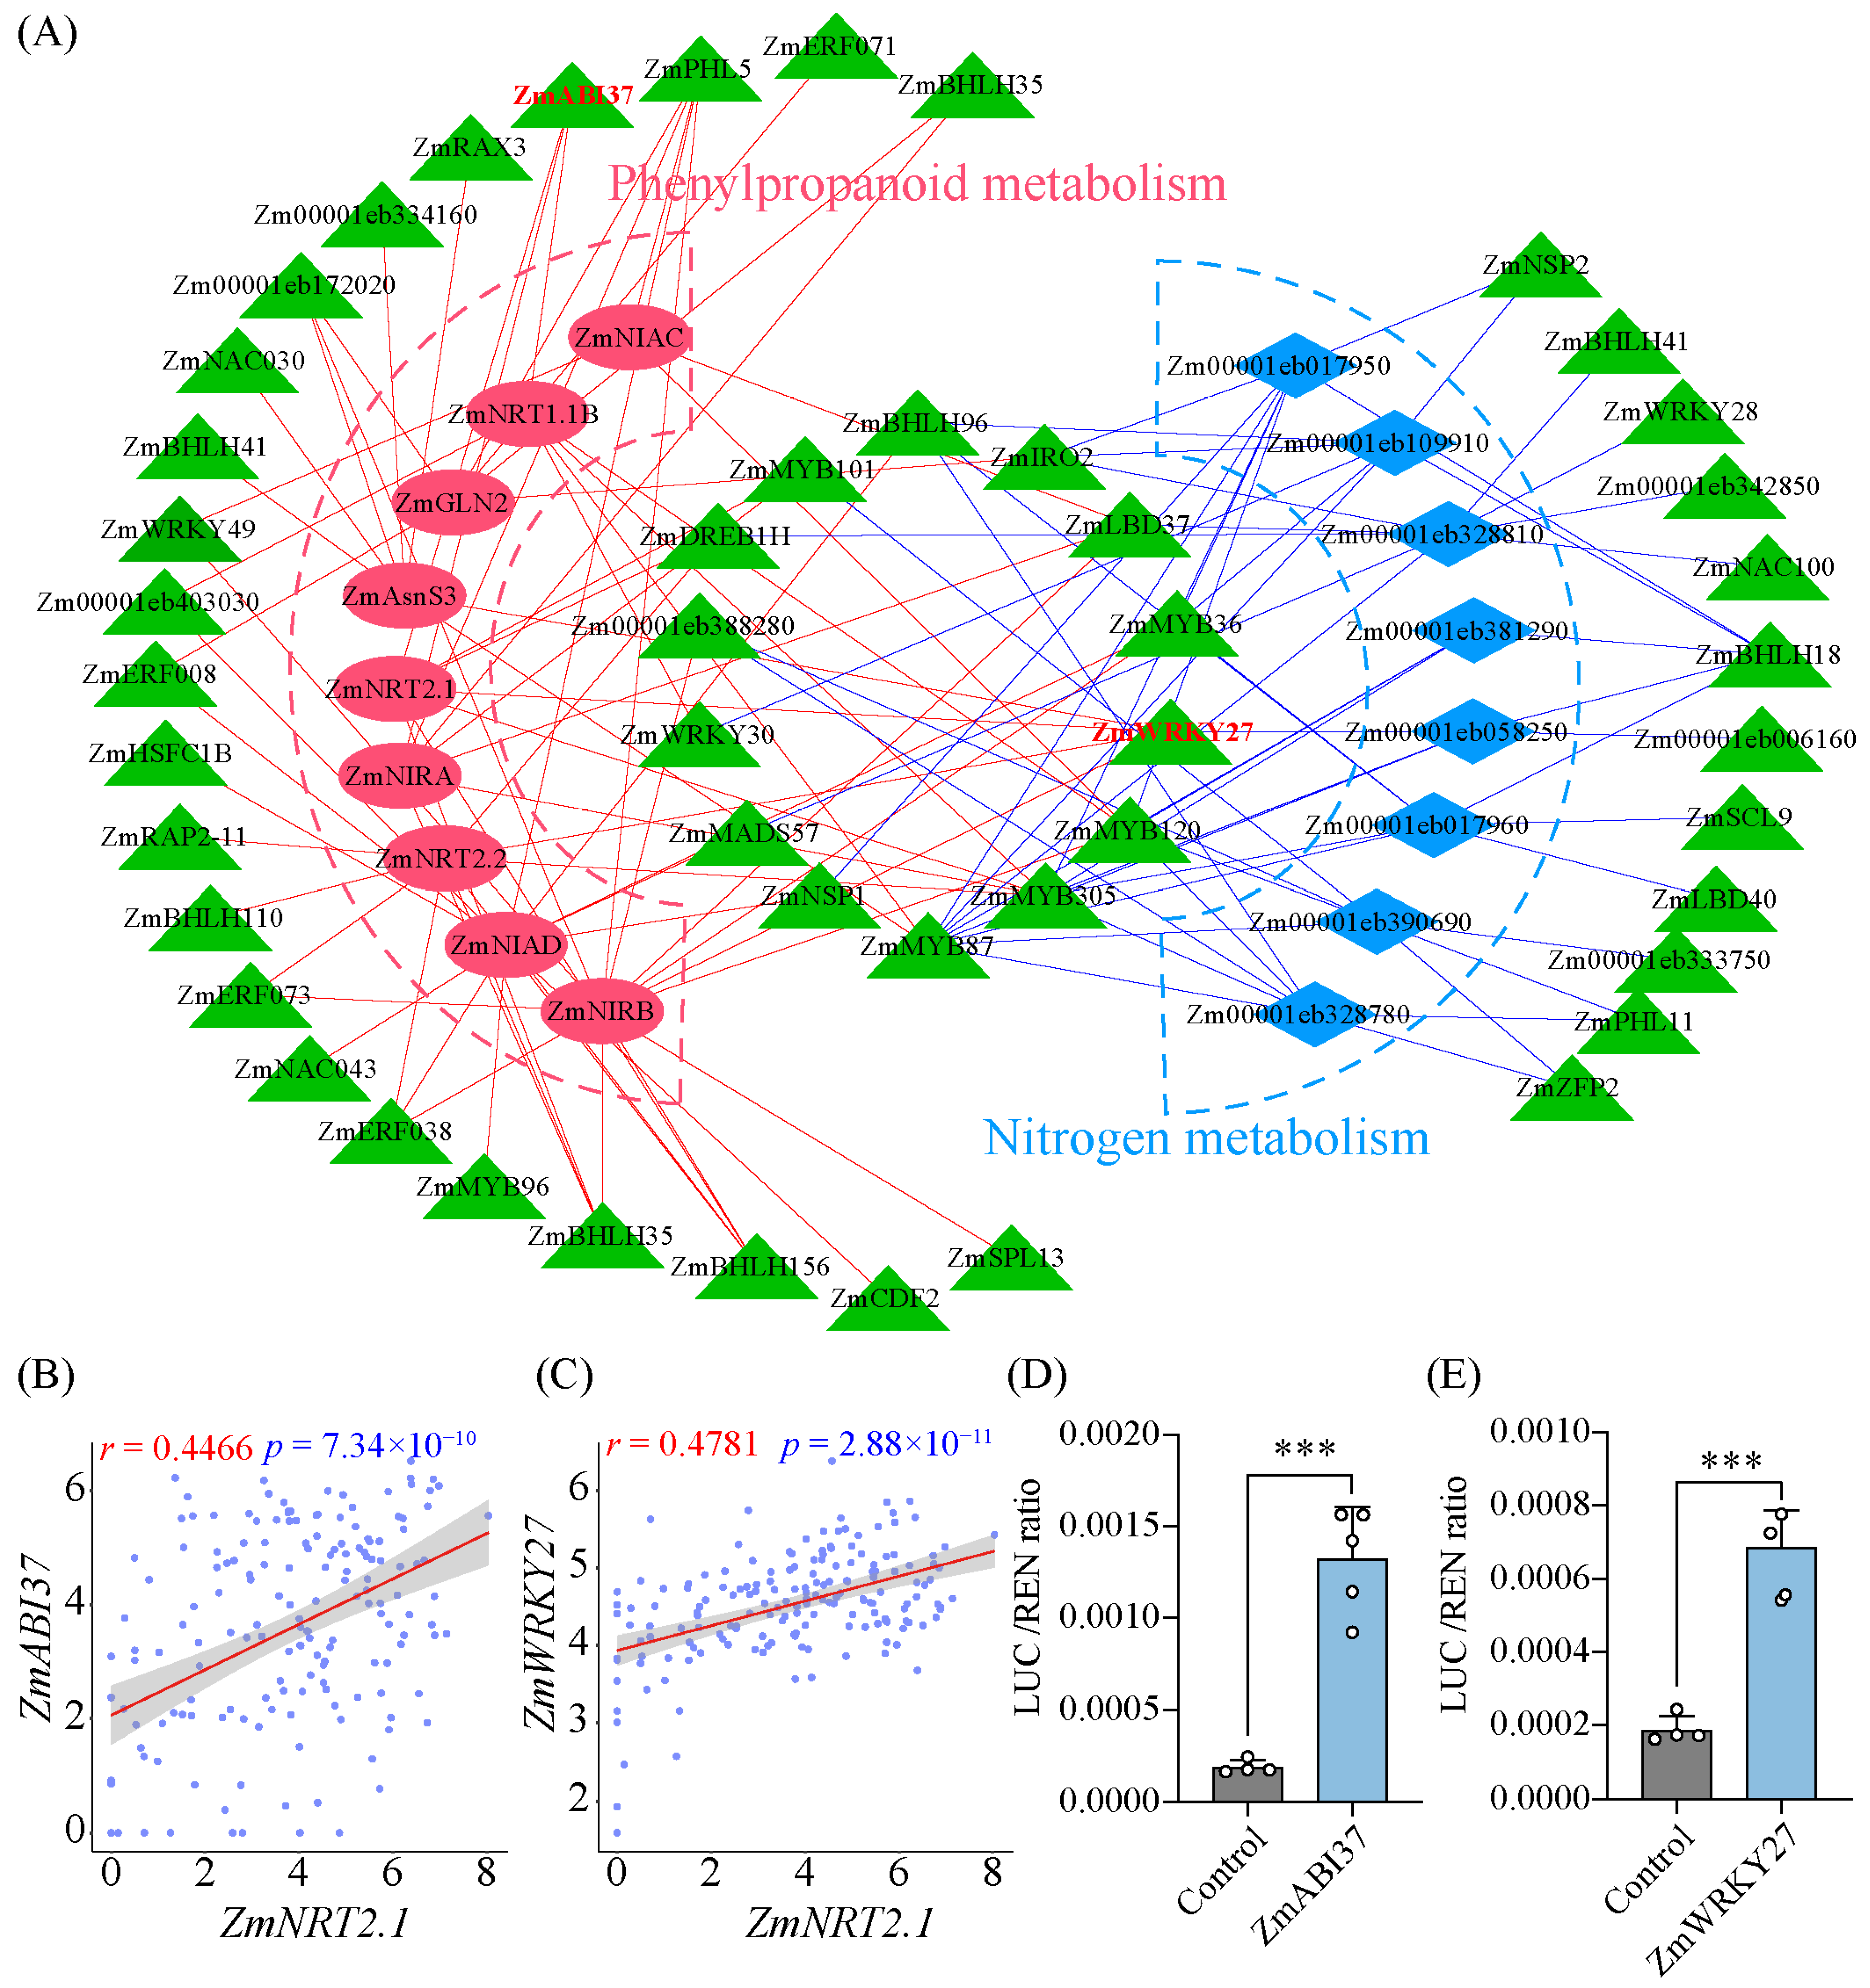
3.6. Construction of Transcriptional Regulatory Network Underlying LN Response

To extend our knowledge to unravel the complex structure of the N-induced regulatory module, we conducted RNA-Seq on maize roots from a population of 158 diverse maize inbred lines under LN treatment. We identified 111 differentially expressed TFs in B73 roots under LN condition (Figure S2A), of which 35 TFs with no or very weak expression in 158 inbred lines were excluded for further analysis. Additionally, 17 key LN response genes exhibited significant downregulation at both the transcription and translation levels, including 9 N metabolic pathway-related genes and 8 peroxidases of the phenylpropane metabolic pathway were used as target genes (Figure 2C,D). Correlations between 76 TFs and 17 target genes were calculated, and a total of 126 TF-target correlations (weight > 0.2) were detected, consisting of 49 TFs with 17 potential targets (Table S13). Our results reflected the complicated regulatory network of the LN response, which requires the combined action of multiple TFs and other components. We further identified key components driving LNs response according to the constructed network. ZmMYB87 (Zm00001eb154560), ZmMYB305 (Zm00001eb402890), and ZmMYB120 (Zm00001eb003470) were predicted to interact with 10, 9 and 7 structure genes, respectively, which some of their potential targets are overlapped. ZmMYB305 and ZmMYB120 were predicted to simultaneously regulate multiple N and phenylpropane metabolism-related genes, indicating the important function of these TFs in coordinating two pathways in response to LN. We found that ZmMYB87 tends to regulate the expression of phenylpropane metabolism genes, with 8 out of 10 target genes belonging to the phenylpropane metabolism. ZmBHLH18 (Zm00001eb025850) was predicted to specifically regulate five peroxidases (Zm00001eb381290, Zm00001eb058250, Zm00001eb017960, Zm00001eb109910 and Zm00001eb017950) in the phenylpropanoid metabolic pathways. Additionally, we identified some TFs that primarily act on the N metabolism. ZmWRKY27 (Zm00001eb237820) and ZmABI37 (Zm00001eb268680), encoding WRKY and B3 TFs, respectively, were found to regulate the expression of several N metabolism structural genes involving processes of N absorption and assimilation, with ZmNRT2.1 being shared (Figure 6A, Table S13). The expression of ZmWRKY27 and ZmABI37 was positively correlated with ZmNRT2.1 (Figure 6B,C). Moreover, the expression of ZmWRKY27 and ZmABI37 significantly decreased under LN condition, reflecting that the two TFs may trigger LNs response by directly activating the expression of ZmNRT2.1 (Figure S9A). The dual luciferase fluorescence assay was performed to verify whether ZmWRKY27 and ZmABI37 could regulate the expression of ZmNRT2.1. The reporter plasmid harboring 2000 bp promoter of ZmNRT2.1 fusing with LUC and the effector plasmids for ZmWRKY27 and ZmABI37 were constructed, respectively (Figure S8B). Co-expression of 35S: ZmWRKY27 or 35S: ZmABI37 with reporter (REN-ZmNRT2.1pro-LUC) resulted in significantly higher firefly luciferase (LUC) activity than the control result, which confirmed that ZmWRKY27 and ZmABI37 could directly bind to promoter fragments and activate the expression of ZmNRT2.1 (Figure 6D,E). Taken together, our results support a high-confidence transcriptional regulatory network for maize roots in response to the LN condition.

4. Discussion

Enhancing NUE of crops is crucial for minimizing N loss and mitigating environmental pollution, thereby promoting the sustainable development of agriculture. Maize is a significant staple, as well as a cash crop, requiring substantial amounts of N fertilizer for optimal production. Thus, comprehending the response of maize plants to changes in environmental N levels is necessary for deciphering the molecular mechanisms underlying N utilization in maize.

4.1. Transcriptional and Translational Synergistically Respond to LN

To date, research on how maize roots respond to N availability have been mainly focused on the mRNA level; however. little is known about the role of translation [53,54]. By utilizing RNA-seq and Ribo-seq data, we can not only observe genome-wide changes in gene expression and translation processes in response to LN treatment, but also explore the interactions between transcriptional and translational responses. Overall, we observed an increased Pearson correlation coefficient between the gene expression and translation under LN conditions (Figure S1D), which was consistent with those in maize under progressive drought treatment and tea upon chilling stress, indicating the ability to coordinate more effectively for plants in response to environmental stresses [47,49]. We observed DEGs at both the transcription and translation levels were enriched in the N metabolic, amino acid metabolism, and phenylalanine metabolism pathways (Figure 1B,C).
However, the levels of mRNA and the corresponding proteins are not always correlated (Figure 1D,E and Figure S3), and the translational response was proposed as a more rapid and direct way of environmental response [72]. A total of 314 genes exhibited exclusive changes at the translation level and demonstrated significant enrichment in the phenylpropanoid metabolism, as well as the valine, leucine, and isoleucine degradation pathways. (Figure 2A,B). These data suggested that the translation itself could play a relatively independent role in the LN response. Consistent with our data, previous studies have also noted significant discrepancies between transcriptional and translational levels. For instance, in tea plants, 3010 genes showed exclusive alterations at the translational level under cold stress, suggesting an independent translational regulation mechanism in response to chilling [49]. Similarly, in maize seedlings subjected to drought, fewer than half of the stress-responsive genes were shared between transcriptional and translational levels, indicating independent regulatory processes under drought conditions. Together with our findings, these multi-tiered responses underscore the complexity of plant stress responses [47]. Above all, the interplay between transcription and translation responses has enhanced the flexibility of gene expression, thereby facilitating adaptation.
We also observed that LN has a negative impact on the TE (Figure 3A). Six hundred fifty-two genes with significant differences in TE were obtained and primarily associated with N metabolism, glutathione metabolism, MAPK signaling pathway, and plant hormone signaling (Figure 3B,C). Notably, several genes involved in the N metabolic pathway exhibited significantly decreased TE under LN (Figure 3D). In Arabidopsis, hypoxia selectively alters the TE of mRNAs, with similar results in drought-stressed maize and low-temperature treated tea plants [47,49,73]. Collectively, the alteration of TE is also an important mechanism by which plants respond to external stimuli.

4.2. Identification of Key Genes in Response to LN

By integrating RNA-seq with Ribo-seq data, a set of overlapping genes that are significantly changed at both the transcription and translation levels by LN have been highlighted (Figure 2C,D). NRT, NR, NiR, GS, and GOGAT are the main components of the NO3 absorption and assimilation process [16,17,18,19]. The diverse functions of NRT in NO3 transport, sensing, and signaling have been extensively studied. Several NRTs with both high and low affinity have been identified and functionally analyzed in plants. ZmNPF6.4 is a high-affinity, chloride-selective transporter localized in the plasma membrane, whereas ZmNPF6.6 has been demonstrated as a high-affinity NO3-specific transporter and preferentially expressed in roots [22]. Very recently, ZmNRT1.1B has been proven to function in high-affinity NO3 uptake and signaling, and the overexpression of ZmNRT1.1B confers a high grain yield under N-limiting fields [23].
The expression of certain NRT transporters, including ZmNRT1.1B, ZmNRT2.1, and ZmNRT2.2 was significantly reduced in LN condition (Figure 2C). Most significantly, the expression of ZmNRT2.1 was remarkably repressed at both the transcription and translation levels, resulting in a more than 20-fold reduction (Figure 2C). NR and NiR facilitate the initiation of inorganic N utilization, while the GS/GOGAT cycle converts inorganic N into organic N, which plays a crucial role in crop N assimilation. In Arabidopsis, simultaneous suppression of NIA1 and NIA2 resulted in 99.5% decreased NR activity, further resulting in severe growth retardation [74]. Overexpression of OsNR2 led to increased effective tiller number and grain yield when grown with NO3 as the primary N source [75]. ZmNIAC and ZmNIAD encode NIA responsible for reducing NO3 to NO2, and expression levels were remarkably repressed under LN (Figure 2C). Besides, the expression abundance of two NIR genes, ZmNIRA and ZmNIRB, was significantly downregulated under LN conditions, with the largest decrease over 95% (Figure 2C). Previous studies have found that ZmGLN2 may be required for root NO3 metabolism [76]. ZmGLN2 exhibited a reduction of expression under LN supply, implying its vital role in NO3 assimilation (Figure 2C).
A comprehensive analysis of the rice transcriptome and metabolome indicated significant impacts on phenylpropanoid metabolism under LN condition [77]. Similarly, a multi-omics analysis in apple also revealed that phenylpropanoid metabolism was affected by N availability [78]. In this study, LN generally downregulated the abundance of genes involved in phenylpropanoid biosynthesis at both transcription and translation levels, particularly peroxidases related to the polymerization of lignin monomers, including Zm00001eb381290, Zm00001eb109910, Zm00001eb328780, Zm00001eb058250, Zm00001eb328810, Zm00001eb390690, and Zm00001eb017950, and Zm00001eb017960 (Figure 2D). These results highlighted the coordinated regulation of N metabolism and phenylpropanoid biosynthesis under N deficiency.

4.3. Regulatory Networks Controlling Responses to LN

Chromatin is a dynamic structure that undergoes changes in response to environmental stimuli, playing a crucial role in the regulation of transcriptional responses [79]. Here, we offer a chromatin accessibility landscape of maize roots under LN (Figure 5A–D). There was a notable upregulation in gene expression level linked to distal or local OCRs, indicating an enhancer-like feature of distal OCRs, consistent with previous reports in rice and soybean (Figure S7) [80,81]. Moreover, we detected 2492 DOCRs distributed in the 2 kb upstream promoter after LN treatment based on ATAC-seq, of which 107 genes were differentially expressed in transcriptional, translational, or both levels (Table S12).
Besides serving as a nutrient in plants, NO3 also functions as a powerful signaling molecule that regulates gene expression, metabolism, physiology, and growth and developmental processes on a genome-wide scale [82]. Over the past two decades, numerous studies have revealed a wide range of regulators involved in NO3 signaling [83]. In comparison with model plant Arabidopsis and rice, the underlying regulation of N uptake and utilization remains to be elucidated in maize.
In this study, we selected a core set of enzymes involved in N metabolism covering NO3 absorption and assimilation, as well as genes related to phenylpropanoid metabolism as target genes. Furthermore, we constructed a transcriptional regulatory network comprising TFs and structure genes based on the RNA-Seq data from 158 diverse maize inbred lines (Figure 6A). In the constructed network, some are known as N-regulatory TFs. For example, Zm00001eb051620 (ZmLBD37), and its homolog AtLBD37 function as important regulatory components of the NO3 response in Arabidopsis roots [26]. ZmWRKY27 and ZmABI37 were identified as key components as hub genes primarily act on the N metabolism. ZmWRKY27 was found to bind to the promoters of ZmAsnS3, ZmNRT2.1, ZmNRT2.2, and ZmNIRB, while ZmABI37 regulated the expression of ZmNRT1.1B, ZmNRT2.1, and ZmNIRA in the resulting network (Figure 6A). A significant positive correlation was observed between the expression of ZmWRKY27 and ZmABI37 with ZmNRT2.1 (Figure 6B,C). Furthermore, both ZmWRKY27 and ZmABI37 were downregulated under LN supply (Figure S9A). Dual luciferase fluorescence assay further confirmed that ZmWRKY27 and ZmABI37 directly bind to the promoter of ZmNRT2.1 and activate its expression (Figure S9B and Figure 6D,E). The high-confidence regulatory TFs validate the reliability of our results and provide new insights into the regulatory relationships of LN-responsive gene expression. Roots are crucial organs for N uptake, making them significant tissues for studying responses to changes in N supply. This study focuses on maize roots, utilizing multi-omics methods to gain a deeper understanding of the response mechanisms to LN conditions. However, the key pathways and genes for N response are largely conserved across species. Therefore, the multi-omics methods and the constructed transcriptional regulatory network can serve as a reference framework for research into other plants or tissues.

5. Conclusions

In summary, we first combined RNA-seq and Ribo-seq to clarify the important roles of N metabolism and phenylpropanoid pathways in the response to LN conditions, and identified key genes responsive to LN in both pathways. Furthermore, we observed a notable discrepancy between transcriptional and translational responses, highlighting the complexity of maize roots’ responses to LN. Additionally, the changes in TEs are also one of the response mechanisms of plants to LN. In conclusion, we developed a transcriptional regulatory network connecting core structure genes, which are regulated by TFs, and identified several hub TFs. Our study provides a new understanding and genetic resources for improving maize NUE.

Supplementary Materials

The following supporting information can be downloaded at: https://www.mdpi.com/article/10.3390/agronomy14071541/s1, Figure S1: Characteristics of RNA-seq and Ribo-seq data in maize roots under LN. (A) Distribution of RFs lengths in CK and LN samples, RFs: ribosome footprints. (B) Distribution of RF across the genome in maize roots under CK and LN. (C) Overview of mRNA abundance distribution at transcription and translation levels in maize roots under CK and LN. (D) Correlation analysis between transcription and translation levels under CK and LN; Figure S2: TFs differentially expressed under LN at transcriptional (A) and translational (B) levels; Figure S3: Gene expression at transcriptional and translational levels of Zm00001eb256260 and Zm00001eb381300; Figure S4: Expression levels of genes involved in N (A) and phenylalanine metabolism (B) in maize roots under CK and LN conditions, respectively; Figure S5: The sequence characteristics of genes affect TE. (A–C) Comparison of length, GC content, and NFME for CDS (A), 5′UTR (B) and 3′UTR (C) of genes in the four TE groups under LN. (D–F) Analysis of the differences in length, GC content, and NFME for CDS (D), 5′UTR (E), and 3′UTR (F) of genes in the four TE groups from CK samples. Figure S6: Identification and characteristics of uORFs in CK samples. (A) Length distribution of the translated uORFs in the CK samples. (B-F) Comparison between translated and untranslated uORFs in terms of uORF length (B), 5′UTR length (C), NMFE (D), and normalized distance to CDS start (E) in CK samples. F, Comparison of sequence features of translated and untranslated uORFs near ATG start codon under CK. * indicated statistically significant differences at p < 0.05 based on the Chi-squared test. (G) Analysis of GC content of the sequence around the ATG start codon for translated and untranslated uORFs under CK. (H) Comparative analysis of TE in genes without any translated uORF, genes with a single translated uORF, and genes with multiple translated uORFs under CK. The p-value was determined using the Kolmogorov–Smirnov test; Figure S7: Expression analysis of genes associated with only local, only distal, and both local and distal OCRs. The expression levels of genes associated with both local OCR and distal OCR were significantly higher compared to those associated with only distal OCR or local OCR in LN (A) and CK (B) samples; Figure S8: KEGG enriched pathways of 107 DOCRs-associated genes; Figure S9: ZmWRKY27 and ZmABI37 directly regulates the expression of ZmNRT2.1. A, Expression analysis of ZmWRKY27 and ZmABI37 in maize roots under CK and LN. B, Schematic diagram indicates the constructs of reporters and effector; Table S1: The information of the 158 maize inbred lines used for transcriptome analysis; Table S2: Primers used in the study; Table S3: Information of differentially expressed genes at the transcription level; Table S4: Information of differentially expressed genes at the translation level; Table S5: KEGG enriched pathways of differentially expressed genes at the transcription level; Table S6: KEGG enriched pathways of differentially expressed genes at the translation level; Table S7: KEGG enriched pathways of genes in five groups; Table S8: Genes with significant differences in TE; Table S9: Information of differentially expressed uORFs; Table S10: OCRs comparison between CK and LN; Table S11: The top 30 most enriched binding motifs predicted at DOCRs in promoter region; Table S12: Information of 107 DOCRs-associated genes; Table S13: 126 TF-target correlations between 49 TFs and 17 potential targets.

Author Contributions

C.X., H.W. and P.L. conceived and designed the study; Z.Y., H.W. and P.L. designed the experiments; software, T.Z, and S.F.; S.F., M.J., T.Z., X.T. and X.Z. conducted the experiments; writing—original draft preparation, S.F., C.X., H.W. and P.L.; writing—review and editing, S.F., C.X., H.W. and P.L.; funding acquisition, C.X., H.W., P.L. and Y.W. All authors have read and agreed to the published version of the manuscript.

Funding

This work was supported by the National Natural Science Foundation of China (31902101), the Key Research and Development Program of Jiangsu Province, China (BE2022343), the Seed Industry Revitalization Project of Jiangsu Province, China (JBGS[2021]009), the Innovative Research Team of Universities in Jiangsu Province, the High-end Talent Project of Yangzhou University, the Priority Academic Program Development of Jiangsu Higher Education Institutions (PAPD), and the Qing Lan Project of Jiangsu Province, China.

Data Availability Statement

The data sets supporting the results of this article are included within the article (and its Supplementary Files).

Conflicts of Interest

The authors declare no conflicts of interest.

References

  1. Crawford, N.M.; Forde, B.G. Molecular and developmental biology of inorganic nitrogen nutrition. Arab. Book 2002, 1, e0011. [Google Scholar] [CrossRef] [PubMed]
  2. Kusano, M.; Fukushima, A.; Redestig, H.; Saito, K. Metabolomic approaches toward understanding nitrogen metabolism in plants. J. Exp. Bot. 2011, 62, 1439–1453. [Google Scholar] [CrossRef] [PubMed]
  3. Ladha, J.K.; Pathak, H.; Krupnik, T.J.; Six, J.; Kessel, C.V. Efficiency of fertilizer nitrogen in cereal production: Retrospects and prospects. Adv. Agron. 2005, 87, 85–156. [Google Scholar]
  4. Frink, C.R.; Waggoner, P.E.; Ausubel, J.H. Nitrogen fertilizer: Retrospect and prospect. Proc. Natl. Acad. Sci. USA 1999, 96, 1175–1180. [Google Scholar] [CrossRef] [PubMed]
  5. Hou, Z.; Li, P.; Li, B.; Gong, J.; Wang, Y. Effects of fertigation scheme on N uptake and N use efficiency in cotton. Plant Soil 2007, 290, 115–126. [Google Scholar] [CrossRef]
  6. Ding, W.; Xu, X.; He, P.; Ullah, S.; Zhang, J.; Cui, Z.; Zhou, W. Improving yield and nitrogen use efficiency through alternative fertilization options for rice in China: A meta-analysis. Field Crops Res. 2018, 227, 11–18. [Google Scholar] [CrossRef]
  7. Li, H.; Hu, B.; Chu, C. Nitrogen use efficiency in crops: Lessons from Arabidopsis and rice. J. Exp. Bot. 2017, 68, 2477–2488. [Google Scholar] [CrossRef] [PubMed]
  8. Święcick, W.K.; Surma, M. The big five in the world of plants–the species that have changed the course of history. Pol. J. Agron. 2021, 47, 68–77. [Google Scholar]
  9. Różewicz, M. Production, use and efficiency of utilising grains of various cereal species as feed resources for poultry production. Pol. J. Agron. 2019, 38, 66–74. [Google Scholar]
  10. Simons, M.; Saha, R.; Guillard, L.; Clément, G.; Armengaud, P.; Cañas, R.; Maranas, C.D.; Lea, P.J.; Hirel, B. Nitrogen-use efficiency in maize (Zea mays L.): From ‘omics’ studies to metabolic modelling. J. Exp. Bot. 2014, 65, 5657–5671. [Google Scholar] [CrossRef]
  11. Kant, S. Understanding nitrate uptake, signaling and remobilisation for improving plant nitrogen use efficiency. Semin. Cell Dev. Biol. 2018, 74, 89–96. [Google Scholar] [CrossRef] [PubMed]
  12. Li, S.; Ji, M.; Liu, F.; Zhu, M.; Yang, Y.; Zhang, W.; Liu, S.; Wang, Y.; Lv, W.; Qi, S. NRG2 family members of Arabidopsis and maize regulate nitrate signalling and promote nitrogen use efficiency. Physiol. Plant. 2024, 176, e14251. [Google Scholar] [CrossRef] [PubMed]
  13. Kiba, T.; Krapp, A. Plant nitrogen acquisition under low availability: Regulation of uptake and root architecture. Plant Cell Physiol. 2016, 57, 707–714. [Google Scholar] [CrossRef] [PubMed]
  14. Crawford, N.M. Nitrate: Nutrient and signal for plant growth. Plant Cell 1995, 7, 859–868. [Google Scholar]
  15. Garnett, T.; Conn, V.; Kaiser, B.N. Root based approaches to improving nitrogen use efficiency in plants. Plant Cell Environ. 2009, 32, 1272–1283. [Google Scholar] [CrossRef] [PubMed]
  16. Fan, X.; Naz, M.; Fan, X.; Xuan, W.; Miller, A.J.; Xu, G. Plant nitrate transporters: From gene function to application. J. Exp. Bot. 2017, 68, 2463–2475. [Google Scholar] [CrossRef] [PubMed]
  17. Gojon, A.; Nacry, P.; Davidian, J.C. Root uptake regulation: A central process for NPS homeostasis in plants. Curr. Opin. Plant Biol. 2009, 12, 328–338. [Google Scholar] [CrossRef] [PubMed]
  18. Tabuchi, M.; Abiko, T.; Yamaya, T. Assimilation of ammonium ions and reutilization of nitrogen in rice (Oryza sativa L.). J. Exp. Bot. 2007, 58, 2319–2327. [Google Scholar] [CrossRef] [PubMed]
  19. Xu, G.; Fan, X.; Miller, A.J. Plant nitrogen assimilation and use efficiency. Annu. Rev. Plant Biol. 2012, 63, 153–182. [Google Scholar] [CrossRef]
  20. Liu, K.H.; Tsay, Y.F. Switching between the two action modes of the dual-affinity nitrate transporter CHL1 by phosphorylation. EMBO J. 2003, 22, 1005–1013. [Google Scholar] [CrossRef]
  21. Hu, B.; Wang, W.; Ou, S.; Tang, J.; Li, H.; Che, R.; Zhang, Z.; Chai, X.; Wang, H.; Wang, Y. Variation in NRT1.1B contributes to nitrate-use divergence between rice subspecies. Nat. Genet. 2015, 47, 834–838. [Google Scholar] [CrossRef] [PubMed]
  22. Wen, Z.; Tyerman, S.D.; Dechorgnat, J.; Ovchinnikova, E.; Dhugga, K.S.; Kaiser, B.N. Maize npf6 proteins are homologs of Arabidopsis chl1 that are selective for both nitrate and chloride. Plant Cell 2017, 29, 2581–2596. [Google Scholar] [CrossRef] [PubMed]
  23. Cao, H.; Liu, Z.; Guo, J.; Jia, Z.; Shi, Y.; Kang, K.; Peng, W.; Wang, Z.; Chen, L.; Neuhaeuser, B.; et al. ZmNRT1.1B (ZmNPF6.6) determines nitrogen use efficiency via regulation of nitrate transport and signalling in maize. Plant Biotechnol. J. 2023, 22, 316–329. [Google Scholar] [CrossRef] [PubMed]
  24. Marchive, C.; Roudier, F.; Castaings, L.; Brehaut, V.; Blondet, E.; Colot, V.; Meyer, C.; Krapp, A. Nuclear retention of the transcription factor NLP7 orchestrates the early response to nitrate in plants. Nat. Commun. 2013, 4, 1713. [Google Scholar] [CrossRef] [PubMed]
  25. Guan, P.; Wang, R.; Nacry, P.; Breton, G.; Kay, S.A.; Pruneda-Paz, J.L.; Davani, A.; Crawford, N.M. Nitrate foraging by Arabidopsis roots is mediated by the transcription factor TCP20 through the systemic signaling pathway. Proc. Natl. Acad. Sci. USA 2014, 111, 15267–15272. [Google Scholar] [CrossRef] [PubMed]
  26. Rubin, G.; Tohge, T.; Matsuda, F.; Saito, K.; Scheible, W.R. Members of the LBD family of transcription factors repress anthocyanin synthesis and affect additional nitrogen responses in Arabidopsis. Plant Cell 2009, 21, 3567–3584. [Google Scholar] [CrossRef] [PubMed]
  27. Vidal, E.A.; Moyano, T.C.; Riveras, E.; Contreras-Lopez, O.; Gutierrez, R.A. Systems approaches map regulatory networks downstream of the auxin receptor AFB3 in the nitrate response of Arabidopsis thaliana roots. Proc. Natl. Acad. Sci. USA 2013, 110, 12840–12845. [Google Scholar] [CrossRef] [PubMed]
  28. Vidal, E.A.; Alvarez, J.M.; Gutierrez, R.A. Nitrate regulation of AFB3 and NAC4 gene expression in Arabidopsis roots depends on NRT1.1 nitrate transport function. Plant Signal. Behav. 2014, 9, e28501. [Google Scholar] [CrossRef] [PubMed]
  29. Medici, A.; Marshall-Colon, A.; Ronzier, E.; Szponarski, W.; Wang, R.; Gojon, A.; Crawford, N.M.; Ruffel, S.; Coruzzi, G.M.; Krouk, G. AtNIGT1/HRS1 integrates nitrate and phosphate signals at the Arabidopsis root tip. Nat. Commun. 2015, 6, 6274. [Google Scholar] [CrossRef]
  30. Krouk, G.; Mirowski, P.; LeCun, Y.; Shasha, D.E.; Coruzzi, G.M. Predictive network modeling of the high-resolution dynamic plant transcriptome in response to nitrate. Genome Biol. 2010, 11, R123. [Google Scholar] [CrossRef]
  31. Xu, N.; Wang, R.; Zhao, L.; Zhang, C.; Li, Z.; Lei, Z.; Liu, F.; Guan, P.; Chu, Z.; Crawford, N.M.; et al. The Arabidopsis NRG2 protein mediates nitrate signaling and interacts with and regulates key nitrate regulators. Plant Cell 2016, 28, 485–504. [Google Scholar] [CrossRef] [PubMed]
  32. Ge, M.; Wang, Y.; Liu, Y.; Jiang, L.; He, B.; Ning, L.; Du, H.; Lv, Y.; Zhou, L.; Lin, F.; et al. The NIN-like protein 5 (ZmNLP5) transcription factor is involved in modulating the nitrogen response in maize. Plant J. 2020, 102, 353–368. [Google Scholar] [CrossRef] [PubMed]
  33. Liu, Y.; Jia, Z.; Li, X.; Wang, Z.; Chen, F.; Mi, G.; Forde, B.; Takahashi, H.; Yuan, L. Involvement of a truncated MADS-box transcription factor ZmTMM1 in root nitrate foraging. J. Exp. Bot. 2020, 71, 4547–4561. [Google Scholar] [CrossRef] [PubMed]
  34. Wang, R.; Zhong, Y.; Han, J.; Huang, L.; Wang, Y.; Shi, X.; Li, M.; Zhuang, Y.; Ren, W.; Liu, X. NIN-LIKE PROTEIN3.2 inhibits repressor Aux/IAA14 expression and enhances root biomass in maize seedlings under low nitrogen. Plant Cell 2024, koae184. [Google Scholar] [CrossRef] [PubMed]
  35. Li, P.; Chen, F.; Cai, H.; Liu, J.; Pan, Q.; Liu, Z.; Gu, R.; Mi, G.; Zhang, F.; Yuan, L. A genetic relationship between nitrogen use efficiency and seedling root traits in maize as revealed by QTL analysis. J. Exp. Bot. 2015, 66, 3175–3188. [Google Scholar] [CrossRef] [PubMed]
  36. Li, P.; Zhuang, Z.; Cai, H.; Cheng, S.; Soomro, A.A.; Liu, Z.; Gu, R.; Mi, G.; Yuan, L.; Chen, F. Use of genotype-environment interactions to elucidate the pattern of maize root plasticity to nitrogen deficiency. J. Integr. Plant Biol. 2016, 58, 242–253. [Google Scholar] [CrossRef] [PubMed]
  37. Ma, N.; Dong, L.; Lü, W.; Lü, J.; Meng, Q.; Liu, P. Transcriptome analysis of maize seedling roots in response to nitrogen-, phosphorus-, and potassium deficiency. Plant Soil 2020, 447, 637–658. [Google Scholar] [CrossRef]
  38. Trevisan, S.; Manoli, A.; Ravazzolo, L.; Botton, A.; Pivato, M.; Masi, A.; Quaggiotti, S. Nitrate sensing by the maize root apex transition zone: A merged transcriptomic and proteomic survey. J. Exp. Bot. 2015, 66, 3699–3715. [Google Scholar] [CrossRef] [PubMed]
  39. Para, A.; Li, Y.; Marshall-Colón, A.; Varala, K.; Francoeur, N.J.; Moran, T.M.; Edwards, M.B.; Hackley, C.; Bargmann, B.O.R.; Birnbaum, K.D.; et al. Hit-and-run transcriptional control by bZIP1 mediates rapid nutrient signaling in Arabidopsis. Proc. Natl. Acad. Sci. USA 2014, 111, 10371–10376. [Google Scholar] [CrossRef]
  40. Qi, J.; Yu, L.; Ding, J.; Ji, C.; Wang, S.; Wang, C.; Ding, G.; Shi, L.; Xu, F.; Cai, H. Transcription factor OsSNAC1 positively regulates nitrate transporter gene expression in rice. Plant Physiol. 2024, 192, 2923–2942. [Google Scholar]
  41. Konishi, M.; Yanagisawa, S. Arabidopsis NIN-like transcription factors have a central role in nitrate signalling. Nat. Commun. 2013, 4, 1617. [Google Scholar] [CrossRef] [PubMed]
  42. Kenchanmane Raju, S.K. Comparative profiling examines roles of dna regulatory sequences and accessible chromatin during cold stress response in grasses. Plant Cell 2020, 32, 2451–2452. [Google Scholar] [CrossRef] [PubMed]
  43. Li, P.; Zheng, T.; Li, L.; Liu, W.; Qiu, L.; Ahmad, S.; Wang, J.; Cheng, T.; Zhang, Q.; Beckles, D. Integration of chromatin accessibility and gene expression reveals new regulators of cold hardening to enhance freezing tolerance in Prunus mume. J. Exp. Bot. 2023, 74, 2173–2187. [Google Scholar] [CrossRef] [PubMed]
  44. Pei, H.; Teng, W.; Gao, L.; Gao, H.; Ren, X.; Liu, Y.; Jia, J.; Tong, Y.; Wang, Y.; Lu, Z. Low-affinity SPL binding sites contribute to subgenome expression divergence in allohexaploid wheat. Sci. China Life Sci. 2022, 66, 819–834. [Google Scholar] [CrossRef]
  45. Wu, Z.; Jiang, Z.; Li, Z.; Jiao, P.; Zhai, J.; Liu, S.; Han, X.; Zhang, S.; Sun, J.; Gai, Z.; et al. Multi-omics analysis reveals spatiotemporal regulation and function of heteromorphic leaves in Populus. Plant Physiol. 2023, 192, 188–204. [Google Scholar] [CrossRef] [PubMed]
  46. Ingolia, N.T.; Ghaemmaghami, S.; Newman, J.R.S.; Weissman, J.S. Genome-wide analysis in vivo of translation with nucleotide resolution using ribosome profiling. Science 2009, 324, 218–223. [Google Scholar] [CrossRef] [PubMed]
  47. Lei, L.; Shi, J.; Chen, J.; Zhang, M.; Sun, S.; Xie, S.; Li, X.; Zeng, B.; Peng, L.; Hauck, A.; et al. Ribosome profiling reveals dynamic translational landscape in maize seedlings under drought stress. Plant J. 2015, 84, 1206–1218. [Google Scholar] [CrossRef]
  48. Shalgi, R.; Hurt, J.A.; Krykbaeva, I.; Taipale, M.; Lindquist, S.; Burge, C.B. Widespread regulation of translation by elongation pausing in heat shock. Mol. Cell 2013, 49, 439–452. [Google Scholar] [CrossRef]
  49. Wang, P.; Jin, S.; Chen, X.; Wu, L.; Zheng, Y.; Yue, C.; Guo, Y.; Zhang, X.; Yang, J.; Ye, N. Chromatin accessibility and translational landscapes of tea plants under chilling stress. Hortic. Res. 2021, 8, 96. [Google Scholar] [CrossRef]
  50. Wang, J.; Li, Y.; Li, M.; Zhang, W.; Lu, Y.; Hua, K.; Ling, X.; Chen, T.; Guo, D.; Yang, Y. Translatome and transcriptome analyses reveal the mechanism that underlies the enhancement of salt stress by the small peptide Ospep5 in plants. J. Agric. Food Chem. 2024, 72, 4277–4291. [Google Scholar] [CrossRef]
  51. Qanmber, G.; You, Q.; Yang, Z.; Fan, L.; Zhang, Z.; Chai, M.; Gao, B.; Li, F.; Yang, Z. Transcriptional and translational landscape fine-tune genome annotation and explores translation control in cotton. J. Adv. Res. 2024, 58, 13–30. [Google Scholar] [CrossRef] [PubMed]
  52. Schnable, P.S.; Ware, D.; Fulton, R.S.; Stein, J.C.; Wei, F.; Pasternak, S.; Liang, C.; Zhang, J.; Fulton, L.; Graves, T.A. The B73 maize genome: Complexity, diversity, and dynamics. Science 2009, 326, 1112–1115. [Google Scholar] [CrossRef] [PubMed]
  53. Wang, Y.; Sun, H.; Wang, H.; Yang, X.; Xu, Y.; Yang, Z.; Xu, C.; Li, P. Integrating transcriptome, co-expression and QTL-seq analysis reveals that primary root growth in maize is regulated via flavonoid biosynthesis and auxin signal transduction. J. Exp. Bot. 2021, 72, 4773–4795. [Google Scholar] [CrossRef] [PubMed]
  54. Wang, Y.; Zhu, T.; Yang, J.; Wang, H.; Ji, W.; Xu, Y.; Yang, Z.; Xu, C.; Li, P. GWAS and transcriptome analysis reveal key genes affecting root growth under low nitrogen supply in maize. Genes 2022, 13, 1632. [Google Scholar] [CrossRef] [PubMed]
  55. Kim, D.; Langmead, B.; Salzberg, S.L. HISAT: A fast spliced aligner with low memory requirements. Nat. Methods 2015, 12, 357–360. [Google Scholar] [CrossRef] [PubMed]
  56. Pertea, M.; Pertea, G.M.; Antonescu, C.M.; Chang, T.C.; Mendell, J.T.; Salzberg, S.L. StringTie enables improved reconstruction of a transcriptome from RNA-seq reads. Nat. Biotechnol. 2015, 33, 290–295. [Google Scholar] [CrossRef] [PubMed]
  57. Anders, S.; Huber, W. Differential expression analysis for sequence count data. Genome Biol. 2010, 11, R106. [Google Scholar] [CrossRef] [PubMed]
  58. Chen, S.; Zhou, Y.; Chen, Y.; Gu, J. fastp: An ultra-fast all-in-one FASTQ preprocessor. Bioinformatics 2018, 34, 884–890. [Google Scholar] [CrossRef] [PubMed]
  59. Langmead, B.; Salzberg, S.L. Fast gapped-read alignment with Bowtie 2. Nat. Methods 2012, 9, 357–359. [Google Scholar] [CrossRef]
  60. Dobin, A.; Davis, C.A.; Schlesinger, F.; Drenkow, J.; Zaleski, C.; Jha, S.; Batut, P.; Chaisson, M.; Gingeras, T.R. STAR: Ultrafast universal RNA-seq aligner. Bioinformatics 2013, 29, 15–21. [Google Scholar] [CrossRef]
  61. Li, B.; Dewey, C.N. RSEM: Accurate transcript quantification from RNA-Seq data with or without a reference genome. BMC Bioinform. 2011, 12, 323. [Google Scholar] [CrossRef] [PubMed]
  62. Robinson, M.D.; McCarthy, D.J.; Smyth, G.K. edgeR: A Bioconductor package for differential expression analysis of digital gene expression data. Bioinformatics 2010, 26, 139–140. [Google Scholar] [CrossRef] [PubMed]
  63. Zhong, Y.; Karaletsos, T.; Drewe, P.; Sreedharan, V.T.; Kuo, D.; Singh, K.; Wendel, H.G.; Ratsch, G. RiboDiff: Detecting changes of mRNA translation efficiency from ribosome footprints. Bioinformatics 2017, 33, 139–141. [Google Scholar] [CrossRef] [PubMed]
  64. Bajic, M.; Maher, K.A.; Deal, R.B. Identification of open chromatin regions in plant genomes using atac-seq. Methods Mol. Biol. 2018, 1675, 183–201. [Google Scholar] [PubMed]
  65. Zhang, Y.; Liu, T.; Meyer, C.A.; Eeckhoute, J.; Johnson, D.S.; Bernstein, B.E.; Nusbaum, C.; Myers, R.M.; Brown, M.; Li, W.; et al. Model-based analysis of ChIP-Seq (MACS). Genome Biol. 2008, 9, R137. [Google Scholar] [CrossRef]
  66. Yu, G.; Wang, L.G.; He, Q.Y. ChIPseeker: An R/Bioconductor package for ChIP peak annotation, comparison and visualization. Bioinformatics 2015, 31, 2382–2383. [Google Scholar] [CrossRef] [PubMed]
  67. Bailey, T.L.; Boden, M.; Buske, F.A.; Frith, M.; Grant, C.E.; Clementi, L.; Ren, J.; Li, W.W.; Noble, W.S. MEME SUITE: Tools for motif discovery and searching. Nucleic Acids Res. 2009, 37, W202–W208. [Google Scholar] [CrossRef]
  68. Huynh-Thu, V.A.; Irrthum, A.; Wehenkel, L.; Geurts, P. Inferring regulatory networks from expression data using tree-based methods. PLoS ONE 2010, 5, e12776. [Google Scholar] [CrossRef]
  69. Bastian, M.; Heymann, S.; Jacomy, M. Gephi: An open source software for exploring and manipulating networks. Proc. Int. AAAI Conf. Web Soc. Media 2009, 3, 361–362. [Google Scholar] [CrossRef]
  70. Gaudinier, A.; Rodriguez-Medina, J.; Zhang, L.; Olson, A.; Liseron-Monfils, C.; Bagman, A.-M.; Foret, J.; Abbitt, S.; Tang, M.; Li, B.; et al. Transcriptional regulation of nitrogen-associated metabolism and growth. Nature 2018, 563, 259–264. [Google Scholar] [CrossRef]
  71. Ivanov, I.P.; Loughran, G.; Atkins, J.F. uORFs with unusual translational start codons autoregulate expression of eukaryotic ornithine decarboxylase homologs. Proc. Natl. Acad. Sci. USA 2008, 105, 10079–10084. [Google Scholar] [CrossRef] [PubMed]
  72. Sonenberg, N.; Hinnebusch, A.G. Regulation of translation initiation in eukaryotes: Mechanisms and biological targets. Cell 2009, 136, 731–745. [Google Scholar] [CrossRef] [PubMed]
  73. Juntawong, P.; Girke, T.; Bazin, J.; Bailey-Serres, J. Translational dynamics revealed by genome-wide profiling of ribosome footprints in Arabidopsis. Proc. Natl. Acad. Sci. USA 2014, 111, E203–E212. [Google Scholar] [CrossRef] [PubMed]
  74. Wilkinson, J.Q.; Crawford, N.M. Identification and characterization of a chlorate-resistant mutant of Arabidopsis thaliana with mutations in both nitrate reductase structural genes NIA1 and NIA2. Mol. Gen. Genet. 1993, 239, 289–297. [Google Scholar] [CrossRef] [PubMed]
  75. Gao, Z.; Wang, Y.; Chen, G.; Zhang, A.; Yang, S.; Shang, L.; Wang, D.; Ruan, B.; Liu, C.; Jiang, H.; et al. The indica nitrate reductase gene OsNR2 allele enhances rice yield potential and nitrogen use efficiency. Nat. Commun. 2019, 10, 5207. [Google Scholar] [CrossRef] [PubMed]
  76. Prinsi, B.; Espen, L. Mineral nitrogen sources differently affect root glutamine synthetase isoforms and amino acid balance among organs in maize. BMC Plant Biol. 2015, 15, 96. [Google Scholar] [CrossRef] [PubMed]
  77. Xin, W.; Zhang, L.; Zhang, W.; Gao, J.; Yi, J.; Zhen, X.; Du, M.; Zhao, Y.; Chen, L. An integrated analysis of the rice transcriptome and metabolome reveals root growth regulation mechanisms in response to nitrogen availability. Int. J. Mol. Sci. 2019, 20, 5893. [Google Scholar] [CrossRef] [PubMed]
  78. Wang, F.; Ge, S.; Xu, X.; Xing, Y.; Du, X.; Zhang, X.; Lv, M.; Liu, J.; Zhu, Z.; Jiang, Y. Multiomics analysis reveals new insights into the apple fruit quality decline under high nitrogen conditions. J. Agric. Food Chem. 2021, 69, 5559–5572. [Google Scholar] [CrossRef]
  79. Potter, K.C.; Wang, J.; Schaller, G.E.; Kieber, J.J. Cytokinin modulates context-dependent chromatin accessibility through the type-B response regulators. Nat. Plants 2018, 4, 1102–1111. [Google Scholar] [CrossRef]
  80. Huang, M.K.; Zhang, L.; Zhou, L.M.; Yung, W.S.; Li, M.W.; Lam, H.M. Genomic features of open chromatin regions (OCRs) in wild soybean and their effects on gene expressions. Genes 2021, 12, 640. [Google Scholar] [CrossRef]
  81. Wang, G.; Li, X.; Shen, W.; Li, M.W.; Huang, M.; Zhang, J.; Li, H. The chromatin accessibility landscape of pistils and anthers in rice. Plant Physiol. 2022, 190, 2797–2811. [Google Scholar] [CrossRef] [PubMed]
  82. Fredes, I.; Moreno, S.; Diaz, F.P.; Gutierrez, R.A. Nitrate signaling and the control of Arabidopsis growth and development. Curr. Opin. Plant Biol. 2019, 47, 112–118. [Google Scholar] [CrossRef] [PubMed]
  83. Vidal, E.A.; Alvarez, J.M.; Araus, V.; Riveras, E.; Brooks, M.D.; Krouk, G.; Ruffel, S.; Lejay, L.; Crawford, N.M.; Coruzzi, G.M.; et al. Nitrate in 2020: Thirty years from transport to signaling networks. Plant Cell 2020, 32, 2094–2119. [Google Scholar] [CrossRef] [PubMed]
Figure 1. Transcriptional and translational response to LN. (A) The numbers of DEGs at transcription and translation levels under LN conditions. (B,C) KEGG enrichment analysis of the DEGs at transcription (B) and translation (C) levels. KEGG terms related to N metabolism, phenylpropanoid biosynthesis, and metabolism of various amino acids were highlighted in green, blue, and orange, respectively. (D) The relationship between LN-responsive genes at transcriptional and translational levels. (E) IGV showing RNA-seq and Ribo-seq abundance across 10 chromosomes. Simultaneous changes at transcription and translation levels caused by LN are highlighted in green shades. Only changes at the transcriptional or translational level are shown in yellow shades.
Agronomy 14 01541 g001
Figure 2. Transcriptional and translational regulation under LN. (A) Scatterplot illustrating the alterations in transcription and translation levels induced by LN treatment. (B) KEGG enrichment analysis for genes in transcription group, translation group, homo-directional group, opposite group, and unchanged group. (C) Transcriptome and translational profiling of genes involved in N uptake and assimilation. The expression data were converted to log2(FPKM) to calculate the expression levels. Zm00001eb023600 (ZmNRT1.1B); Zm00001eb209670 (ZmNRT2.1); Zm00001eb209690 (ZmNRT2.2); Zm00001eb176470 (ZmNIAC); Zm00001eb037860 (ZmNIAD); Zm00001eb193660 (ZmNIRA); Zm00001eb255880 (ZmNIRB); Zm00001eb432580 (ZmGLN2); Zm00001eb013430 (ZmAsnS3). (D) Expression levels of peroxidases involved in phenylpropanoid biosynthesis at transcription and translation levels. The expression data were converted to log2(FPKM) to calculate the expression levels.
Agronomy 14 01541 g002
Figure 3. LN modifies the translational efficiency (TE) of genes. (A) Overview of distribution of TE under CK and LN conditions. (B) The number of genes with significant changes in TE under LN condition. (C) KEGG enrichment analysis for genes with significant differences in TE. (D) Comparison of TE for several N metabolism-related genes under both CK and LN conditions.
Agronomy 14 01541 g003
Figure 4. Identification and characteristics of uORFs in maize roots under LN. (A) Length distribution of the translated uORFs in the LN samples. (BE) Comparison of uORF length (B), 5′UTR length (C), NMFE (D), and normalized distance to CDS start (E) between translated and untranslated uORFs in maize roots under N deficiency. The p-value was calculated by Student’s t-test. (F) Comparison of sequence features between translated and untranslated uORFs near ATG start codon under LN supply. * indicated statistically significant differences based on the Chi-squared test (p < 0.05). (G) Analysis of the GC content of the sequence around the ATG start codon for translated and untranslated uORFs. (H) Comparative analysis of TE in genes without any translated uORF, genes with a single translated uORF, and genes with multiple translated uORFs. The p-value was determined using the Kolmogorov–Smirnov test. (I) Comparison of the TE for uORFs under both CK and LN conditions. The p-value was calculated using the Kolmogorov–Smirnov test.
Agronomy 14 01541 g004
Figure 5. Characterization of chromatin accessibility in maize roots under CK and LN. (A) Identification of OCRs and Venn diagrams showing the comparison between CK and LN samples. OCR: open chromatin region. (B) The distribution of OCRs throughout the genome in maize roots under CK and LN. (C) The OCR density around TSS of genes. (D) IGV browser view of the global ATAC-seq density across 10 chromosomes under CK and LN. The representative changes in chromatin accessibility caused by LN are highlighted in green shades. (E,F) ZmNRT2.1 (E) and Zm00001eb328810 (F) underwent significant changes in chromatin accessibility, transcription, and translation levels under LN.
Agronomy 14 01541 g005
Figure 6. Transcriptional regulatory network of maize roots under LN. (A) Regulatory network of TFs that regulate core genes. 49 TFs and 17 key LN response genes were used for the transcriptional regulatory network construction. TFs are marked with green triangles, and target genes in N metabolism and phenylpropanoid metabolism pathways are marked with red circles and blue quadrilaterals, respectively. The red lines indicate regulatory relationships between TFs and genes related to N metabolism, while the blue lines represent the interactions of the TFs with genes involved in phenylpropanoid metabolism. (B,C) The expression of ZmWRKY27 and ZmABI37 positively correlated with ZmNRT2.1. (D,E) Dual luciferase fluorescence assay demonstrated the activation of the ZmNRT2.1 promoter fragment by ZmWRKY27 and ZmABI37. The relative LUC activity was measured in N. benthamiana leaves co-expressing 35S: ZmWRKY27 (D) or 35S: ZmABI37 (E) with ZmNRT2.1-promoter: LUC. (***, p < 0.001).
Agronomy 14 01541 g006
Disclaimer/Publisher’s Note: The statements, opinions and data contained in all publications are solely those of the individual author(s) and contributor(s) and not of MDPI and/or the editor(s). MDPI and/or the editor(s) disclaim responsibility for any injury to people or property resulting from any ideas, methods, instructions or products referred to in the content.

