
Sugar Accumulation Patterns and Transcriptome Analysis during the Developmental Stage of Small-Fruit Watermelon (Citrullus lanatus L.)

 ,
,
Abstract
1. Introduction
2. Materials and Methods
2.1. Germplasm Materials
2.1.1. Evaluation Materials for Sugar Content in Watermelon Fruit
2.1.2. Transcriptome Sequencing Materials
2.2. Experimental Design
2.2.1. Field Trial of Watermelon Population Materials
2.2.2. Determination of Sucrose, Fructose, and Glucose Content
2.2.3. Transcriptome Analysis
RNA Quantification and Library Preparation
Transcriptome Sequencing
Analysis of Sequencing Results
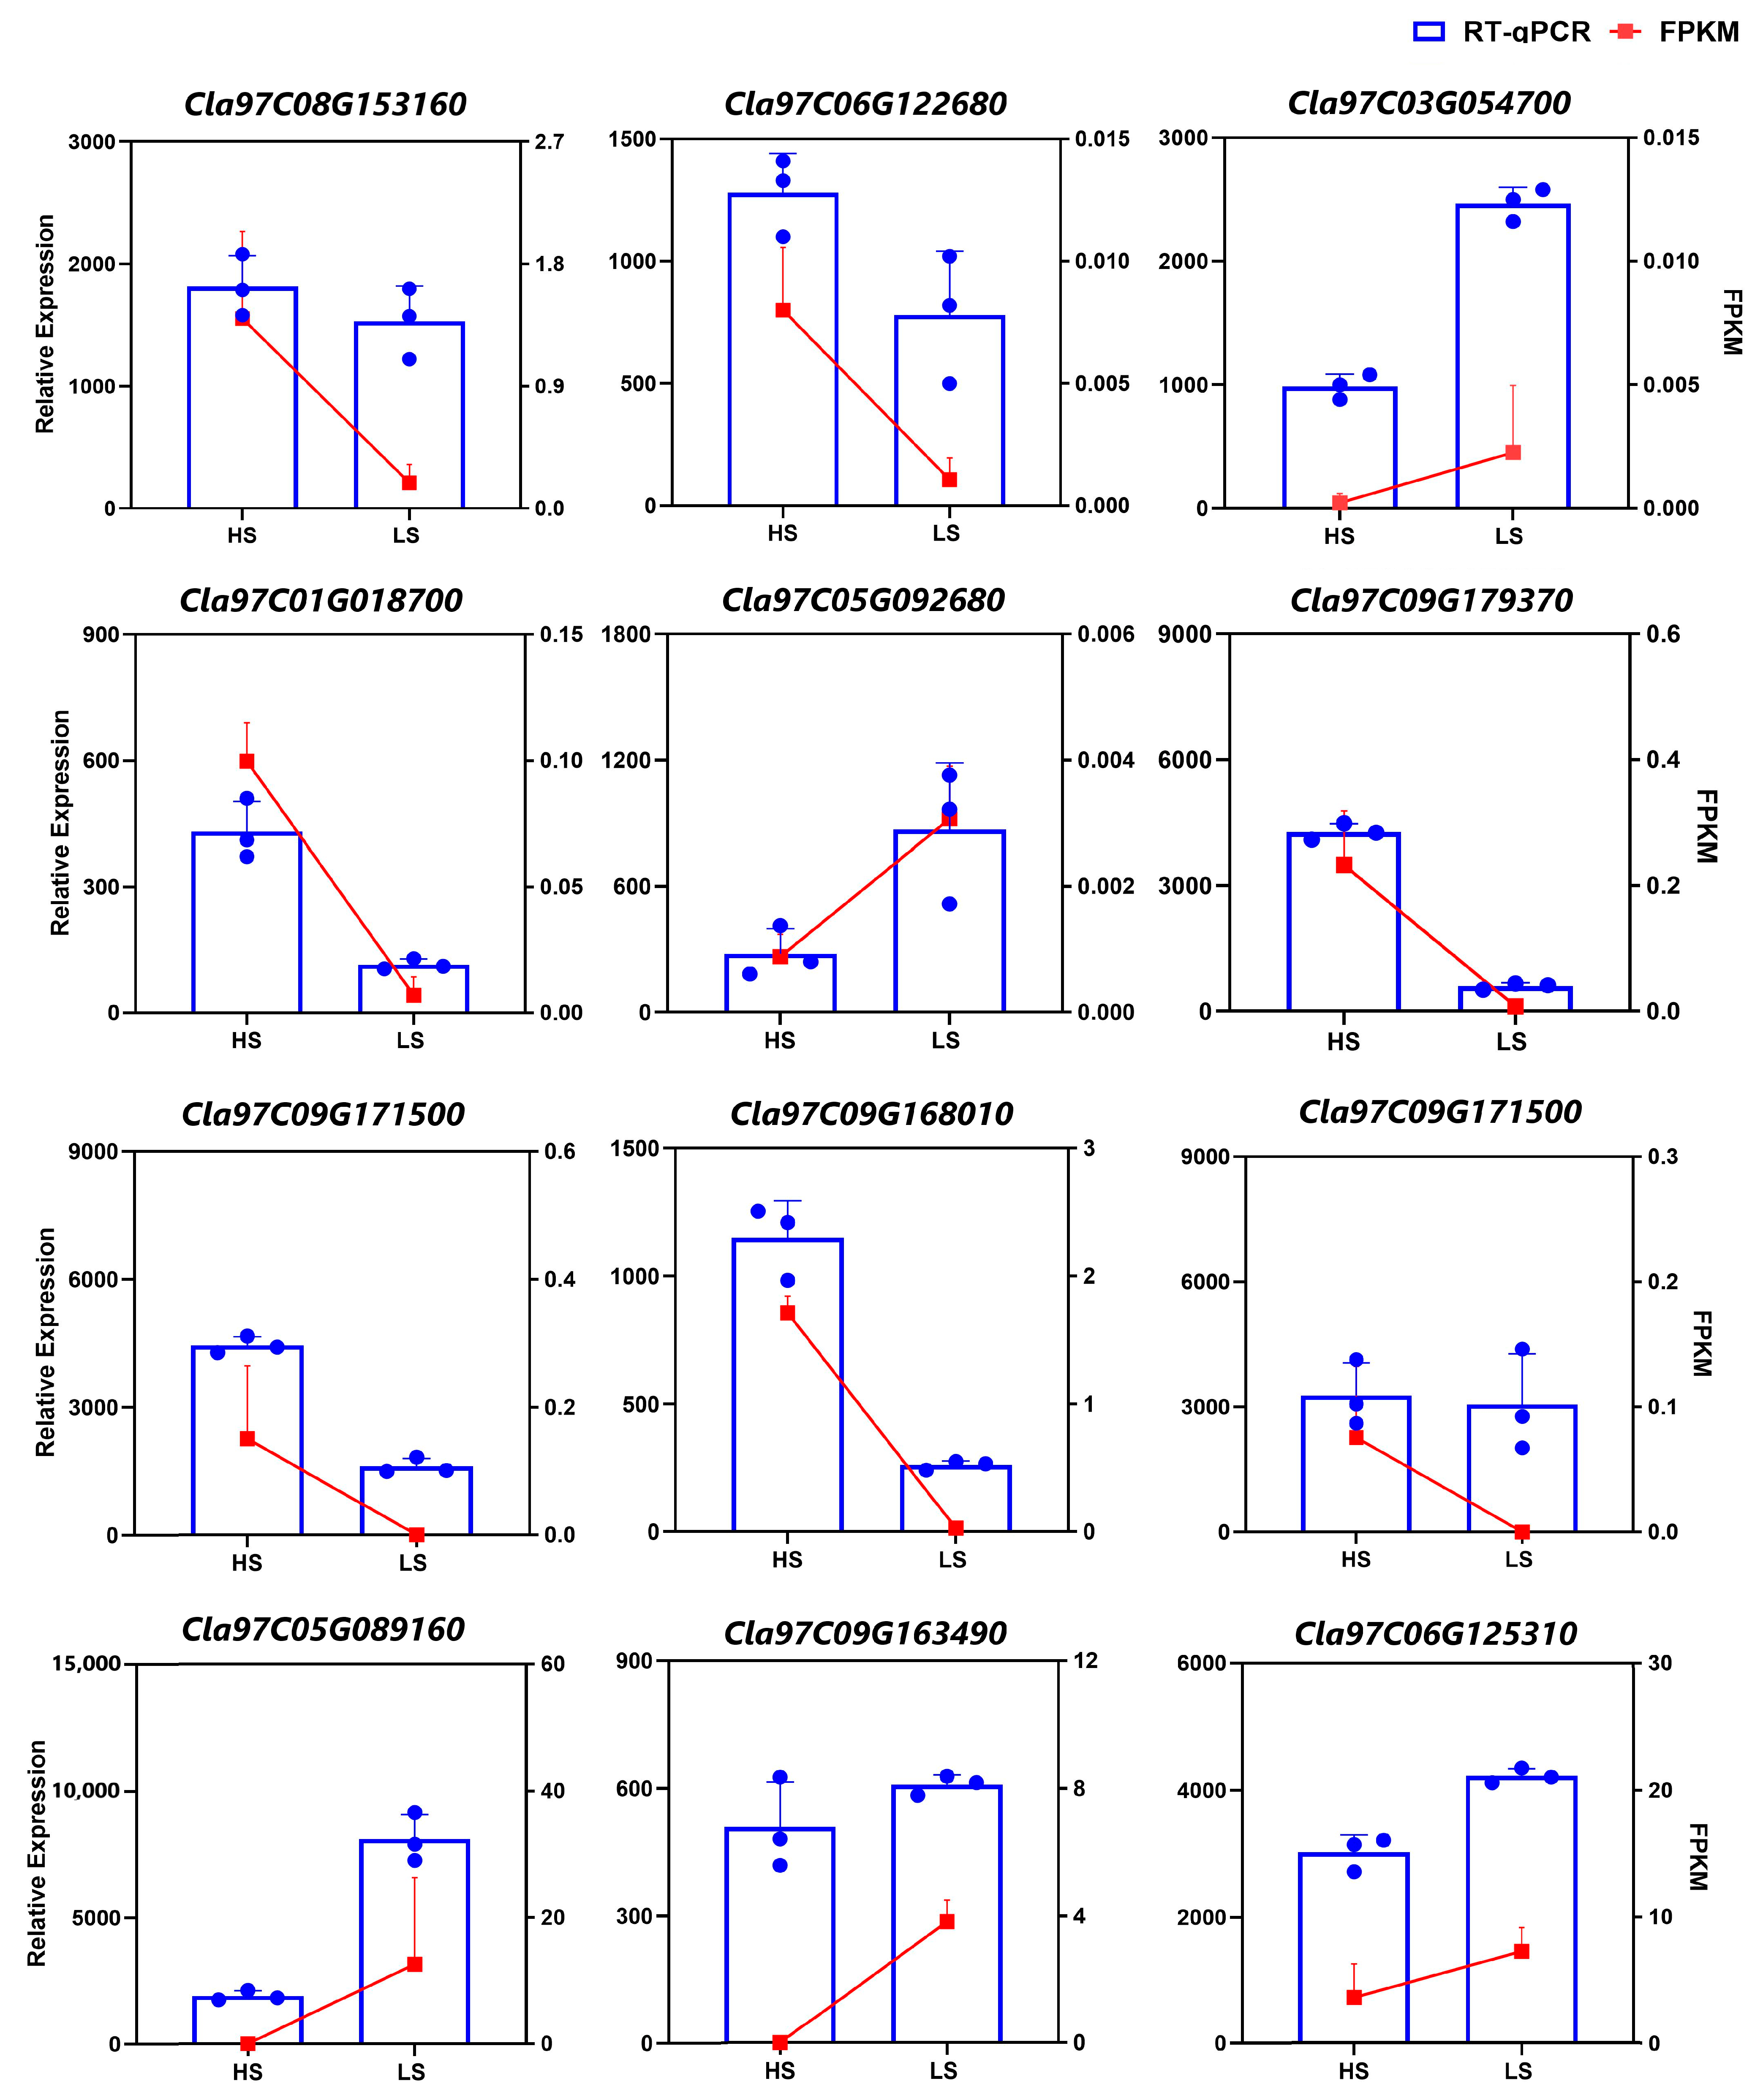
2.2.4. Validation of Gene Expression by Fluorescence Quantitative Real-Time PCR (RT-qPCR)
2.3. Statistical Analysis
3. Results
3.1. Investigating Sugar Content Dynamics in Small-Fruited Watermelon across Growth Stages
3.2. The Correlation between F1 and the Changes of Glucose, Sucrose, and Fructose of Parents during Fruit Development
3.3. Transcriptome Sequencing Quality Assessment
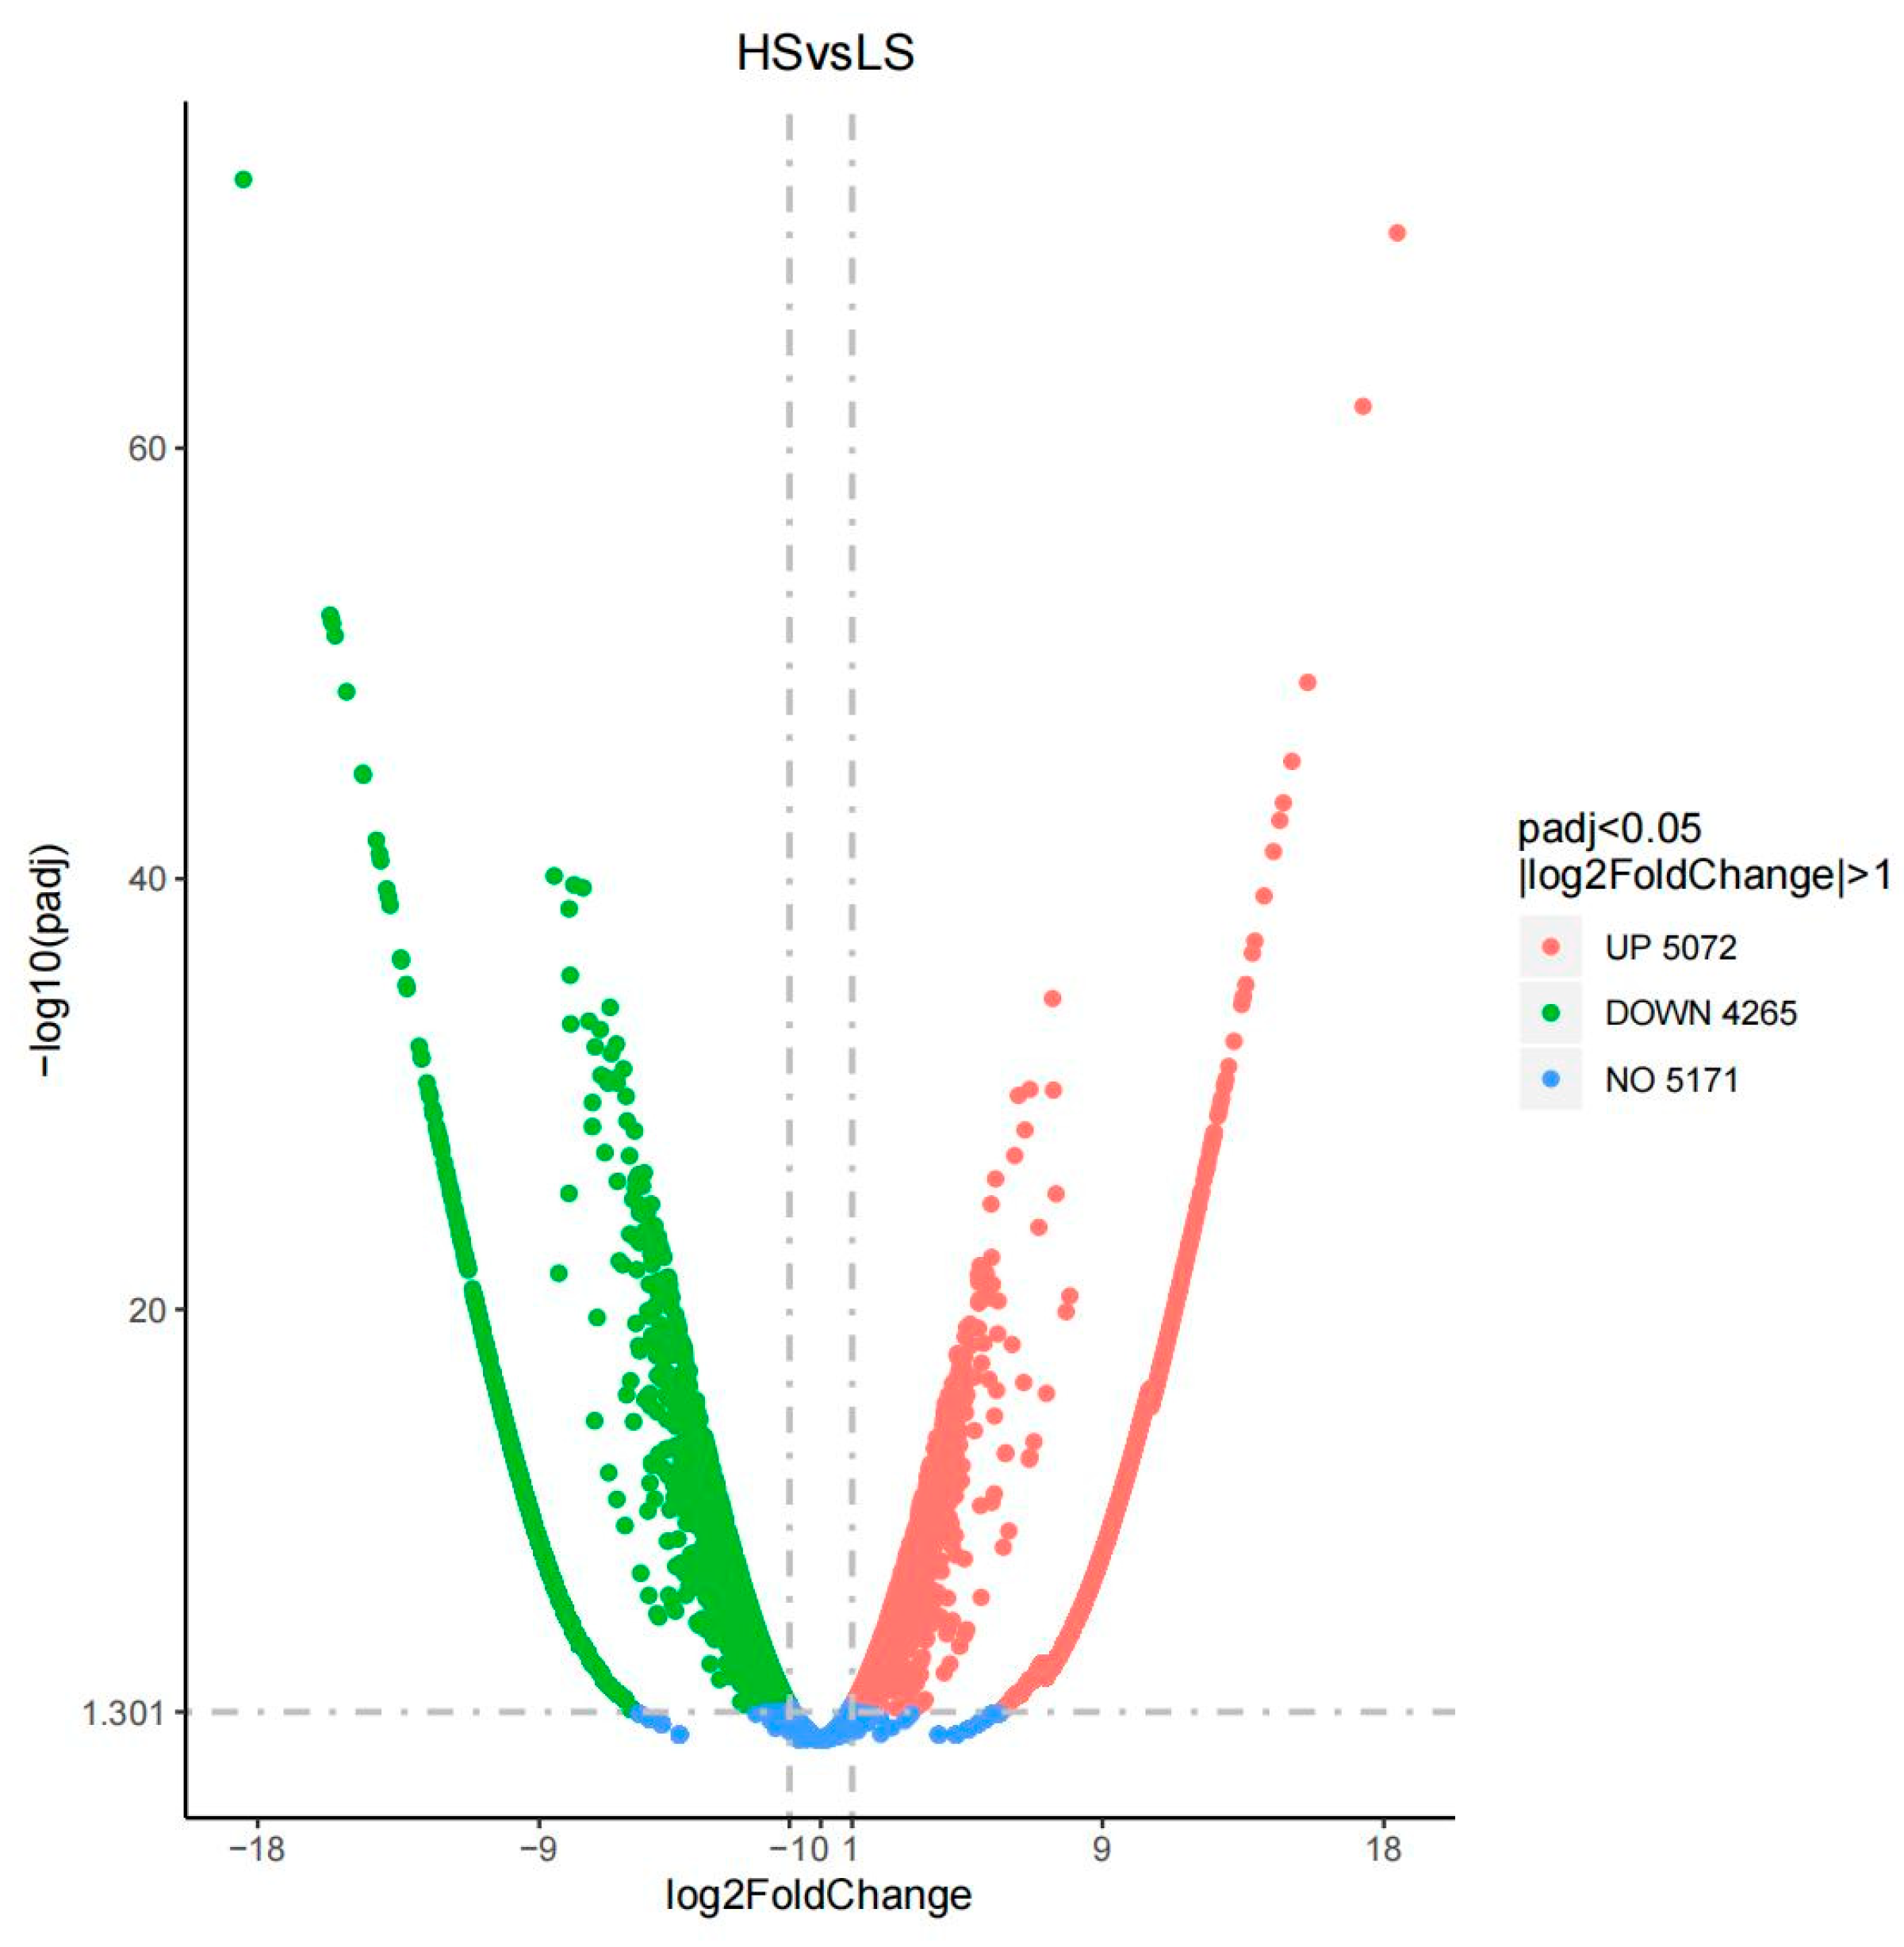
3.4. Gene Expression Data Analysis
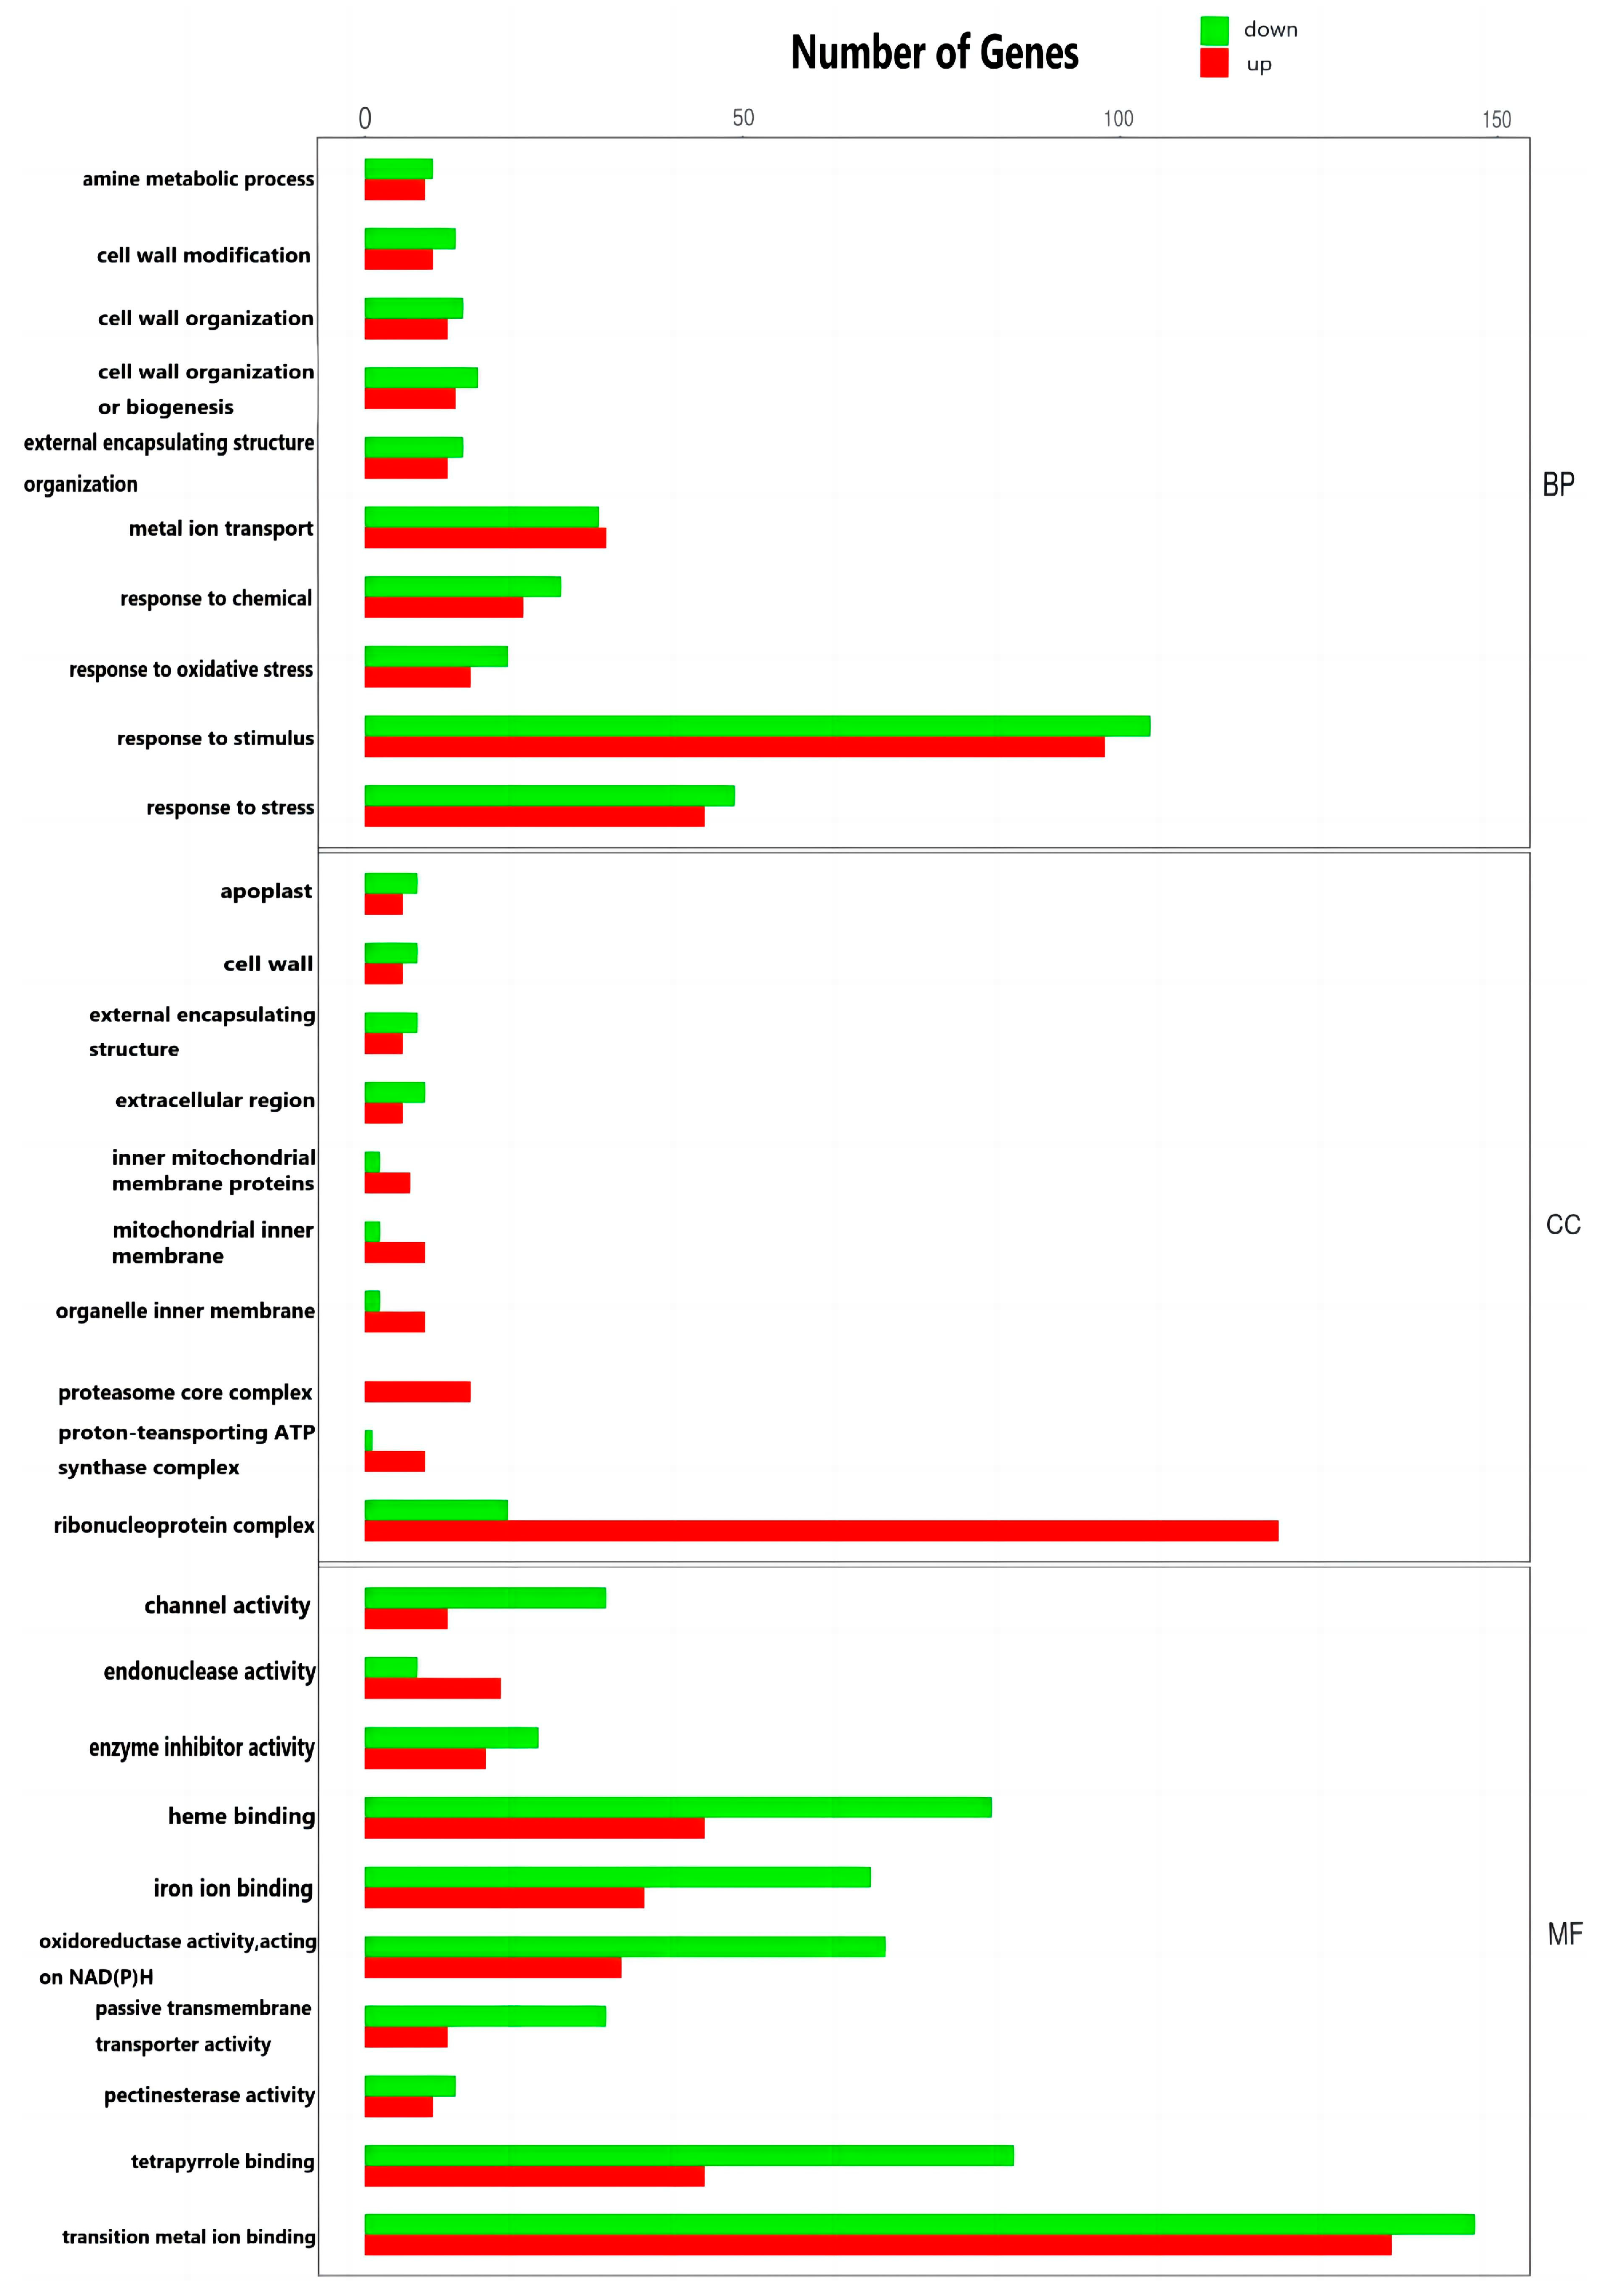
3.5. GO Enrichment Analysis
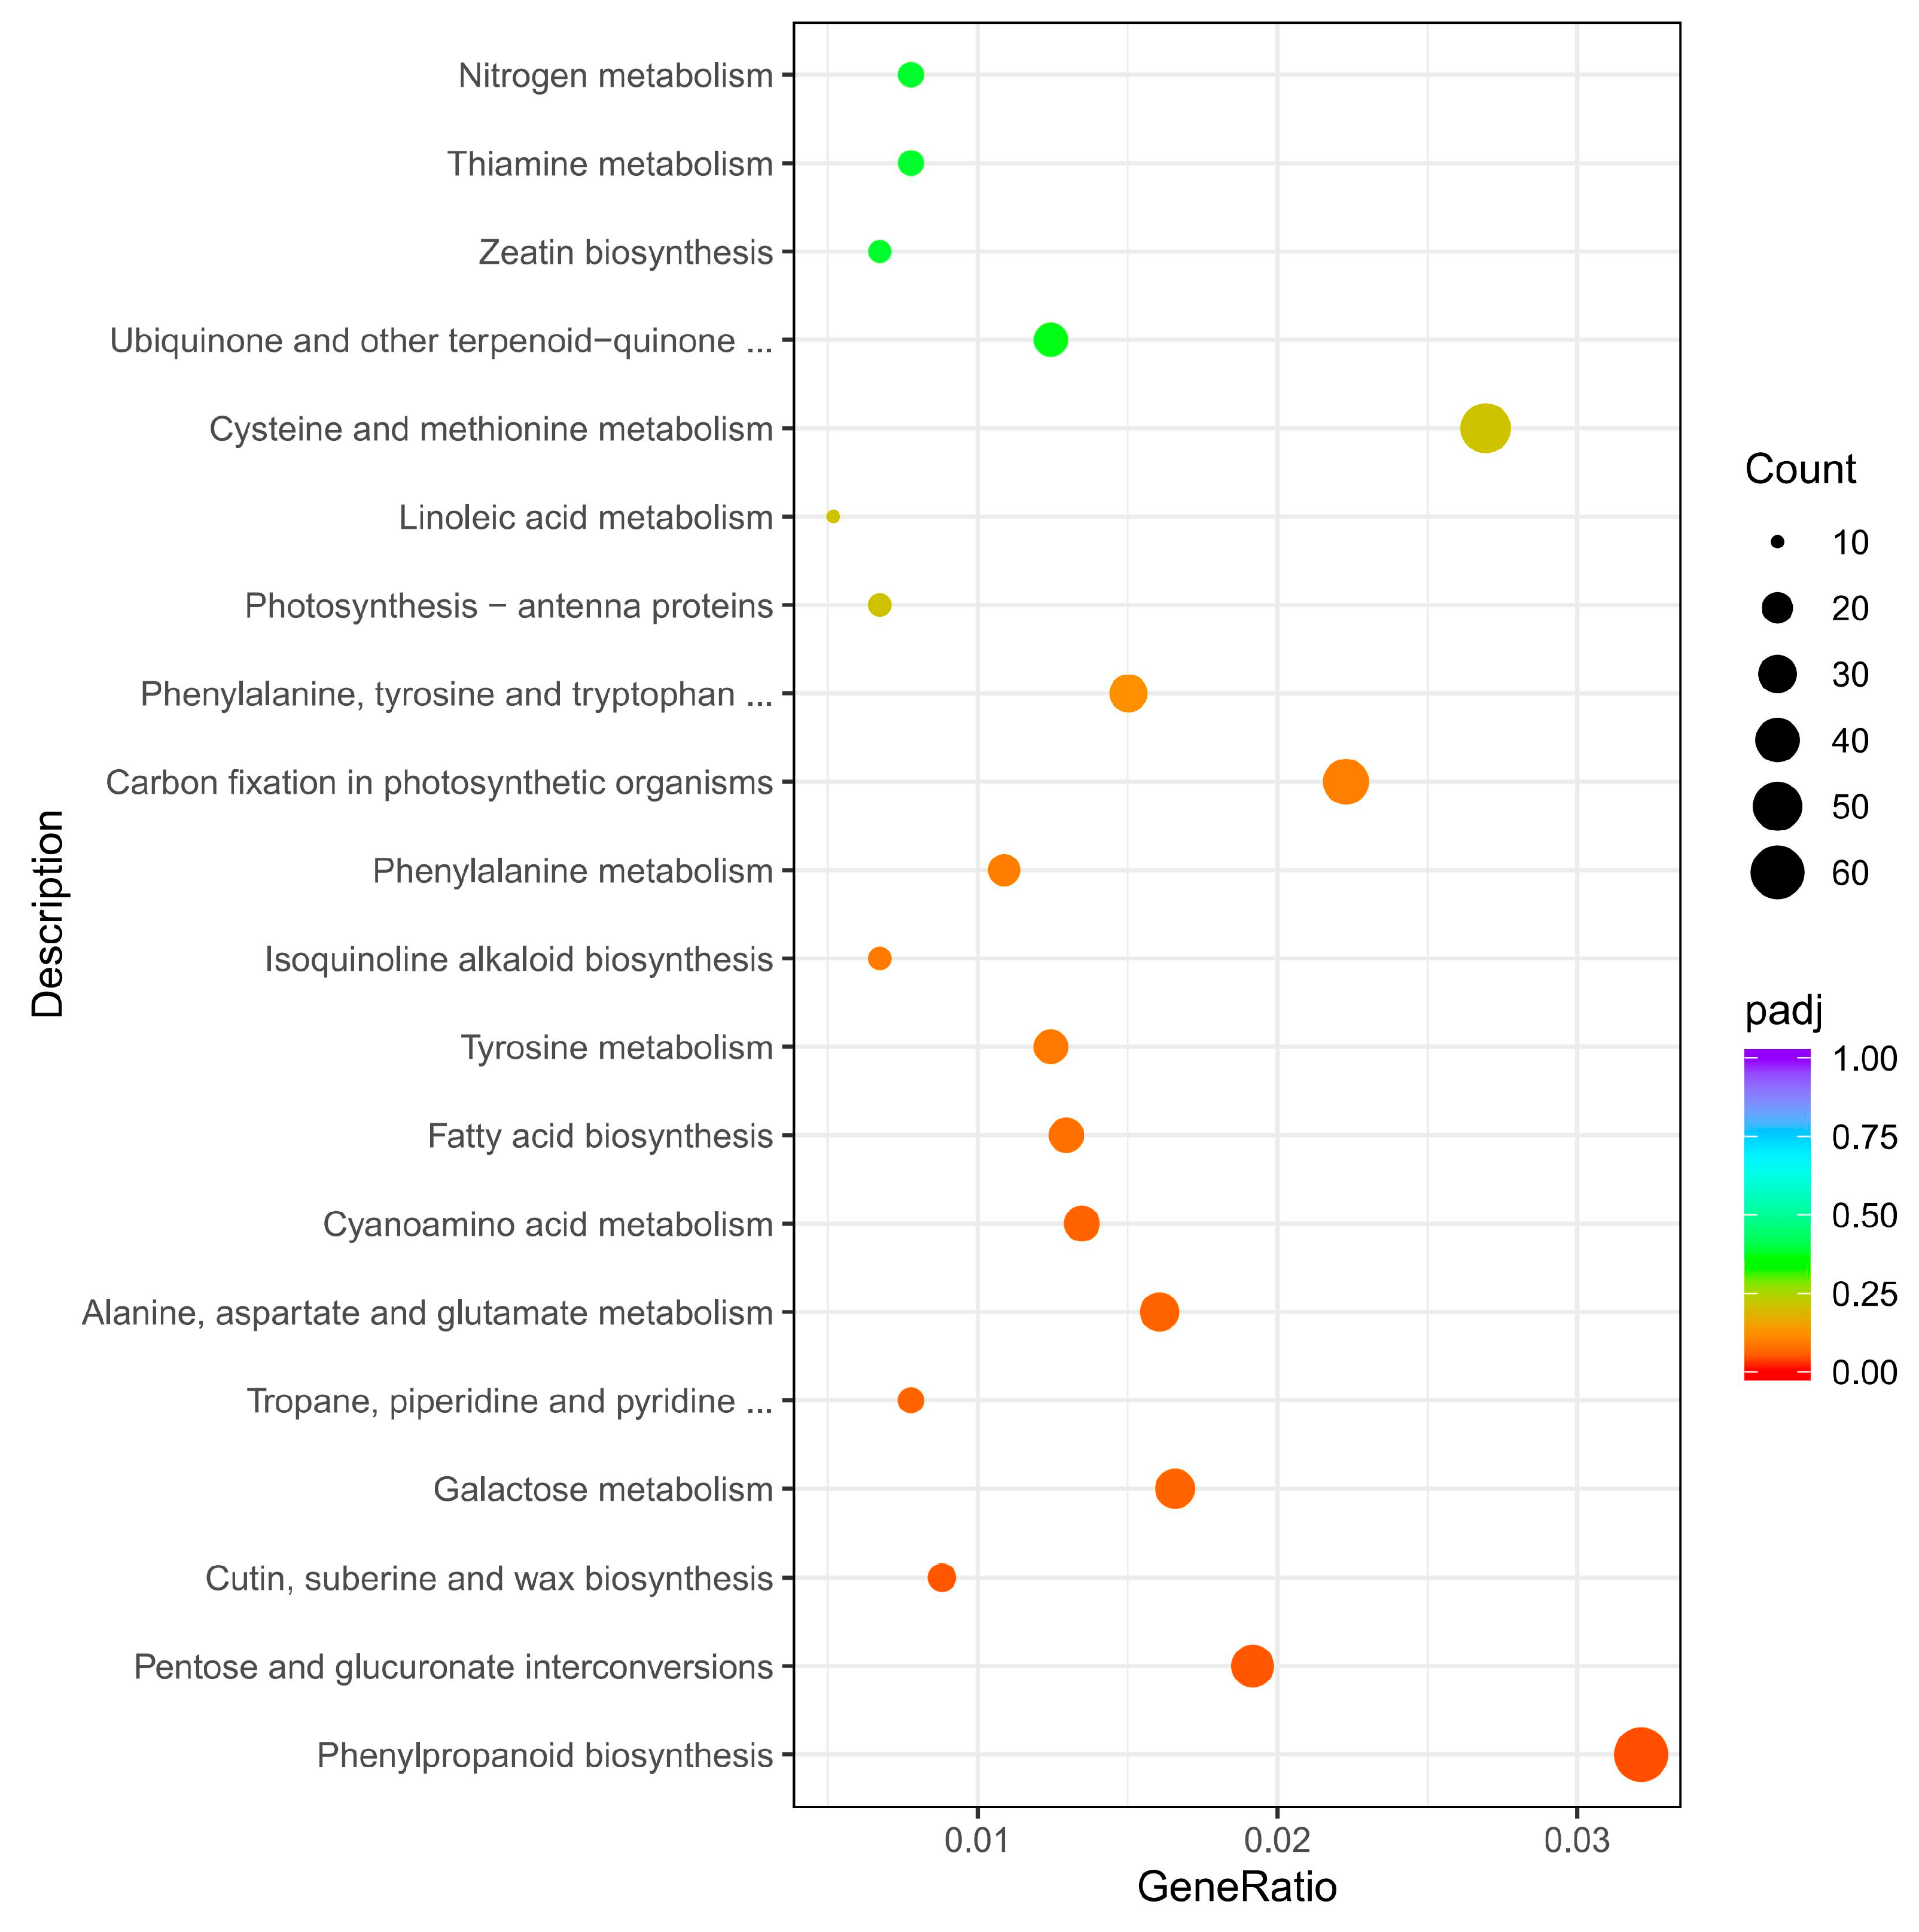
3.6. KEGG Enrichment Analysis
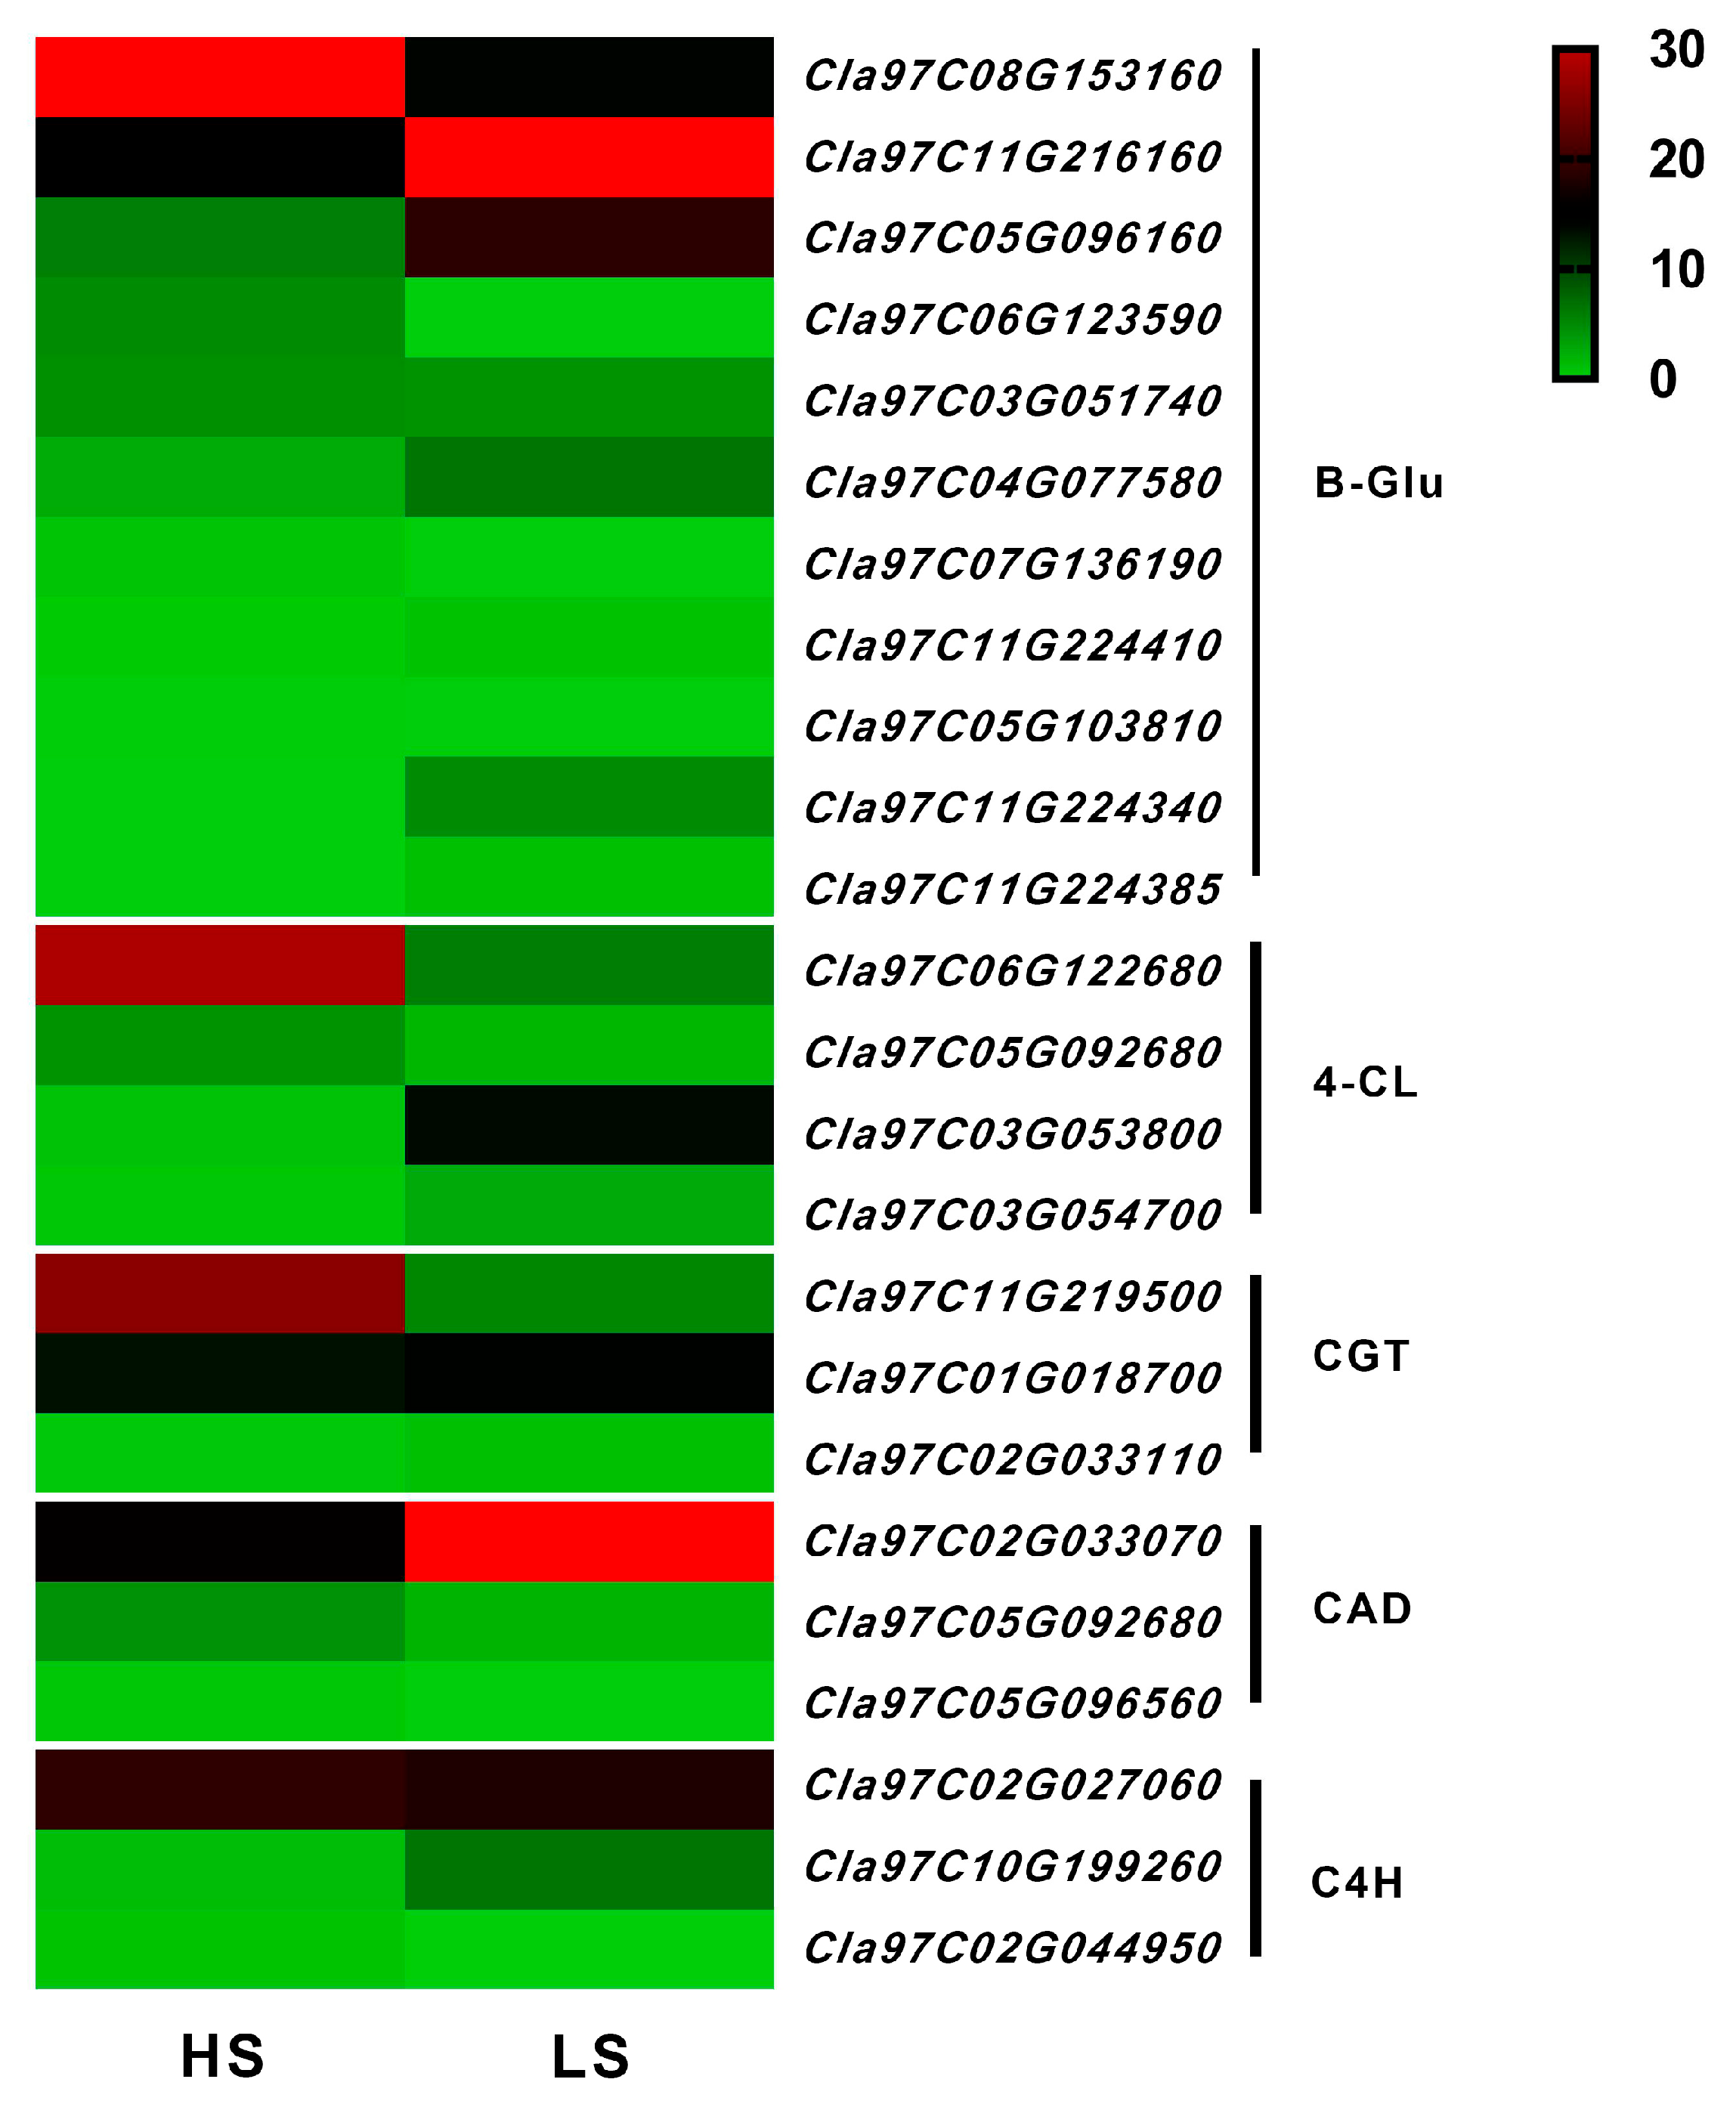
3.7. Analysis of DEGs in Phenylpropanoid Biosynthesis
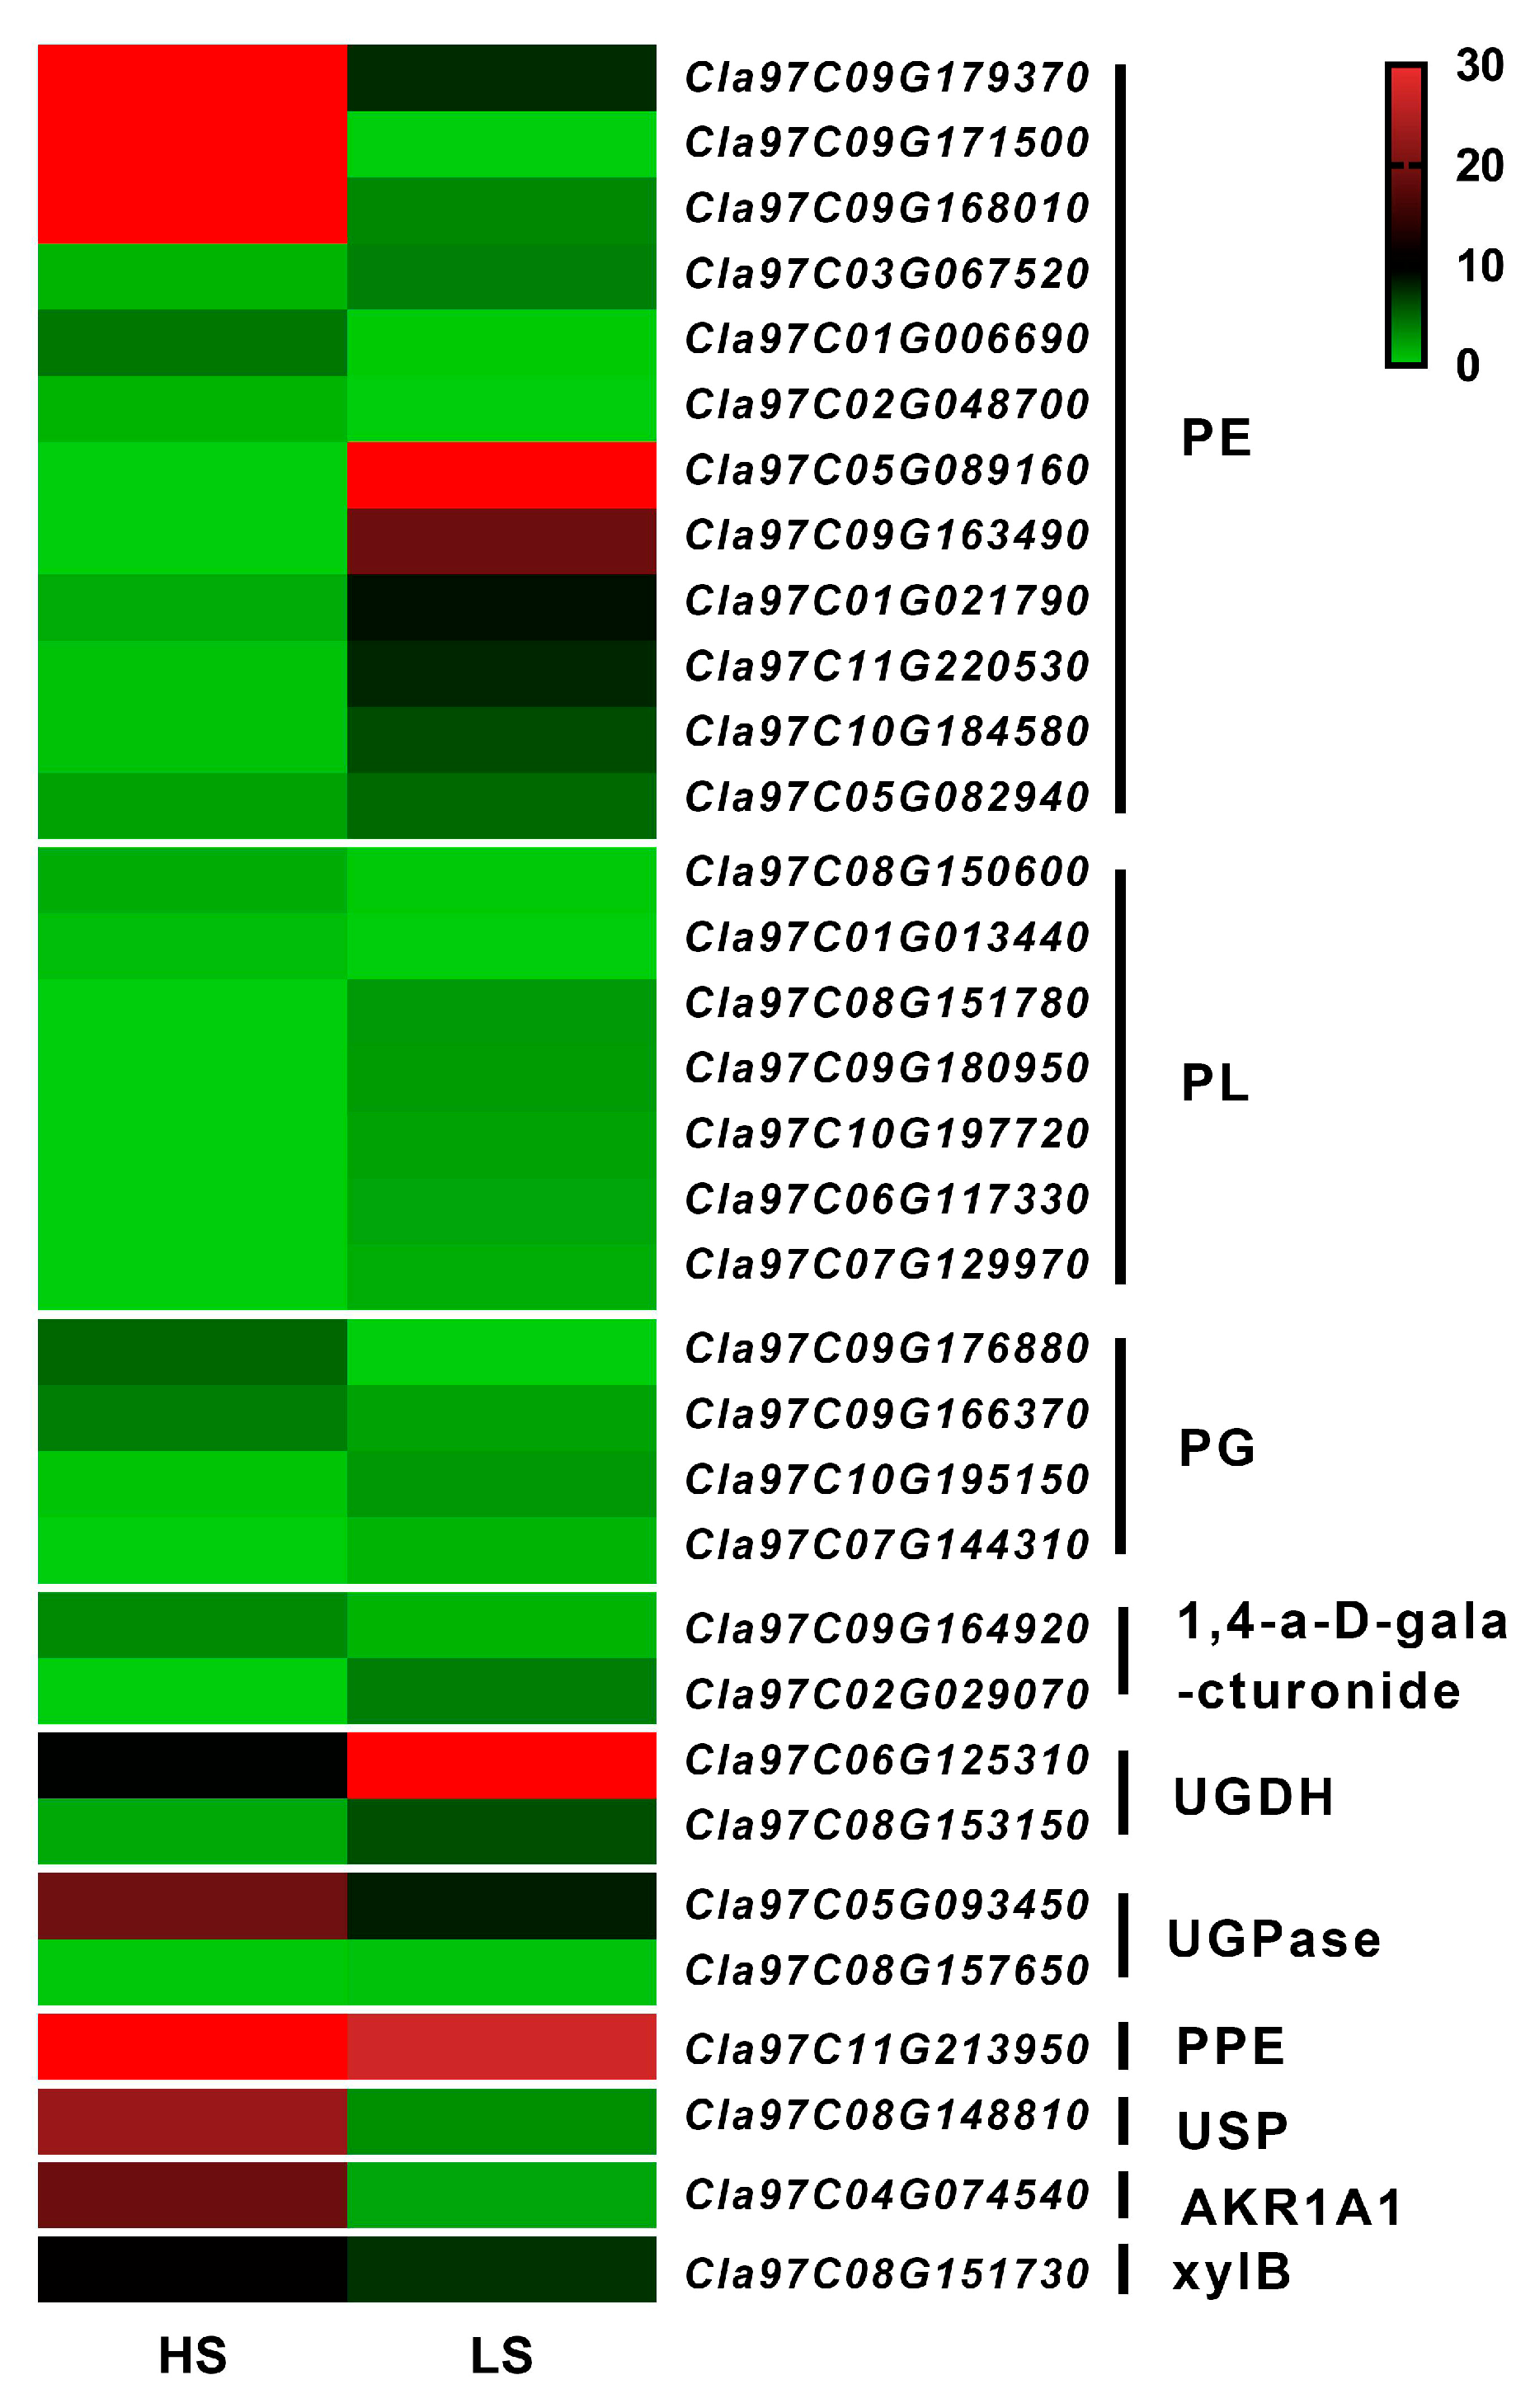
3.8. Analysis of DEGs in Pentose and Glucuronate Interconversions
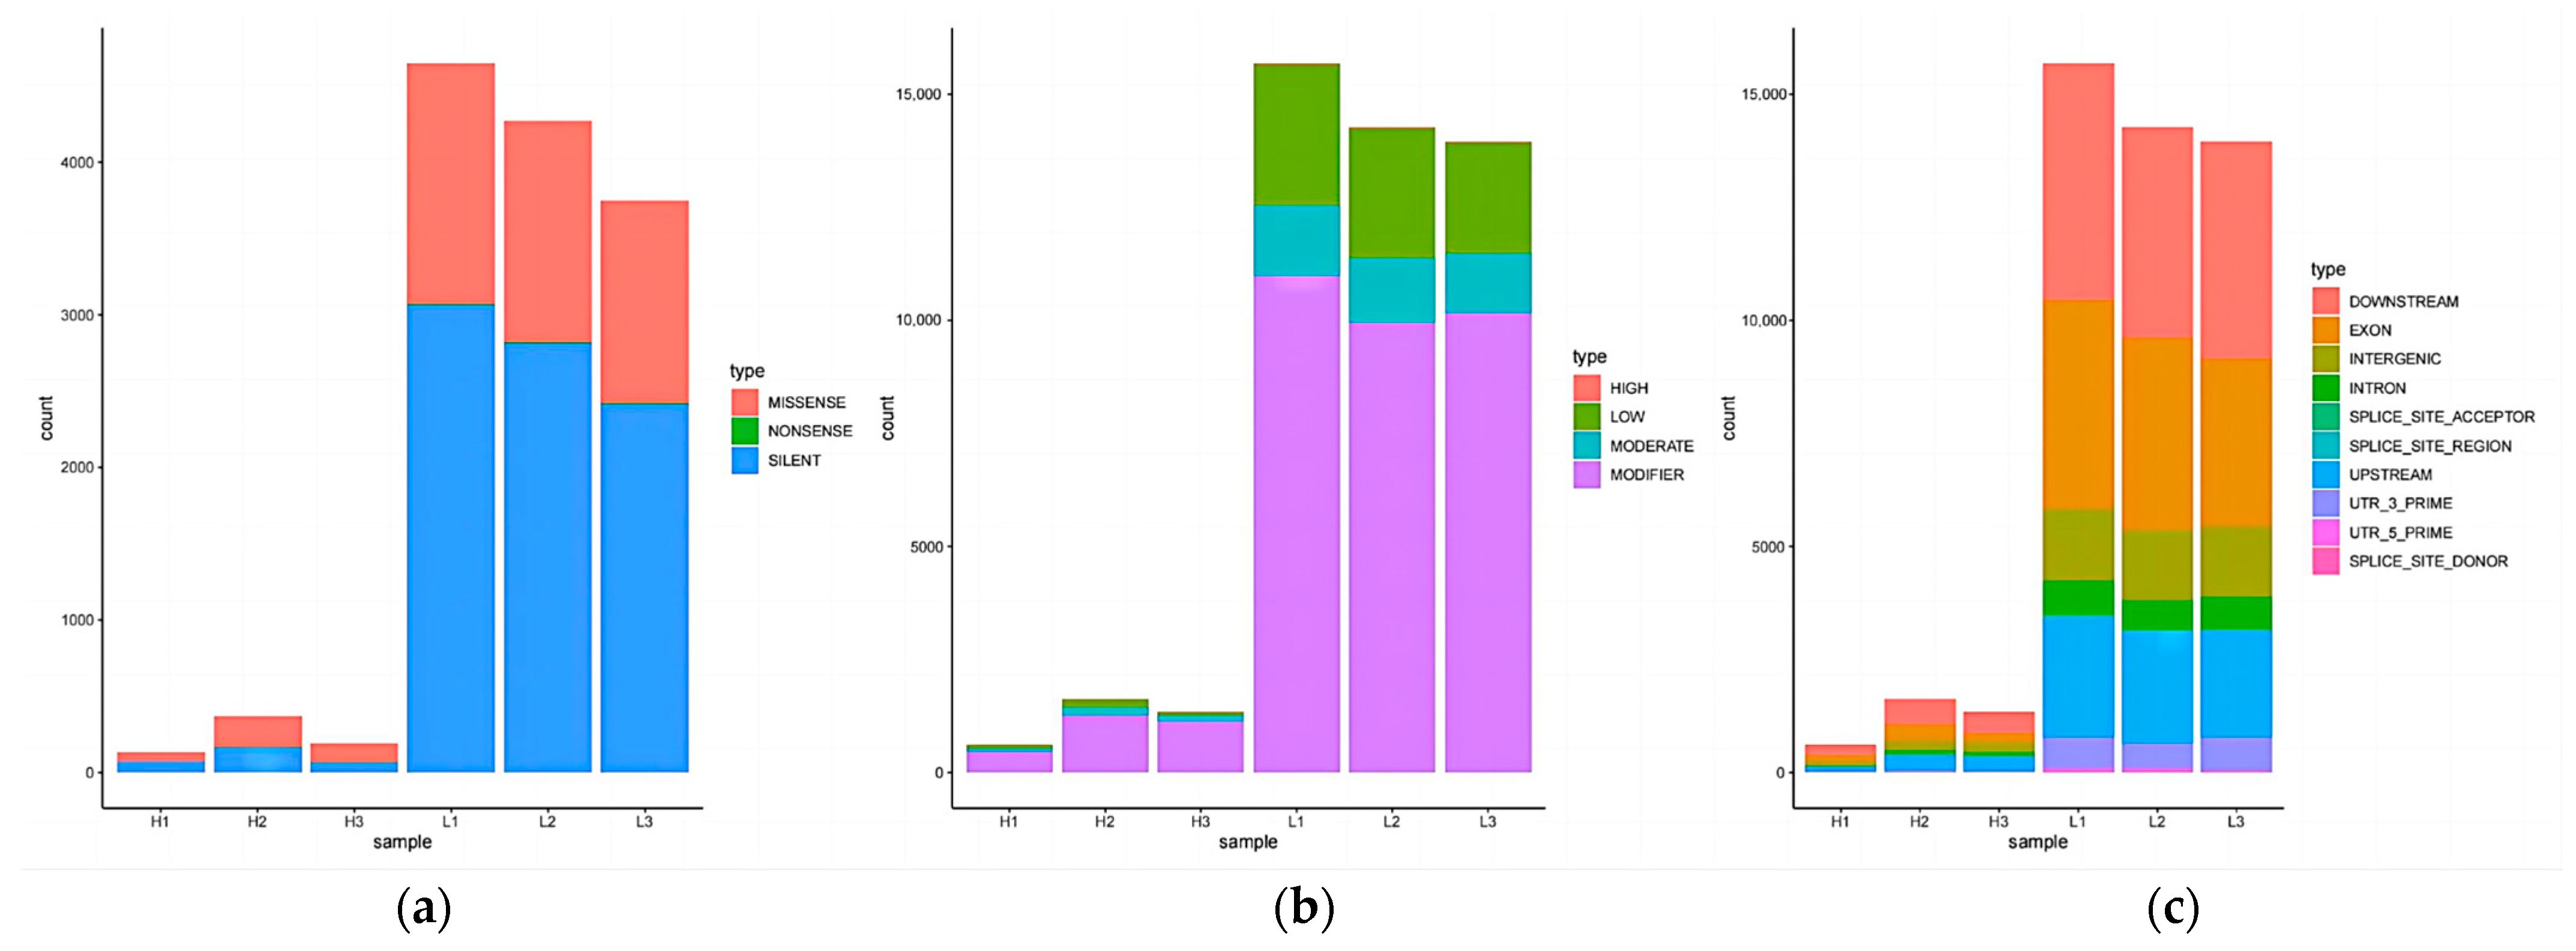
3.9. Analysis of Variant Sites
3.10. Co-Expression Analysis Related to Sugar Synthesis and Conversion
4. Discussion
5. Conclusions
Supplementary Materials
Author Contributions
Funding
Data Availability Statement
Conflicts of Interest
References
- Wehner, T.C. Watermelon. In Vegetables I: Asteraceae, Brassicaceae, Chenopodicaceae, and Cucurbitaceae; Springer: New York, NY, USA, 2008; pp. 381–418. [Google Scholar] [CrossRef]
- Mashilo, J.; Shimelis, H.; Ngwepe, R.M.; Thungo, Z. Genetic analysis of fruit quality traits in sweet watermelon (Citrullus lanatus var. lanatus): A review. Front. Plant Sci. 2022, 13, 834696. [Google Scholar] [CrossRef]
- Gao, L.; Zhao, S.; Lu, X.; He, N.; Zhu, H.; Dou, J.; Liu, W. Comparative transcriptome analysis reveals key genes potentially related to soluble sugar and organic acid accumulation in watermelon. PLoS ONE 2018, 13, e0190096. [Google Scholar] [CrossRef] [PubMed]
- Gong, C.; Zhu, H.; Lu, X.; Yang, D.; Zhao, S.; Umer, M.J.; He, N.; Yuan, P.; Anees, M.; Diao, W.; et al. An integrated transcriptome and metabolome approach reveals the accumulation of taste-related metabolites and gene regulatory networks during watermelon fruit development. Planta 2021, 254, 35. [Google Scholar] [CrossRef]
- Ramirez, J.L.; Du, X.; Wallace, R.W. Investigating sensory properties of seven watermelon varieties and factors impacting refreshing perception using quantitative descriptive analysis. Food Res. Int. 2020, 138, 109681. [Google Scholar] [CrossRef] [PubMed]
- Umer, M.J.; Bin Safdar, L.; Gebremeskel, H.; Zhao, S.; Yuan, P.; Zhu, H.; Kaseb, M.O.; Anees, M.; Lu, X.; He, N.; et al. Identification of key gene networks controlling organic acid and sugar metabolism during watermelon fruit development by integrating metabolic phenotypes and gene expression profiles. Hortic. Res. 2020, 7, 193. [Google Scholar] [CrossRef]
- Durán-Soria, S.; Pott, D.M.; Osorio, S.; Vallarino, J.G. Sugar signaling during fruit ripening. Front. Plant Sci. 2020, 11, 564917. [Google Scholar] [CrossRef]
- Liu, J.; Guo, S.; He, H.; Zhang, H.; Gong, G.; Ren, Y.; Xu, Y. Dynamic characteristics of sugar accumulation and related enzyme activities in sweet and non-sweet watermelon fruits. Acta Physiol. Plant. 2013, 35, 3213–3222. [Google Scholar] [CrossRef]
- Zhu, Q.; Gao, P.; Liu, S.; Zhu, Z.; Amanullah, S.; Davis, A.R.; Luan, W.F. Comparative transcriptome analysis of two contrasting watermelon genotypes during fruit development and ripening. BMC Genom. 2017, 18, 3. [Google Scholar] [CrossRef]
- Jin, D.; Zhang, L.; Zhang, J. Relationship between sugar accumulation and enzymes activity of sugar metabolism during fruit development of three strains of watermelon. J. Gansu Agric. Univ. 2017, 52, 28–33. [Google Scholar]
- Sun, L.; Wang, J.; Lian, L.; Song, J.; Du, X.; Liu, W.; Zhao, W.; Yang, L.; Li, C.; Qin, Y.; et al. Systematic analysis of the sugar accumulation mechanism in sucrose-and hexose-accumulating cherry tomato fruits. BMC Plant Biol. 2022, 22, 303. [Google Scholar] [CrossRef]
- Hu, Z.; Tang, Z.; Zhang, Y.; Niu, L.; Yang, F.; Zhang, D.; Hu, Y. Rice SUT and SWEET transporters. Int. J. Mol. Sci. 2021, 22, 11198. [Google Scholar] [CrossRef] [PubMed]
- Doidy, J.; Vidal, U.; Lemoine, R. Sugar transporters in Fabaceae, featuring SUT MST and SWEET families of the model plant Medicago truncatula and the agricultural crop Pisum sativum. PLoS ONE 2019, 14, e0223173. [Google Scholar] [CrossRef] [PubMed]
- Chen, L.Q.; Qu, X.Q.; Hou, B.H.; Sosso, D.; Osorio, S.; Fernie, A.R.; Frommer, W.B. Sucrose efflux mediated by SWEET proteins as a key step for phloem transport. Science 2012, 335, 207–211. [Google Scholar] [CrossRef] [PubMed]
- Chen, L.Q. SWEET sugar transporters for phloem transport and pathogen nutrition. New Phytol. 2014, 201, 1150–1155. [Google Scholar] [CrossRef]
- Bavnhøj, L.; Driller, J.H.; Zuzic, L.; Stange, A.D.; Schiøtt, B.; Pedersen, B.P. Structure and sucrose binding mechanism of the plant SUC1 sucrose transporter. Nat. Plants 2023, 9, 938–950. [Google Scholar] [CrossRef] [PubMed]
- Varsha, G.; Kühn, C. Subcellular dynamics and protein-protein interactions of plant sucrose transporters. J. Plant Physiol. 2022, 273, 153696. [Google Scholar]
- Guo, S.; Zhang, J.; Sun, H.; Salse, J.; Lucas, W.J.; Zhang, H.; Zheng, Y.; Mao, L.; Ren, Y.; Wang, Z. The draft genome of watermelon (Citrullus lanatus) and resequencing of 20 diverse accessions. Nat. Genet. 2013, 45, 51–58. [Google Scholar] [CrossRef]
- Li, B.; Zhu, L.; Yang, N.; Qu, S.; Cao, W.; Ma, W.; Wei, X.; Ma, B.; Ma, F.; Fu, A. Transcriptional Landscape and Dynamics Involved in Sugar and Acid Accumulation during Apple Fruit Development. Plant Physiol. 2024, kiae273. [Google Scholar] [CrossRef] [PubMed]
- Lv, L.; Zhao, A.; Zhang, Y.; Li, H.; Chen, X. Proteome and transcriptome analyses of wheat near isogenic lines identifies key proteins and genes of wheat bread quality. Sci. Rep. 2021, 11, 9978. [Google Scholar] [CrossRef]
- Zhao, J.; Sauvage, C.; Zhao, J.; Bitton, F.; Bauchet, G.; Liu, D.; Huang, S.; Tieman, D.M.; Klee, H.J.; Causse, M. Meta-analysis of genome-wide association studies provides insights into genetic control of tomato flavor. Nat. Commun. 2019, 10, 1534. [Google Scholar] [CrossRef]
- Tao, H.; Sun, H.; Wang, Y.; Song, X.; Guo, Y. New insights on ‘GALA’apple fruit development: Sugar and acid accumulation: A transcriptomic approach. J. Plant Growth Regul. 2020, 39, 680–702. [Google Scholar] [CrossRef]
- Khan, Q.; Qin, Y.; Guo, D.J.; Yang, L.T.; Song, X.P.; Xing, Y.X.; Li, Y.R. A Review of the diverse genes and molecules involved in sucrose metabolism and innovative approaches to improve sucrose content in sugarcane. Agronomy 2023, 13, 2957. [Google Scholar] [CrossRef]
- Sachdeva, M.; Bhatia, S.; Batta, S.K. Sucrose accumulation in sugarcane: A potential target for crop improvement. Acta Physiol. Plant. 2011, 33, 1571–1583. [Google Scholar] [CrossRef]
- Ren, Y.; Li, M.; Guo, S.; Sun, H.; Zhao, J.; Zhang, J.; Xu, Y. Evolutionary gain of oligosaccharide hydrolysis and sugar transport enhanced carbohydrate partitioning in sweet watermelon fruits. Plant Cell 2021, 33, 1554–1573. [Google Scholar] [CrossRef]
- Braun, D.M.; Wang, L.; Ruan, Y.L. Understanding and manipulating sucrose phloem loading, unloading, metabolism, and signalling to enhance crop yield and food security. J. Exp. Bot. 2014, 65, 1713–1735. [Google Scholar] [CrossRef]
- Julius, B.T.; Leach, K.A.; Tran, T.M.; Mertz, R.A.; Braun, D.M. Sugar transporters in plants: New insights and discoveries. Plant Cell Physiol. 2017, 58, 1442–1460. [Google Scholar] [CrossRef]
- Zhang, G.; Ding, Q.; Wei, B. The SWEET gene family in watermelon: Genome-wide identification, phylogeny, duplication and expression analyses in male sterile buds and under sucrose, fructose and glucose treatments. Biologia 2024, 79, 393–409. [Google Scholar] [CrossRef]
- Yativ, M.; Harary, I.; Wolf, S. Sucrose accumulation in watermelon fruits: Genetic variation and biochemical analysis. J. Plant Physiol. 2010, 167, 589–596. [Google Scholar] [CrossRef] [PubMed]
- Shahwar, D.; Khan, Z.; Park, Y. Candidate Gene Identification, and Breeding in Melon (Cucumis melo L.): A Review. Int. J. Mol. Sci. 2023, 24, 15490. [Google Scholar] [CrossRef]
- Zhu, L.; Li, B.; Wu, L.; Li, H.; Wang, Z.; Wei, X.; Li, M. MdERDL6-mediated glucose efflux to the cytosol promotes sugar accumulation in the vacuole through up-regulating TSTs in apple and tomato. Proc. Natl. Acad. Sci. USA 2021, 118, e2022788118. [Google Scholar] [CrossRef]
- Wang, J.; Wang, Y.; Yu, Y.; Zhang, J.; Ren, Y.; Tian, S.; Xu, Y. ClSnRK2.3 negatively regulates watermelon fruit ripening and sugar accumulation. J. Integr. Plant Biol. 2023, 65, 2336–2348. [Google Scholar] [CrossRef] [PubMed]
- Wang, J.; Tang, Z. The regulation of soluble sugars in the growth and development of plants. Bot 2014, 3, 71–76. [Google Scholar]
- Meng, L.S.; Bao, Q.X.; Mu, X.R.; Tong, C.; Cao, X.Y.; Huang, J.J.; Loake, G.J. Glucose-and sucrose-signaling modules regulate the Arabidopsis juvenile-to-adult phase transition. Cell Rep. 2021, 36, 109348. [Google Scholar] [CrossRef] [PubMed]
- Cheng, H.; Kong, W.; Tang, T.; Ren, K.; Zhang, K.; Wei, H.; Lin, T. Identification of key gene networks controlling soluble sugar and organic acid metabolism during oriental melon fruit development by integrated analysis of metabolic and transcriptomic analyses. Front. Plant Sci. 2022, 13, 830517. [Google Scholar] [CrossRef] [PubMed]
- Aslam, A.; Zhao, S.; Azam, M.; Lu, X.; He, N.; Li, B.; Dou, J.; Zhu, H.; Liu, W. Comparative analysis of primary metabolites and transcriptome changes between ungrafted and pumpkin-grafted watermelon during fruit development. PeerJ. 2020, 8, e8259. [Google Scholar] [CrossRef] [PubMed]
- Wang, J.; Wang, Y.; Zhang, J.; Ren, Y.; Li, M.; Tian, S.; Xu, Y. The NAC transcription factor ClNAC68 positively regulates sugar content and seed development in watermelon by repressing ClINV and ClGH3.6. Hortic. Res. 2021, 8, 214. [Google Scholar] [CrossRef] [PubMed]
- Salgado, J.C.S.; Meleiro, L.P.; Carli, S.; Ward, R.J. Glucose tolerant and glucose stimulated β-glucosidases—A review. Bioresour. Technol. 2018, 267, 704–713. [Google Scholar] [CrossRef] [PubMed]
- Levvy, G.A. β-Glucuronidase and related enzymes. Br. Med. Bull. 1953, 9, 126–130. [Google Scholar] [CrossRef] [PubMed]
- Cukovica, D.; Ehlting, J.; Ziffle, J.A.V.; Douglas, C.J. Structure and evolution of 4-coumarate: Coenzyme A ligase (4CL) gene families. Biol. Chem. 2005, 001, 645–654. [Google Scholar]
- Niu, W.; Wei, H.; Xue, F.; Yang, M. Overexpression of a fusion protein of 4-coumaroyl-CoA ligase and polyketide synthase for raspberry ketone production in Chlamydomonas reinhardtii. Chin. J. Biotechnol. 2021, 7, 2495–2502. [Google Scholar]
- Dong, N.Q.; Lin, H.X. Contribution of phenylpropanoid metabolism to plant development and plant–environment interactions. J. Integr. Plant Biol. 2021, 63, 180–209. [Google Scholar] [CrossRef]
- Huang, X.X.; Wang, Y.; Lin, J.S.; Chen, L.; Li, Y.J.; Liu, Q.; Hou, B.K. The novel pathogen-responsive glycosyltransferase UGT73C7 mediates the redirection of phenylpropanoid metabolism and promotes SNC1-dependent Arabidopsis immunity. Plant J. 2021, 107, 149–165. [Google Scholar] [CrossRef] [PubMed]
- Wang, S.; Meng, K.; Luo, H.; Yao, B.; Tu, T. Research progress in structure and function of pectin methylesterase. Chin. J. Biotechnol. 2020, 36, 1021–1030. [Google Scholar]
- Du, J.; Kirui, A.; Huang, S.; Wang, L.; Barnes, W.J.; Kiemle, S.N. Mutations in the pectin methyltransferase QUASIMODO2 influence cellulose biosynthesis and wall integrity in Arabidopsis. Plant Cell 2020, 32, 3576–3597. [Google Scholar] [CrossRef] [PubMed]
- Luzzatto, L.; Battistuzzi, G. Glucose-6-phosphate dehydrogenase. Adv. Hum. Genet. 1985, 14, 217–329. [Google Scholar]
- Stanton, R.C. Glucose-6-phosphate dehydrogenase, NADPH, and cell survival. IUBMB Life 2012, 64, 362–369. [Google Scholar] [CrossRef]


| Variety Name | Sample Name | The Content of Sucrose | The Content of Fructose | The Content of Glucose | Flesh Color | Picture of Fruit |
|---|---|---|---|---|---|---|
| G38-28 | HS | 11.4 mg/g | 32.82 mg/g | 567.29 umol/g | red | 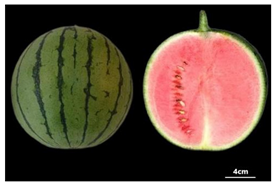 |
| 482276-28 | LS | 2.76 mg/g | 8.16 mg/g | 154.85 umol/g | Light green |  |
Disclaimer/Publisher’s Note: The statements, opinions and data contained in all publications are solely those of the individual author(s) and contributor(s) and not of MDPI and/or the editor(s). MDPI and/or the editor(s) disclaim responsibility for any injury to people or property resulting from any ideas, methods, instructions or products referred to in the content. |
© 2024 by the authors. Licensee MDPI, Basel, Switzerland. This article is an open access article distributed under the terms and conditions of the Creative Commons Attribution (CC BY) license (https://creativecommons.org/licenses/by/4.0/).
Share and Cite
Zhang, X.; Xu, B.; Luo, D.; Xu, W.; Yin, L.; Zhang, C.; Gu, Y.; Zhao, J.; Wang, W.; Liu, L.; et al. Sugar Accumulation Patterns and Transcriptome Analysis during the Developmental Stage of Small-Fruit Watermelon (Citrullus lanatus L.). Agronomy 2024, 14, 1544. https://doi.org/10.3390/agronomy14071544
Zhang X, Xu B, Luo D, Xu W, Yin L, Zhang C, Gu Y, Zhao J, Wang W, Liu L, et al. Sugar Accumulation Patterns and Transcriptome Analysis during the Developmental Stage of Small-Fruit Watermelon (Citrullus lanatus L.). Agronomy. 2024; 14(7):1544. https://doi.org/10.3390/agronomy14071544
Chicago/Turabian StyleZhang, Xuelian, Binghua Xu, Dexu Luo, Wenzhao Xu, Lian Yin, Changwei Zhang, Yan Gu, Jianfeng Zhao, Weiwei Wang, Lu Liu, and et al. 2024. "Sugar Accumulation Patterns and Transcriptome Analysis during the Developmental Stage of Small-Fruit Watermelon (Citrullus lanatus L.)" Agronomy 14, no. 7: 1544. https://doi.org/10.3390/agronomy14071544
APA StyleZhang, X., Xu, B., Luo, D., Xu, W., Yin, L., Zhang, C., Gu, Y., Zhao, J., Wang, W., Liu, L., Bai, T., & Sun, Y. (2024). Sugar Accumulation Patterns and Transcriptome Analysis during the Developmental Stage of Small-Fruit Watermelon (Citrullus lanatus L.). Agronomy, 14(7), 1544. https://doi.org/10.3390/agronomy14071544