
Response of Reduced Grassland Degradation Index to Climate Change in China


Abstract
:1. Introduction
2. Materials and Methods
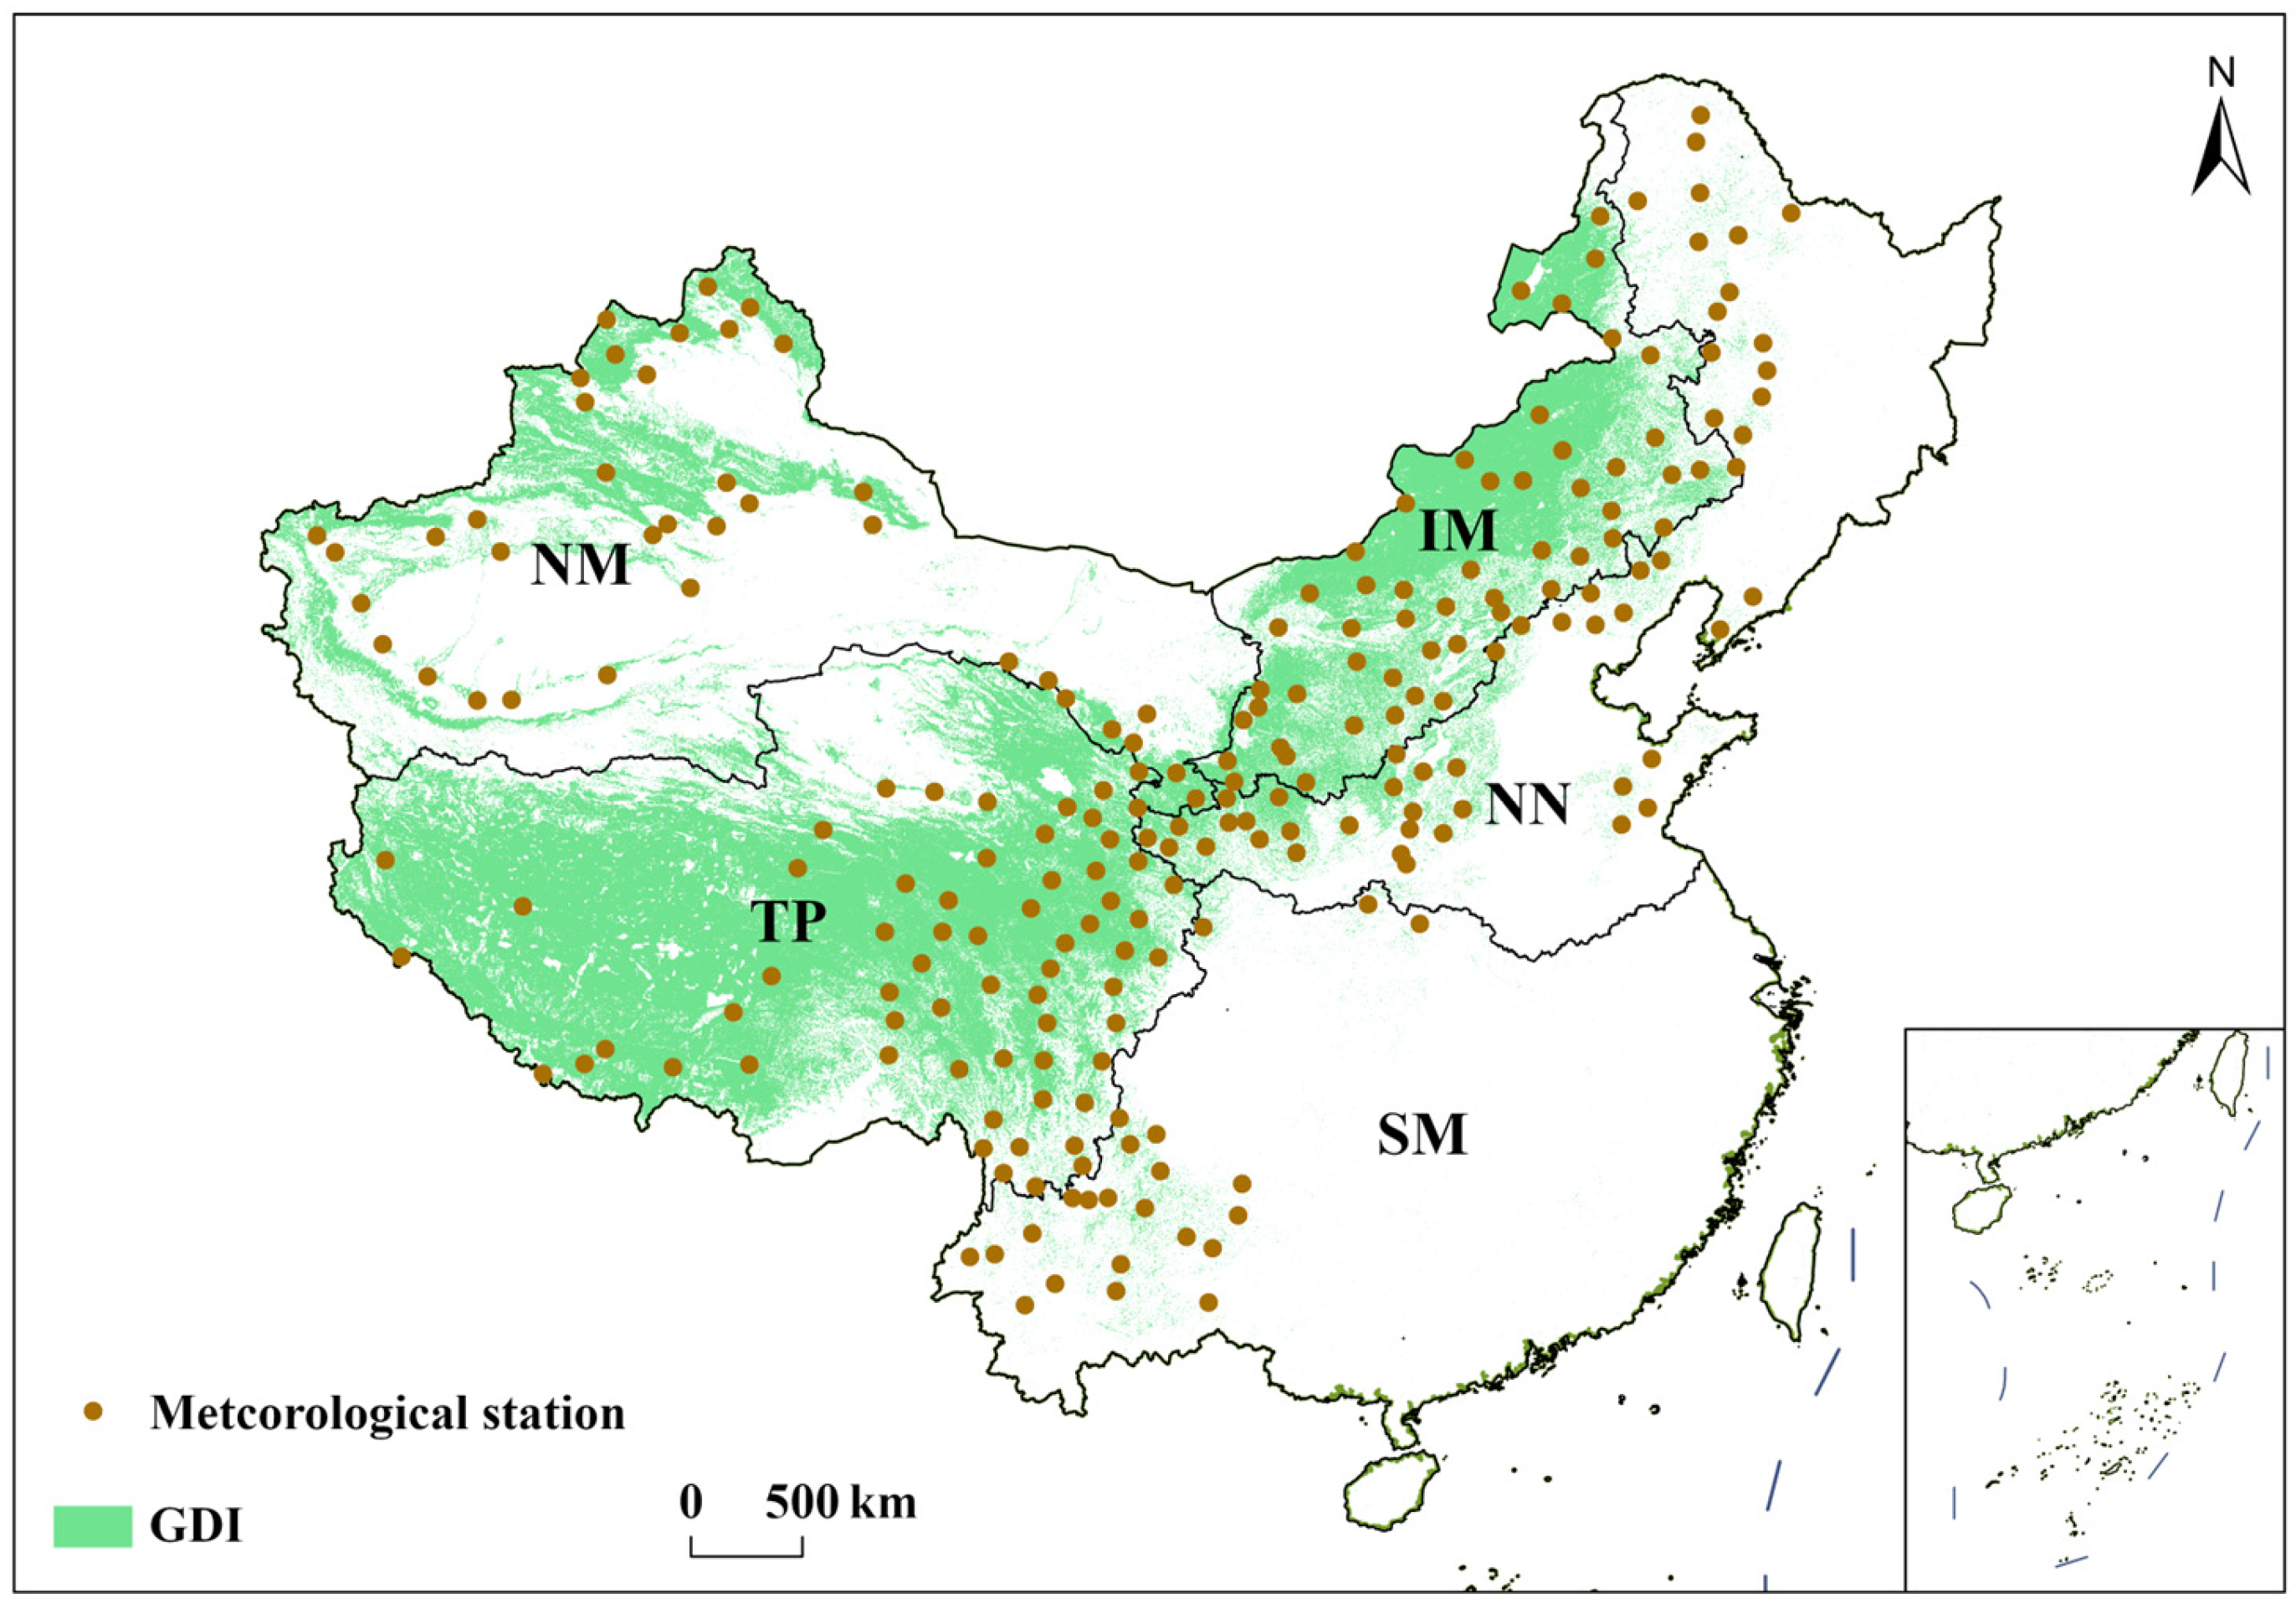
2.1. Study Area
2.2. Data Sources
2.2.1. Remote Sensing Data
2.2.2. Meteorological Data
2.3. Data Processing and Analysis
2.3.1. Change
2.3.2. Meteorological Dataset
2.3.3. Correlation Analysis
3. Results
3.1. Five Major Grassland Regions in China
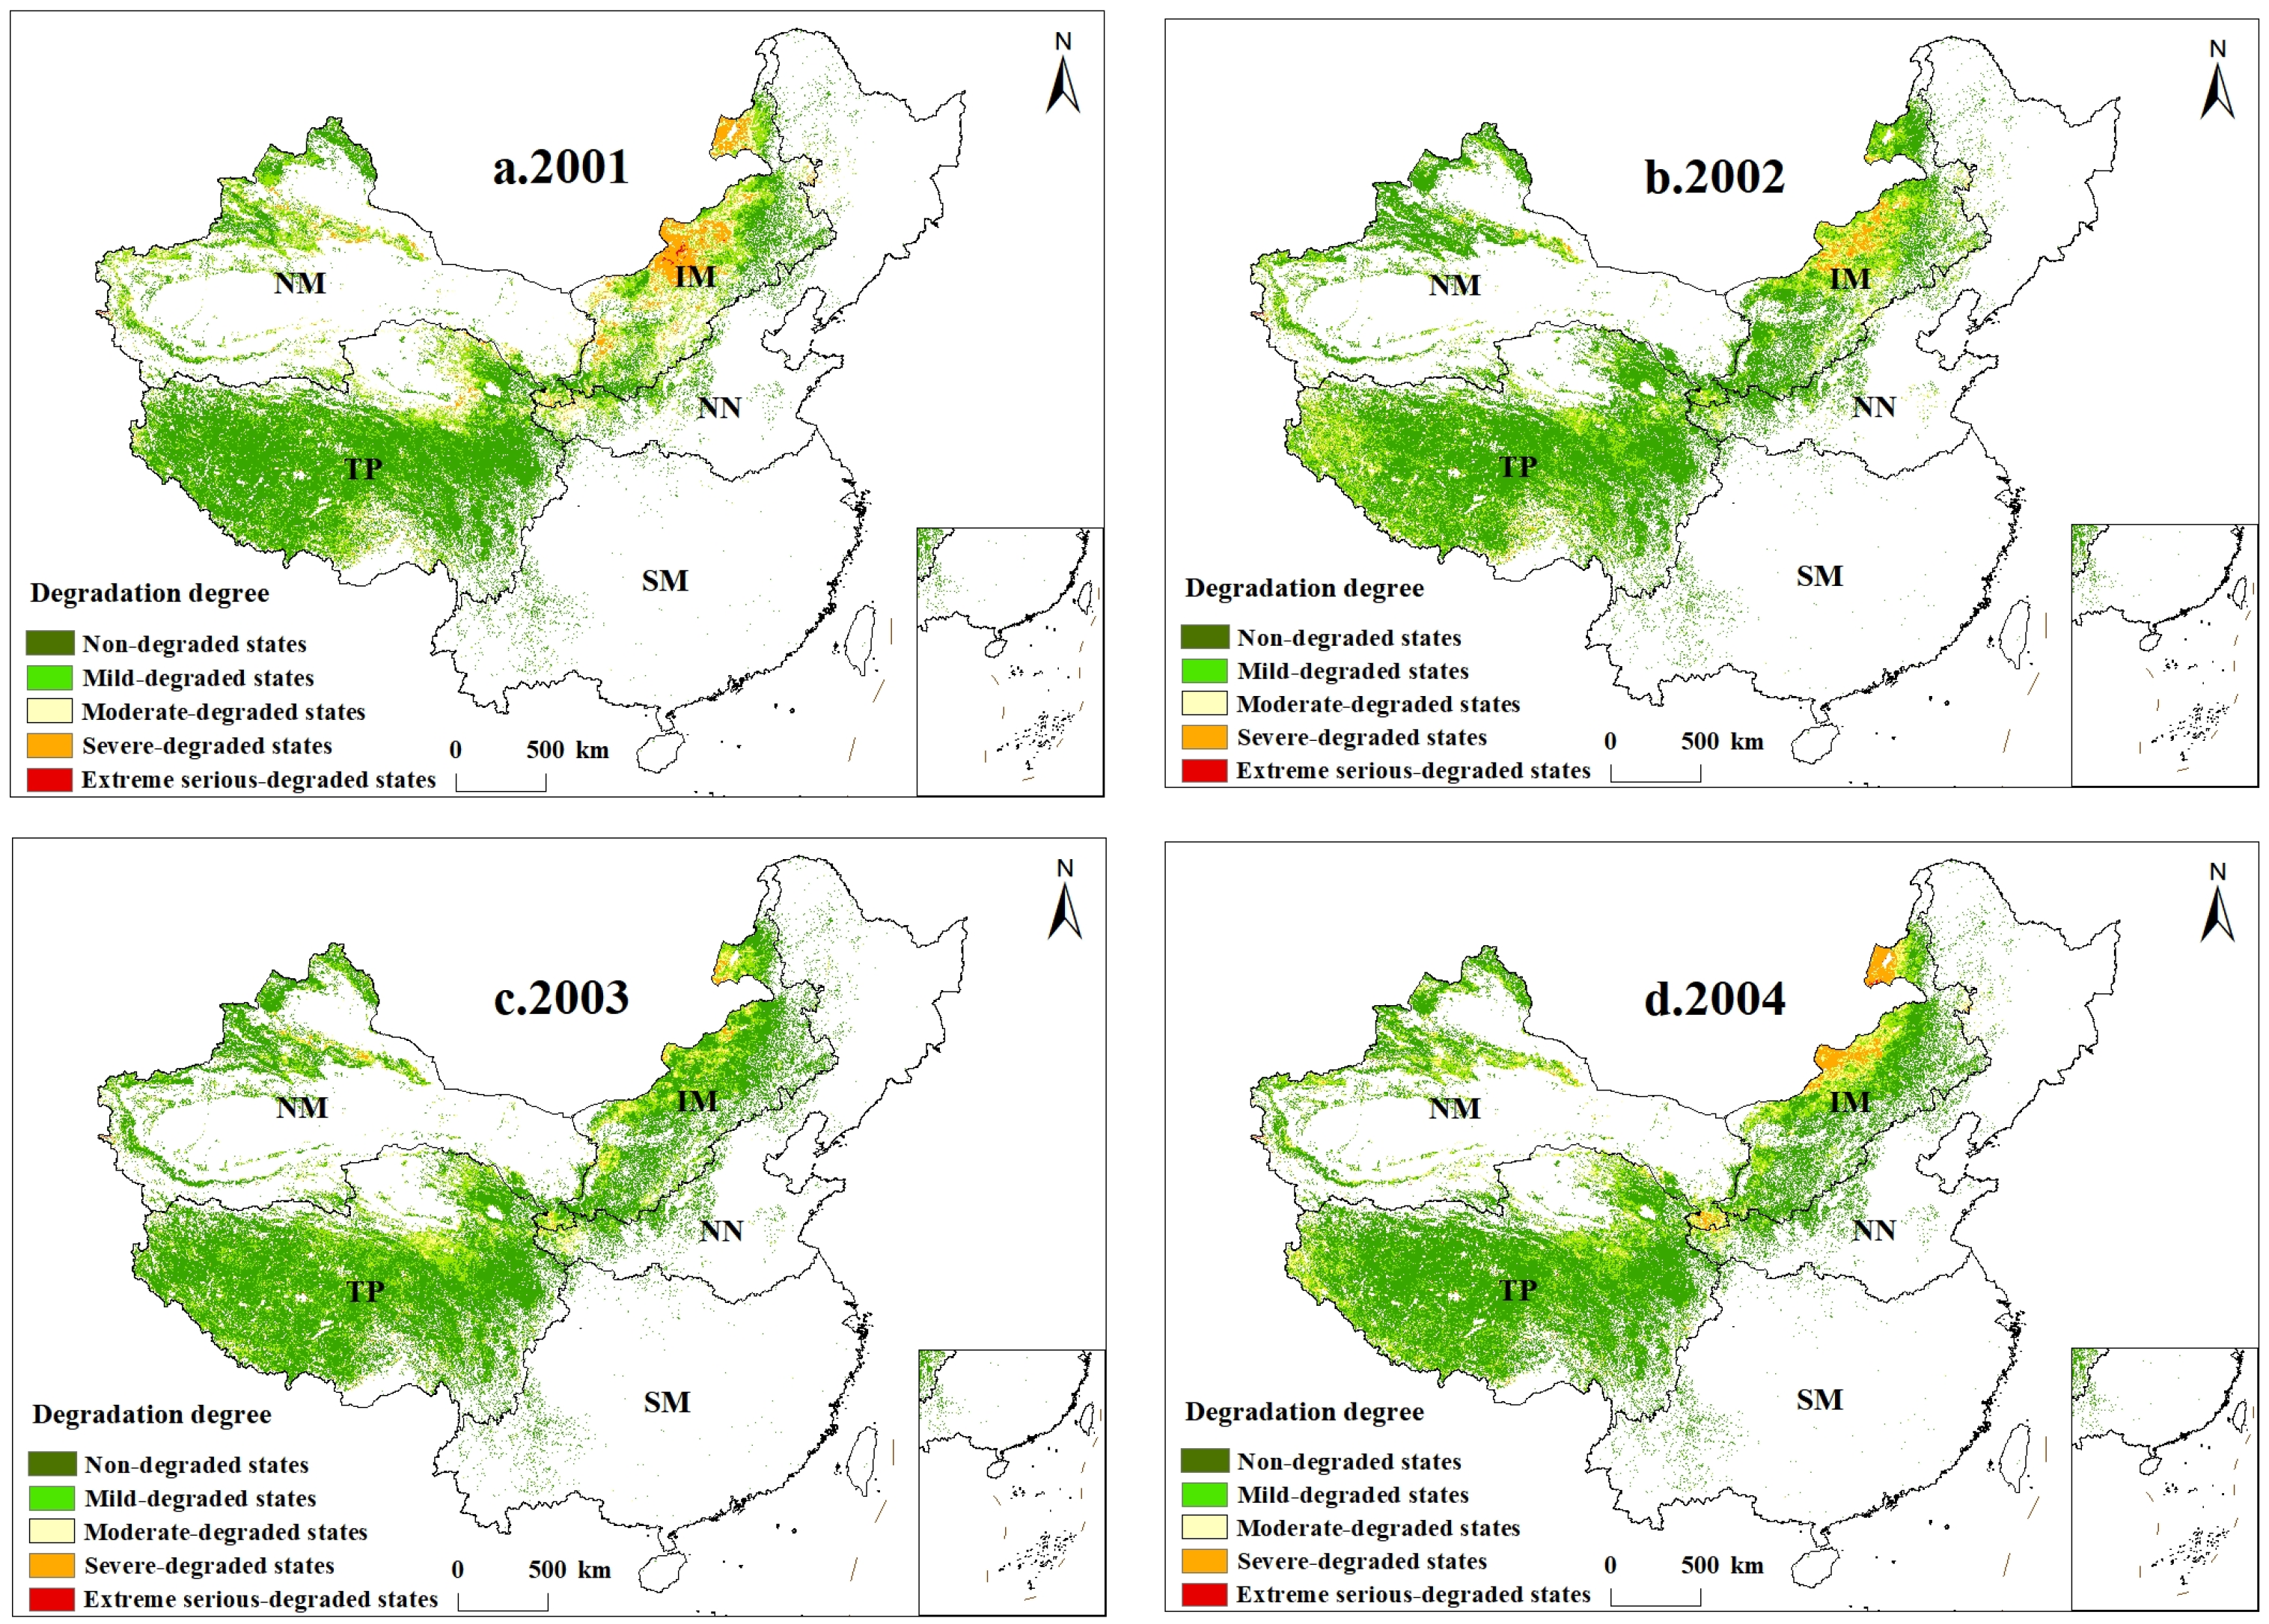
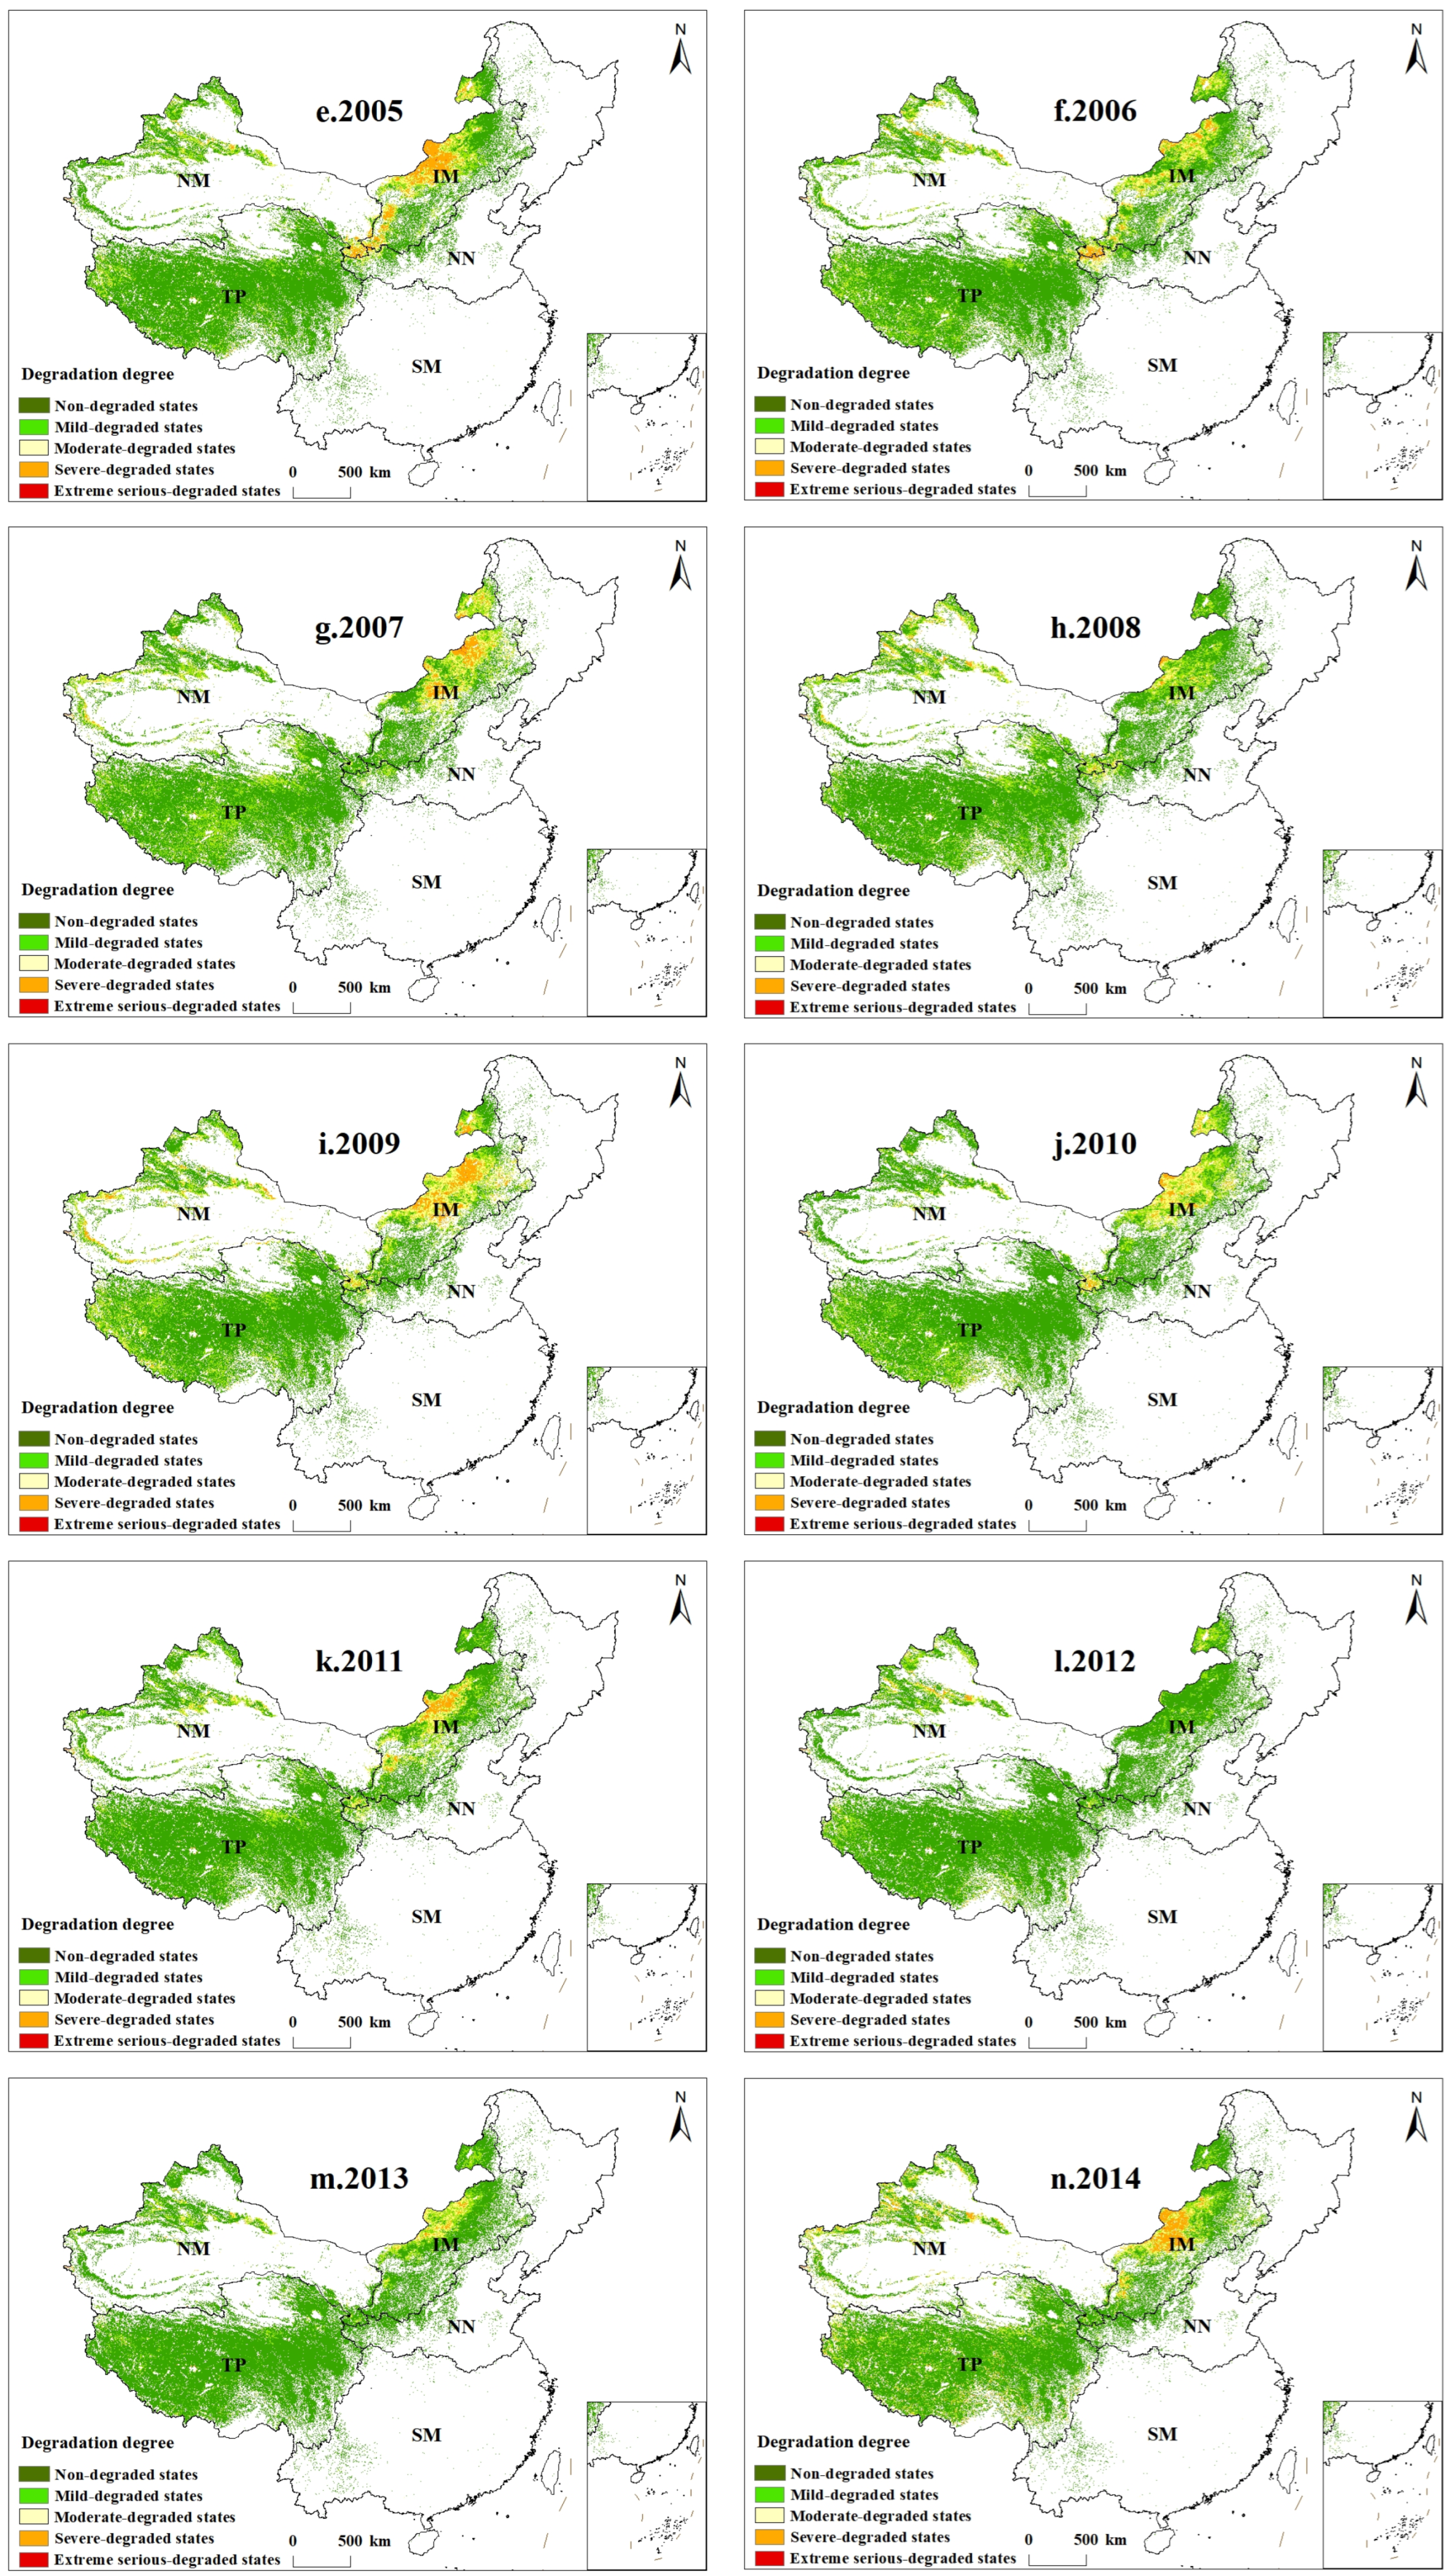
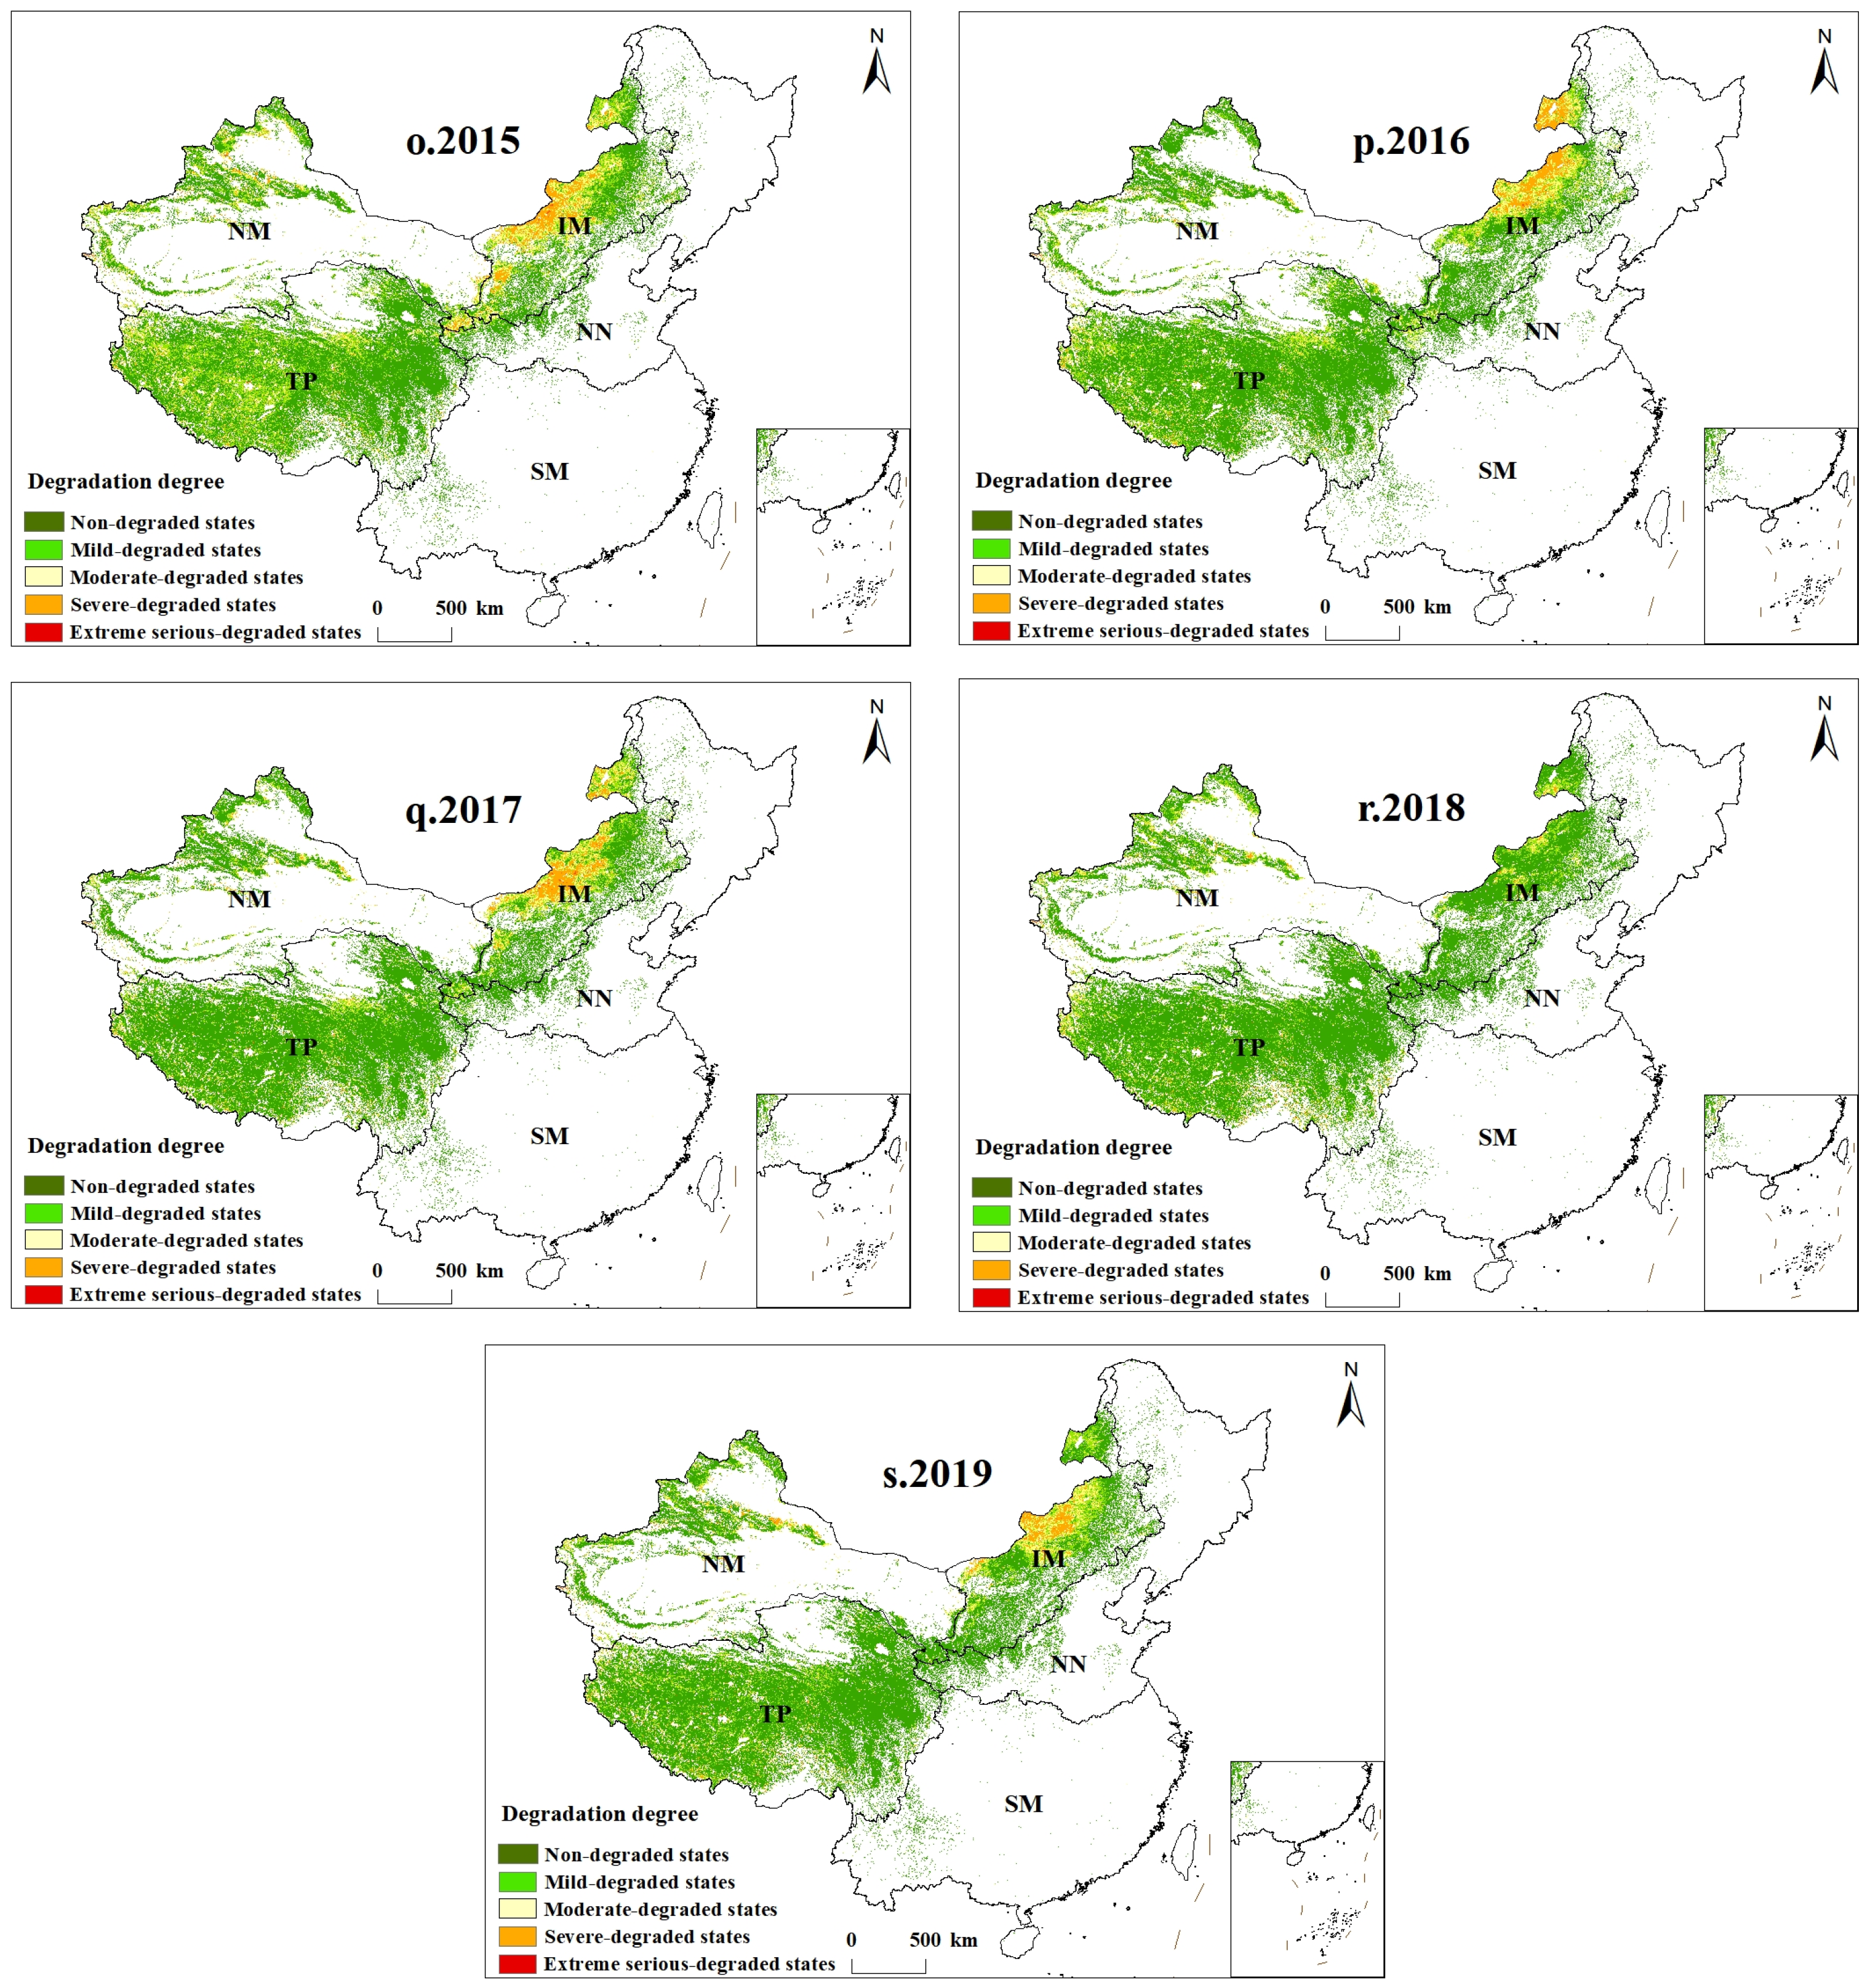
3.2. Spatiotemporal Distribution of Grassland Degradation
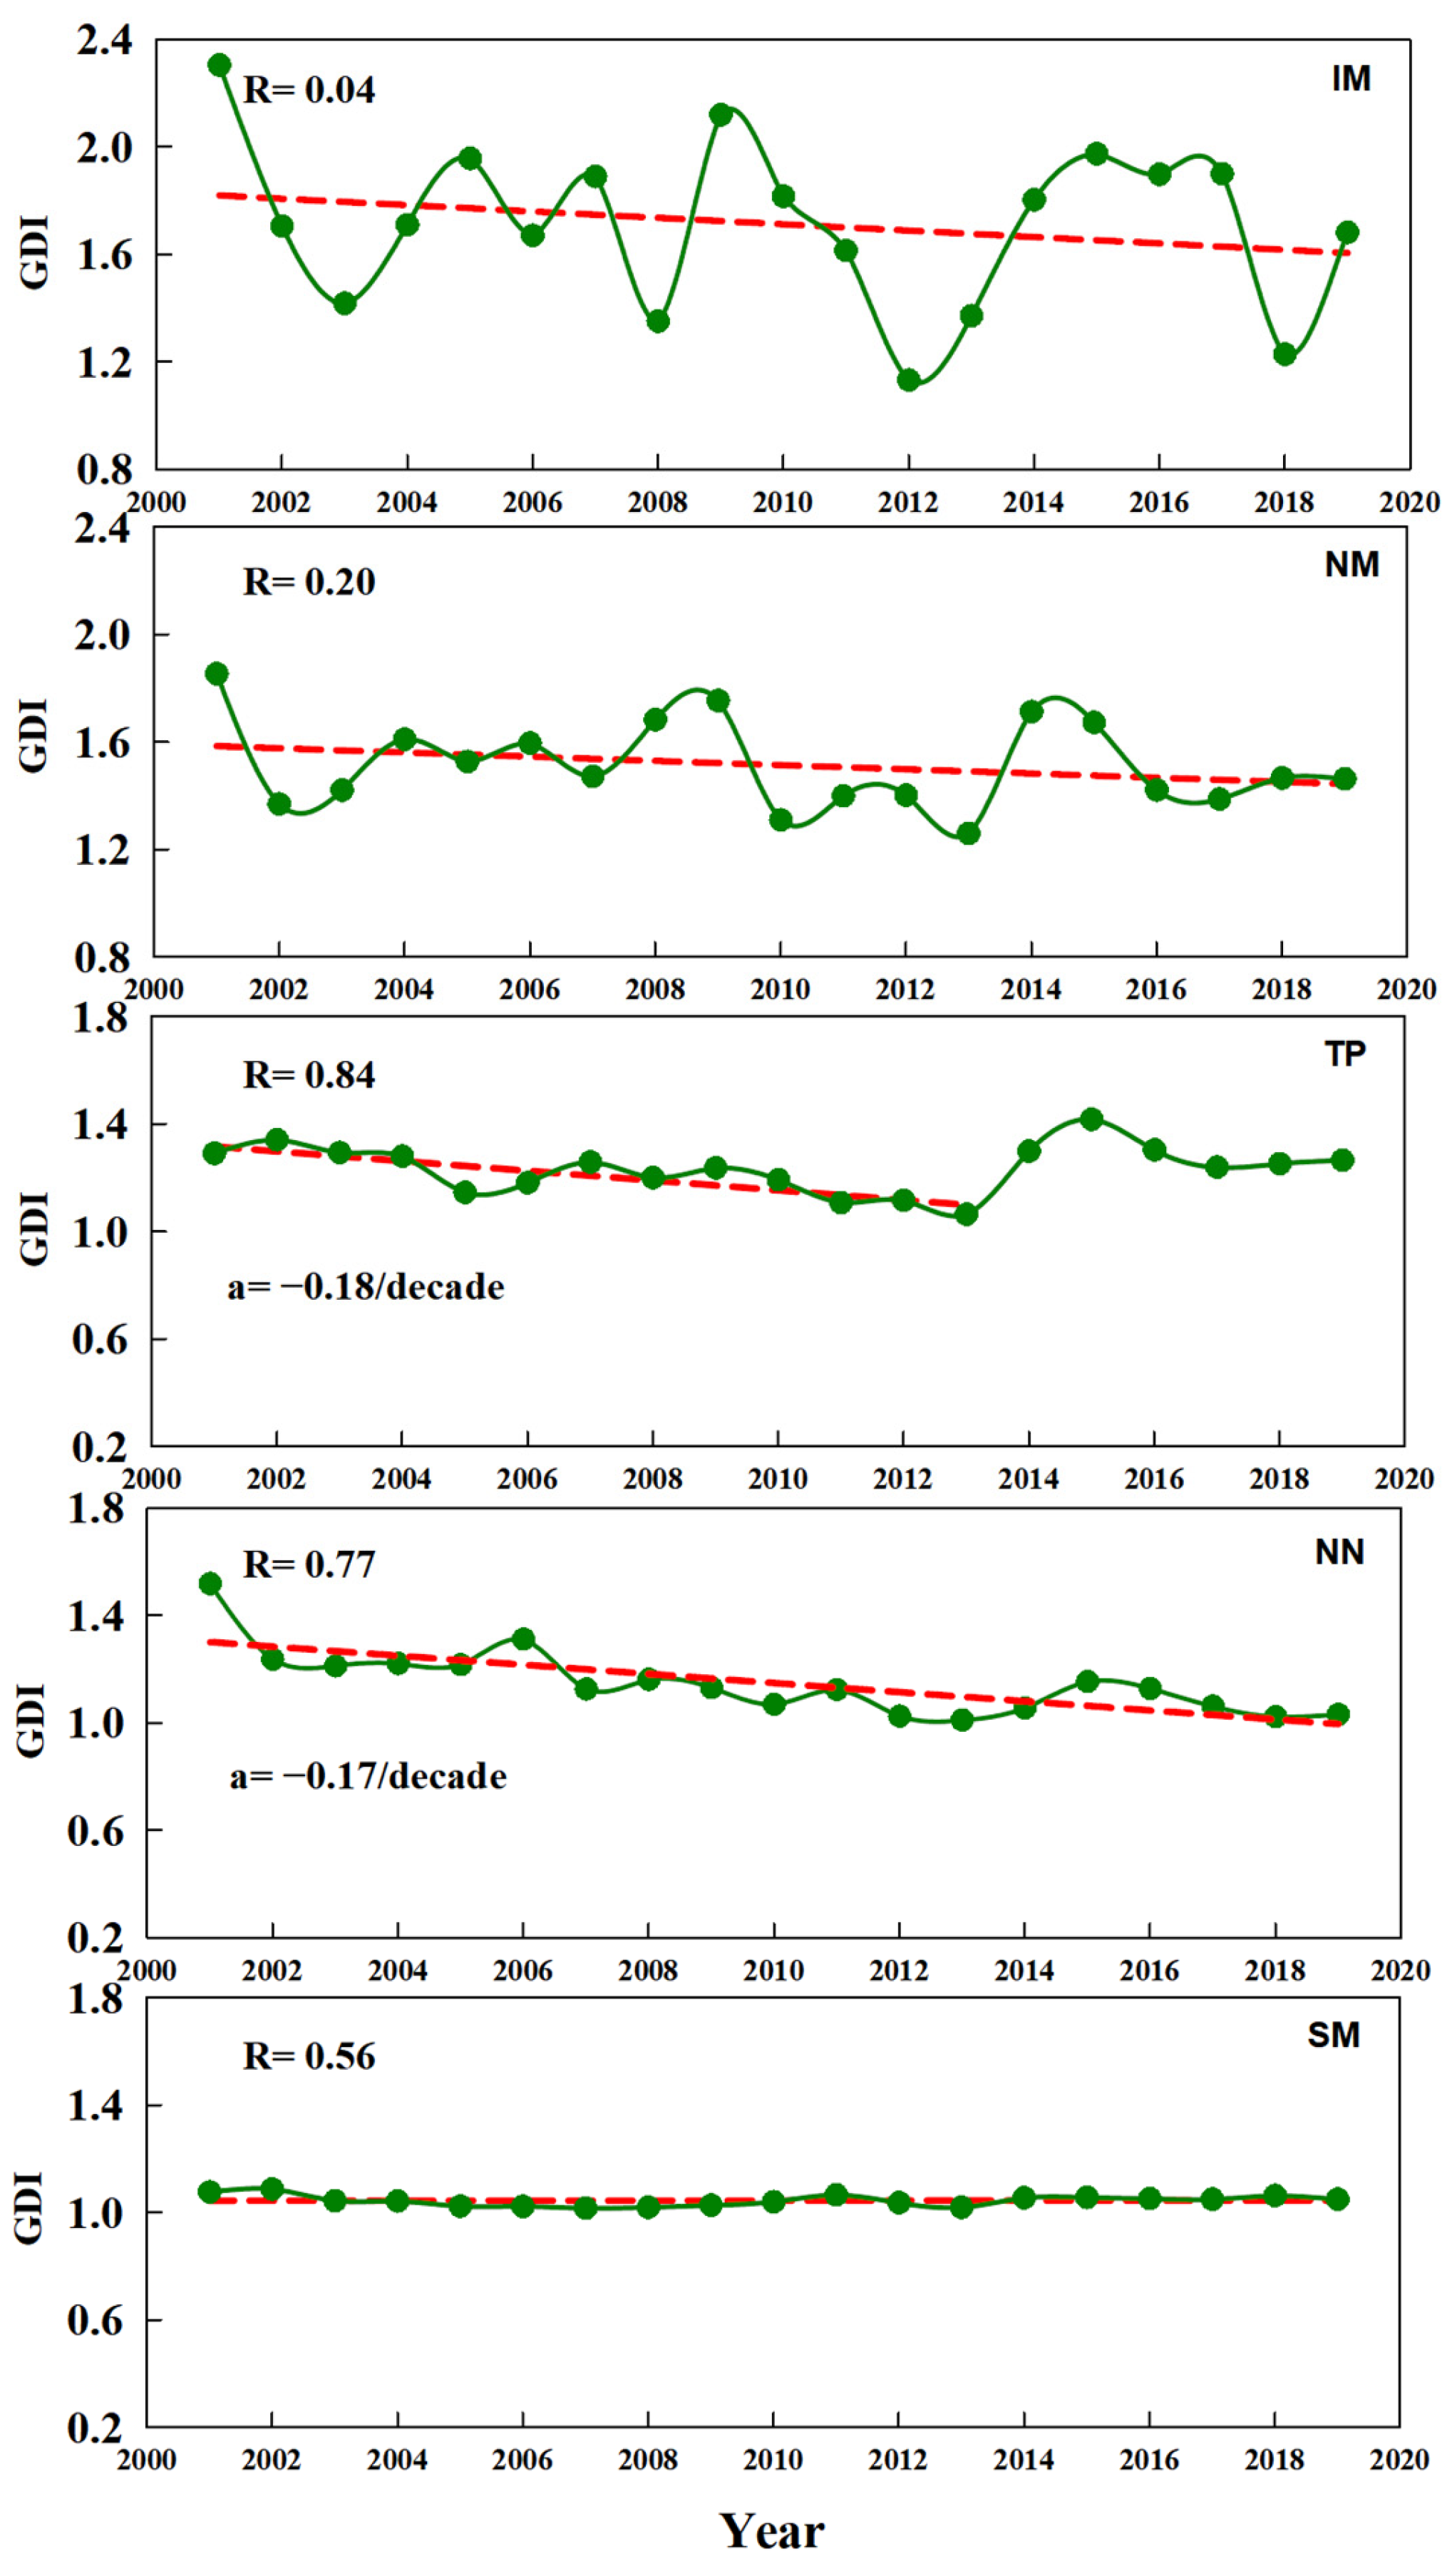
3.3. Temporal Changes of Grassland Degradation Index of China in Past 20 Years
3.4. Response of Grassland Degradation Index to Climate Change
3.4.1. Relationships between the and Annual Climate Variables
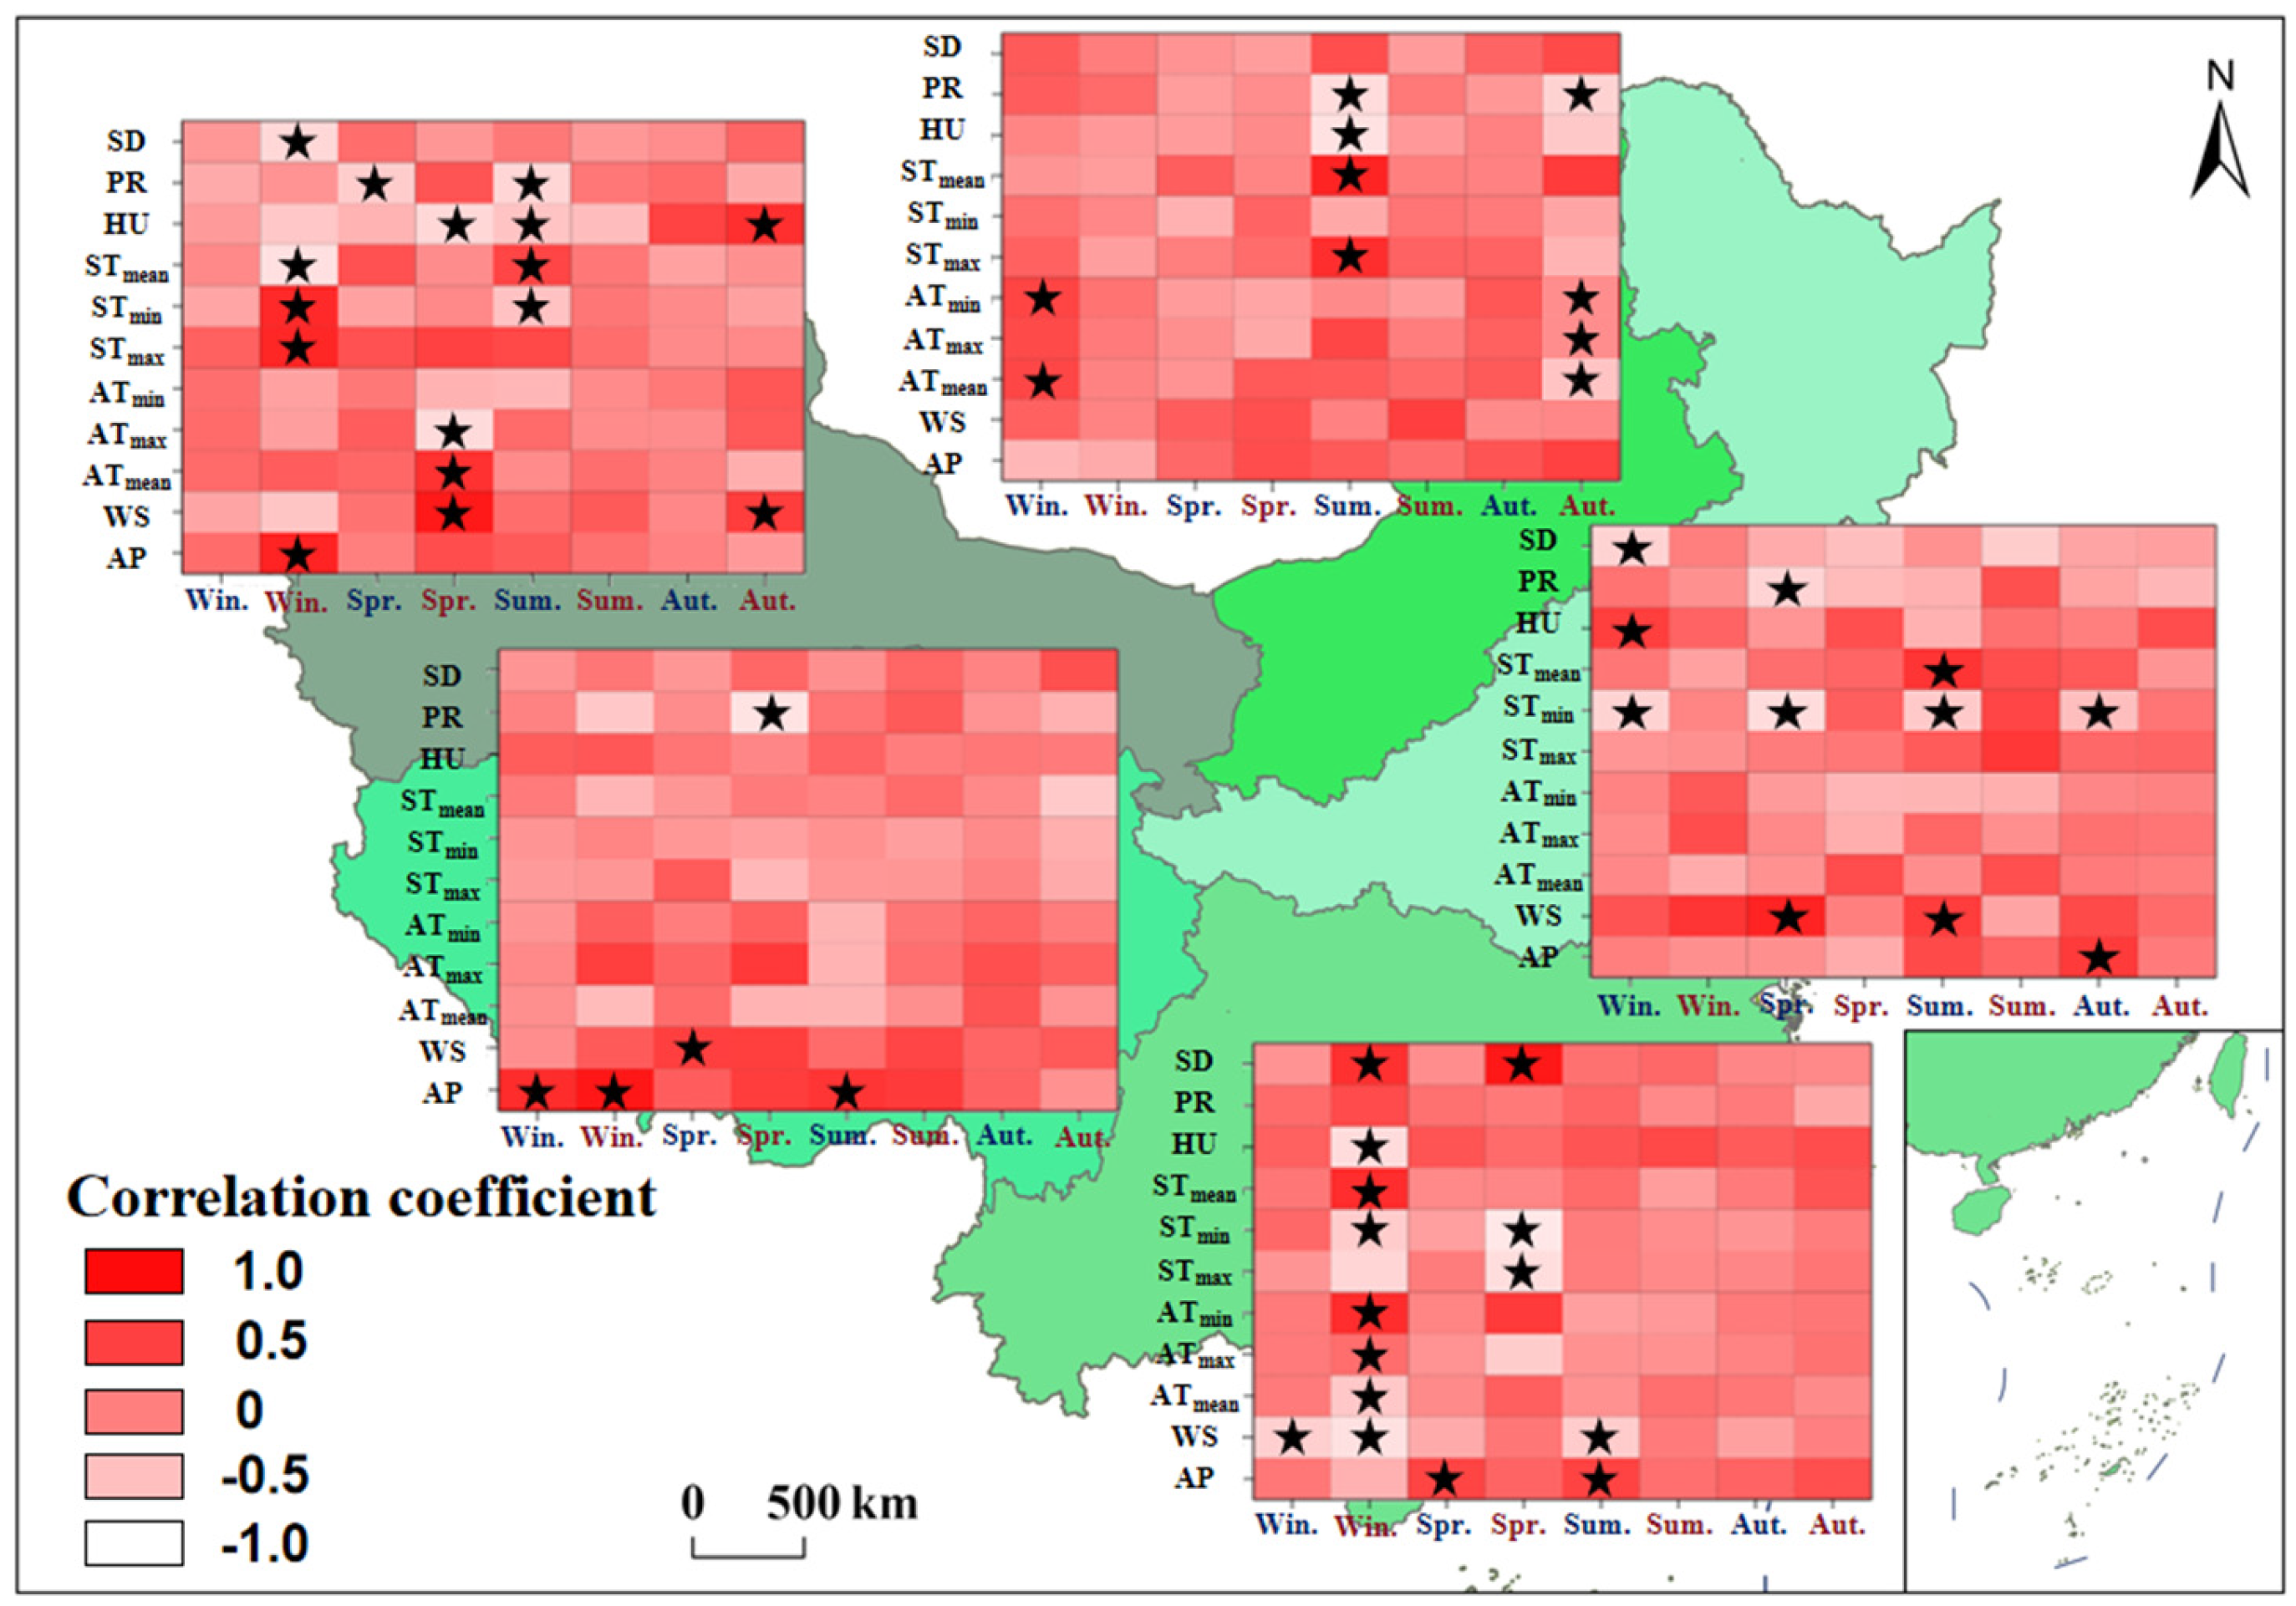
3.4.2. Relationships between the and Seasonal Climate Variables
4. Discussion
5. Conclusions
Author Contributions
Funding
Data Availability Statement
Conflicts of Interest
Appendix A

| Region | Meteorological Factors | Mar. | Apr. | May | Jun. | Jul. | Aug. | Sep. | Oct. | Nov. |
|---|---|---|---|---|---|---|---|---|---|---|
| NN | ATmean | −0.08 | −0.26 | 0.67 * | −0.30 | −0.16 | 0.45 | 0.46 | 0.09 | −0.33 |
| ATmax | −0.04 | 0.27 | −0.60 | 0.59 | 0.18 | −0.35 | −0.40 | −0.34 | 0.31 | |
| ATmin | 0.14 | 0.27 | −0.61 | 0.23 | 0.10 | −0.36 | −0.42 | 0.38 | 0.29 | |
| HU | 0.33 | −0.08 | 0.53 | −0.10 | −0.27 | 0.05 | 0.38 | −0.25 | 0.53 | |
| PR | −0.35 | −0.47 | −0.35 | −0.48 | 0.50 | −0.18 | −0.27 | −0.62 | −0.19 | |
| WS | 0.19 | −0.02 | 0.66 | 0.40 | 0.57 | −0.17 | 0.42 | 0.61 | 0.26 | |
| AP | −0.28 | 0.19 | −0.22 | 0.43 | 0.34 | 0.37 | 0.75 * | 0.48 | 0.07 | |
| STmean | 0.10 | 0.04 | −0.75 * | −0.65 | −0.19 | −0.37 | −0.36 | −0.31 | 0.31 | |
| SD | 0.37 | −0.41 | 0.29 | −0.42 | 0.04 | −0.04 | −0.47 | 0.52 | 0.23 | |
| STmax | −0.05 | −0.06 | 0.69 * | 0.61 | 0.28 | 0.30 | 0.30 | 0.23 | 0.01 | |
| STmin | 0.15 | 0.24 | 0.58 | 0.25 | 0.12 | 0.21 | 0.32 | 0.07 | 0.30 | |
| SM | ATmean | −0.48 | 0.31 | −0.10 | −0.38 | 0.27 | 0.21 | −0.01 | 0.11 | 0.39 |
| ATmax | 0.49 | −0.24 | −0.08 | 0.36 | −0.13 | −0.18 | −0.25 | −0.09 | −0.25 | |
| ATmin | 0.46 | −0.25 | 0.18 | 0.46 | −0.45 | −0.25 | 0.22 | −0.07 | −0.41 | |
| HU | −0.21 | 0.52 | 0.15 | 0.32 | 0.64 | 0.01 | −0.21 | 0.27 | 0.28 | |
| PR | 0.24 | −0.29 | 0.08 | −0.28 | −0.20 | 0.18 | −0.15 | −0.19 | 0.03 | |
| WS | −0.03 | 0.05 | 0.22 | −0.34 | −0.06 | 0.01 | 0.08 | 0.29 | −0.10 | |
| AP | 0.49 | 0.20 | −0.14 | −0.14 | 0.38 | 0.12 | 0.46 | 0.12 | 0.14 | |
| STmean | 0.48 | 0.39 | 0.63 | 0.37 | −0.26 | −0.04 | 0.38 | 0.18 | 0.01 | |
| SD | 0.39 | 0.08 | 0.42 | 0.28 | −0.32 | 0.08 | 0.33 | 0.11 | −0.08 | |
| STmax | −0.52 | −0.28 | −0.54 | −0.29 | 0.47 | 0.04 | −0.37 | −0.16 | −0.02 | |
| STmin | −0.49 | −0.36 | −0.72 * | −0.41 | 0.36 | 0.07 | −0.31 | −0.25 | −0.02 | |
| IM | ATmean | −0.10 | 0.48 | −0.27 | 0.43 | 0.31 | −0.16 | −0.20 | −0.38 | −0.24 |
| ATmax | −0.07 | −0.48 | 0.37 | −0.47 | −0.40 | −0.08 | 0.09 | 0.04 | 0.20 | |
| ATmin | 0.12 | −0.41 | 0.13 | −0.36 | −0.11 | 0.31 | 0.29 | 0.57 | 0.18 | |
| HU | −0.22 | 0.12 | −0.12 | 0.13 | −0.25 | −0.42 | 0.10 | −0.53 | −0.13 | |
| PR | 0.25 | 0.42 | −0.27 | 0.12 | −0.14 | 0.43 | −0.42 | 0.27 | −0.07 | |
| WS | 0.25 | 0.19 | 0.13 | 0.05 | 0.67 | 0.25 | 0.06 | −0.27 | −0.14 | |
| AP | 0.14 | 0.34 | 0.24 | 0.17 | −0.25 | 0.46 | 0.02 | −0.08 | 0.22 | |
| STmean | 0.24 | −0.25 | −0.34 | −0.13 | −0.19 | 0.23 | 0.60 | 0.60 | 0.53 | |
| SD | −0.03 | −0.16 | 0.48 | −0.25 | −0.06 | −0.42 | −0.19 | 0.26 | 0.21 | |
| STmax | −0.15 | 0.20 | 0.13 | 0.17 | 0.31 | 0.24 | −0.49 | −0.54 | −0.25 | |
| STmin | −0.26 | −0.18 | 0.23 | 0.05 | −0.09 | −0.55 | −0.68 * | −0.66 | −0.50 | |
| TP | ATmean | 0.62 | −0.45 | −0.16 | −0.51 | 0.07 | 0.32 | 0.59 | 0.25 | −0.09 |
| ATmax | −0.62 | 0.75 * | 0.22 | 0.45 | −0.11 | −0.18 | −0.43 | −0.04 | 0.09 | |
| ATmin | −0.60 | −0.22 | 0.11 | 0.51 | −0.01 | −0.41 | −0.66 | −0.44 | 0.09 | |
| HU | 0.72 * | 0.57 | −0.08 | 0.00 | −0.22 | 0.61 | 0.54 | 0.56 | −0.71 * | |
| PR | −0.83 * | −0.46 | −0.03 | 0.01 | 0.28 | −0.37 | −0.13 | 0.06 | −0.67 * | |
| WS | 0.85 * | 0.71 * | 0.50 | 0.38 | 0.06 | 0.38 | 0.60 | 0.82 * | 0.27 | |
| AP | 0.80 * | 0.02 | 0.06 | 0.27 | 0.14 | 0.71 * | −0.47 | −0.13 | 0.77 * | |
| STmean | −0.29 | −0.70 * | 0.59 | 0.62 | 0.34 | −0.43 | −0.34 | −0.13 | 0.66 | |
| SD | 0.18 | −0.51 | −0.44 | 0.10 | 0.22 | −0.38 | −0.41 | −0.31 | −0.78 * | |
| STmax | 0.26 | 0.59 | −0.58 | −0.59 | −0.30 | 0.46 | 0.48 | 0.22 | −0.66 | |
| STmin | 0.28 | 0.67 * | −0.58 | −0.63 | −0.35 | 0.39 | 0.31 | 0.11 | −0.63 | |
| NM | ATmean | 0.12 | 0.11 | 0.13 | 0.15 | 0.58 | −0.39 | −0.51 | −0.57 | 0.25 |
| ATmax | −0.34 | 0.00 | −0.30 | 0.05 | −0.64 | 0.45 | 0.42 | 0.53 | −0.14 | |
| ATmin | 0.19 | −0.29 | 0.21 | −0.17 | −0.34 | 0.31 | 0.17 | 0.69 * | −0.31 | |
| HU | −0.50 | −0.06 | −0.06 | −0.45 | −0.86 * | 0.02 | 0.80 * | −0.42 | 0.45 | |
| PR | −0.28 | 0.25 | 0.19 | −0.36 | 0.64 | 0.46 | −0.48 | 0.44 | −0.35 | |
| WS | 0.76 * | 0.17 | 0.61 | −0.52 | −0.62 | 0.22 | 0.24 | 0.72 * | −0.10 | |
| AP | −0.10 | 0.08 | −0.14 | 0.65 | 0.35 | 0.43 | −0.40 | 0.05 | −0.06 | |
| STmean | −0.13 | 0.11 | 0.02 | −0.33 | −0.48 | 0.21 | 0.45 | 0.26 | −0.09 | |
| SD | 0.58 | −0.42 | −0.28 | −0.45 | −0.81 * | 0.05 | 0.45 | 0.15 | −0.18 | |
| STmax | −0.04 | −0.07 | 0.32 | 0.37 | 0.28 | −0.16 | −0.25 | −0.23 | 0.03 | |
| STmin | 0.00 | 0.00 | −0.45 | 0.29 | 0.05 | −0.30 | −0.26 | −0.56 | 0.12 | |
| NN | ATmean | −0.08 | −0.26 | 0.67* | −0.30 | −0.16 | 0.45 | 0.46 | 0.09 | −0.33 |
| ATmax | −0.04 | 0.27 | −0.60 | 0.59 | 0.18 | −0.35 | −0.40 | −0.34 | 0.31 | |
| ATmin | 0.14 | 0.27 | −0.61 | 0.23 | 0.10 | −0.36 | −0.42 | 0.38 | 0.29 | |
| HU | 0.33 | −0.08 | 0.53 | −0.10 | −0.27 | 0.05 | 0.38 | −0.25 | 0.53 | |
| PR | −0.35 | −0.47 | −0.35 | −0.48 | 0.50 | −0.18 | −0.27 | −0.62 | −0.19 | |
| WS | 0.19 | −0.02 | 0.66 | 0.40 | 0.57 | −0.17 | 0.42 | 0.61 | 0.26 | |
| AP | −0.28 | 0.19 | −0.22 | 0.43 | 0.34 | 0.37 | 0.75 * | 0.48 | 0.07 | |
| STmean | 0.10 | 0.04 | −0.75 * | −0.65 | −0.19 | −0.37 | −0.36 | −0.31 | 0.31 | |
| SD | 0.37 | −0.41 | 0.29 | −0.42 | 0.04 | −0.04 | −0.47 | 0.52 | 0.23 | |
| STmax | −0.05 | −0.06 | 0.69 * | 0.61 | 0.28 | 0.30 | 0.30 | 0.23 | 0.01 | |
| STmin | 0.15 | 0.24 | 0.58 | 0.25 | 0.12 | 0.21 | 0.32 | 0.07 | 0.30 | |
| SM | ATmean | −0.48 | 0.31 | −0.10 | −0.38 | 0.27 | 0.21 | −0.01 | 0.11 | 0.39 |
| ATmax | 0.49 | −0.24 | −0.08 | 0.36 | −0.13 | −0.18 | −0.25 | −0.09 | −0.25 | |
| ATmin | 0.46 | −0.25 | 0.18 | 0.46 | −0.45 | −0.25 | 0.22 | −0.07 | −0.41 | |
| HU | −0.21 | 0.52 | 0.15 | 0.32 | 0.64 | 0.01 | −0.21 | 0.27 | 0.28 | |
| PR | 0.24 | −0.29 | 0.08 | −0.28 | −0.20 | 0.18 | −0.15 | −0.19 | 0.03 | |
| WS | −0.03 | 0.05 | 0.22 | −0.34 | −0.06 | 0.01 | 0.08 | 0.29 | −0.10 | |
| AP | 0.49 | 0.20 | −0.14 | −0.14 | 0.38 | 0.12 | 0.46 | 0.12 | 0.14 | |
| STmean | 0.48 | 0.39 | 0.63 | 0.37 | −0.26 | −0.04 | 0.38 | 0.18 | 0.01 | |
| SD | 0.39 | 0.08 | 0.42 | 0.28 | −0.32 | 0.08 | 0.33 | 0.11 | −0.08 | |
| STmax | −0.52 | −0.28 | −0.54 | −0.29 | 0.47 | 0.04 | −0.37 | −0.16 | −0.02 | |
| STmin | −0.49 | −0.36 | −0.72 * | −0.41 | 0.36 | 0.07 | −0.31 | −0.25 | −0.02 | |
| IM | ATmean | −0.10 | 0.48 | −0.27 | 0.43 | 0.31 | −0.16 | −0.20 | −0.38 | −0.24 |
| ATmax | −0.07 | −0.48 | 0.37 | −0.47 | −0.40 | −0.08 | 0.09 | 0.04 | 0.20 | |
| ATmin | 0.12 | −0.41 | 0.13 | −0.36 | −0.11 | 0.31 | 0.29 | 0.57 | 0.18 | |
| HU | −0.22 | 0.12 | −0.12 | 0.13 | −0.25 | −0.42 | 0.10 | −0.53 | −0.13 | |
| PR | 0.25 | 0.42 | −0.27 | 0.12 | −0.14 | 0.43 | −0.42 | 0.27 | −0.07 | |
| WS | 0.25 | 0.19 | 0.13 | 0.05 | 0.67 | 0.25 | 0.06 | −0.27 | −0.14 | |
| AP | 0.14 | 0.34 | 0.24 | 0.17 | −0.25 | 0.46 | 0.02 | −0.08 | 0.22 | |
| STmean | 0.24 | −0.25 | −0.34 | −0.13 | −0.19 | 0.23 | 0.60 | 0.60 | 0.53 | |
| SD | −0.03 | −0.16 | 0.48 | −0.25 | −0.06 | −0.42 | −0.19 | 0.26 | 0.21 | |
| STmax | −0.15 | 0.20 | 0.13 | 0.17 | 0.31 | 0.24 | −0.49 | −0.54 | −0.25 | |
| STmin | −0.26 | −0.18 | 0.23 | 0.05 | −0.09 | −0.55 | −0.68* | −0.66 | −0.50 | |
| TP | ATmean | 0.62 | −0.45 | −0.16 | −0.51 | 0.07 | 0.32 | 0.59 | 0.25 | −0.09 |
| ATmax | −0.62 | 0.75 * | 0.22 | 0.45 | −0.11 | −0.18 | −0.43 | −0.04 | 0.09 | |
| ATmin | −0.60 | −0.22 | 0.11 | 0.51 | −0.01 | −0.41 | −0.66 | −0.44 | 0.09 | |
| HU | 0.72 * | 0.57 | −0.08 | 0.00 | −0.22 | 0.61 | 0.54 | 0.56 | −0.71 * | |
| PR | −0.83 * | −0.46 | −0.03 | 0.01 | 0.28 | −0.37 | −0.13 | 0.06 | −0.67 * | |
| WS | 0.85 * | 0.71 * | 0.50 | 0.38 | 0.06 | 0.38 | 0.60 | 0.82 * | 0.27 | |
| AP | 0.80 * | 0.02 | 0.06 | 0.27 | 0.14 | 0.71 * | −0.47 | −0.13 | 0.77 * | |
| STmean | −0.29 | −0.70 * | 0.59 | 0.62 | 0.34 | −0.43 | −0.34 | −0.13 | 0.66 | |
| SD | 0.18 | −0.51 | −0.44 | 0.10 | 0.22 | −0.38 | −0.41 | −0.31 | −0.78 * | |
| STmax | 0.26 | 0.59 | −0.58 | −0.59 | −0.30 | 0.46 | 0.48 | 0.22 | −0.66 | |
| STmin | 0.28 | 0.67 * | −0.58 | −0.63 | −0.35 | 0.39 | 0.31 | 0.11 | −0.63 | |
| NM | ATmean | 0.12 | 0.11 | 0.13 | 0.15 | 0.58 | −0.39 | −0.51 | −0.57 | 0.25 |
| ATmax | −0.34 | 0.00 | −0.30 | 0.05 | −0.64 | 0.45 | 0.42 | 0.53 | −0.14 | |
| ATmin | 0.19 | −0.29 | 0.21 | −0.17 | −0.34 | 0.31 | 0.17 | 0.69 * | −0.31 | |
| HU | −0.50 | −0.06 | −0.06 | −0.45 | −0.86 * | 0.02 | 0.80 * | −0.42 | 0.45 | |
| PR | −0.28 | 0.25 | 0.19 | −0.36 | 0.64 | 0.46 | −0.48 | 0.44 | −0.35 | |
| WS | 0.76 * | 0.17 | 0.61 | −0.52 | −0.62 | 0.22 | 0.24 | 0.72 * | −0.10 | |
| AP | −0.10 | 0.08 | −0.14 | 0.65 | 0.35 | 0.43 | −0.40 | 0.05 | −0.06 | |
| STmean | −0.13 | 0.11 | 0.02 | −0.33 | −0.48 | 0.21 | 0.45 | 0.26 | −0.09 | |
| SD | 0.58 | −0.42 | −0.28 | −0.45 | −0.81 * | 0.05 | 0.45 | 0.15 | −0.18 | |
| STmax | −0.04 | −0.07 | 0.32 | 0.37 | 0.28 | −0.16 | −0.25 | −0.23 | 0.03 | |
| STmin | 0.00 | 0.00 | −0.45 | 0.29 | 0.05 | −0.30 | −0.26 | −0.56 | 0.12 |
References
- Yan, Z.; Gao, Z.; Sun, B.; Ding, X.; Gao, T.; Li, Y. Global degradation trends of grassland and their driving factors since 2000. Int. J. Digit. Earth 2023, 16, 1661–1684. [Google Scholar] [CrossRef]
- Akiyama, T.; Kawamura, K. Grassland degradation in China: Methods of monitoring, management and restoration. Grassl. Sci. 2007, 53, 1–17. [Google Scholar] [CrossRef]
- Ceballos, G.; Davidson, A.; List, R.; Pacheco, J.; Manzano−Fischer, P.; Santos−Barrera, G.; Cruzado, J. Rapid decline of a grassland system and its ecological and conservation implications. PLoS ONE 2010, 5, e8562. [Google Scholar] [CrossRef] [PubMed]
- Shen, X.; Jiang, M.; Lu, X.; Liu, X.; Liu, B.; Zhang, J.; Wang, X.; Tong, S.; Lei, G.; Wang, S.; et al. Aboveground biomass and its spatial distribution pattern of herbaceous marsh vegetation in China. Sci. China (Earth Sci.) 2021, 64, 1115–1125. [Google Scholar] [CrossRef]
- Thornley, J.H.M.; Cannell, M.G.R. Temperate grassland responses to climate change: An analysis using the Hurley pasture model. Ann. Bot. 1997, 80, 205–221. [Google Scholar] [CrossRef]
- Hoppe, F.; Zhusui Kyzy, T.; Usupbaev, A.; Schickhoff, U. Range land degradation assessment in Kyrgyzstan: Vegetation and soils as indicators of grazing pressure in Naryn Oblast. J. Mt. Sci. 2016, 13, 1567–1583. [Google Scholar] [CrossRef]
- Vásquez, H.V.; Puscán, M.M.H.; Bobadilla, L.G.; Zagaceta, H.; Valqui, L.; Maicelo, J.L.; Silva−López, J.O. Evaluation of pasture degradation through vegetation indices of the main livestock micro−watersheds in the Amazon region (NW Peru). Environ. Sustain. Indic. 2023, 20, 100315. [Google Scholar] [CrossRef]
- Tong, L.; Liu, Y.; Wang, Q.; Zhang, Z.; Li, J.; Sun, Z.; Khalifa, M. Relative effects of climate variation and human activities on grassland dynamics in Africa from 2000 to 2015. Ecol. Inform. 2019, 53, 100979. [Google Scholar] [CrossRef]
- Yang, Y.; Xu, M.; Sun, J.; Qiu, J.; Pei, W.; Zhang, K.; Xu, X.; Liu, D. Dynamic of Grassland Degradation and Its Driving Forces from Climate Variation and Human Activities in Central Asia. Agronomy 2023, 13, 2763. [Google Scholar] [CrossRef]
- Chen, T.; Tang, G.; Yuan, Y.; Guo, H.; Xu, Z.; Jiang, G.; Chen, X. Unraveling the relative impacts of climate change and human activities on grassland productivity in Central Asia over last three decades. Sci. Total Environ. 2020, 743, 140649. [Google Scholar] [CrossRef]
- Zhao, Y.; Wang, J.; Zhang, G.; Liu, L.; Yang, J.; Wu, X.; Biradar, C.; Dong, J.; Xiao, X. Divergent trends in grassland degradation and desertification under land use and climate change in Central Asia from 2000 to 2020. Ecol. Indic. 2023, 154, 110737. [Google Scholar] [CrossRef]
- Li, X.; Zhang, L.; Zhang, G.; Cui, H.; Liu, L. Grassland variation and its driving factors from 2000 to 2016: A comparative assessment between Qinghai−Tibet Plateau and Inner Mongolia Plateau. J. Environ. Prot. 2022, 13, 411–426. [Google Scholar] [CrossRef]
- Wang, S.; Dai, E.; Jia, L.; Wang, Y.; Huang, A.; Liao, L.; Cai, L.; Fan, D. Assessment of multiple factors and interactions affecting grassland degradation on the Tibetan Plateau. Ecol. Indic. 2023, 154, 110509. [Google Scholar] [CrossRef]
- Wang, Y.; Shen, X.; Jiang, M.; Tong, S.; Lu, X. Spatiotemporal change of aboveground biomass and its response to climate change in marshes of the Tibetan Plateau. Int. J. Appl. Earth Obs. Geoinf. 2021, 102, 102385. [Google Scholar] [CrossRef]
- Wan, H.; Gao, S.; Liu, Y.J.R.S. Grassland degradation monitoring and spatio−temporal variation analysis of the Hulun Buir Ecological Function Region. Resour. Sci. 2016, 38, 1443–1451. [Google Scholar]
- Kang, Y.M. Influence of grassland degradation on soil and vegetation characteristics in Inner Mongolia, China. Pedologist 2012, 55, 332–342. [Google Scholar]
- Zhang, Y.; Wang, Q.; Wang, Z.; Yang, Y.; Li, J. Impact of human activities and climate change on the grassland dynamics under different regime policies in the Mongolian Plateau. Sci. Total Environ. 2020, 698, 134304. [Google Scholar] [CrossRef]
- Zheng, S.; Sun, Y. The Analysis of Human Factors on Grassland Productivity in Western Songnen Plain. Procedia Environ. Sci. 2011, 10, 1302–1307. [Google Scholar] [CrossRef]
- Gang, C.; Zhou, W.; Chen, Y.; Wang, Z.; Sun, Z.; Li, J.; Qi, J.; Odeh, I. Quantitative assessment of the contributions of climate change and human activities on global grassland degradation. Environ. Earth Sci. 2014, 72, 4273–4282. [Google Scholar] [CrossRef]
- Jones, P.D.; Osborn, T.J.; Briffa, K.R. The evolution of climate over the last millennium. Science 2001, 292, 662–667. [Google Scholar] [CrossRef]
- Zarei, A.; Asadi, E.; Ebrahimi, A.; Jafari, M.; Malekian, A.; Nasrabadi, H.M.; Chemura, A.; Maskell, G. Prediction of future grassland vegetation cover fluctuation under climate change scenarios. Ecol. Indic. 2020, 119, 106858. [Google Scholar] [CrossRef]
- Friend, A.D. Terrestrial plant production and climate change. J. Exp. Bot. 2010, 61, 1293–1309. [Google Scholar] [CrossRef]
- Van Oijen, M.; Bellocchi, G.; Höglind, M. Effects of climate change on grassland biodiversity and productivity: The need for a diversity of models. Agronomy 2018, 8, 14–22. [Google Scholar] [CrossRef]
- Craine, J.M.; Nippert, J.B.; Elmore, A.J.; Skibbe, A.M.; Hutchinson, S.L.; Brunsell, N.A. Timing of climate variability and grassland productivity. Proc. Natl. Acad. Sci. USA 2012, 109, 3401–3405. [Google Scholar] [CrossRef] [PubMed]
- Parton, W.J.; Ojima, D.S.; Schimel, D.S. Environmental change in grasslands: Assessment using models. Clim. Chang. 1994, 28, 111–141. [Google Scholar] [CrossRef]
- Zhang, H.; Du, H.; Sun, S.; Wang, Y.; Wang, T.; Li, L. A symmetrical exponential model of soil temperature in temperate steppe regions of China. Open Geosci. 2023, 15, 20220523. [Google Scholar] [CrossRef]
- Shen, X.; Liu, B.; Jiang, M.; Lu, X. Marshland loss warms local land surface temperature in China. Geophys. Res. Lett. 2020, 47, e2020GL087648. [Google Scholar] [CrossRef]
- Snyder, P.K.; Delire, C.; Foley, J.A. Evaluating the influence of different vegetation biomes on the global climate. Clim. Dyn. 2004, 23, 279–302. [Google Scholar] [CrossRef]
- Nandintsetseg, B.; Boldgiv, B.; Chang, J.; Ciais, P.; Davaanyam, E.; Batbold, A.; Bat−Oyun, T.; Stenseth, N.C. Risk and vulnerability of Mongolian grasslands under climate change. Environ. Res. Lett. 2021, 16, 034035. [Google Scholar] [CrossRef]
- Heisler−White, J.L.; Knapp, A.K.; Kelly, E.F. Increasing precipitation event size increases aboveground net primary productivity in a semi−arid grassland. Oecologia 2008, 158, 129–140. [Google Scholar] [CrossRef]
- Brookshire, E.N.J.; Weaver, T. Long−term decline in grassland productivity driven by increasing dryness. Nat. Commun. 2015, 6, 7148. [Google Scholar] [CrossRef]
- Haddad, N.M.; Tilman, D.; Knops, J.M.H. Long−term oscillations in grassland productivity induced by drought. Ecol. Lett. 2002, 5, 110–120. [Google Scholar] [CrossRef]
- Zhang, H.; Fan, J.; Gao, D.; Liu, Y.L.; Du, H.S. Effect of decreasing the interception of solar illuminance by vegetation on ground temperature in degraded grasslands. Sustainability 2022, 14, 4488. [Google Scholar] [CrossRef]
- Zhang, H.; Wang, E.; Zhou, D.; Luo, Z.; Zhang, Z. Rising soil temperature in China and its potential ecological impact. Sci. Rep. 2016, 6, 35530. [Google Scholar] [CrossRef] [PubMed]
- Zhang, H.; Liu, B.; Zhou, D.; Wu, Z.; Wang, T. Asymmetric Soil Warming under Global Climate Change. Int. J. Environ. Res. Public Health 2019, 16, 1504. [Google Scholar] [CrossRef] [PubMed]
- Piao, S.; Mohammat, A.; Fang, J.; Cai, Q.; Feng, J. NDVI−based increase in growth of temperate grasslands and its responses to climate changes in China. Glob. Environ. Chang. 2006, 16, 340–348. [Google Scholar] [CrossRef]
- Parton, W.J.; Scurlock, J.M.O.; Ojima, D.S.; Schimel, D.S.; Hall, D.O.; Scopegram Group Members. Impact of climate change on grassland production and soil carbon worldwide. Glob. Chang. Biol. 1995, 1, 13–22. [Google Scholar] [CrossRef]
- Ali, I.; Cawkwell, F.; Dwyer, E.; Barrett, B.; Green, S. Satellite remote sensing of grasslands: From observation to management. J. Plant Ecol. 2016, 9, 649–671. [Google Scholar] [CrossRef]
- Kumar, D.; Shekhar, S. Statistical analysis of land surface temperature–vegetation indexes relationship through thermal remote sensing. Ecotoxicol. Environ. Saf. 2015, 121, 39–44. [Google Scholar] [CrossRef] [PubMed]
- Wiesmair, M.; Feilhauer, H.; Magiera, A.; Otte, A.; Waldhardt, R. Estimating vegetation cover from high−resolution satellite data to assess grassland degradation in the Georgian Caucasus. Mt. Res. Dev. 2016, 36, 56–65. [Google Scholar] [CrossRef]
- Zhou, W.; Yang, H.; Huang, L.; Chen, C.; Lin, X.; Hu, Z.; Li, J. Grassland degradation remote sensing monitoring and driving factors quantitative assessment in China from 1982 to 2010. Ecol. Indic. 2017, 83, 303–313. [Google Scholar] [CrossRef]
- Dong, S.K.; Tang, F.L.; Ping, X.Y.; Yang, X.C.; Yang, Z.; Lin, C.C.; Su, D.R. Zoning and functions of China’s grassland in the New Era of ecological civilization. Resour. Sci. 2022, 37, 568–581. [Google Scholar] [CrossRef]
- Shen, X.; Liu, B.; Li, G.; Zhou, D. Impact of Climate Change on Temperate and Alpine Grasslands in China during 1982–2006. Adv. Meteorol. 2015, 2015, 180614. [Google Scholar] [CrossRef]

| Degradation Level | Score | Classification Method |
|---|---|---|
| Non-degraded | 1 | Grassland vegetation cover exceeds 90% of V * |
| Mild-degraded | 2 | Grassland vegetation cover ranges from 75% to 90% of V * |
| Moderate-degraded | 3 | Grassland vegetation cover ranges from 60% to 75% of V * |
| Severe-degraded | 4 | Grassland vegetation cover ranges from 30% to 60% of V * |
| Extreme serious-degraded | 5 | Grassland vegetation cover is below 30% of V * |
| GDI | Classification of Grassland |
|---|---|
| [0, 1) | Non-degraded grassland |
| [1, 2) | Mild-degraded grassland |
| [2, 3) | Moderate-degraded grassland |
| [3, 4) | Severe-degraded grassland |
| [4, ∞) | Extreme serious-degraded grassland |
Disclaimer/Publisher’s Note: The statements, opinions and data contained in all publications are solely those of the individual author(s) and contributor(s) and not of MDPI and/or the editor(s). MDPI and/or the editor(s) disclaim responsibility for any injury to people or property resulting from any ideas, methods, instructions or products referred to in the content. |
© 2024 by the authors. Licensee MDPI, Basel, Switzerland. This article is an open access article distributed under the terms and conditions of the Creative Commons Attribution (CC BY) license (https://creativecommons.org/licenses/by/4.0/).
Share and Cite
Zhang, H.; Liao, Z.; Yao, J.; Wang, T.; Xu, J.; Yan, B.; Liu, J. Response of Reduced Grassland Degradation Index to Climate Change in China. Agronomy 2024, 14, 1554. https://doi.org/10.3390/agronomy14071554
Zhang H, Liao Z, Yao J, Wang T, Xu J, Yan B, Liu J. Response of Reduced Grassland Degradation Index to Climate Change in China. Agronomy. 2024; 14(7):1554. https://doi.org/10.3390/agronomy14071554
Chicago/Turabian StyleZhang, Hui, Zihan Liao, Jinting Yao, Tianying Wang, Jinghan Xu, Boxiong Yan, and Jiping Liu. 2024. "Response of Reduced Grassland Degradation Index to Climate Change in China" Agronomy 14, no. 7: 1554. https://doi.org/10.3390/agronomy14071554
APA StyleZhang, H., Liao, Z., Yao, J., Wang, T., Xu, J., Yan, B., & Liu, J. (2024). Response of Reduced Grassland Degradation Index to Climate Change in China. Agronomy, 14(7), 1554. https://doi.org/10.3390/agronomy14071554