Article

SAW-YOLO: A Multi-Scale YOLO for Small Target Citrus Pests Detection

1
College of Information Engineering, Sichuan Agricultural University, Ya’an 625014, China
2
Sichuan Key Laboratory of Agricultural Information Engineering, Ya’an 625000, China
3
Ocean College, Hebei Agricultural University, Qinhuangdao 066000, China
4
National Forestry and Grassland Administration Key Laboratory of Forest Resource Conservation and Ecological Safety on the Upper Reaches of the Yangtze River, Rainy Area of West China Plantation Ecosystem Permanent Scientific Research Base, college of Forestry, Sichuan Agricultural University, Chengdu 611130, China
*
Authors to whom correspondence should be addressed.
These authors contributed equally to this work.
Agronomy 2024, 14(7), 1571; https://doi.org/10.3390/agronomy14071571
Submission received: 18 June 2024 / Revised: 15 July 2024 / Accepted: 16 July 2024 / Published: 19 July 2024
(This article belongs to the Special Issue AI, Sensors and Robotics for Smart Agriculture—2nd Edition)

Abstract

:
Citrus pests pose a major threat to both citrus yield and fruit quality. The early prevention of pests is essential for sustainable citrus cultivation, cost savings, and the reduction of environmental pollution. Despite the increasing application of deep learning techniques in agriculture, the performance of existing models for small target detection of citrus pests is limited, mainly in terms of information bottlenecks that occur during the transfer of information. This hinders its effectiveness in fully automating the detection of citrus pests. In this study, a new approach was introduced to overcome these limitations. Firstly, a comprehensive large-scale dataset named IP-CitrusPests13 was developed, encompassing 13 distinct citrus pest categories. This dataset was amalgamated from IP102 and web crawlers, serving as a fundamental resource for precision-oriented pest detection tasks in citrus farming. Web crawlers can supplement information on various forms of pests and changes in pest size. Using this comprehensive dataset, we employed the SPD Module in the backbone network to preserve fine-grained information and prevent the model from losing important information as the depth increased. In addition, we introduced the AFFD Head detection module into the YOLOv8 architecture, which has two important functions that effectively integrate shallow and deep information to improve the learning ability of the model. Optimizing the bounding box loss function to WIoU v3 (Wise-IoU v3), which focuses on medium-quality anchor frames, sped up the convergence of the network. Experimental evaluation on a test set showed that the proposed SAW-YOLO (SPD Module, AFFD, WIoU v3) model achieved an average accuracy of 90.3%, which is 3.3% higher than the benchmark YOLOv8n model. Without any significant enlargement in the model size, state-of-the-art (SOTA) performance can be achieved in small target detection. To validate the robustness of the model against pests of various sizes, the SAW-YOLO model showed improved detection performance on all three scales of pests, significantly reducing the rate of missed detections. Our experimental results show that the SAW-YOLO model performs well in the detection of multiple pest classes in citrus orchards, helping to advance smart planting practices in the citrus industry.

1. Introduction

As the cornerstone of global food security, agriculture is intrinsically linked to human survival and economic prosperity [1]. In China, a renowned agricultural powerhouse, the vitality of agriculture is closely linked to people’s livelihoods. However, agricultural productivity has long been threatened by a number of factors, of which pests are the most worrisome [2]. Citrus is one of the most important fruit commodities in the world and is grown commercially in more than 137 countries with a production of more than 140 million tonnes [3]. However, citrus faces widespread challenges from pests that pose a significant obstacle to optimal citrus production and economic viability [4]. Major pests of citrus include the citrus looper, citrus whitefly, citrus fruit fly, red wax scale, and brown shield sheller, which cause deleterious effects on citrus cultivation such as leading to decreased yields and reduced fruit quality. For example, the harmful effects of red wax scales and brown shield shellers manifest themselves as parasitism on citrus leaves, leading to discoloration, drying out of the leaves, and possibly even death of the plant. Therefore, real-time, accurate, and automated pest detection and prediction mechanisms are particularly important during citrus cultivation. Traditional pest monitoring methods, which rely on manual identification by entomologists or technicians, have proved to be subjective, labor-intensive, and not applicable on a large scale [5]. To address these shortcomings and reduce the high costs for fruit farmers, the development of simplified and effective pest detection technologies is imperative. With the popularity of camera-equipped and Internet-enabled machine vision systems, computer vision technology provides a new avenue for automated monitoring of modern crop pests and diseases, greatly improving the monitoring efficiency [6]. Notably, the emergence of deep learning has made significant breakthroughs in this field, with better results than traditional methods [7]. In light of this, the integration of advanced deep learning methods is a key strategy to strengthen the citrus industry against various pests while increasing citrus yields. To address the above issues, our contributions are as follows: (1) We constructed a citrus pest dataset, IP-CitrusPests13, for citrus pest small target detection training. (2) We proposed an SPD Module and AFFD detection header with innovative WIOU loss function. (3) The model has SOTA performance in multi-category detection, multi-scale detection, while keeping the number of parameters low.
Subsequent sections of this paper delineate the relevant literature (Section 2), describe the dataset creation and modeling methodology (Section 2), elucidate the machine learning experiments conducted (Section 2) and, finally, draw comprehensive conclusions (Section 3).

2. Materials and Methods

In recent years, deep learning methods have gained significant momentum in the field of agricultural technology, particularly in the area of pest detection. This technological change has revolutionized traditional agricultural practices, resulting in significant cost savings, increased detection efficiency, and improved profitability. In the field of pest identification, popular deep learning architectures include deep autoencoders (DAE), convolutional neural networks (CNN), etc. Subsequent advances in deep learning-based object detection algorithms can be categorized as follows: 1. Derived from CNN architectures, there are region proposal-based approaches such as fast R-CNN [8], faster R-CNN [9], masked R-CNN [10]; regression-based approaches such as YOLO [11,12,13] and SSD [14]. 2. Transformer-based object detection algorithms utilize a query mechanism to process and predict the location and category information, such as DETR [15], Swin Transformer [16], and ViDT [17]. The Transformer architecture has demonstrated exceptional deep learning capabilities, consistently outperforming CNNs in a variety of downstream tasks [18]. However, its complex architecture and the need for high-quality datasets pose significant challenges for its practical application. In the context of agricultural object detection, YOLO is more promising to strike a balance between accuracy and lightweight implementation. Notably, ref. [19] facilitated target detection and occlusion level discrimination in strawberries using YOLOv7, enabling fast and accurate detection under complex environmental conditions. In addition, ref. [20] introduced patches by enhancing the YOLO framework by increasing the focus on small samples, resulting in a very satisfactory classification model for bedbugs. Furthermore, ref. [21] introduced an innovative and efficient fully-connected bottleneck transformer module, which significantly improved the performance at a relatively low computational cost. Great strides have also been made in automated detection methods for citrus pests. For instance, ref. [22] employed AR-GAN to automatically scale citrus pests and implemented transfer learning on augmented data (e.g., ResNet50, VGG16 and MobileNetV2), all of which yielded commendable results. Additionally, ref. [23] designed a two-stage end-to-end classification and detection model to handle disease detection tasks of three common citrus diseases with an accuracy of up to 86.2%. Also, ref. [24] used an improved R-CNN for detecting small citrus targets with a mAP score improvement of 21% compared to other models. However, existing public datasets on citrus pests focus mainly on specific classes and sizes. This neglect hampers the model’s performance in coping with pest size variations, which is particularly evident in the detection of small target objects. In addition, the intricate biodiversity and morphological similarities among pests pose significant challenges for accurate detection. For example, it is still difficult to distinguish closely related species (e.g., cotton-striped nightshade moths and sea grey-winged nightshade moths) by limited phenotypic features alone. Detection of pests on plant surfaces is also a formidable challenge due to their small size and camouflage.
In small target detection, ref. [25] innovatively proposed a novel convolutional approach for low-resolution images and small objects, demonstrating excellent results.
Attention mechanisms were shown to be effective in image feature focusing and ref. [21] used a variant of self-attention in order to address the inefficiency of detection of rice pests. Interestingly, ref. [26] used a modified YOLOv4-Tiny and denoising autoencoder (DAE) to obtain end-to-end segmentation masks for cracked objects. The Convolutional Block Attention Module (CBAM) was added to the input and fusion stages of the FPN to create an Attention Feature Pyramid Network (AFPN) to compensate for the accuracy loss of YOLOv4-Tiny. The above attention mechanisms are computationally expensive and have high memory footprint or ineffective attention; ref. [27] creatively proposed Bi-level Routing Attention, which used sparsity to improve the attention mechanism with more flexible and content-aware computational allocation. Structure reparameterization can maximize the parameter utilization of the model; ref. [28] introduced a multi-branch structure with different sensing fields and different levels of complexity, which can significantly improve the accuracy of the original model, and can increase the point without loss under the premise that the model structure, computation, and inference time are all unchanged.
To address these challenges, this study is dedicated to achieving a small target detection of citrus pests. We propose a novel target detection algorithm, SAW-YOLO, based on YOLOv8 [29]. Our contributions include the construction of the IP-CitrusPests13 dataset, which consists of 13 classes and 7844 labeled samples derived from IP102 [30] and web crawling techniques. In addition, we introduce the SAW-YOLOv8 variant model, which is adept at capturing comprehensive semantic information, achieves multi-level feature extraction, and deep information integration, and efficiently handles low-resolution objects through the careful optimization of the network Backbone, Head, and training strategies. The experimental results show that our proposed SAW-YOLO model performs well in detecting small-target objects of complex categories, while being able to balance the performance of medium and large targets thus facilitating the advancement of citrus pest management and reducing yield loss, while laying a solid foundation for future research on citrus pest detection models.

2.1. Data Collection and Preprocessing
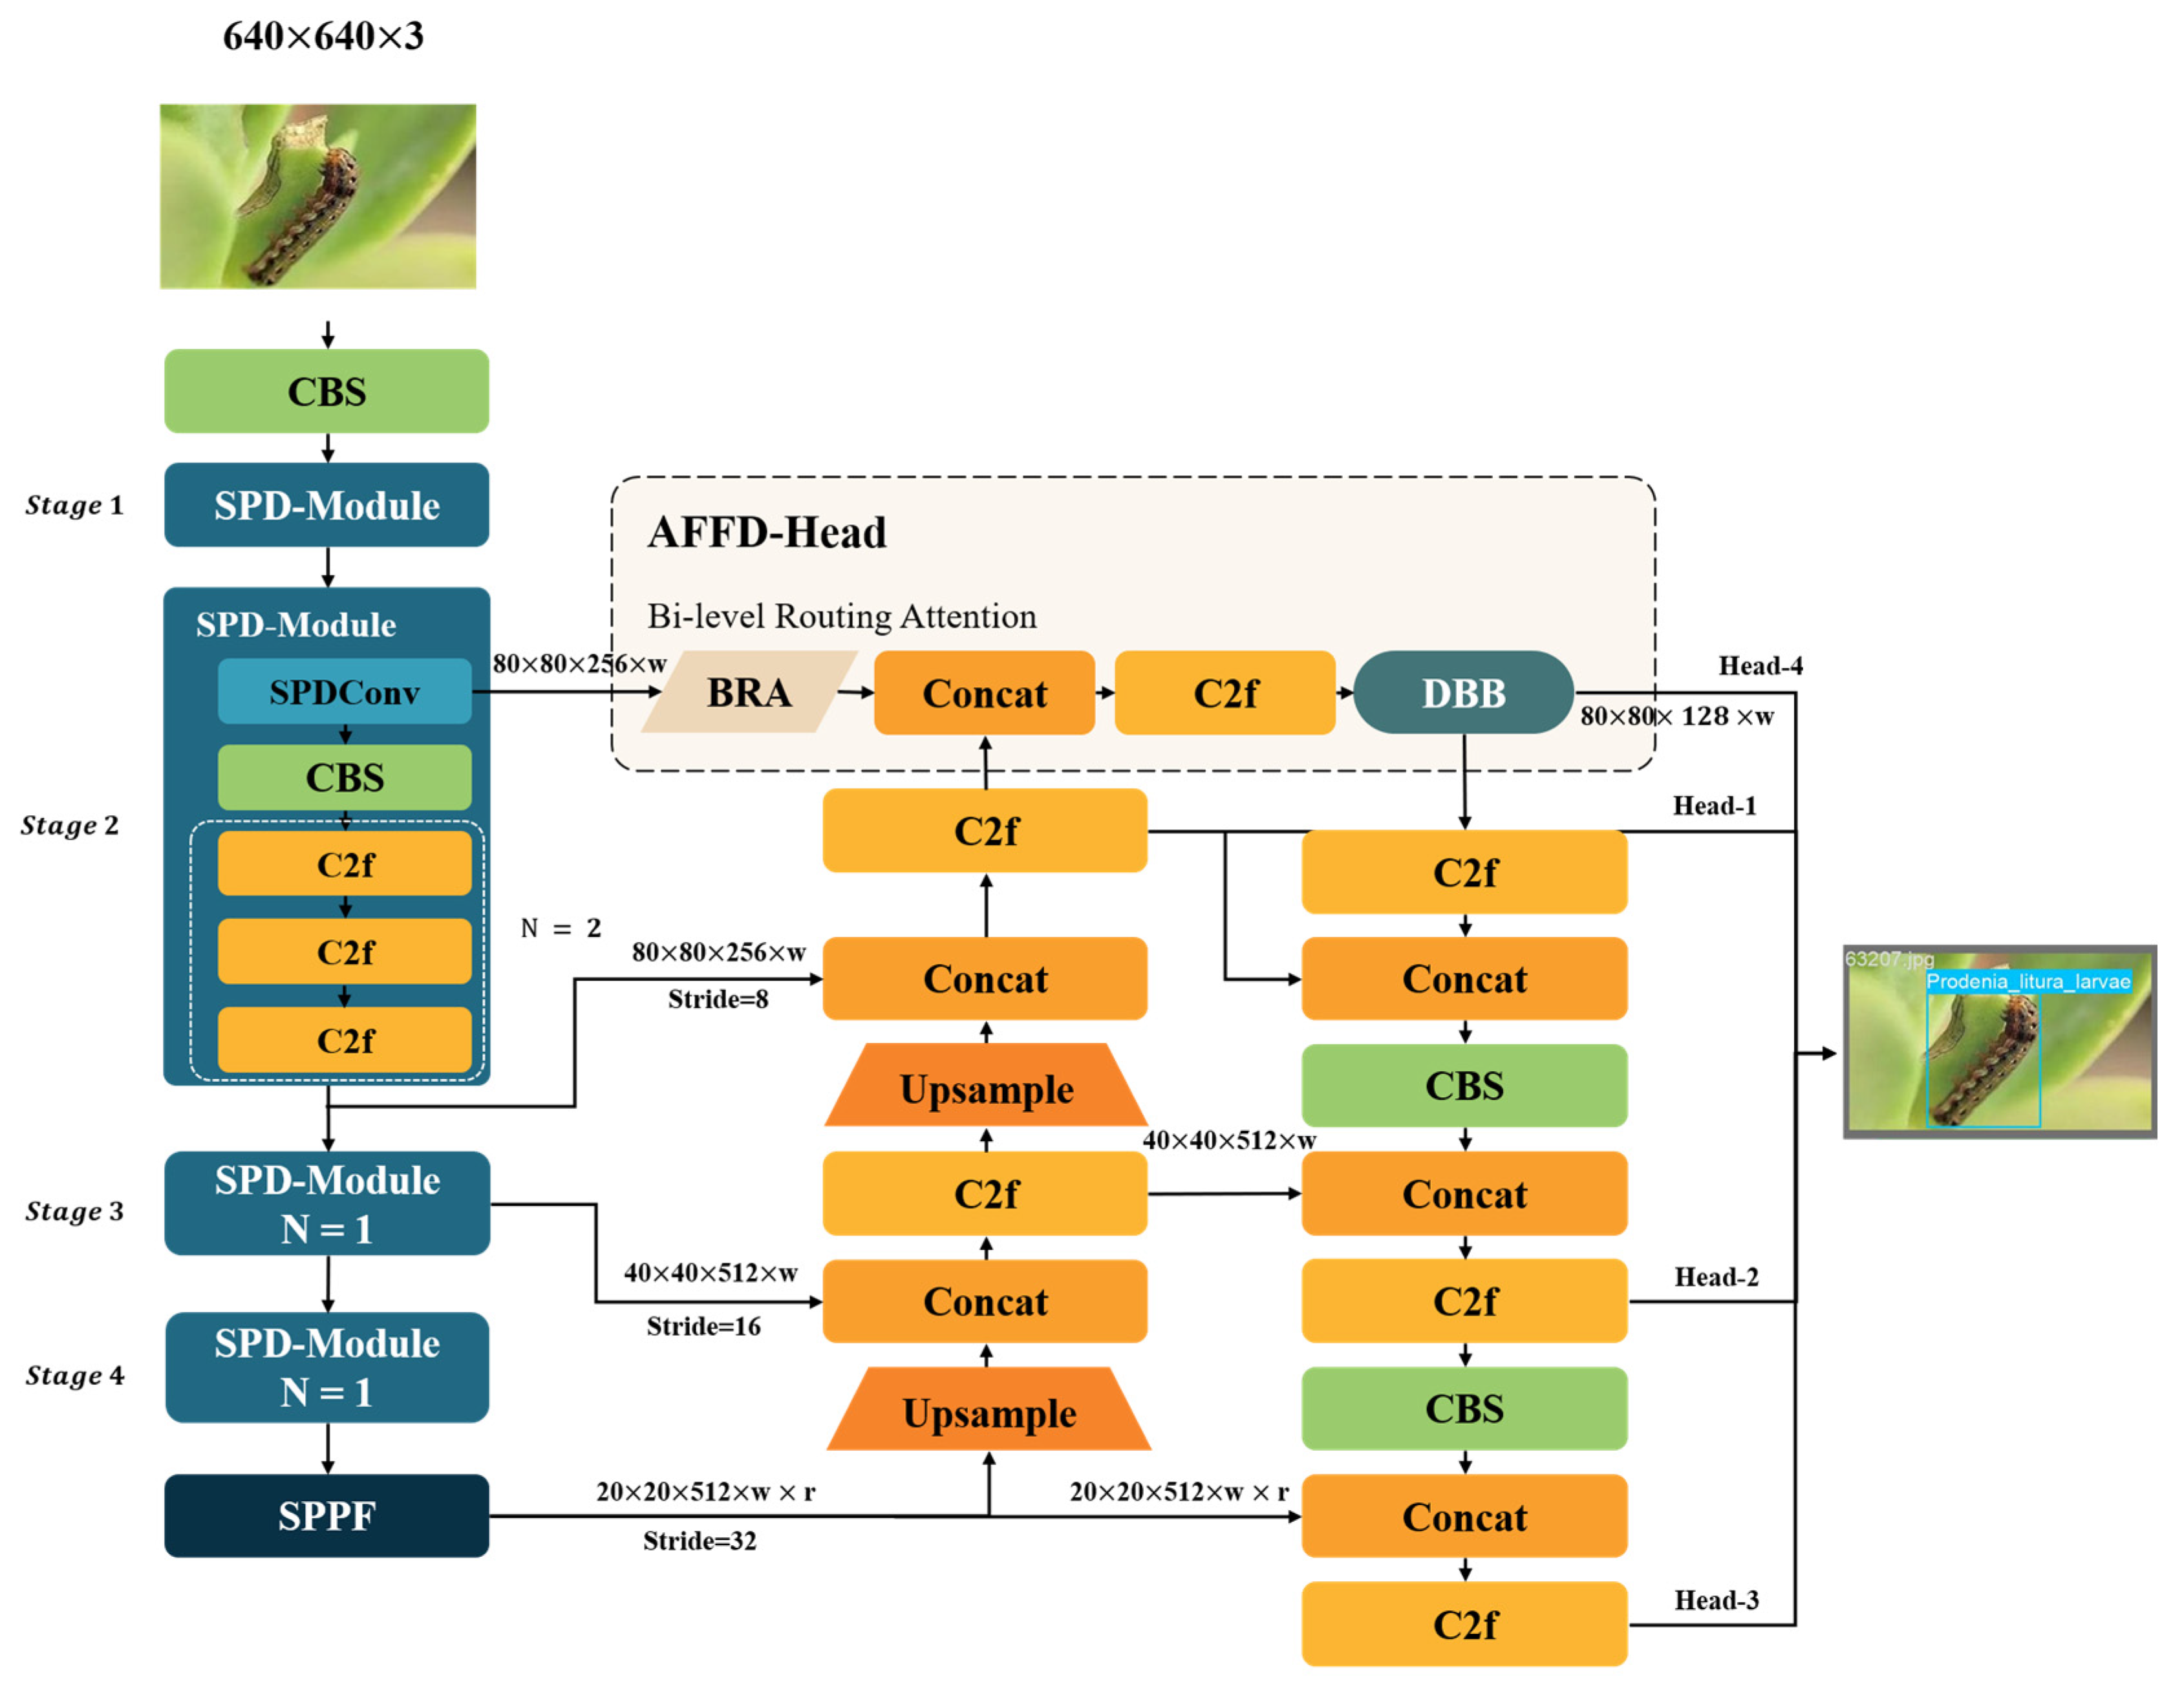
Citrus pest detection often presents more uncertainty in application scenarios. This is mainly reflected in the fact that there are more than 20 citrus pest categories, while most existing detection data and studies are on a single type of adult Lepidoptera pests under flytrap light. In order to solve the above problems, this study proposes a new method to address the challenge of detecting 13 major pests common to citrus plants, including larvae and adults of Lepidoptera types, Homoptera aphids, and ticks and mites, etc., and to meet the demand of detecting pests with different morphologies and different growth cycles in agriculture. Based on the IP102 large dataset, we constructed the IP-CitrusPests13 dataset using a large web crawler, which is a key element of our study. Under the careful supervision of domain experts, we rigorously annotated this dataset, setting a new standard for our experimental enquiry. We used python to build a crawler script that screens and downloads publicly licensed citrus pest images locally. During the data annotation phase, we used the native YOLO format to annotate the data set based on the category information provided by IP102. In addition, we divided the dataset into training, validation, and test sets in the ratio of 7:2:1. In addition to the above division of pest categories, in order to evaluate the model’s ability to detect small targets, we divided all pests into three categories based on the size of the pixels occupied by the photographed pests, as shown in Table 1. As shown in Figure 1, we used the COCO assessment metrics [31] and assigned each pest sample to a size-based tier—small, medium, or large—based on its pixel area footprint. According to COCO indicators, Small is the small goal, representing area < 32 2 , medium is the medium goal, representing 32 2 < a r e a < 96 2 , large is the large goal, and area > 96 2 .

2.2. Model Design

2.2.1. The Structure of the YOLOv8 Model

YOLOv8 [29] is a cutting-edge algorithm in the deep learning paradigm, known for its fast processing speed, high accuracy, and streamlined parameters tailored for object detection tasks. The iterated YOLO architecture consists of the following three main parts: Backbone, Neck, and Head. In YOLOv8, the Backbone module has been significantly improved by borrowing advanced design principles from the ELAN framework of YOLOv7 [32] and thus replacing the C3 structure of YOLOv5 [33] with a gradient-flow-enhanced C2f architecture. YOLOv8 has made a slight modification to the number of channels for models of different sizes. A minor adjustment was made. By keeping the width and height dimensions of the input feature layers consistent, YOLOv8 enhances inter-layer interactions through scaling, random combining, and connectivity operations to continuously improve the learnability of the network. The injection of the C2f architecture brings about a proliferation of hopping connections and introduces a new splitting operation, which ultimately significantly improves model efficiency. Meanwhile, the Head module has been redesigned with a mainstream decoupled architecture that separates the classification and detection functions distinctly. Unlike its anchor-based predecessor, YOLOv8 employs an anchorless mode, thereby simplifying the detection process. YOLOv8 draws on the experience of the last 10 epochs of YOLOX [34] and strategically omits mosaic data augmentation during the model training process, which improves the accuracy of the model. As a result, YOLOv8 demonstrated superior performance benchmarks, affirming its position as the premier algorithmic solution for pest detection in citrus growing environments.

2.2.2. The Method of Improved YOLOv8n Model
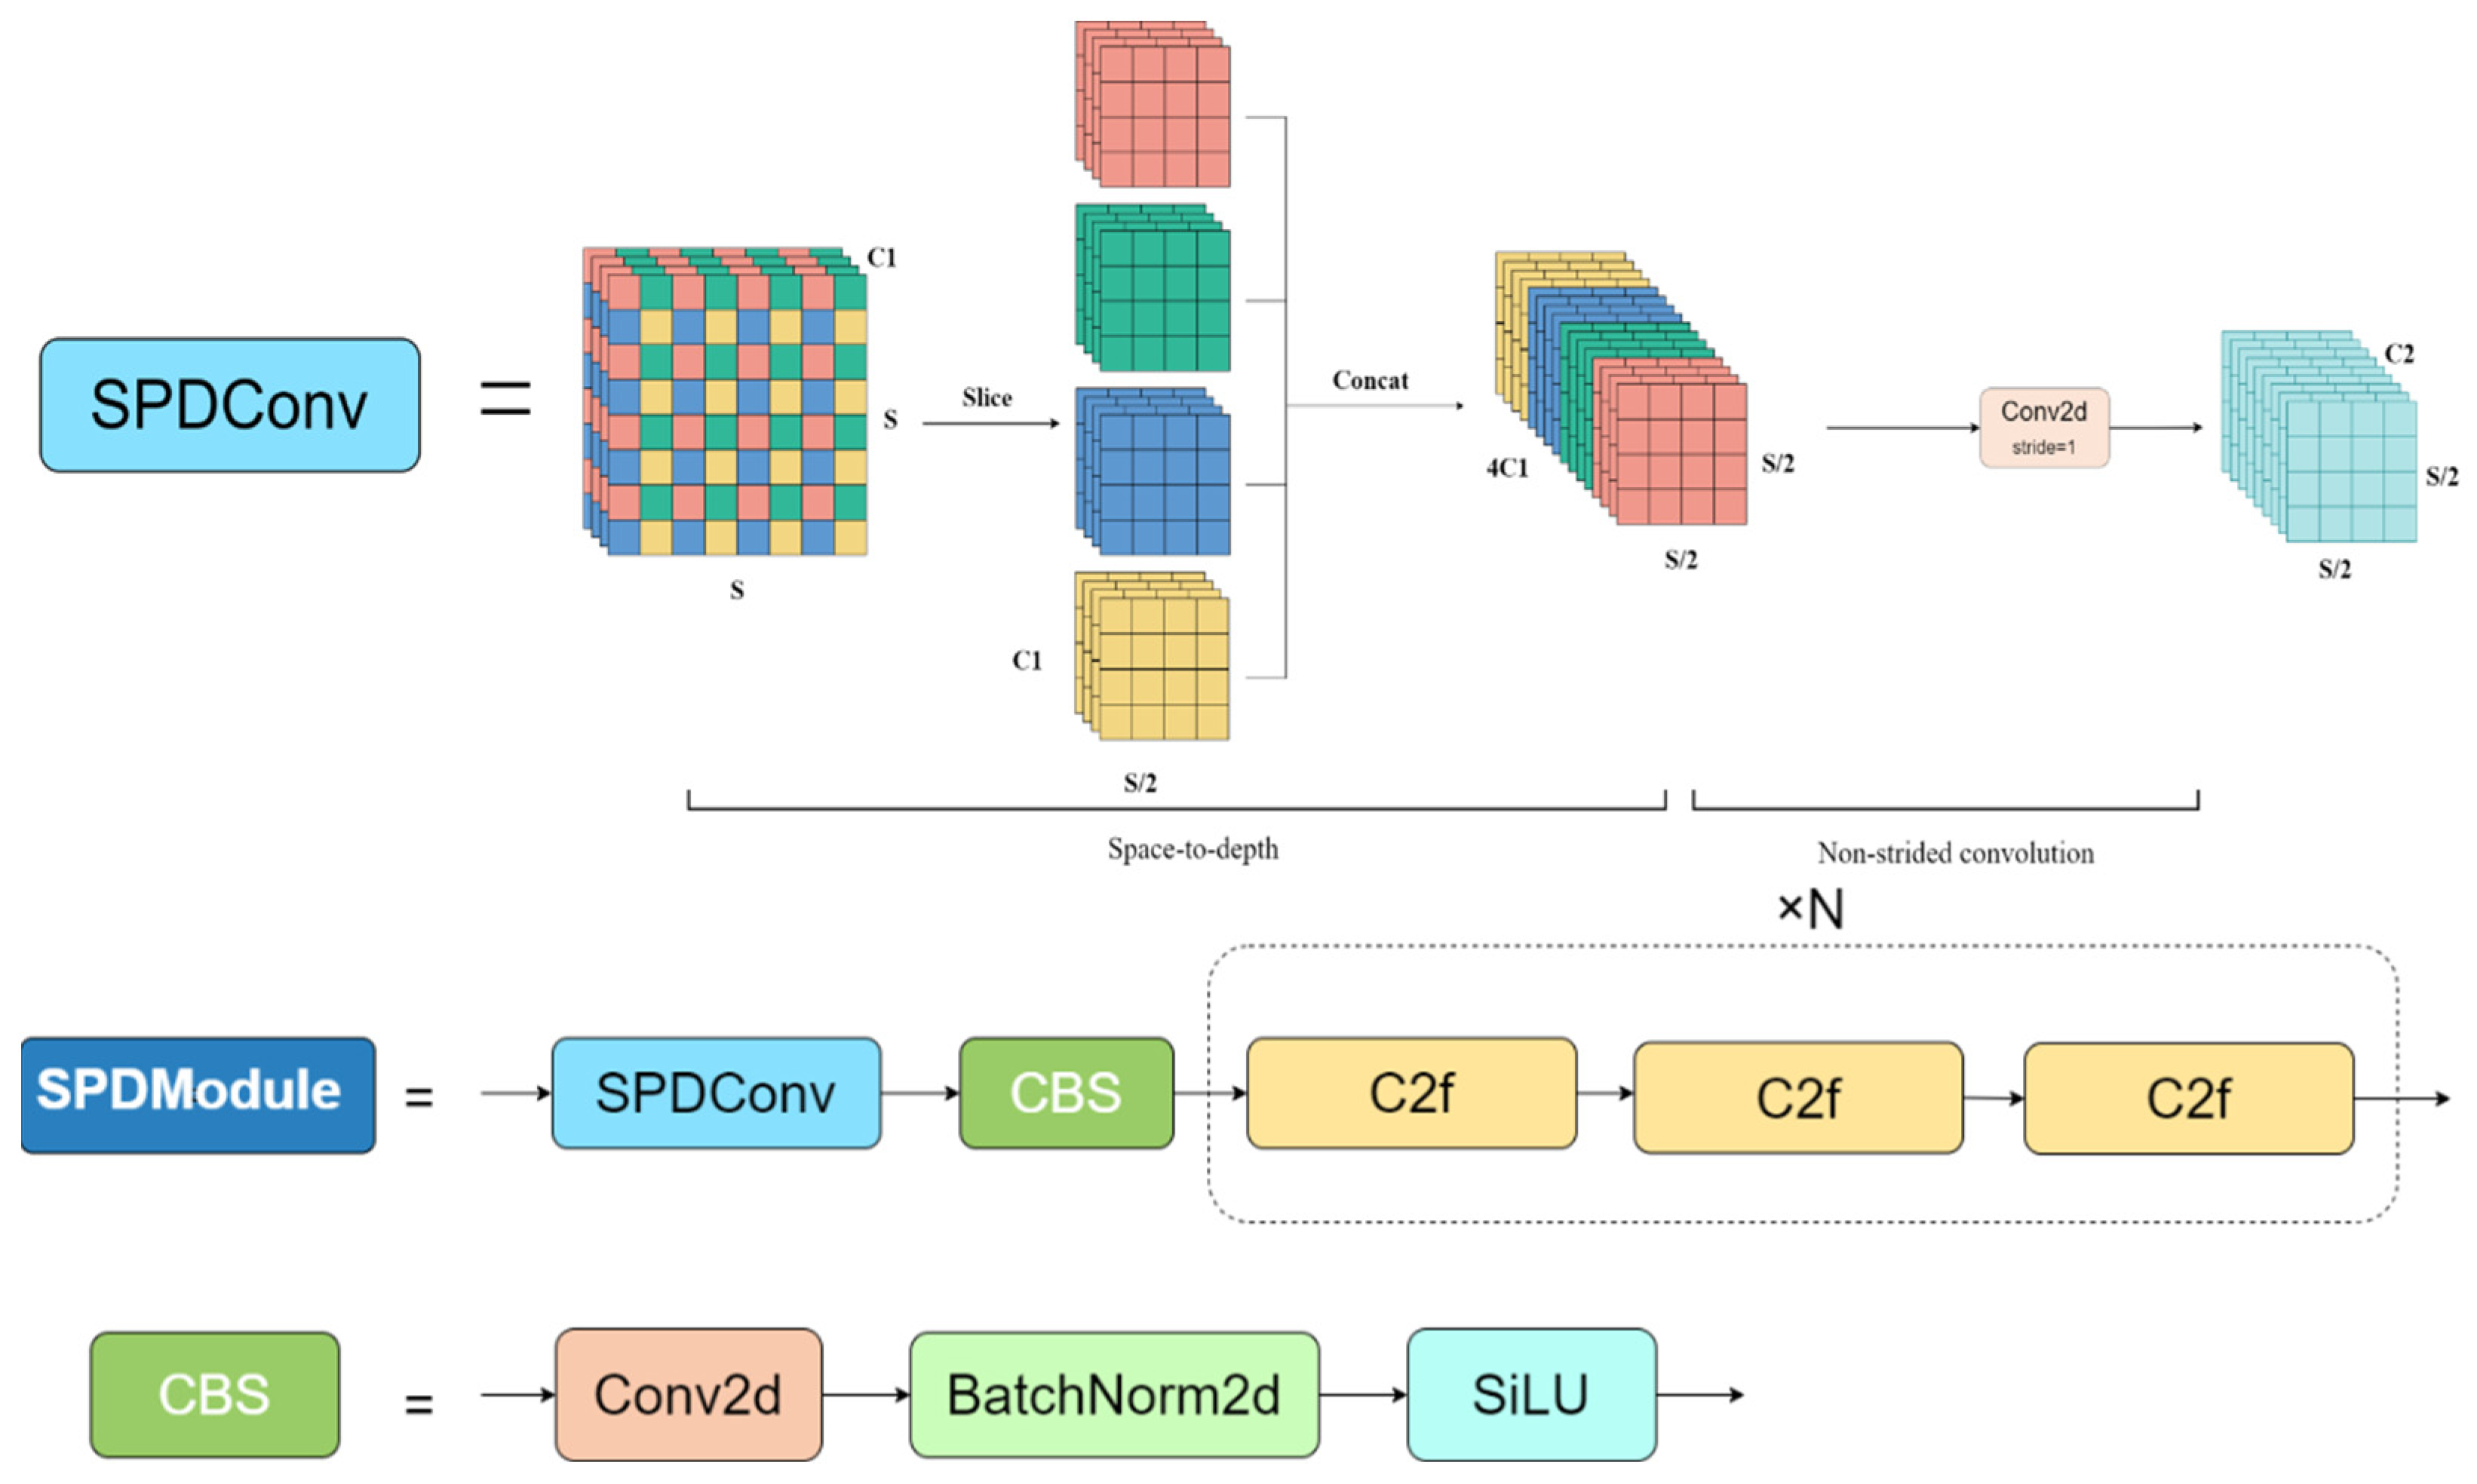
In this study, we made advanced modifications to YOLOv8, culminating in the SAW-YOLO architecture shown in Figure 2, which improved the accuracy as well as lightweighting of the algorithm for small-target pest detection. The architectural foundation of the backbone network integrates quadruple space-to-depth (SPD) modules that are based on SPD-Conv [25], so we proposed the SPD Module, a plug-and-play minimalist deep extraction module. It is capable of extracting multi-scale features of pests, preventing large information loss during feature extraction for small-target pests, and its conversion of spatial data into deep information representation minimized information loss. The Attentional Feature Fusion Distribution (AFFD) head fuses the previously extracted multilevel features, and its two inputs and two outputs make it different from the common structures. Thus, we designed an innovative AFFD structure with two innovative functions as follows: 1. To provide an auxiliary detection role, as well as capable of fusing the shallow and deep information and tracing it back to the deep structure. 2. To act as a detection head, focusing on the detection of small targets. The combination of the two functions in one structure maximizes the use of parametric rates and information. Finally, the bounding box regression loss function is carefully improved using Wise-IoUv3 [35] to mitigate the detrimental effects of poor-quality detection frames to improve the discriminative accuracy of the model and speed up convergence.
  • SPD Module
In specialized use cases such as pest detection, redundant data may be reduced after convolutional down-sampling, especially when dealing with microscopic or small-scale pests. As the number of layers increases, this often leads to the loss of a large amount of critical information, called the “information bottleneck” [36]. This is manifested by information provided to the objective function (Equation (1)) to compute varying degrees of loss [37], and misinformation being provided to the model for unreasonable reference. The information bottleneck will change the bounding box IOU predicted by the model, and for a single pest detection, will incorrectly predict the targets within the bounding box, causing both FN and FP in Equations (9) and (10) to increase, and decreasing the performance of Equations (11) and (12).
In order to address the above issues, we designed the SPDModule structure. In the process of down-sampling, by transforming the image spatial information into channel information, this idea does not lead to information loss compared to the general down-sampling methods.
This structure combines SPD-Conv and the lightweight C2f module in YOLOv8n. Since SPD-Conv increases the computational effort and, after experiments in the YOLOv8n backbone, when the SPDModule is increased to the 5th, the model accuracy no longer improves significantly but brings about a larger computational effort, we used 4 such structures to find a compromise between the accuracy and the number of parameters. Meanwhile, a single SPD Module with shallow layers and simple structure was immediately followed by the next SPD Module after it had extracted the key information. We use a compact module approach to combine the simple serial structures, and this multi-scale structure will provide help for subsequent feature fusion, while ensuring that it will not fall into the problem of information bottleneck again during the C2f downscaling process. Our approach employed the SPD convolution (space-to-depth) technique to meticulously capture the nuances of individual pest details in shallower layers, as shown in Figure 3. This technique ensured that the relevant information was retained throughout the down-sampling phase. We started with a feature map of size S × S × C 1 and used a space–depth strategy to segment the tensor of the four neighboring channels on the feature map. By connecting these tensors counterclockwise, the number of channels is effectively quadrupled while the spatial size is simultaneously halved. After the space-to-depth operation, the feature map is subjected to a span-free convolution with a span length of 1. The final output tensor size is S / 2 × S / 2 × C 2 thus refining the granularity of the feature representation.
2.
Attention Feature Fusion Distribution Head, AFFD-Head
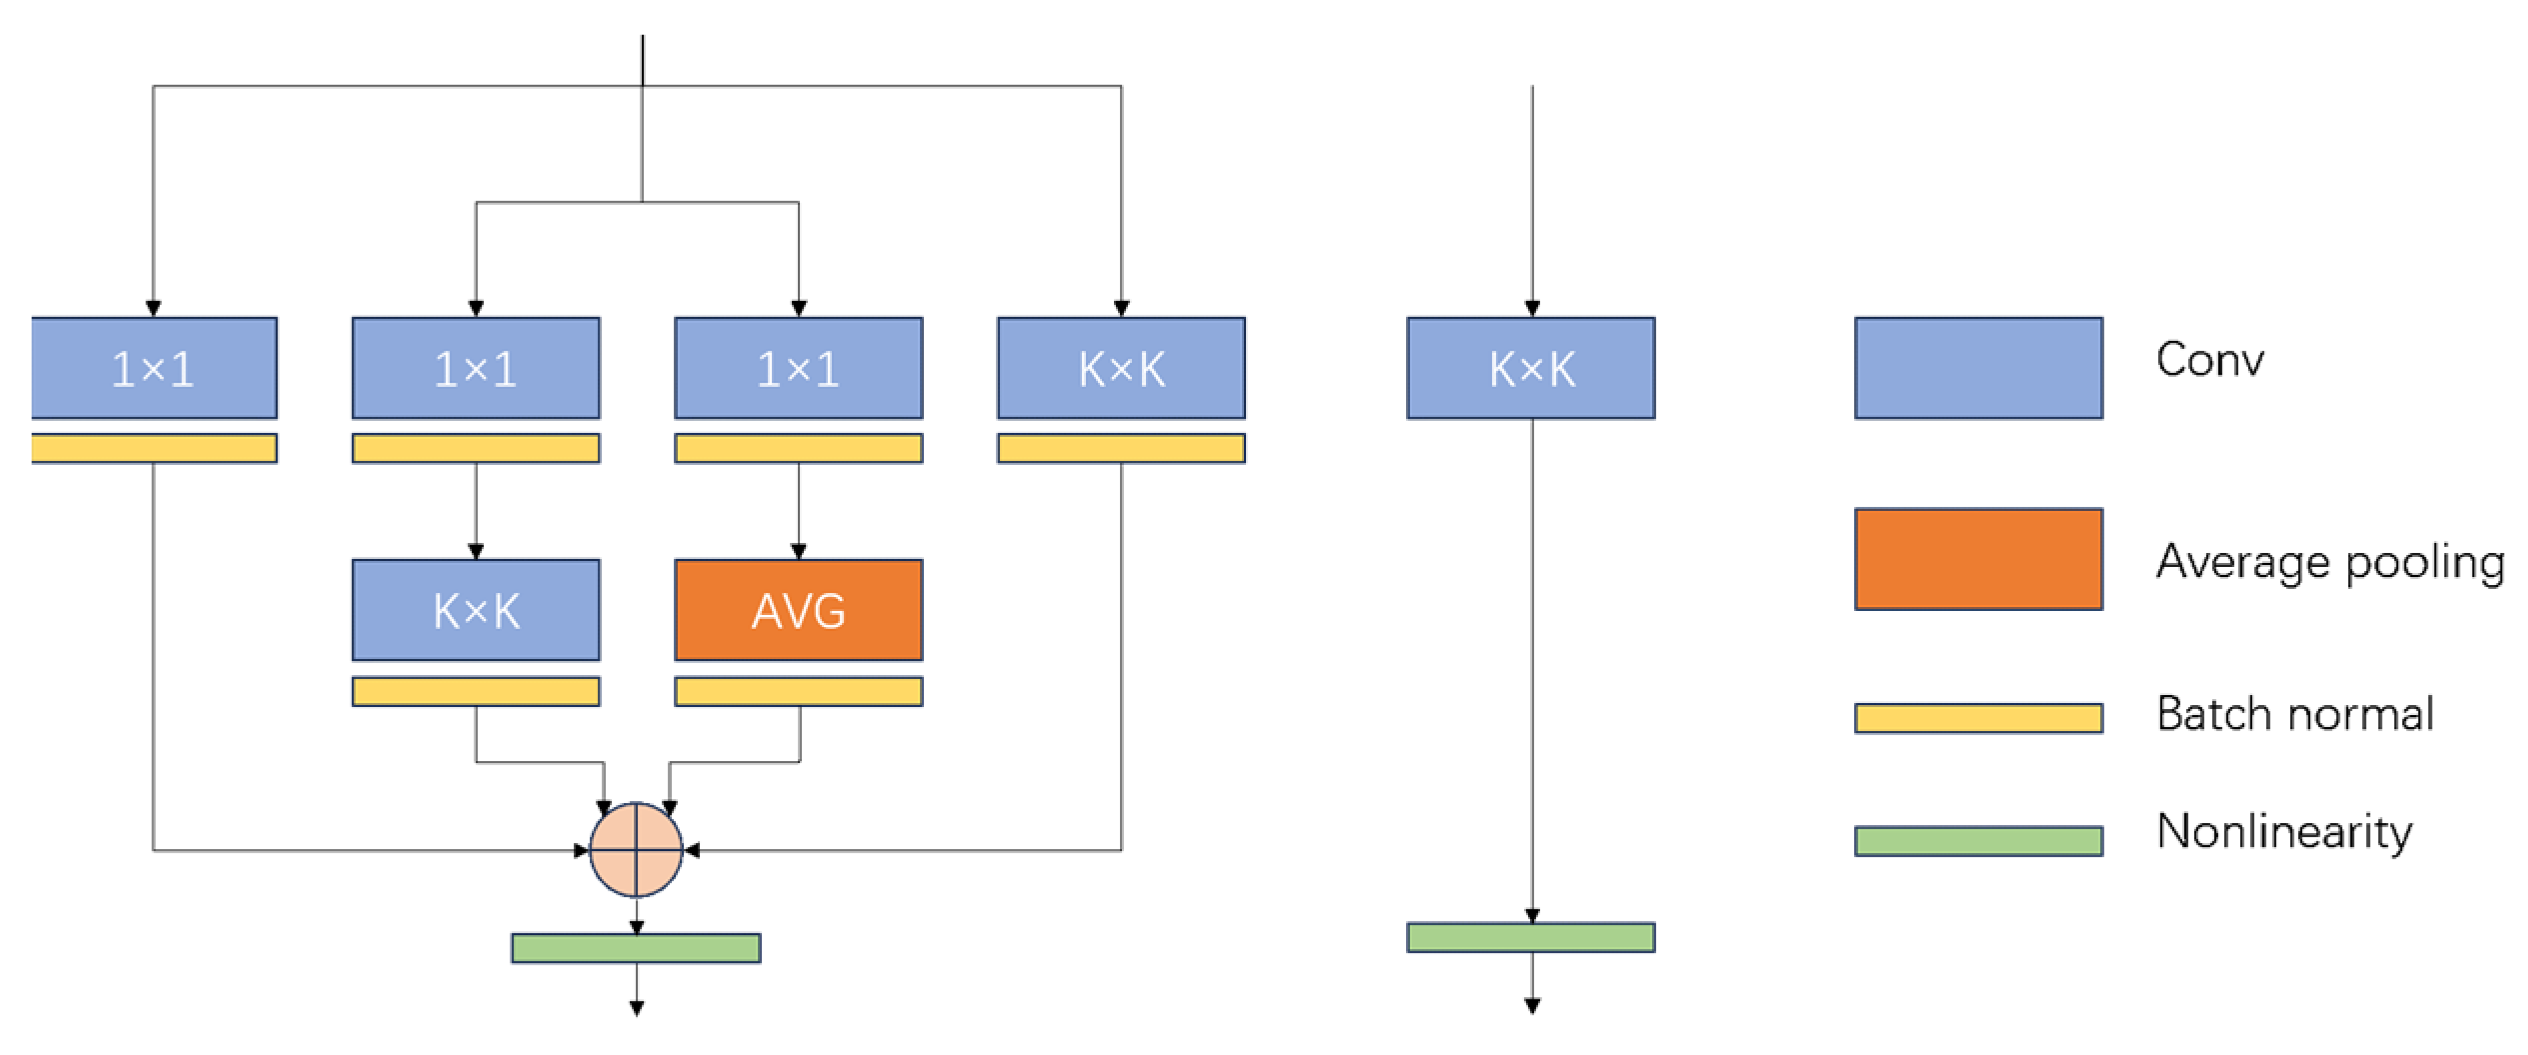
Inspired by Gold-YOLO [38], we proposed a novel pest identification method, which required two inputs to generate two outputs at the same time and was capable of extracting information from the pyramid in the form of extracting information in Gold-YOLO, aggregating the information and focusing on and distributing the important information, which is a process that greatly enhances the feature fusion capability of the model. At the same time, based on this, we use it in the Neck part of the model to be able to focus on detecting small target objects. These dual-input and dual-output forms realizes two functions in one structure. After the experiments, the output of the SPD Module in the second stage provides the best information, which retains the initial small target information. To ensure that the shallow and deep information could be fused with each other, we used the Bi-Level Routing Attention (BRA) mechanism [27]. The structure pays attention to the focused information in the small target before performing feature fusion in the deep and shallow layers. As shown in Figure 4, BRA is based on query-based operations and is adept at discovering broad contextual relevance, which is crucial for pest classification. The BRA enables the coupling of small target information and deeper information in the features, rather than mere superposition.
In the AFFD head architectures, the final output module bears a dual key objective as follows: Firstly, it must integrate the antecedent features and share them with the depth detection branch; secondly, it is responsible for providing salient information to the detection head. This information is then processed to generate spatial coordinates and classification data relevant to the detection task. As shown in Figure 5, our proposed approach employs the Diverse Branch Block (DBB) [28] configuration in the output segment of the AFFD header. Addressing the first requirement, the DBB architecture features a heavily parameterized design that optimizes learning in the training phase of the model through a multi-branch structure. This framework not only embodies an innovative information integration strategy that improves the robustness of multi-pest identification. For the second requirement, parameter transformations integrate the multi-branch model into a single structural entity throughout the testing phase. This synthesized information was then passed to the detection head. Although it is ultimately reduced to a single K     K convolution, which appears to be structurally like a direct application of the K     K convolution. This structure retains the superior fitting ability inherent in multi-branch structures. It enhances the model’s ability to learn nonlinear features without incurring additional computational costs in the inference process thus reducing the processing load on the detection head.
In this study, we describe the multi-scale feature fusion extraction mechanism used in the novel YOLOv8 architecture that increases the model’s ability to detect small target objects. Specifically, the YOLOv8 header pyramid architecture utilizes features extracted from the backbone network and injects these features into the AFFD. This integration is further enhanced by linking them with deeply improved features. After fusion, the enriched features are propagated into the down-sampling frame. This approach ensures that the extracted features are fully propagated across various detection heads, which, in turn, substantially enhances the semantic description of pests at multiple scales. This advancement helps to enrich the semantic information of pests at different scales and enhances the robustness and accuracy of pest detection under different scale variations.
3.
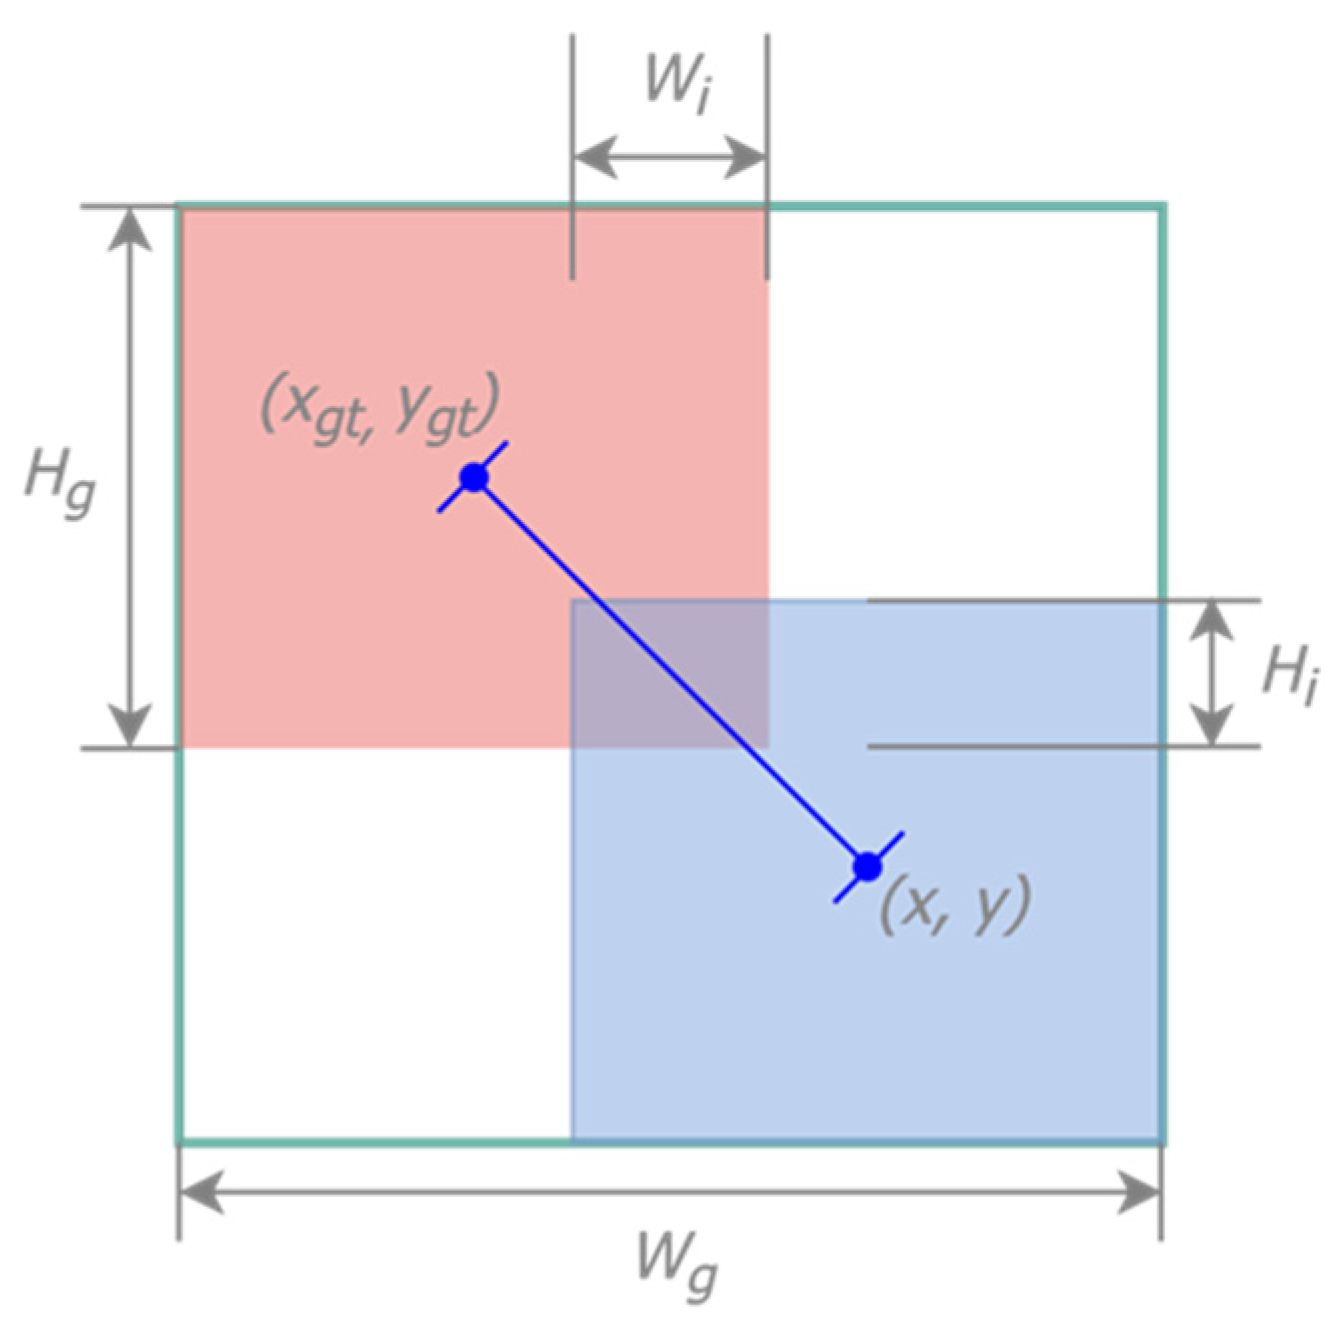
Loss Function: Wise-IOUv3
The loss function of YOLOv8 consists of classification loss, localization loss, and object loss.
L o s s = λ o b j   O b j L o s s + λ c l s   C l s   L o s s + λ l o c   L o c   L o s s
The parameters λ o b j , λ c l s , and λ l o c are used to balance the various loss terms and are adjusted according to the specific problem at hand. Bounding box regression (BBR) is a critical factor that directly affects the model’s localization performance.
The original YOLOv8 utilizes the Complete-IoU Loss (CIOU Loss) for bounding box regression. This loss function factors in the intersection area by considering the central point distance and aspect ratio differences between the predicted anchor boxes and the ground truth target boxes. As shown in Figure 6, red represents the ground truth target box, and blue represents the anchor boxes predicted by the model. Upon evaluation with our experimental dataset, it became evident that the training subset inevitably comprised a proportion of low-quality instances. This presence has a detrimental effect, as the CIoU Loss disproportionately penalizes these instances, which, in turn, impairs the model’s ability to generalize. Consequently, this observation prompted an investigation into the potential recalibration of the loss function to mitigate this issue and enhance overall model robustness.
  L C I O U = 1 IOU + ρ 2 p , p gt c 2 + α V
V = 4 π 2 a r c t a n w g t h g t a r c t a n w h 2
α = V 1 I O U + V
As shown in (2), p and p g t represent the centroids of the anchor box and the detection box, respectively, and ρ = p p g t 2 denotes the Euclidean geometric distance. c is the length of the diagonal of the minimum enclosing box covering the anchor box and the detection box. V   and α represent the consistencies of the aspect ratios of the two target boxes, while   w g t and h g t represent the width and height of the target box, and w and h represent the width and height of the anchor box. During the experimental phase, we inevitably encounter certain suboptimal or even erroneous anchor boxes. This necessitated adjustment in the model’s loss function to prioritize medium-quality instances more heavily, simultaneously diminishing the emphasis on superior-quality anchor boxes and mitigating the detrimental impact of their inferior counterparts. In particular, the existing dataset comprises a substantial volume of diminutive target entities, with a pronounced prevalence in categories such as Chrysomphalus aonidum and Panonchus citri McGregor. The small scale of these targets presents a significant challenge in feature extraction, exacerbated by the presence of low-quality anchor boxes, which, in turn, has a non-negligible effect on the degradation of detection efficacy. The conventional CIoU loss function, as implemented in YOLOv8, does not adequately measure the differences between bounding boxes and their respective anchors, leading to suboptimal convergence rates and less precise localization within the ambit of the AFFD model’s optimization process. In response, SAW-YOLO integrated Wise-IoU v3 [35] instead of CIoU. The revised loss function is delineated by the following equations:
  L W I o U v 3 = r R W I o U L I o U , r = β δ α β δ
R W I o U = e x p x x g t 2 + y y g t 2 W g 2 + H g 2
L I o U = 1 I o U
β = L I o U L I o U ¯ 0 , +
In the proposed model, the R W I o U metric is preferentially employed to quantify the distance between the anchor box and the center of the target box. R W I o U rigorously evaluates the spatial proximity of the anchor and target boxes by emphasizing their central alignment. WIoU v3 incorporates a dynamic non-monotonic attention mechanism which utilizes a concept designated as “outlierness” to supplant the traditional Intersection over Union (IoU) metric in assessing the efficacy of anchor boxes. This innovative framework facilitates an astute allocation strategy for gradient gains. The dynamic nature of the Liou metric ensures that the YOLOv8 algorithm continuously adapts its gradient gain allocation strategy to optimally correspond with the conditions at each discrete juncture throughout the training phase. In contrast to conventional methods, the non-monotonic aspect of the mechanism permits fluctuations in gradient gain that are not strictly dependent on incremental changes in the loss value. Such a methodology diminishes the competitiveness of superior anchor boxes, while attenuating the detrimental gradients engendered by lower-quality examples. Consequently, this tactic enables WIoU to prioritize anchor boxes of median quality, culminating in an enhanced aggregate performance of the detection system.

2.2.3. Training Environment and Evaluation Indicators

In this study, model training was performed on a computer with the Ubuntu 20.04 operating system. The CPU configuration of the computer was 12 vCPU 2.50 GHz. The GPU was RTX 3080 (10 GB), and the experimental environment was based on Python 1.11.0 and Python 3.8. The relevant hyperparameters of the experimental model were set as follows: The model accepts images with a resolution of 640 × 640 pixels as the standard input, the initial learning rate is 0.01, the initial momentum of the learning rate is 0.937, and the optimizer uses SGD. Taking into account the variations in the model size and the training speed in the experiments, the number of training batches is 8 per training batch and 200 training iterations.
On the test dataset, we used several evaluation metrics to assess the performance of the trained models. All samples were classified into four types, namely true positive ( T P ), false positive ( F P ), true negative ( T N ), and false negative ( F N ). Precision ( P ) and recall ( R ) are defined based on the number of these four sample types using the following equations. The P–R curve was plotted with P as the vertical axis and R as the horizontal axis. Since the formulas for P and R are mainly for positive samples T P , to measure the relative weights of precision and recall at the same time, A P is defined as the area under the P–R curve.   A P measures the sensitivity of the network in recognising the target object, especially when dealing with unbalanced categories. It is often used to measure the accuracy of the model in different categories, not just the overall accuracy. m A P is the average of the A P s of all categories, where C represents the number of pest categories. In this experiment, m A P was mainly used and, whose subscripts represent the average accuracy with IoU greater than or equal to 50 and the range of IoU between 0.5 and 0.95, respectively.
    P r e c i s i o n = T P T P + F P × 100 %
R e c a l l = T P T P + F N × 100 %
A P k = 0 1 P R k d R k
m A P = 1 C j C A P j

3. Results and Discussion

3.1. The Comparison of Various Mainstream Models

Accuracy Comparison

In this study, we provide a comprehensive comparison of the SAW-YOLO model with mainstream YOLO frameworks, including the YOLOv8m, YOLOv8n, YOLOv8L, and YOLOv7, as well as the YOLOv5 family, and with single-stage detector models such as SSD and YOLOX. In addition, we compared them with the state-of-the-art two-stage detection models Faster RCNN and RCNN. Table 2 lists the experimental results and parameter comparisons between SAW-YOLO and these mainstream models under the same hyperparameter conditions. The experimental results show that SAW-YOLO has a high advantage in terms of the number of parameters and model detection performance, which is mainly reflected in the fact that it still maintains the leading performance compared to YOLOv8s, which has 243% of the number of parameters of SAW-YOLO. The overall precision and recall achieved SOTA in the field of citrus pest detection.

3.2. Ablation Experiments

To determine the efficacy of the model in identifying citrus pests, we used an ablation study based on the YOLOv8n architecture. Each improvement method was methodically integrated into the YOLOv8n framework and benchmarked against the SAW-YOLOv8n variant. The hardware environment and parameter configurations were kept consistent during the training of all models. Table 3 shows a series of model enhancement strategies and their corresponding performance metrics. The results show that SAW-YOLOv8 outperformed the benchmark YOLOv8n and other enhancement methods in terms of both metrics and indices. The tabular data shows that SAW-YOLO improved these two metrics on the test set by 3.3% and 3.2%, respectively, compared to the benchmark YOLOv8 model. With the addition of the SPD Module to the model, SAW-YOLO improved by 1.4 percentage points on each of these metrics, highlighting the key role of the SPD Module in exploiting shallow image data. After adding the AFFD-Head to the initial model, SAW-YOLO improved by 0.3 and 0.1 percentage points on both metrics, respectively. When the SPD Module was used together with the AFFD, the improvements were not linearly additive, and the improvements were 2.1 and 2.6 percentage points, respectively. In the case of a single AFFD-Head role, the metrics did not perform as well, and the SPD-Module was able to retain and provide more information to the AFFD-Head during the forward process to alleviate the information bottleneck. This experiment demonstrated the key role of SPD-Module and AFFD in the overall architecture, greatly improving the model’s detection capability. The optimization of the loss function by WIoUv3 improved the model’s focus on the quality of the medium detection frames and sped up the convergence of the model. As shown in Figure 7, our novel bounding box regression loss function is more advantageous than the traditional loss function. On the one hand, after using the innovative WIOU loss function, the b o x _ l o s s curves of SAW-YOLO are all far below in the baseline model YOLOv8n, which indicates that WIOU accelerates bounding box convergence. On the other hand, the most obvious feature of the information bottleneck is that as the depth deepens, it is difficult for the model to localize the real pests to determine the bounding box, and even if the categories are identified based on the features, their localization errors are often large. Without affecting d f l _ l o s s and c l s _ l o s s , SAW-YOLO is tuned for bounding box regression to improve performance. In addition, Figure 8 shows the performance metrics trajectories of SAW-YOLO and YOLOv8n, where SAW-YOLO shows significant improvement in both recall and metrics. To evaluate the precision of the detection algorithm, we adjusted the confidence thresholds of the test image set to generate precision–recall (P–R) curves for the 13 pest categories, as shown in Figure 9. Compared to YOLOv8n, the per-category curves in SAW-YOLO are more compact and have higher precision.

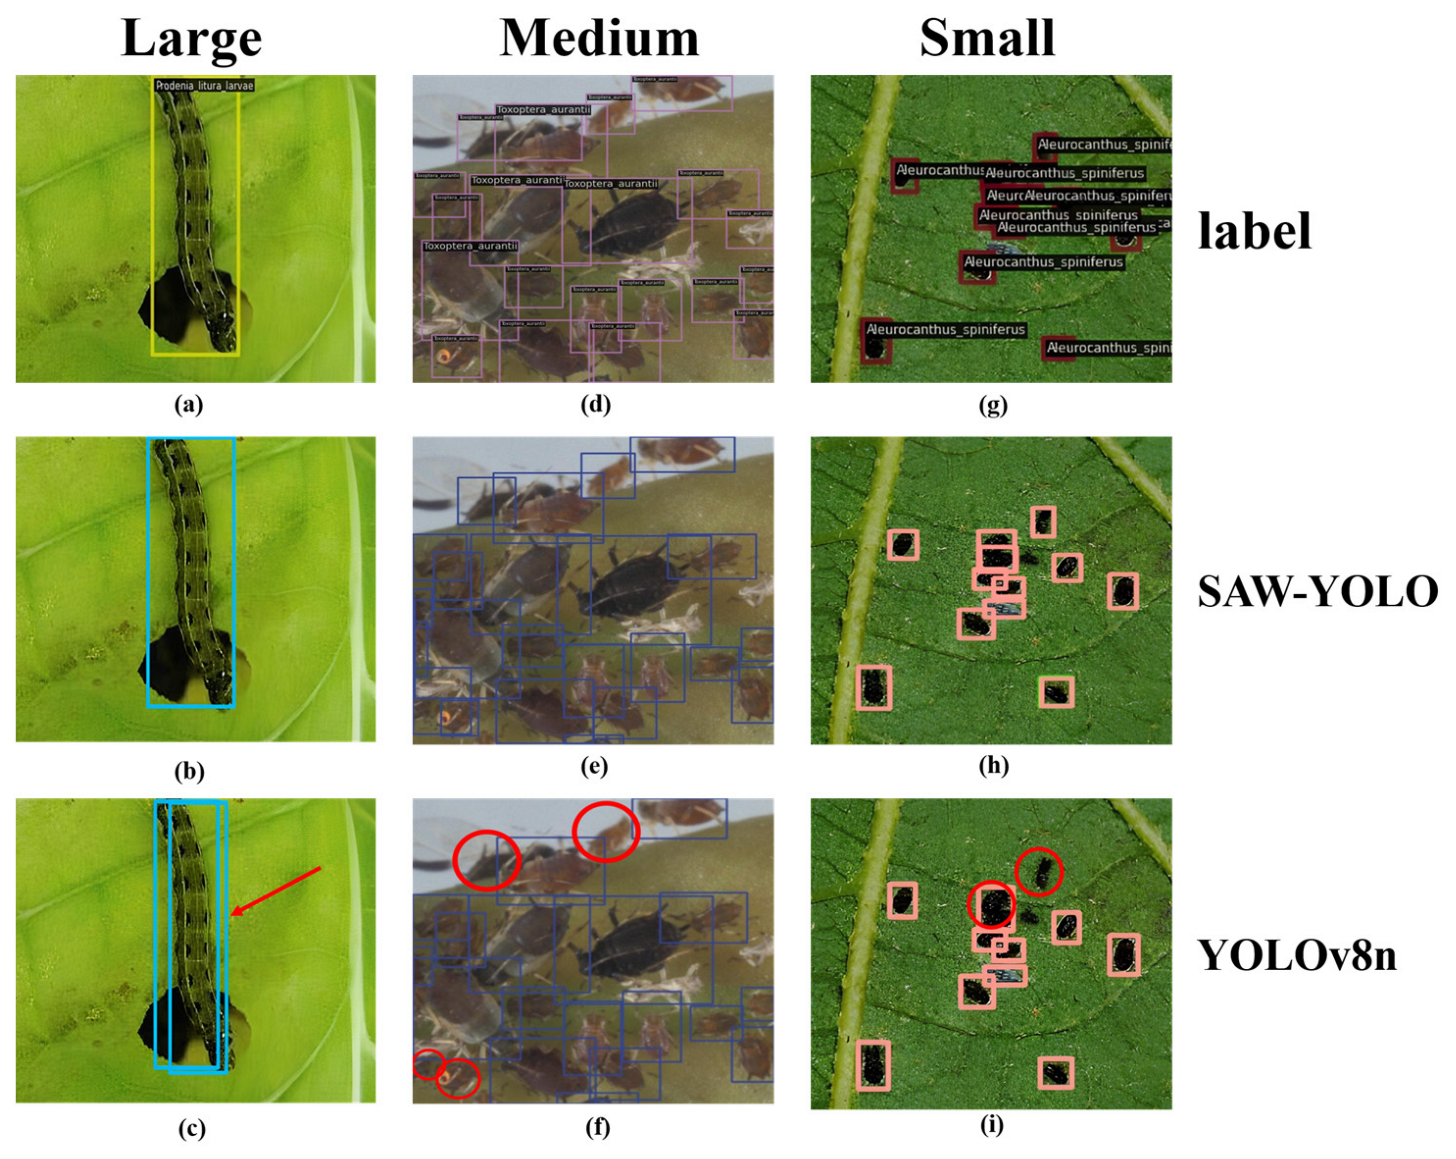
3.3. Performance of Multi-Scale Object Detection

In this study, we collected a comprehensive dataset of 5,000 images covering 13 different categories. A large portion of the dataset (1257 images or 22.3%) was composed of small target entities (scale not exceeding 32 × 32 pixels), representing cumulatively 5645 targets. The tiny scale of these entities posed a considerable challenge to pest detection algorithms. Table 4 summarizes the results of the analysis of this experiment, demonstrating the algorithm’s ability to detect pests on small targets. SAW-YOLO achieves SOTA on small targets with a very small number of parameters, and even though our baseline model is YOLOv8n, compared to the larger YOLOv8s, YOLOv3, Faster-RCNN, and SwinTransformer models, our model still outperformed the best of them by 2.3%, with only 40% or more of the number of parameters. The model parameter is only 40% or less of theirs. The inferential analyses derived from these metrics show that the SAW-YOLO model has superior detection capabilities for small target pests, exceeding the performance benchmarks set by other leading models in the field. The results of our model’s detection performance for small targets are shown in Figure 10, model exhibit detection performance for small targets in dense pest scenarios of different sizes. The Grad-CAM maps for the SAW-YOLO and YOLOv8n models are shown in Figure 11, respectively. In order to verify the robustness of the model, as in Figure 12, the detection results of the model for multiple scales were demonstrated, which helped to corroborate the strong fitting performance of the model for application scenarios with multiple sizes of pests.

4. Conclusions

In this study, we built the IP-CitrusPests13 dataset containing 13 common citrus pests with multiple morphologies of the pests for different scenarios. The longstanding problem of focusing solely on a single pest category and morphology in this field has now been effectively resolved. We constructed a SAW-YOLO network model based on YOLOv8n for solving the problem of difficult detection of small targets of citrus pests in agriculture, Using the SPD-Module, we enhanced the accurate detection of small-target citrus pests, effectively reduced the loss of information in the transmission process, and solved the information bottleneck problem in the dissemination process. The AFFD head fully mines and pays attention to the features obtained through the SPD-Module, fuses and distributes them with the information from the pyramid structure and, at the same time, acts as a small target detection head, achieving dual functionality within a single structure. After the experiments, the model improved by 3.3% and 3.2% to 90.3% and 74.3%, respectively, in the whole dataset. In terms of small target pest detection, SAW-YOLO shows satisfactory performance with a 7.5% improvement in metrics over the initial YOLOv8n, and the model even outperforms the existing state-of-the-art YOLOv8s with larger parameters in detecting small and medium-sized targets, and the SAW-YOLO parameter is only 41.1% of that of the YOLOv8s. Thus, our model has better performance and more efficient parameter utilization. We tested our model against three different sizes of pests and verified that SAW-YOLO has strong robustness. Based on this, we plan to optimize the parameter computation of this high performance and lighter model and deeply explore on model pruning and neural network search, so that it can be applied to IoT deployment for precision agriculture.

Author Contributions

Conceptualization, X.W. and J.L.; methodology, X.W.; validation, X.W., J.L. and Y.Y.; formal analysis, Y.Y.; investigation, Z.L.; resources, X.J.; data curation, X.J.; writing—original draft preparation, X.W.; writing—review and editing, X.W.; visualization, X.W.; project administration, H.P.; funding acquisition, P.Z. All authors have read and agreed to the published version of the manuscript.

Funding

This work was financially supported by the Seedling Cultivation Project of Technology Innovation of Sichuan Province (MZGC20230101).

Data Availability Statement

The data presented in this study are available on request from the corresponding author.

Acknowledgments

The authors thank Falin Guo for providing article presentation suggestions.

Conflicts of Interest

The authors declare that they have no known financial, interest, or personal relationships that may influence the work reported in this paper.

References

  1. Van Der Ploeg, J.D. Peasant-Driven Agricultural Growth and Food Sovereignty. J. Peasant. Stud. 2014, 41, 999–1030. [Google Scholar] [CrossRef]
  2. Fennell, J.T.; Fountain, M.T.; Paul, N.D. Direct Effects of Protective Cladding Material on Insect Pests in Crops. Crop Prot. 2019, 121, 147–156. [Google Scholar] [CrossRef]
  3. Chen, K.; Tian, Z.; He, H.; Long, C.; Jiang, F. Bacillus Species as Potential Biocontrol Agents against Citrus Diseases. Biol. Control 2020, 151, 104419. [Google Scholar] [CrossRef]
  4. Qiang, J. Detection of Citrus Pests in Double Backbone Network Based on Single Shot Multibox Detector. Comput. Electron. Agric. 2023, 212, 108158. [Google Scholar] [CrossRef]
  5. Li, W.; Zheng, T.; Yang, Z.; Li, M.; Sun, C.; Yang, X. Classification and Detection of Insects from Field Images Using Deep Learning for Smart Pest Management: A Systematic Review. Ecol. Inform. 2021, 66, 101460. [Google Scholar] [CrossRef]
  6. Preti, M.; Verheggen, F.; Angeli, S. Insect Pest Monitoring with Camera-Equipped Traps: Strengths and Limitations. J. Pest Sci. 2021, 94, 203–217. [Google Scholar] [CrossRef]
  7. Dargan, S.; Kumar, M.; Ayyagari, M.R.; Kumar, G. A Survey of Deep Learning and Its Applications: A New Paradigm to Machine Learning. Arch. Computat. Methods Eng. 2020, 27, 1071–1092. [Google Scholar] [CrossRef]
  8. Girshick, R. Fast R-CNN. In Proceeding of the IEEE International Conference on Computer Vision, Santiago, Chile, 7–13 December 2015. [Google Scholar]
  9. Ren, S.; He, K.; Girshick, R.; Sun, J. Faster R-CNN: Towards Real-Time Object Detection with Region Proposal Networks. IEEE Trans. Pattern Anal. Mach. Intell. 2016, 39, 1137–1149. [Google Scholar] [CrossRef] [PubMed]
  10. He, K.; Gkioxari, G.; Dollár, P.; Girshick, R. Mask R-CNN. arXiv 2018, arXiv:1703.06870. [Google Scholar]
  11. Redmon, J.; Divvala, S.; Girshick, R.; Farhadi, A. You Only Look Once: Unified, Real-Time Object Detection 2016. In Proceeding of the IEEE Conference on Computer Vision and Pattern Recognition, Las Vegas, NV, USA, 27–30 June 2016. [Google Scholar]
  12. Redmon, J.; Farhadi, A. YOLOv3: An Incremental Improvement. arXiv 2018, arXiv:1804.02767. [Google Scholar]
  13. Bochkovskiy, A.; Wang, C.-Y.; Liao, H.-Y.M. YOLOv4: Optimal Speed and Accuracy of Object Detection. arXiv 2020, arXiv:2004.10934. [Google Scholar]
  14. Liu, W.; Anguelov, D.; Erhan, D.; Szegedy, C.; Reed, S.; Fu, C.-Y.; Berg, A.C. SSD: Single Shot MultiBox Detector. In Computer Vision–ECCV 2016: 14th European Conference, Amsterdam, The Netherlands, 11–14 October 2016; Springer International Publishing: Heidelberg, Germany, 2016; Volume 9905, pp. 21–37. [Google Scholar]
  15. Carion, N.; Massa, F.; Synnaeve, G.; Usunier, N.; Kirillov, A.; Zagoruyko, S. End-to-End Object Detection with Transformers. In Computer Vision–ECCV 2020; Vedaldi, A., Bischof, H., Brox, T., Frahm, J.-M., Eds.; Lecture Notes in Computer Science; Springer International Publishing: Heidelberg, Germany, 2020; Volume 12346, pp. 213–229. ISBN 978-3-030-58451-1. [Google Scholar]
  16. Liu, Z.; Lin, Y.; Cao, Y.; Hu, H.; Wei, Y.; Zhang, Z.; Lin, S.; Guo, B. Swin Transformer: Hierarchical Vision Transformer Using Shifted Windows. Available online: https://arxiv.org/abs/2103.14030v2 (accessed on 20 March 2023).
  17. Song, H.; Sun, D.; Chun, S.; Jampani, V.; Han, D.; Heo, B.; Kim, W.; Yang, M.-H. ViDT: An Efficient and Effective Fully Transformer-Based Object Detector. arXiv 2021, arXiv:2110.03921. [Google Scholar]
  18. Islam, S.; Elmekki, H.; Elsebai, A.; Bentahar, J.; Drawel, N.; Rjoub, G.; Pedrycz, W. A Comprehensive Survey on Applications of Transformers for Deep Learning Tasks. Expert Syst. Appl. 2024, 241, 122666. [Google Scholar] [CrossRef]
  19. Du, X.; Cheng, H.; Ma, Z.; Lu, W.; Wang, M.; Meng, Z.; Jiang, C.; Hong, F. DSW-YOLO: A Detection Method for Ground-Planted Strawberry Fruits under Different Occlusion Levels. Comput. Electron. Agric. 2023, 214, 108304. [Google Scholar] [CrossRef]
  20. Betti Sorbelli, F.; Palazzetti, L.; Pinotti, C.M. YOLO-Based Detection of Halyomorpha Halys in Orchards Using RGB Cameras and Drones. Comput. Electron. Agric. 2023, 213, 108228. [Google Scholar] [CrossRef]
  21. Yang, Y.; Xiao, Y.; Chen, Z.; Tang, D.; Li, Z.; Li, Z. FCBTYOLO: A Lightweight and High-Performance Fine Grain Detection Strategy for Rice Pests. IEEE Access 2023, 11, 101286–101295. [Google Scholar] [CrossRef]
  22. Jia, X.; Jiang, X.; Li, Z.; Mu, J.; Wang, Y.; Niu, Y. Application of Deep Learning in Image Recognition of Citrus Pests. Agriculture 2023, 13, 1023. [Google Scholar] [CrossRef]
  23. Syed-Ab-Rahman, S.F.; Hesamian, M.H.; Prasad, M. Citrus Disease Detection and Classification Using End-to-End Anchor-Based Deep Learning Model. Appl. Intell. 2022, 52, 927–938. [Google Scholar] [CrossRef]
  24. Dai, F.; Wang, F.; Yang, D.; Lin, S.; Chen, X.; Lan, Y.; Deng, X. Detection Method of Citrus Psyllids With Field High-Definition Camera Based on Improved Cascade Region-Based Convolution Neural Networks. Front. Plant Sci. 2022, 12, 816272. [Google Scholar] [CrossRef]
  25. Sunkara, R.; Luo, T. No More Strided Convolutions or Pooling: A New CNN Building Block for Low-Resolution Images and Small Objects; Springer Nature: Cham, Switzerland, 2022. [Google Scholar]
  26. Du, Y.; Zhong, S.; Fang, H.; Wang, N.; Liu, C.; Wu, D.; Sun, Y.; Xiang, M. Modeling Automatic Pavement Crack Object Detection and Pixel-Level Segmentation. Autom. Constr. 2023, 150, 104840. [Google Scholar] [CrossRef]
  27. Zhu, L.; Wang, X.; Ke, Z.; Zhang, W.; Lau, R. BiFormer: Vision Transformer with Bi-Level Routing Attention. In Proceeding of the IEEE/CVF Conference on Computer Vision and Pattern Recognition, Vancouver, BC, Canada, 17–24 June 2023. [Google Scholar]
  28. Ding, X.; Zhang, X.; Han, J.; Ding, G. Diverse Branch Block: Building a Convolution as an Inception-like Unit. In Proceedings of the IEEE/CVF Conference on Computer Vision and Pattern Recognition, Nashville, TN, USA, 20–25 June 2021. [Google Scholar]
  29. Jocher, G. Ultralytics YOLO (Version8.0.0) [Computer Software]. Available online: https://github.com/ultralytics (accessed on 10 January 2024).
  30. Wu, X.; Zhan, C.; Lai, Y.-K.; Cheng, M.-M.; Yang, J. IP102: A Large-Scale Benchmark Dataset for Insect Pest Recognition. In Proceedings of the 2019 IEEE/CVF Conference on Computer Vision and Pattern Recognition (CVPR), Long Beach, CA, USA, June 2019; IEEE: New York, NY, USA, 2019; pp. 8779–8788. [Google Scholar]
  31. Lin, T.-Y.; Maire, M.; Belongie, S.; Hays, J.; Perona, P.; Ramanan, D.; Dollár, P.; Zitnick, C.L. Microsoft COCO: Common Objects in Context. In Computer Vision–ECCV 2014; Fleet, D., Pajdla, T., Schiele, B., Tuytelaars, T., Eds.; Lecture Notes in Computer Science; Springer International Publishing: Heidelberg, Germany, 2014; Volume 8693, pp. 740–755. ISBN 978-3-319-10601-4. [Google Scholar]
  32. Wang, C.-Y.; Bochkovskiy, A.; Liao, H.-Y.M. YOLOv7: Trainable Bag-of-Freebies Sets New State-of-the-Art for Real-Time Object Detectors. In Proceedings of the 2023 IEEE/CVF Conference on Computer Vision and Pattern Recognition (CVPR), Vancouver, BC, Canada, 17–24 June 2023; pp. 7464–7475. [Google Scholar]
  33. Jocher, G. YOLOv5 by Ultralytics (Version 7.0) [Computer Software]. 2020. Available online: https://zenodo.org/records/7347926 (accessed on 22 November 2022).
  34. Ge, Z.; Liu, S.; Wang, F.; Li, Z.; Sun, J. YOLOX: Exceeding YOLO Series in 2021. arXiv 2021, arXiv:2107.08430. [Google Scholar]
  35. Tong, Z.; Chen, Y.; Xu, Z.; Yu, R. Wise-IoU: Bounding Box Regression Loss with Dynamic Focusing Mechanism. arXiv 2023, arXiv:2301.10051. [Google Scholar]
  36. Tishby, N.; Zaslavsky, N. Deep Learning and the Information Bottleneck Principle. In Ieee Information Theory Workshop (itw); IEEE: New York, NY, USA, 2015. [Google Scholar]
  37. Wang, C.-Y.; Yeh, I.-H.; Liao, H.-Y.M. YOLOv9: Learning What You Want to Learn Using Programmable Gradient Information. arXiv 2024, arXiv:2402.13616. [Google Scholar]
  38. Wang, C.; He, W.; Nie, Y.; Guo, J.; Liu, C.; Han, K.; Wang, Y. Gold-YOLO: Efficient Object Detector via Gather-and-Distribute Mechanism. In Proceedings of the Advances in Neural Information Processing Systems, New Orleans, LA, USA, 10–16 December 2023. [Google Scholar]
Figure 1. Diagram of Various Insect Scales.
Agronomy 14 01571 g001
Figure 2. The Structure of the SAW-YOLO.
Agronomy 14 01571 g002
Figure 3. The Structure of the SPD Module.
Agronomy 14 01571 g003
Figure 4. The structure of Bi-level Routing Attention.
Agronomy 14 01571 g004
Figure 5. The structure of Diverse Branch Block.
Agronomy 14 01571 g005
Figure 6. Illustration of bounding boxes and anchor boxes.
Agronomy 14 01571 g006
Figure 7. SAW-YOLO and YOLOv8n’s loss function plot.
Agronomy 14 01571 g007
Figure 8. The performance curves of SAW-YOLO and YOLOv8n.
Agronomy 14 01571 g008
Figure 9. Precision-Recall (P-R) curves for YOLOv8n and SAW-YOLO and comparison of recognition accuracy for 13 species.
Agronomy 14 01571 g009
Figure 10. Comparison of dense target (area < 322) detection with different models. The squares in the image indicate the detection results of the model for the test set.
Agronomy 14 01571 g010
Figure 11. The Grad-CAM maps of the SAW-YOLO and YOLOv8n models. (a,d,g) correspond to original images, (b,e,h) and (c,f,i) respectively illustrate the Grad-CAM effects post feature aggregation in the deep layers of the SAW-YOLO and YOLOv8n models.
Agronomy 14 01571 g011
Figure 12. The detection comparison of SAW-YOLO and YOLOv8n models at different scales. Arrows pointing to pests indicate that the YOLOv8n model made repeated detections of the target; circles indicate missed detections by YOLOv8n. Picture frame categories in picture (d,g) are both Toxoptera aurantii and Aleurocanthus spiniferus.
Agronomy 14 01571 g012
Table 1. Classification categories of the study area and the number of training samples, validation samples, and test samples for each category.
ClassSpecies Name
(Average Length (mm))
Training SamplesValidation SamplesTest
Samples
1Adristyrannus (96–106)2777644
2Aleurocanthus spiniferus (1–1.3)2164 596365
3Bactrocera tsuneonis (9.9–12)1041720
4Ceroplastes rubens (1–2.5)2367522
5Chrysomphalus aonidum77312279
6Panonchus citri McGregor (1.5–2)3468326
7Papilio Xuthus (3–40)2909048
8Parlatoria zizyphus Lucus (1.5–2)63157
9Phyllocnistis citrella Stainton (0.5–4)622415
10Phyllocoptes olives ashmead (0.1–1)24212332
11Prodenia litura imago (14–20)1334619
12Prodenia litura larvae (14–40)2255836
13Toxoptera aurantii (0.2–0.5)55226475
Small 1049334155
Medium 2432612336
Large 1986643297
Total 54671589788
Table 2. Comparison of metrics in various mainstream models.
Models m A P 50 m A P @ 0.5 : 0.95 m A R @ 0.5 : 0.95 P a r a m s M
SwinTransformer72.947.260.668.752
SSD69.744.454.725.35
Faster-RCNN78.345.855.551.753
YOLOv389.176.178.161.588
YOLOv5n87.570.279.23.247
YOLOv6n88.372.578.74.239
YOLOv8n87.071.177.93.157
YOLOv8s89.475.779.511.141
YOLOx-s81.263.264.38.942
SAW-YOLO90.374.380.54.58
Table 3. Comparison of ablation experiments of the improved YOLOv8n models and the SAW-YOLO model.
Methods SPDM AFFD WIoUv3 m A P 50 m A P @ 0.5 : 0.95 m A R @ 0.5 : 0.95 F P S P a r a m s M
YOLOv8 87.071.13.16120.86.2M
YOLOv8+SPDM 88.4(+1.4)72.8(+1.7)4.19117.78.2M
YOLOv8+AFFD 87.3(+0.3)71.2(+0.1)3.4381.96.9M
YOLOv8+WIoUv3 88.6(+1.6)72.1(+1.0)3.16124.86.2M
YOLOv8+S+A 89.1(+2.1)73.7(+2.6)4.5881.88.8M
YOLOv8+S+W 89.3(+2.3)73.1(+2.0)4.1998.48.2M
YOLOv8+A+W 88.2(+1.2)72.5(+1.4)3.4389.06.9M
SAW-YOLO90.3(+3.3)74.3(+3.2)4.5882.98.8M
Table 4. Comparison results of different object detection methods.
Models m A P @ 0.5 : 0.95
s m a l l
m A P @ 0.5 : 0.95
m e d i u m
m A P @ 0.5 : 0.95
l a r g e
P a r a m s M
SwinTransformer31.343.453.068.752
Faster-RCNN26.341.951.451.753
YOLOv347.968.4885.061.588
YOLOv5n28.670.180.63.247
YOLOv6n41.666.781.74.239
YOLOx-s30.651.163.08.942
YOLOv8n37.860.176.03.157
YOLOv8s43.070.384.511.141
SAW-YOLO45.370.877.44.58
Disclaimer/Publisher’s Note: The statements, opinions and data contained in all publications are solely those of the individual author(s) and contributor(s) and not of MDPI and/or the editor(s). MDPI and/or the editor(s) disclaim responsibility for any injury to people or property resulting from any ideas, methods, instructions or products referred to in the content.

