Abstract
Broiler farming is a significant source of gaseous emissions. The aim of this study was to assess the effects of different litter additives on the emission of NH3, N2O, CO2, and CH4 during broiler housing and subsequent manure storage. The gaseous emissions from the housing facilities were evaluated during one fattening cycle in environmentally controlled rooms with three different additives applied to the litter material (10% w/w aluminum sulphate or biochar and 2.50 mg m−2 urease inhibitor), as well as a control. A storage experiment was conducted under laboratory conditions for 90 days to evaluate the influence of these three additives on gaseous losses. During broiler housing, the results indicated that NH3 emissions were reduced significantly (40–60%) by litter additives, while global warming potential (GWP) emissions were reduced significantly (31%) by Alum. The addition of Biochar (a 58% reduction) had the same significant effect as Alum (a 60% reduction) to mitigate these losses. The re-application of Urease (a 41% reduction) may be required to reach an equal or higher reduction. During storage, NH3 and GWP emissions were not significantly affected by the litter additives. During broiler housing and subsequent manure storage, NH3 emissions were reduced significantly (22–41%) by litter additives, whereas GWP emissions did not decrease significantly. Globally, it can be concluded that Biochar appears to be a good alternative to Alum due to its equal effectiveness in mitigating NH3 losses, without increasing the GWP potential in the housing and avoiding pollution swapping.
1. Introduction
Broiler farming is one of the main sources of protein for humans and it is expected that the consumption of chicken meat will continue to grow until 2050. Currently, around 121.5 million tons of chicken meat are produced worldwide from the farming of 74 billion chicken heads [1]. This sector is a significant source of ammonia (NH3), nitrous oxide (N2O), and methane (CH4) emissions and has an impact on global greenhouse gas (GHG) emissions, as well as bird and human health [2,3]. Hence, in the European Union, broiler farming is obligated to be environmentally sustainable by the Integrated Pollution Prevention and Control (IPPC) Directive (96/61/EC), the National Emissions Ceiling (NEC) Directive (2016/2284/EU), and the Energy and Climate Action Directive (2018/1999/EU) for carbon neutrality [4].
Broiler excretions are rich in uric acid (ca. 80%), being hydrolyzed into urea through aerobic decomposition, followed by conversion to ammonium (NH4+) by the urease enzyme found in manure [5]. Then, NH3 is volatilized into the air as a gas and released into the atmosphere from litter material, while N2O is released through the nitrification and denitrification processes [6]. In addition, CO2 is emitted by broilers during breathing, uric acid/urea hydrolysis of excretions, and the aerobic/anaerobic decomposition of litter material, whereas CH4 is released by the anaerobic decomposition [7]. The emission intensity of chicken meat was 0.6 kg CO2 eq. kg−1 [8] and, in European countries, the average annual emission rates from broiler houses varied greatly from 0.06 to 0.45 g day−1 broiler−1 for NH3, 0 to 46 mg day−1 broiler−1 for N2O, 55.2 to 98.4 g day−1 broiler−1 for CO2, and 0 to 50 mg day−1 broiler−1 for CH4 [6,9,10].
Ammonia and GHG emissions occur in all stages of animal manure management–housing, storage, processing, and recycling as crop fertilizers after field application [4,9,11,12,13]. An effective assessment of the effects of manure treatments or the combination of different treatments in mitigating different emission processes should change from a single-stage approach to include real/pilot-scale experiments. These studies should be performed using a manure whole-life-cycle scale to avoid pollution swapping and simultaneously to determine the most efficient solution for manure energy and nutrient recovery [14]. The relationship between NH3 volatilization and N2O emission is also complex because emissions of both may be reduced by diet manipulation or manure management, and if a mitigation technology reduces NH3 losses, the preserved NH4+ may later increase storage N2O emissions [4,11,12]. On the other hand, gaseous nitrogen (N) losses will reduce the N availability for nitrification and denitrification processes and, consequently, N2O formation. Nevertheless, it is crucial to consider potential pollution swapping when planning and implementing mitigation measures [12].
Previous studies [5,10,13,15,16] reported that a wide range of additives could be applied to litter, where they act as acidifying and adsorbent additives and can affect the microbial activity in manure; they also have been shown to reduce manure pH. However, several additives are marketed to reduce gaseous emissions but are not listed in The United Nations Economic Commission for Europe (UNECE) guidance document [4,11,12] due to limited evidence of their efficacy and clear independence during their testing process. On the other hand, a transition towards circular agricultural systems entails minimizing external inputs with the least negative impact on the environment. Thus, the replacement of chemical additives by agricultural residues will contribute to the sustainability of broiler farming and this research is of great importance and should be investigated in further studies.
The aim of the present study was to assess the effects the litter additives aluminum sulphate, biochar and urease inhibitor had on the emissions of NH3, N2O, CO2, and CH4 during the broiler housing and subsequent storage of manure.
2. Materials and Methods
The experiment was authorized by the Organism for Animal Welfare of the University (ORBEA) and conducted in accordance with animal research regulations of the EU (Directive, 2010/63/EU), with protocol number 1638-e-CITAB-2023. The test was carried out at the animal research unit of the University of Trás-os-Montes and Alto Douro (Vila Real, Portugal).
The NH3 and GHG emissions from broiler housing were evaluated during one fattening cycle (35 days) in environmentally controlled rooms with three different additives applied to the litter material (aluminum sulphate, biochar, and urease inhibitor) and a control (without any additives). Furthermore, a storage experiment was conducted under laboratory conditions for 90 days to evaluate the influence of these three additives and the control on gaseous losses.
2.1. Housing Experiment
2.1.1. Treatments
The experiment was conducted over a 35-day period at an animal research unit located in Vila Real, Portugal (latitude: 41.286596°, longitude: −7.744373°). Twelve identical airtight rooms (length = 1.64 m, width = 1.10 m, and height = 2.50 m) with controlled temperature and ventilation were used for the growth of Ross 308 broilers for 35 days. As can be observed in Figure 1, the environmentally controlled rooms were located inside a steel building (construction year 2017) fully insulated with polyurethane and equipped with air conditioning (Inoxnorma, Portugal). The broiler rooms were equipped with feeding systems in line (Roxell, Belgium) and nipple drinking systems (Roxell, Belgium), mechanical ventilation by roof exhaust fans (Fancom, The Netherlands), and heat exchangers and climate control systems (Inoxnorma, Portugal). The ventilation of each room was achieved by a one-tunnel ridge system (Ø = 150 mm) being controlled with one differential pressure meter and two temperature and relative humidity sensors (Fancom, The Netherlands) located both inside and outside (Figure 1A).
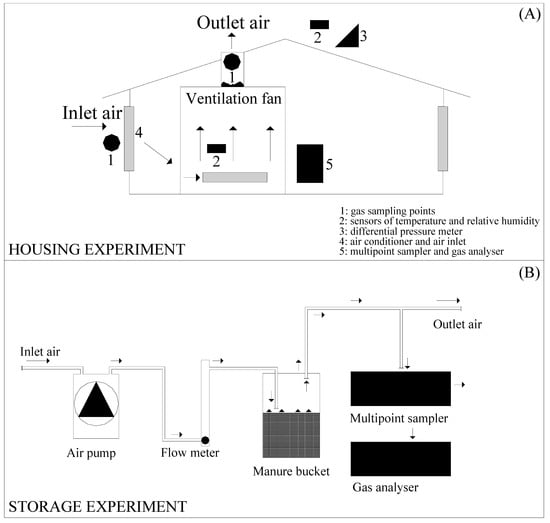
Figure 1.
Schematic plan of the housing system (A) and subsequent storage experiments (B).
New wood (Pinus pinaster Aiton) shavings (3.5 kg m−2) were placed as litter material (6314 g for 1.804 m2) in each airtight room at the beginning of the fattening cycle and the composition was as follows: 4.8 of pH (H2O) (by potentiometry, European Normalization (EN) 13037, Brussels, Belgium), 893.8 g kg−1 of dry matter (by the gravimetric method, EN 13040, Brussels, Belgium [17]), 509.4 g kg−1 of total C (by the Dumas method), 2.1 g kg−1 of total N (by the Kjeldahl method, EN 13654-1, Brussels, Belgium [18]), 0.4 g kg−1 of total NH4+-N (by absorption spectrophotometry, EN 13652, Brussels, Belgium [19]), 1.0 mg kg−1 of total NO3−-N (by absorption spectrophotometry, EN 13652, Brussels, Belgium [19]), 500–700 µm particle sizes (by the sieving method), and 100–300 kg m−3 of bulk density (by the core method). In the litter material of each airtight room, either none or one of the three following additives was applied, corresponding to the four treatments with three replications each, namely, the Control treatment received no additive to the litter; the Alum treatment and Biochar treatment received aluminum sulphate and commercial biochar on the litter surface (10% w/w) at day 0, respectively; and Urease treatment received the urease inhibitor (2.50 mg m−2) at day 25.
The Alum and Biochar treatments received the litter additives (26 February 2023) after the scattering of the bedding material and before the entrance (day 0) of the broiler chicks (27 February 2023), being uniformly sprayed by hand in the whole litter area (631.4 g per room or 350 g m−2 or 28.7 g broiler−1) [20,21]. On day 25, after the arrival of the broiler chicks, the Urease treatment was sprayed by hand over the surface of the litter (24 March 2023) after dilution at a rate of 2.50 mg m−2 of urease inhibitor per 100 mL m−2 of deionized water (4.51 mg of urease inhibitor in 180.4 mL of deionized water per room) [22]. Also on day 25, the same amount of deionized water was applied in the other three treatments (180.4 mL of deionized water per room).
The Alum (aluminum sulfate hexadecahydrate ≥ 95%, p.a., cryst; Al2(SO4)3*18 H2O) was supplied by Panreac (AppliChem GmbH, Darmstadt, Germany) with the following characteristics: Chemical Abstract Service (CAS) number of 7784-31-8; molecular weight of 666.42 g mol−1; particle size of 0.4 mm; pH (H2O) of 3.1. The biochar (Ecochar) was produced from wood (Acacia dealbata Link. and Acacia melanoxylon R. Br.) shavings (Ø = 2 mm) after being pyrolyzed in a muffle furnace (900 °C) (Ibero Massa Florestal, S.A., Portugal) and following the Commission Regulation No 889/2008 [23]. The composition of the biochar was as follows: 7.9 of pH (H2O), 700.0 g kg−1 of dry matter, 900.0 g kg−1 of total C, 5.0 g kg−1 of total N, 1000–8000 µm of particle size, 300–400 kg m−3 of bulk density, 22 m2 g−1 of specific surface area (by the Brunauer, Emmett, and Teller method), and 1.1 of mm3 g−1 of pore volume (by mercury porosimetry). The urease inhibitor N-(n-butyl) thiophosphoric triamide (NBPT) (pure solid formulation, 98.2%) was provided by Apollo Scientific Ltd., Stockport, UK, with the following characteristics: CAS number of 94317-64-3 and pH (H2O) of 7.2.
A sample of 264 broiler chicks (Ross 308) was used on day 0 (27 February 2023) of the fattening and finished on day 35 (3 April 2023). In each airtight room, 22 broiler chicks (0 days of age) were randomly placed in twelve rooms (0.082 m2 per broiler), assigned to four treatments with three replications each. At 10 days of age, the groups were decreased to 20 broilers per room (0.090 m2 per broiler). Two different feeds were used, according to the growth stage of the birds, distributed during the whole fattening cycle and following the production techniques supplied by the integrator company. Birds had ad libitum access to feed and water under a lighting period of 20:4 (light:dark) h day−1 and a luminance of 20 Lux. The composition of the standards diets used in the first (starter, 1 to 16 days) and second (grower, 17 to 35 days) phases of feeding was 6.5 and 6.4 of pH (H2O), 870.7 and 864.7 g kg−1 of dry matter (DM), 200.4 and 192.4 g kg−1 DM of crude protein, 944.5 and 948.5 g kg−1 DM of organic matter, 52.0 and 54.5 g kg−1 DM of crude fat, 25.6 and 20.9 g kg−1 DM of crude fiber, 147.1 and 138.5 g kg−1 DM of neutral detergent fiber, and 43.6 and 40.3 g kg−1 DM of ashes, respectively. The grain and other major ingredients in the feed were maize, triticale, soybean meal, animal fat, and sunflower meal. These feed samples were analyzed in triplicate by near-infrared spectroscopy (NIR) FT-NIR (NIRMaster™, Buchi, Spain).
2.1.2. Measurements
The concentrations of NH3, N2O, CO2, and CH4 in the inlet and outlet air of the broiler rooms were measured during the 35 days of the fattening cycle (from 27 February to 3 April 2023). As can be observed in Figure 1A, inlet and outlet gas concentrations were measured by a sampling line located outside the building and twelve sampling lines located inside the broiler rooms. Each sampling line was made using a Teflon tube (Ø = 3 mm, Lumasense Technologies, Ballerup, Denmark), being fixed with plastic clamps to the structure of the building. The tube of each sampling point was connected to a polytetrafluoroethylene membrane (Ø = 1 μm, Whatman, Ome, Japan) to protect against dust.
The air samples of the outlet air of the broiler rooms were collected sequentially (every 2 min) from each sampling point by a multipoint sampler (INNOVA 1409-12, Lumasense Technologies, Denmark) and then gas concentrations were analyzed by a photoacoustic field gas monitor (INNOVA 1412i-5, Lumasense Technologies, Denmark). Furthermore, a second photoacoustic field gas monitor (INNOVA 1412i-5, Lumasense Technologies, Denmark) was also used to analyze the inlet gas concentrations (every 2 min) from the outdoor sampling line. The gas analyzers were calibrated by the manufacturer before the beginning of the experiment, being operated in the mode for compensation of water interference and cross-interference and equipped with an optical filter for water vapor (filter type SB0527). The detection limits for NH3 (filter type UA0973), N2O (filter type UA0985), CO2 (filter type UA0982), and CH4 (filter type UA0969) were 152.1, 58.9, 2947.1, and 286.4 μg m−3, respectively.
The group body weights and feed weights of each broiler room were recorded on days 0, 3, 7, 10, 15, 18, 23, 29, and 35 and were used to determine the daily weight gain, daily feed intake, and feed conversion ratio. The climate control systems were used to create digital records of all data variables (temperature, relative humidity, ventilation rate, age, liveweight, and mortalities) during the fattening cycle.
2.2. Storage Experiment
2.2.1. Treatments
The manure used in this subsequent storage experiment was collected in each broiler room, corresponding to the same four treatments with three replications that were evaluated in the housing experiment, namely, raw manure as the control (treatment: Control); the addition of aluminum sulphate to litter (10% w/w) on day 0 (27 February 2023) of the fattening cycle (treatment: Alum); the addition of biochar to litter (10% w/w) on day 0 (27 February 2023) of the fattening cycle (treatment: Biochar); and the addition of the urease inhibitor to litter (2.50 mg m−2) on day 25 (24 March 2023) of the fattening cycle (treatment: Urease).
The storage experiment was conducted under laboratory conditions (latitude: 40.639035°, longitude: −7.910673°) for 90 days (from 3 April to 4 July 2023). All of the manure from each broiler room was scraped and homogenized by hand and weighted. Then, subsamples were retained for analysis and the storage experiment. These single bulk samples were collected in each broiler room on day 35 (3 April 2023) of the housing experiment, being mixed thoroughly. Subsamples were retained and analyzed using standard laboratory methods to determine the pH (H2O) according to EN 13037 [24], dry matter using the gravimetric method (24 h at 105 °C), total C using the Dumas method, total N using the Kjeldahl method according to EN 13654-1 [18], and NH4+ and NO3− via absorption spectrophotometry.
The storage experiment consisted of a system of twelve plastic buckets (height = 240 mm, Ø = 290 mm, and volume = 12 L) filled with 5000 g (height = 105 mm) of manure collected in each broiler room, under a constant temperature (20 ± 0.5 °C) and airflow rate, for 90 days. Detailed information on the laboratory system used in the storage experiment is available in Pereira et al. [25] and a schematic plan is given in Figure 1B. Briefly, one air inlet and one air outlet were positioned symmetrically in the plastic bucket, inserting a Teflon tube (Ø = 3 mm) through one of the septa with the end kept 20 mm above the manure surface. The airflow through the headspace of each container (25 exchanges h−1 and 2.272 m h−1) was obtained by a pump (KNF, model N010.KN.18, Neuberger GmbH, Freiburg, Germany) with a 2.5 L min−1 flowrate controlled by a needle valve connected to a flow meter (Aalborg™ FT10201SAVN, Aalborg, Denmark). The inlet air passed through NH3-trapping filters coated with oxalic acid, and the outlet air of the twelve plastic buckets was exhausted by a fume hood.
2.2.2. Measurements
Gas concentrations were measured in the exhaust air of the twelve plastic buckets using the same procedure and equipment as in the broiler rooms. Briefly, the air samples from the sampling points were collected every 2 min by a multipoint sampler (INNOVA 1409-12, Lumasense Technologies, Denmark), and gas concentrations were analyzed by a photoacoustic field gas monitor (INNOVA 1412i-5, Lumasense Technologies, Denmark) (Figure 1).
2.3. Data Analysis
The daily values of liveweight were obtained using an Excel spreadsheet using regression methods, adjusting cubic polynomial equations to the raw data of the broiler rooms.
The gas emissions of the broiler rooms (housing experiment) and plastic buckets (storage experiment) were calculated per hour by a mass balance from the inlet and outlet air concentrations and following the procedure described in Pereira et al. [14], using Equation (1).
where EMI is the emission of NH3, N2O, CO2, or CH4 from the broiler room or plastic bucket (mg h−1), AIR is the air flowrate of the broiler room or plastic bucket (m3 h−1), and OUT and INL are the indoor and outdoor concentrations of NH3, N2O, CO2, or CH4 of the broiler room or plastic bucket, respectively (mg m−3).
To compare gas emissions between additive and Control treatments, the efficiencies of reductions in these gases were determined following the procedure described in Pereira et al. [14], using Equation (2).
where RED is the reduction efficiencies (%) of NH3, N2O, CO2, or CH4 from additive treatments (Alum, Biochar, and Urease), ADD is the mean value of the individual or cumulative gas values from the additive treatments, and CON is the mean value of the individual or cumulative gas values from the Control treatment.
The cumulative gas emissions of each broiler room or plastic bucket were calculated by summing the daily emissions rates. The GWP was estimated by the GWP coefficients for direct GHG emissions (N2O = 265 and CH4 = 28) and indirect N2O emissions (1% of NH3-N volatilized) [2,7].
The total cumulative gas emission from each combined housing (broiler room) and subsequent storage experiment (plastic bucket) treatment was calculated per broiler using Equation (3).
where TOT is the total cumulative emission (mg broiler−1) of NH3, N2O, CO2, CH4, or GWP from the combined housing and subsequent storage experiment, HOU is the emission rate (mg broiler−1) of one broiler housed for 35 days, and STO is the emission rate (mg broiler−1) from the manure stored in the plastic bucket (emission per bucket with 5000 g of manure for 90 days) that was equivalent to the manure produced by one broiler (emission per broiler with 656 g manure for 35 days) [26].
The data obtained were analyzed using an analysis of variance (ANOVA) to test the effects of each treatment, bird age, and time on emission of gases and manure composition, followed by Tukey’s range test and comparisons of means tests (p < 0.05), using the statistical software package STATISTIX 10.0 (Analytical Software, Tallahassee, FL, USA).
3. Results and Discussion
3.1. Gaseous Emissions in Housing
3.1.1. Experimental Condition
As can be seen in Table 1, during the 35 days of the fattening cycle, no significant differences (p > 0.05) were observed in the liveweight of broilers, daily weight gain, daily feed intake, and feed conversion ratio between the Control and treatments (Alum, Biochar, and Urease).

Table 1.
Growth performance of broilers from experimental housing treatments (mean ± standard deviation).
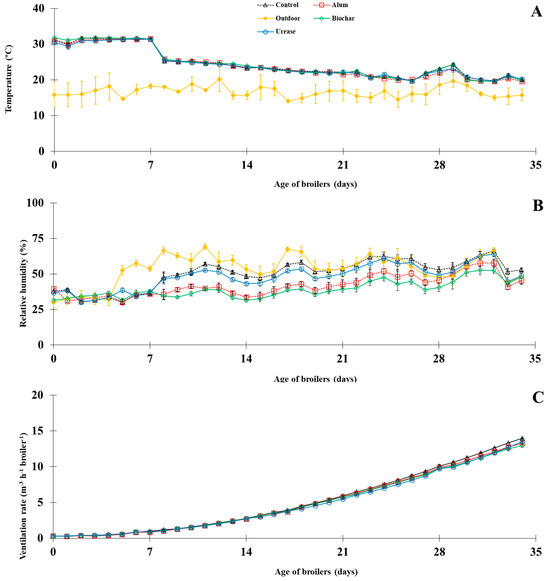
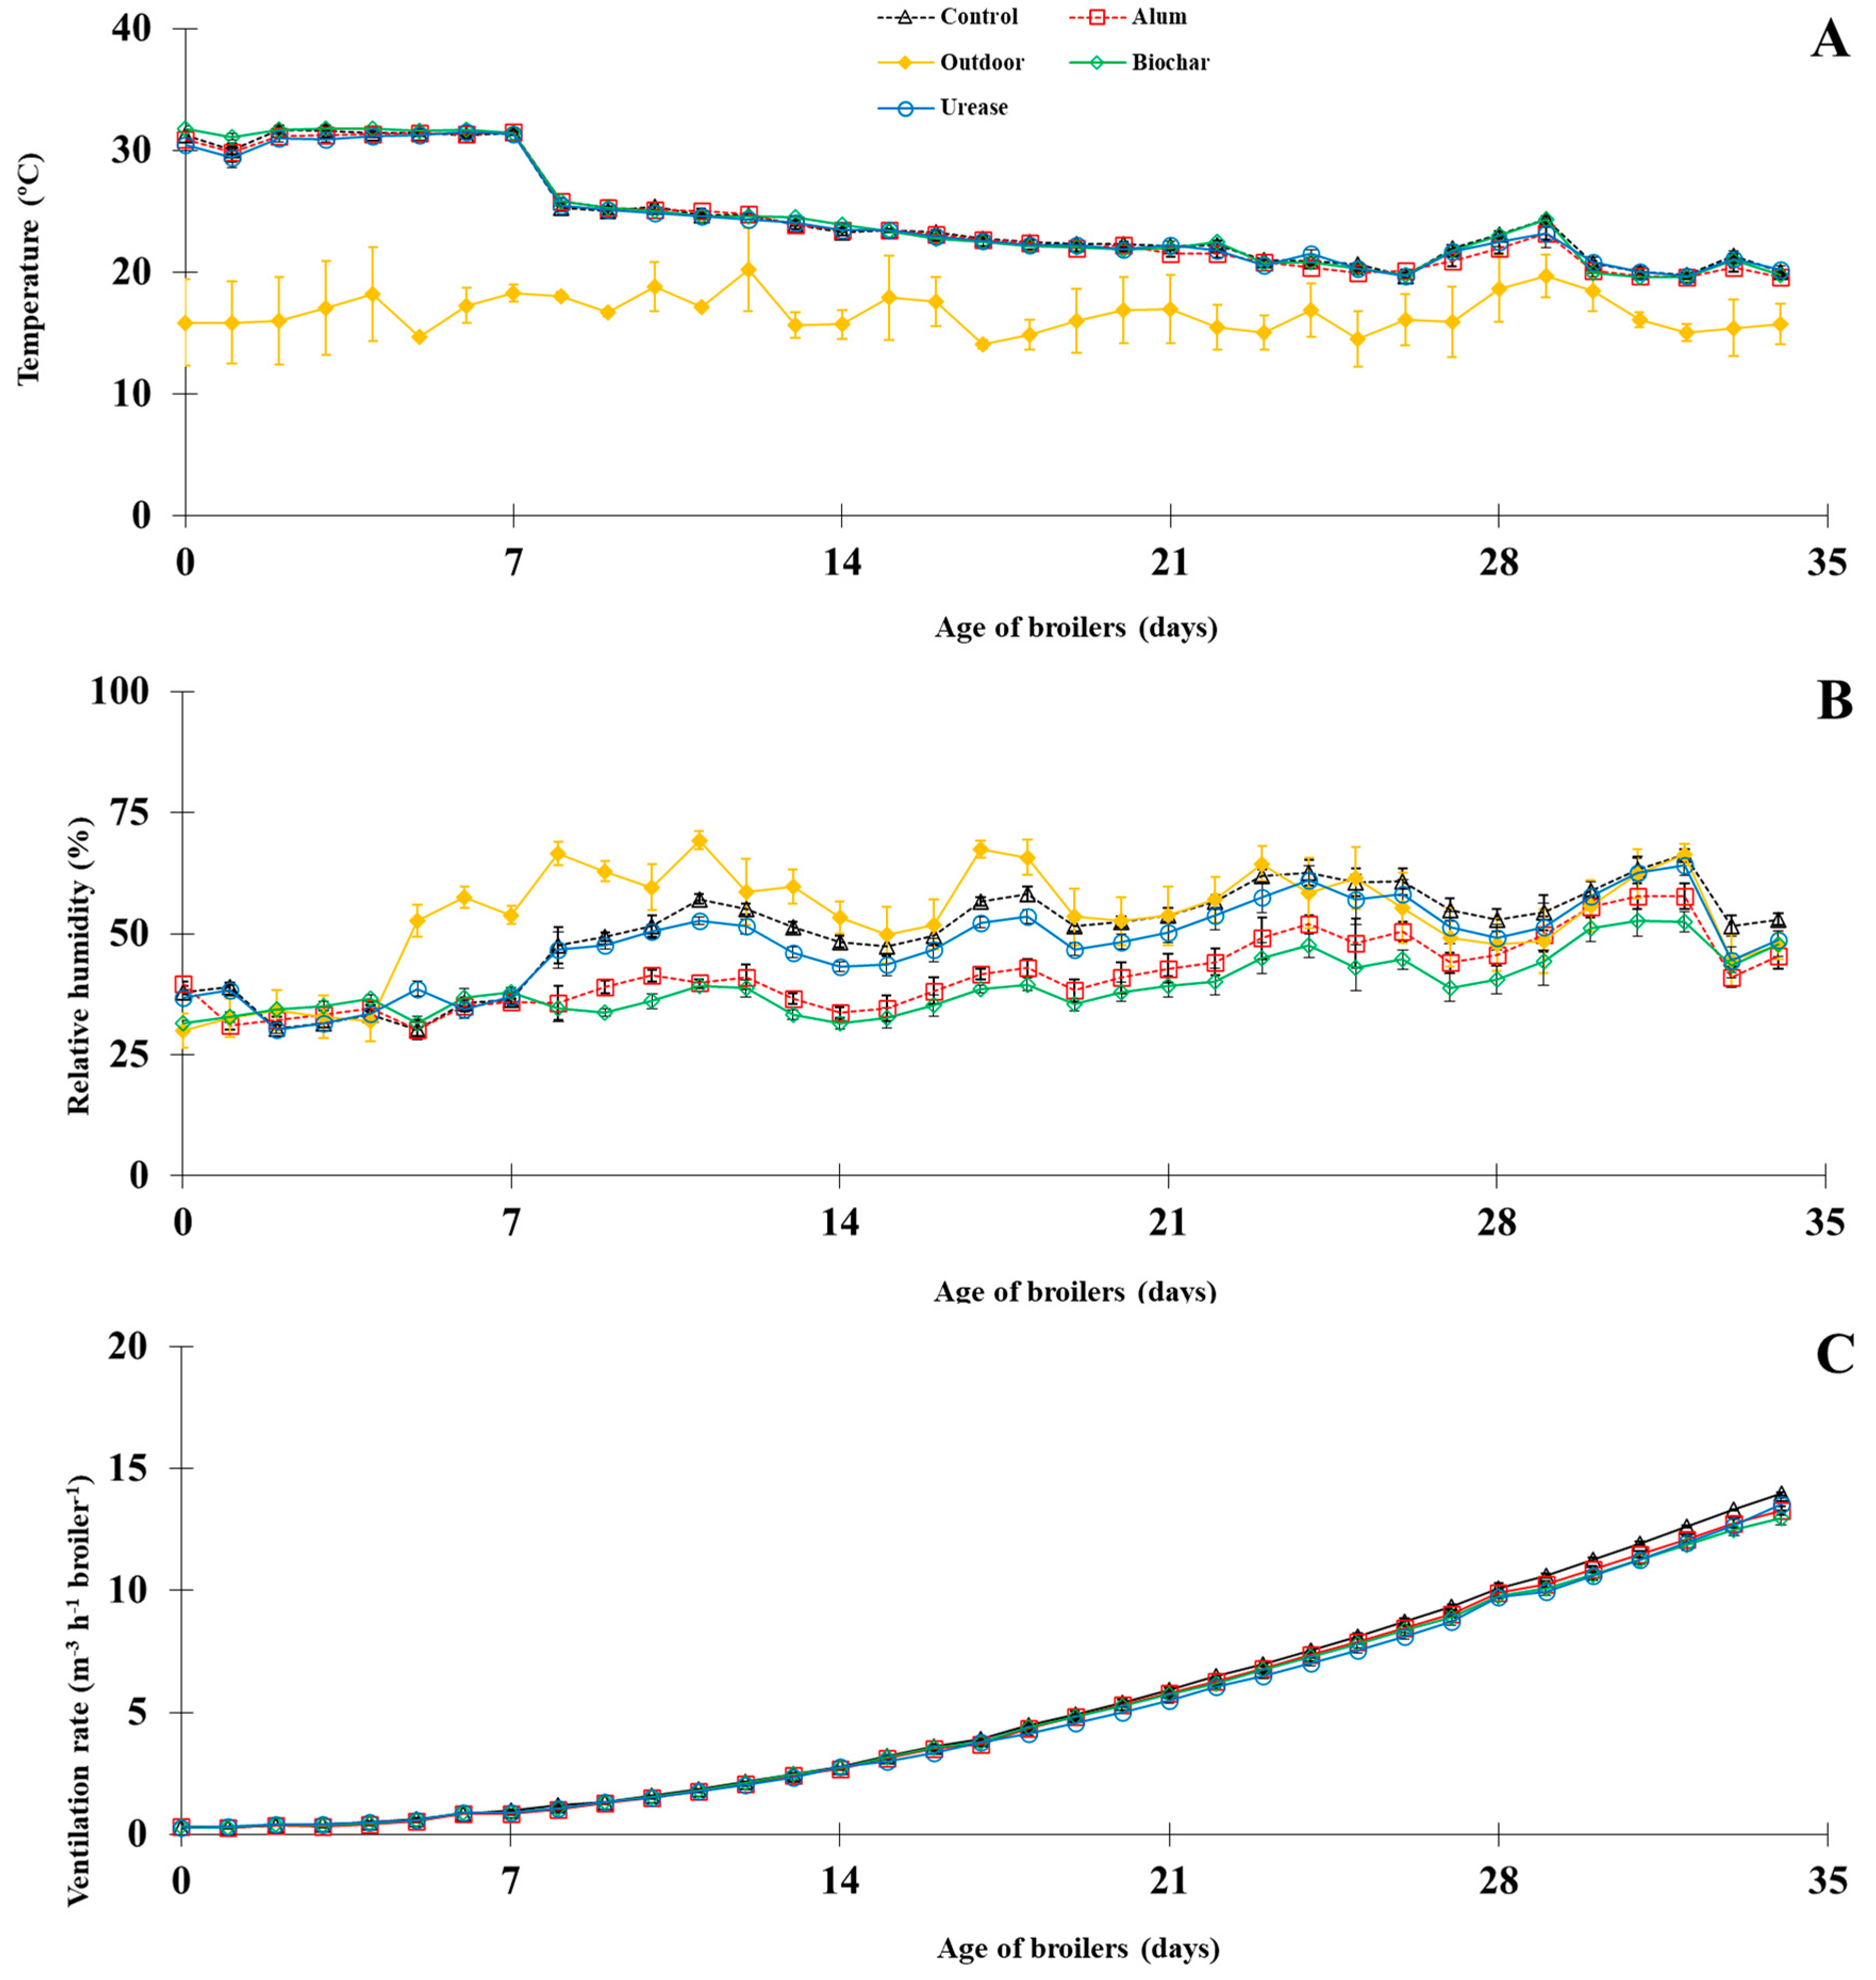
Figure 2.
Environmental parameters (temperature (A), relative humidity (B), and ventilation rate (C)) in the housing experiment treatments (vertical bars represent standard deviation of 24 h measurements).
Table 2.
Climatic variables and emission of gases from the housing experiment treatments (mean ± standard deviation).
The daily average outdoor temperature varied between 14 and 20 °C and the outdoor average relative humidity ranged from 30 to 70% during the 35 days of the fattening cycle (Figure 2A,B). There was no significant difference (p > 0.05) in daily average indoor temperature or ventilation rate for broilers in any treatment (Control, Alum, Biochar, and Urease) (Table 2 and Figure 2A,C). However, the average daily relative humidity was significantly lower (p < 0.05) by approximately 10% in the Alum and Biochar treatments when compared to the Control and Urease treatments (Table 2 and Figure 2B). From day 0 to day 35 of the fattening cycle, the average daily internal temperature dropped from 32 to 20 °C and the relative humidity varied from 30 to 67% in all treatments (Figure 2A,B). The lower values of indoor relative humidity in the Alum and Biochar treatments in relation to the Control and Urease treatments (Table 2 and Figure 2B) are due to the low humidity of these additives, which reduced the humidity of the litter material and, consequently, decreased the indoor relative humidity.
The ventilation rates (Figure 2C) and liveweights (Table 1) of broilers increased during the fattening cycle, with average daily values for all treatments ranging from 0.3 m3 h−1 broiler−1 on day 0 (45 g broiler−1) to 14.0 m3 h−1 broiler−1 on day 35 (2664 g broiler−1). The average ventilation rates reported in the present study (5.0 m3 h−1 broiler−1) are in line with previous studies [7,27], which reported that the ventilation rates increased with bird age and varied from 0.2 to 6.6 m3 h−1 broiler−1. In this study, the amended litter additives (Alum, Biochar, and Urease) had no significant effect on the performance and health of broilers compared to the Control (Table 1), which is in accordance with previous studies that added alum (8–15% w/w) [20,28], biochar (10–20% w/w) [21,29,30], or the urease inhibitor (0.28–3.50 mg m−2) [22,31] to housing facilities.
3.1.2. Ammonia and Greenhouse Gases
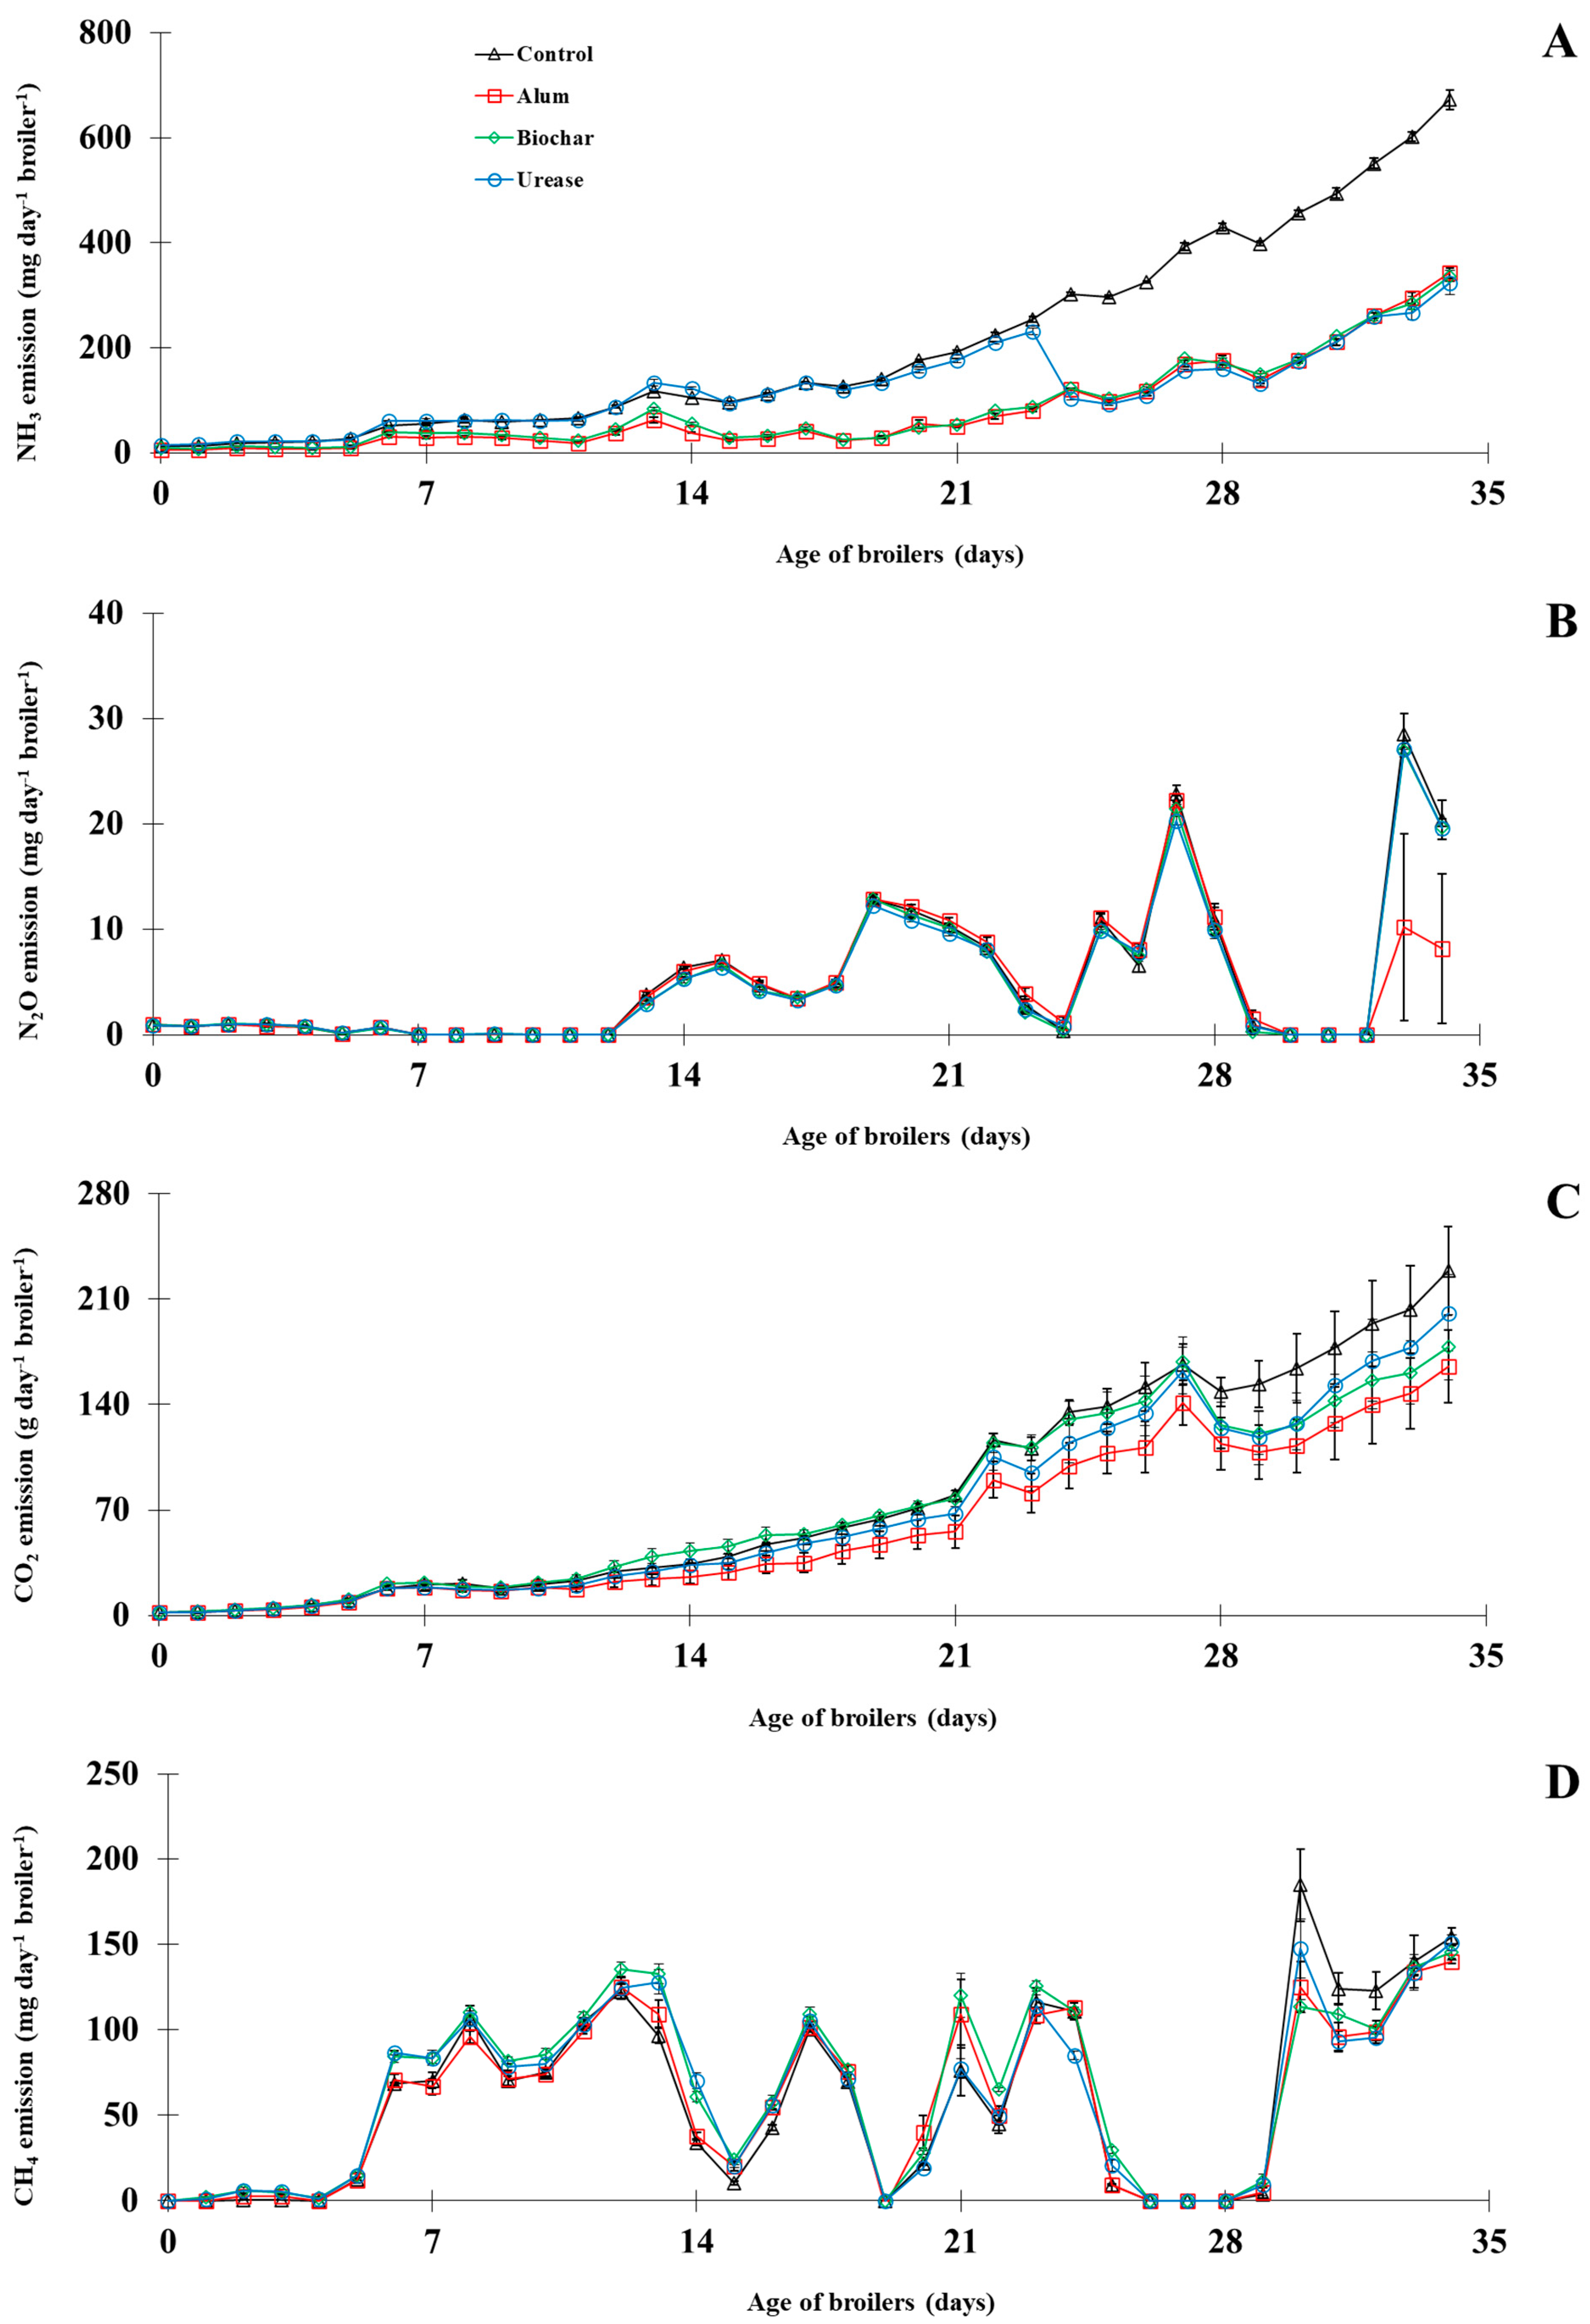
The daily fluxes of NH3 observed in the Control and amended treatments are shown in Figure 3A, with a progressive increase (6–672 mg day−1 broiler−1) from the beginning until the end of the fattening cycle observed. Comparatively to the Control treatment, the daily NH3 fluxes of the Urease treatment did not differ significantly (p > 0.05) in the first 24 days of the fattening cycle, being significantly reduced (p < 0.05) by 61% from day 25 until the end of the fattening cycle (Figure 3A). As can be seen in Table 2, the cumulative NH3 emissions were significantly reduced (p < 0.05) in the amended treatments compared to the Control, with reductions of 59% in the Alum or Biochar treatment and 41% in the Urease treatment.
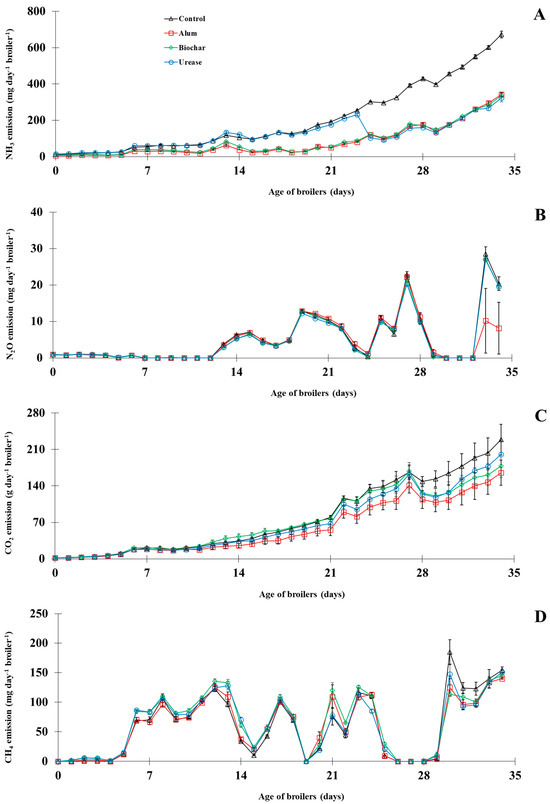
Figure 3.
Gaseous emissions (NH3 (A), N2O (B), CO2 (C), and CH4 (D)) from the housing experiment treatments (vertical bars represent standard deviation of 24 h measurements).
The factors that regulate NH3 volatilization in the broiler house environment are the litter type, animal activity, bird age and density, manure handling, frequency of manure removal, ventilation rate, and air velocity, while the factors that influence how manure bacteria and enzymes break down N to form NH3 are N content, temperature, moisture/humidity, and pH [6,10]. The addition of Alum to litter material led to the maintenance of low and stable pH (Table 3) and, consequently, to the reduction of 60% in NH3 losses observed in Table 2. This can be explained by the pH of the litter, which is an important factor in the regulation of NH3 volatilization since it specifies the relationship between volatile NH4+/NH3 and its ionic and non-volatile forms [32].
Table 3.
Physicochemical characteristics of the litter material in the housing experiment treatments (mean ± standard deviation).
The results of the present study are in line with previous studies that reported a reduction of 50–70% from the addition (8–15% w/w) of alum to litter material [11,20]. The application of Biochar to litter material enhances the NH4+ and NH3 binding and low humidity and reduces NH3 losses by 58% (Table 2) due to a high specific surface area and high cation exchange capacity [33]. Previous studies [30,34] reported that direct Biochar addition (10–20% w/w) to the litter had a positive effect on NH3 reduction, in accordance with this study. The addition of Urease blocked the enzyme activity in the litter because NH3 is the by-product of the five-step enzymatic degradation of uric acid [31], and then reduced NH3 losses by 41% (Table 2). This result is consistent with those of Singh et al. [31], who observed that the effect of urease inhibitor reduced NH3 losses from poultry litter for 7 days after the first application, and the persistency could be influenced by a change in manure characteristics over time. In the present study, there was a single application of urease at day 25 but the effect of the urease decreased with time, suggesting that the reapplication of urease (0.28–3.50 mg m−2) may be required, such as reported by other researchers in cattle or pig housing [22,35]. Comparing the three additives evaluated in the present study with the best available techniques to reduce NH3 losses by aluminum sulphate as a litter additive (a 50–70% reduction) in broiler housing [11], the present study suggests that Biochar (a 58% reduction) has the same potential as Alum to mitigate these losses and that the reapplication of Urease (a 41% reduction) may be required to reach an equal or higher reduction.
The daily N2O fluxes were not significantly different (p > 0.05) between the Control and amended treatments, being lower than 1 mg day−1 broiler−1 in the first 13 days and then increasing until the end of the fattening cycle (Figure 3B). After day 13, the daily N2O fluxes increased progressively in all treatments and varied between 3 and 29 mg day−1 broiler−1 on most measurement dates (Figure 3B). The cumulative N2O emissions were reduced in the amended treatments compared to the Control, with reductions of 14% in the Alum treatment and 6% in the Biochar and Urease treatment, although these differences were not statistically significant (p > 0.05) (Table 2).
The nitrification and denitrification processes are the source of N2O emissions, and these losses might be related to litter management (i.e., the interphase aerobic/anaerobic conditions of the litter), although the litter temperature and protein content in the diet could enhance the N2O loss [10]. The addition of Alum to litter material is usually associated with the inhibition of the nitrification/denitrification processes, whereas Biochar is associated with the adsorption of NH4+ and Urease to the preservation of NH4+, which can subsequently increase N2O emissions [12]. In this study, the addition of the additives (Alum, Biochar, and Urease) to litter material had no significant impact on the N2O emissions relative to non-amended litter (Table 2), which is consistent with previous studies [20,28] that reported no differences in N2O emissions from Alum-treated and untreated litter. No published studies were found to evaluate the effects of biochar and urease on GHG emissions in broiler houses. Nitrous oxide emissions were low for all treatments in this study (Table 2).
The daily CO2 fluxes in the Control and amended treatments increased from the beginning until the end of the fattening cycle and reached values between 2 and 229 g day−1 broiler−1 (Figure 3C). In addition, although not statistically significant (p > 0.05), the daily CO2 fluxes were reduced in the amended treatments relative to the Control by 21% for the Alum treatment and by 11% for the Urease treatment (Figure 3C). The cumulative CO2 emission of the Alum treatment decreased significantly (p < 0.05) by 26% in relation to the Control treatment, while this cumulative emission was approximately 11% lower in the Biochar and Urease treatment but not statistically significant (p > 0.05) (Table 2).
The CO2 emission has its sources in broiler respiration, uric acid/urea hydrolysis of excretions, and aerobic/anaerobic decomposition of litter material [6]. Previous studies [20,28] reported that adding Alum to litter material significantly lowered CO2 emissions from broiler houses by decreasing the microbial activity, which is in line with the present study where this loss was reduced by 26% relative to non-amended litter (Table 2). Other studies [14] reported that the addition of Biochar to animal manure could reduce CO2 emission due to either sorption into the biochar or a reduction in labile C availability. However, in this study, the lack of a significant effect of this additive was observed (Table 2). Carbon dioxide emissions occur from the aerobic degradation of uric acid as well as other organic compounds in the litter [28], although, in this study, the addition of Urease appears to have had no effect on CO2 emission (Table 2).
As can be observed in Figure 3D, the daily CH4 fluxes in the Control and amended treatments increased from the beginning to the end of the fattening cycle and reached values between 1 and 185 mg day−1 broiler−1; however, there were no significant differences (p > 0.05) between all treatments. Furthermore, cumulative CH4 emissions were not significantly different (p > 0.05) between the Control and amended treatments, although a small increase of 9% was observed in the Biochar treatment (Table 2).
The emission of CH4 occurs through the anaerobic decomposition of litter, where oxygen water contents, pH levels, and nutrient availability play key roles in CH4 production [28]. Previous studies [7,35] reported low CH4 emissions in broiler houses and this variability may be caused by differences in litter reactions in the broiler house during the growing period. The addition of Alum to litter material did not affect CH4 losses (Table 2), which is consistent with previous studies [20,28] that did not report any significant differences in CH4 emission between untreated and Alum-treated litter. The addition of Biochar could reduce CH4 emission due to its adsorption capacity, but in this study, CO2 emissions occurred mainly under aerobic conditions and no significant CH4 emissions were observed (Table 2). Pereira et al. [14] also did not report any significant differences in CH4 emissions between untreated and Biochar-treated animal manure. Similarly, the addition of Urease appears to have had no effect on CH4 emissions in this study (Table 2).
Compared to the Control treatment, the GWP of the Alum treatment was significantly reduced (p < 0.05) by 31%, whereas in the Biochar and Urease treatments, it was lower by approximately 25%, although these differences were not statistically significant (p > 0.05) (Table 2).
3.2. Gaseous Emissions in Storage
3.2.1. Composition of the Manures
The initial (0 days) and final (35 days) compositions of the litter material collected in the housing experiment are presented in Table 3. The initial pH values were not significantly different (p > 0.05) between the Control and Urease treatments (pH = 4.8), being significantly higher (p < 0.05) in the Biochar treatment (pH = 6.3) (Table 3). As can be observed in Table 3, the final (35 days) composition of the manures collected in the housing experiment and used in the subsequent storage experiment revealed no significant differences (p > 0.05) in pH, dry matter, NH4+-N, NO3−-N total C, total N, and the C/N ratio between the Control and amended treatments, although numerically higher values of total N and NH4+-N were observed for the Alum treatment and dry matter, total C, and the C/N ratio for the Biochar treatment.
Although the final (35 days) composition of the manures collected in the housing experiment revealed an absence of differences among treatments, the addition (0 days) of the additives changed the litter characteristics relative to non-amended litter (Table 3) because Alum acts by acidification [32], Biochar acts by NH4+ binding [33], and Urease acts by blocking the enzyme activity [31].
3.2.2. Ammonia and Greenhouse Gases
The daily fluxes of NH3 from Control and amended treatments during the storage experiment are shown in Figure 4A.
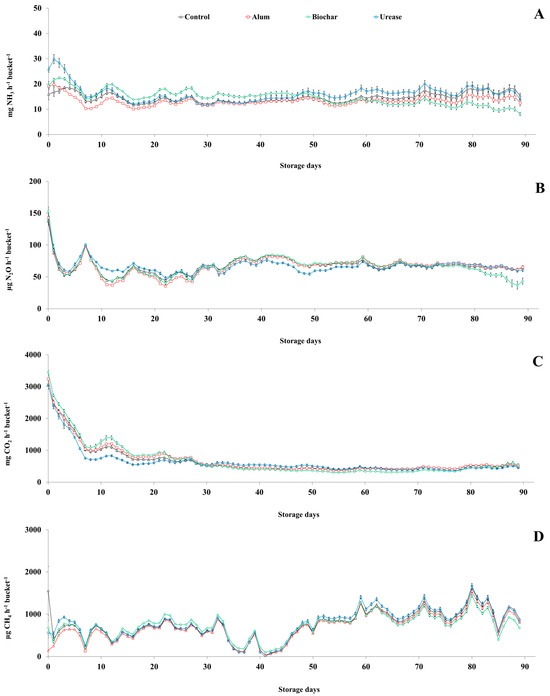
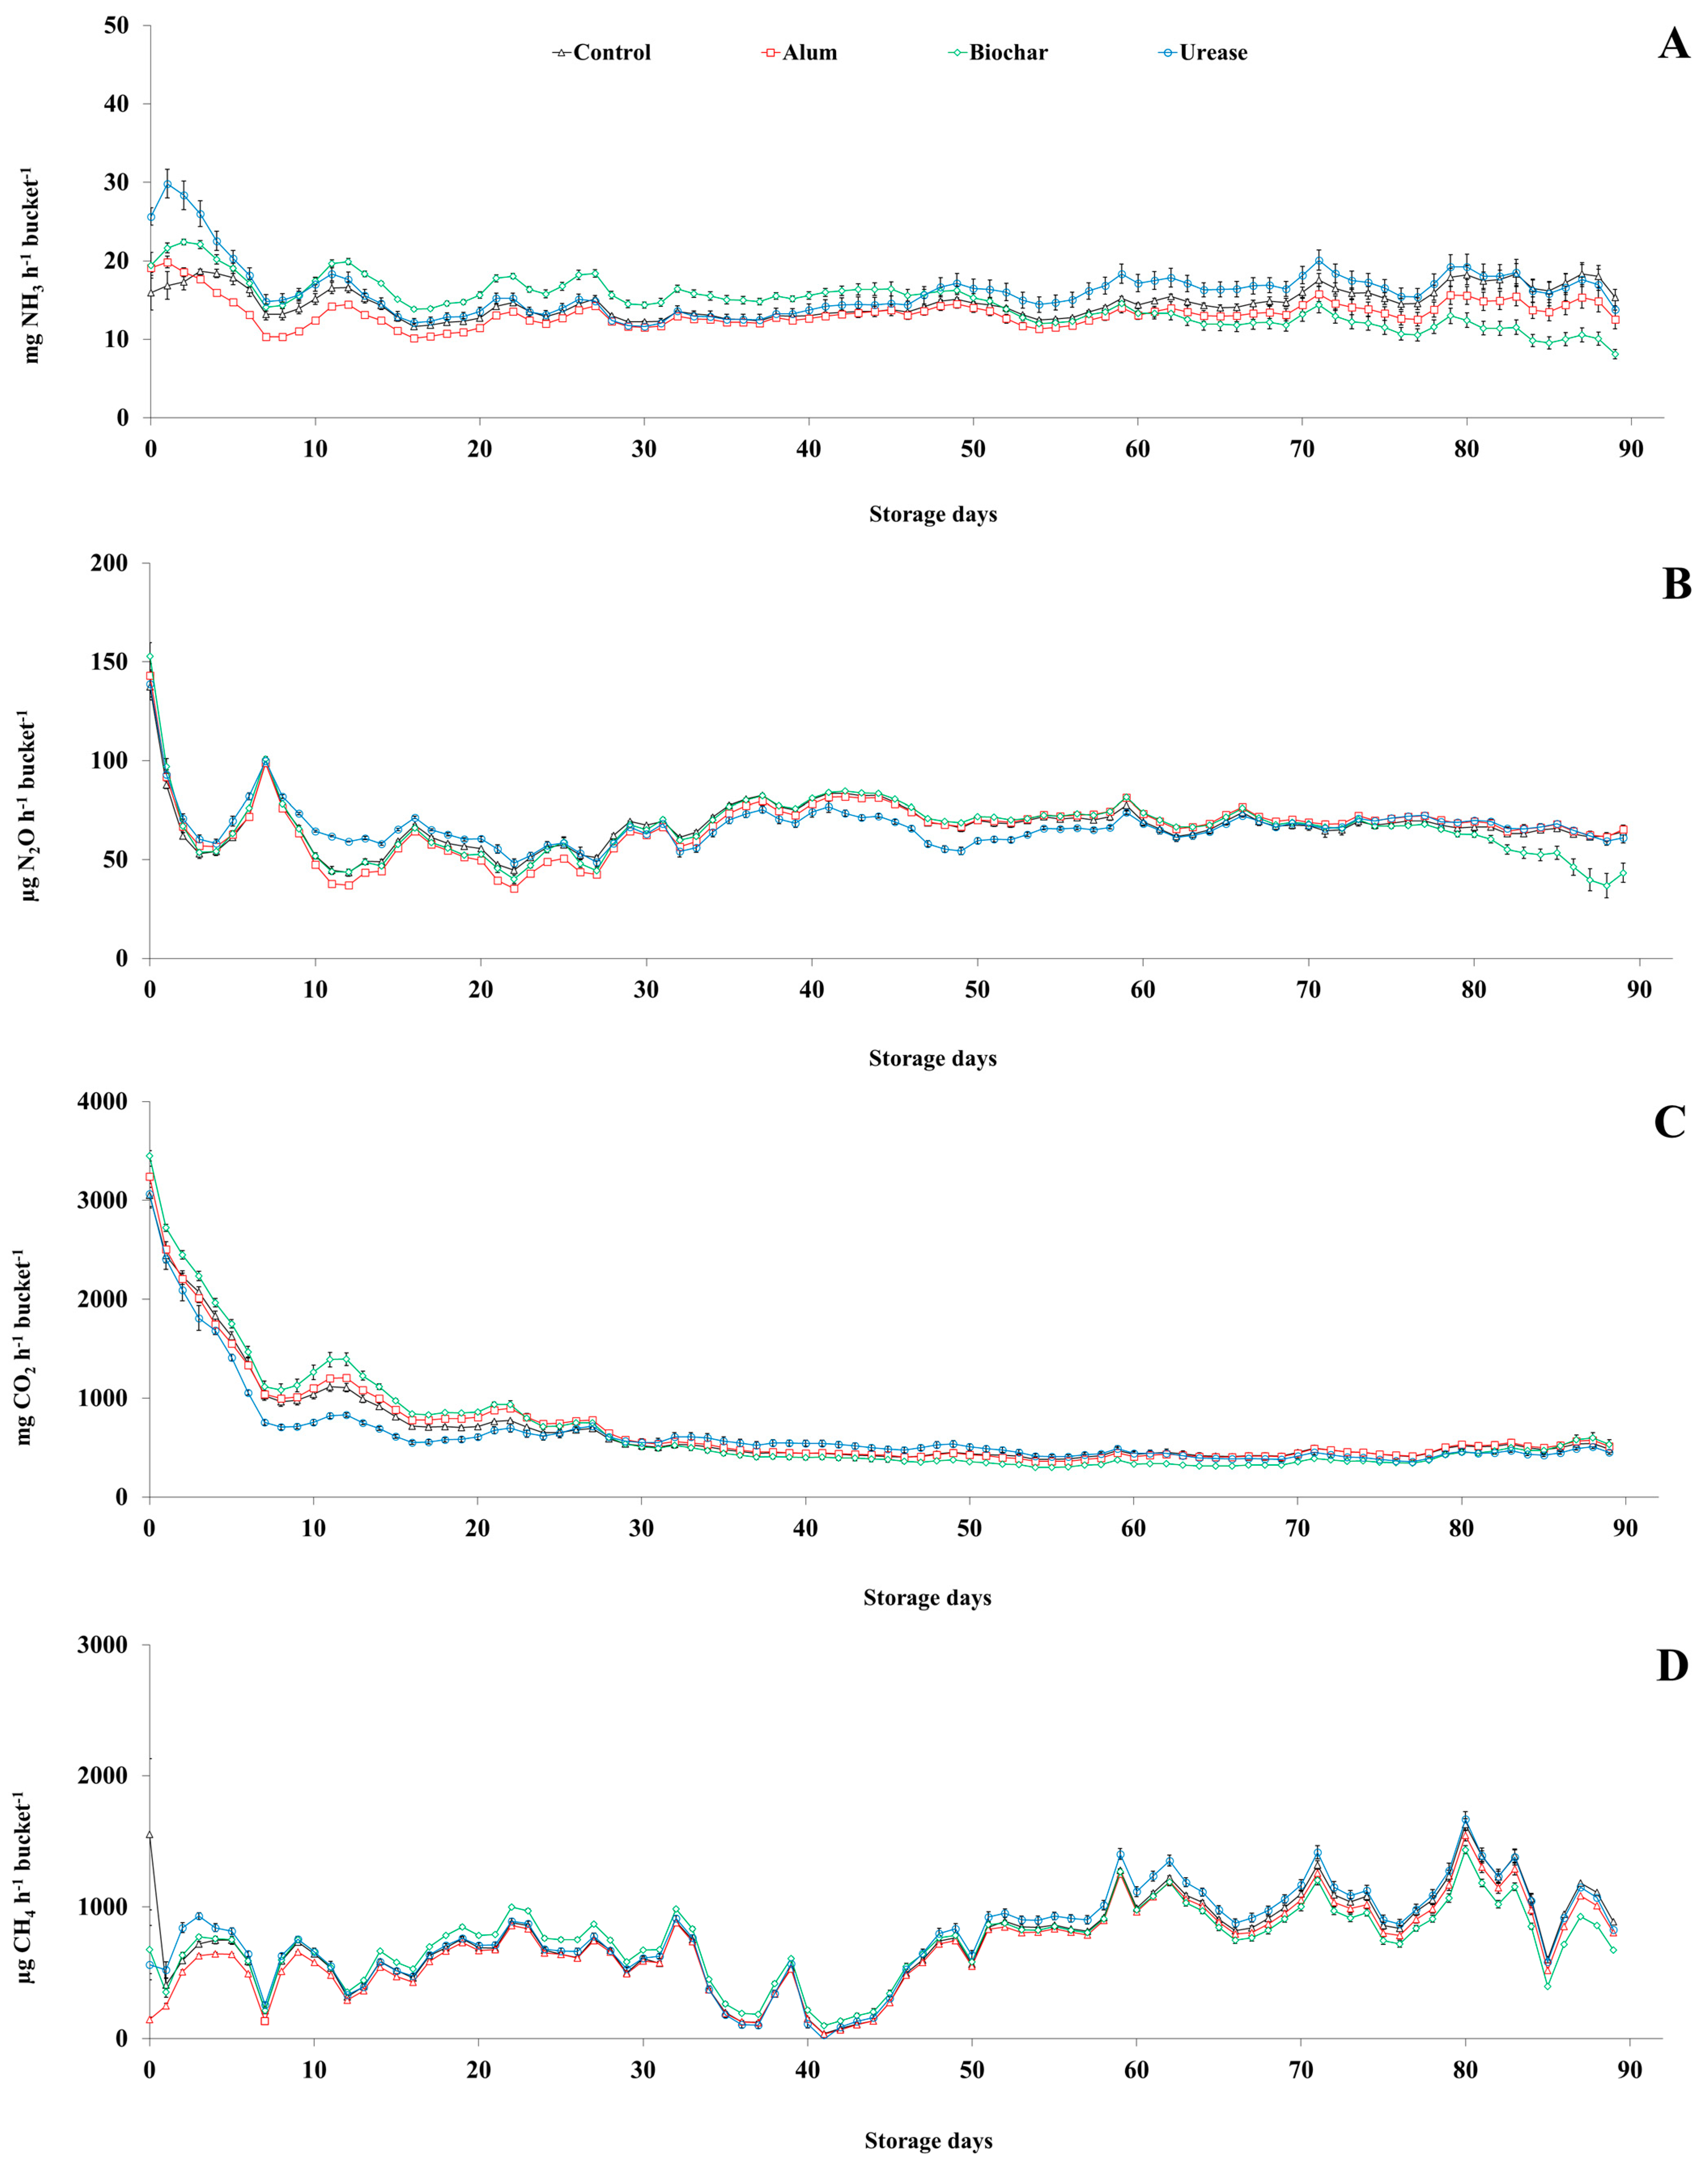
Figure 4.
Gaseous emissions (NH3 (A), N2O (B), CO2 (C), and CH4 (D)) from the storage experiment treatments (vertical bars represent standard deviation of 24 h measurements).
As can be seen, the daily NH3 fluxes follow the same trend, independently of the treatment, with a strong decrease (30 to 10 mg NH3 h−1 bucket−1) in the first 8 days, followed by a small decrease (20 to 8 mg NH3 h−1 bucket−1) until the end of the experiment (Figure 4A). Compared to the Control treatment, in the first 8 days of the experiment, the daily NH3 fluxes were significantly higher (p < 0.05) by approximately 38% in the Urease treatment and approximately 16% in the Biochar treatment, but significantly lower (p < 0.05) by approximately 4% in the Alum treatment (Figure 4A). Then, on most measurement dates, the daily NH3 fluxes from the Urease and Biochar treatments were significantly higher (p < 0.05) relative to the Control, with an increase of 10% on days 9–47 and 20% on days 48–90 (Figure 4A). From day 4 to the end of the experiment, the daily NH3 fluxes of the Alum treatment were significantly reduced (p < 0.05) by 10% compared to the Control treatment (Figure 4A). The cumulative NH3 emissions were reduced by 9% in the Alum treatment and increased by 11% in the Urease treatment when compared to the Control and Biochar treatments, despite these differences not being statistically significant (p > 0.05) (Table 4).
Table 4.
Cumulative gaseous emissions from the storage experiment treatments (mean ± standard deviation).
The daily N2O fluxes of the storage experiment are shown in Figure 4B and follow the same trend, independently of the treatment, with a sharp drop (153 to 52 µg N2O h−1 bucket−1) in the first 4 days, followed by a progressive decrease (85 to 35 µg N2O h−1 bucket−1) until the end of the experiment. Relative to the Control treatment, the Alum and Biochar treatments reduced daily N2O fluxes by 3–8% in the first 30 days, while the Urease treatment increased them by 10%, although this was not statistically different (p > 0.05) on most measurement days (Figure 4B). From that day until the end of the experiment, no significant differences (p > 0.05) were observed between the daily N2O fluxes of Control and amended treatments, with reductions below 4% (Figure 4B). The cumulative N2O emissions were not significantly different (p > 0.05) between all treatments (Table 4).
The daily CO2 fluxes from the Control and amended treatments are shown in Figure 4C, with higher fluxes (3449 to 707 mg CO2 h−1 bucket−1) being observed in the first 9 days, followed by a decrease (1390 to 451 mg CO2 h−1 bucket−1) until the end of the experiment. Compared to the Control treatment, the Alum and Biochar treatments significantly (p < 0.05) increased daily CO2 fluxes by 7–16% during the first 25 days of the experiment, while the Urease treatment significantly reduced them (p < 0.05) by 17% (Figure 4C). From day 26 to the end of the experiment, daily CO2 fluxes in the amended treatments did not differ significantly (p > 0.05) from the Control treatment (Figure 4C). Cumulative CO2 emissions in the amended treatments were not significantly different (p > 0.05) from the Control treatment, although a 6% decrease was observed in the Urease treatment (Table 4).
As can be observed in Figure 4D, higher CH4 fluxes were observed over the first 8 days of the experiment (1554 to 132 µg CH4 h−1 bucket−1), followed by a progressive increase (293 to 1184 µg CH4 h−1 bucket−1) until the end of the experiment. Compared to the Control treatment, in the first 8 days of the experiment, the daily CH4 fluxes were significantly lower (p < 0.05) by 7–30% in the Alum and Biochar treatments, but significantly higher (p < 0.05) by 11% in the Urease treatment (Figure 4D). Afterward, the daily CH4 fluxes were similar between the Control and amended treatments, with a reduction of approximately 4% for the Alum treatment and an increase of approximately 2–7% for the Biochar and Urease treatments (Figure 4D). Cumulative CH4 emissions from the Control and amended treatments did not differ significantly (p > 0.05), but an 8% reduction was observed in the Alum treatment (Table 4).
When expressed as a GWP, the cumulative emissions from the Alum treatment were lower by 5% when compared to the other treatments, although these differences were not statistically significant (p > 0.05) (Table 4).
Previous studies [36,37,38] reported that the storage of broiler manure can be a significant source of gaseous emissions, which can reach 10–20% of the total amount of N released for NH3 and 0–80 g broiler−1 year−1 for CH4. In the present study, these losses of NH3 and CH4 were 33.9 and 6.9 g broiler−1 year−1, respectively (Table 5).
Table 5.
Cumulative gaseous emissions from housing and subsequent storage experiment treatments (mean ± standard deviation).
Other studies [5,13,18,39,40,41] reported that the application of litter additives in the storage of broiler manure has been efficient in significantly reducing NH3 and GHG emissions. Nevertheless, their effectiveness varies, depending on the substance, dosage, and operational conditions [41]. On the other hand, gaseous emissions occur at all stages of manure management—housing, storage, processing, and recycling as fertilizer for crops after application in the field [12]. The relationship between manure NH3 volatilization and N2O emissions is also complex because emissions of both may be reduced by housing or storage, and if a mitigation technology reduces NH3 losses, the preserved NH4+ may later increase storage N2O emissions. Nevertheless, it is crucial to consider potential pollution swapping when planning and implementing mitigation measures [10].
3.3. Implications and Recommendations
The effects of different additives on the total gaseous emissions from housing and subsequent storage are shown in Table 5. As can be observed, the total NH3 emissions were significantly reduced (p < 0.05) in the amended treatments when compared to the Control, with reductions of approximately 40% in the Alum and Biochar treatments and 22% in the Urease treatment (Table 5). The total N2O or CH4 emissions of the Control and amended treatments did not differ significantly (p > 0.05), although a 13% reduction was observed for N2O in the Alum treatment (Table 5). The cumulative CO2 emissions were reduced in the amended treatments when compared to the Control, with a significant decrease (p < 0.05) of approximately 24% for the Alum treatment and a non-significant decrease (p > 0.05) of up to 12% for the Biochar and Urease treatments (Table 5). Cumulative GWP emissions were not significantly different (p > 0.05) between all treatments, although they were 8% lower in the Alum treatment (Table 5).
In this study, the litter additives were applied in housing during the fattening cycle (Alum and Biochar at 0 days against Urease at 25 days) to mitigate gaseous emissions at this stage. At the end of the fattening cycle (35 days), the manures were collected (Control and amended treatments) and subjected to a subsequent storage experiment in the next 90 days without receiving any extra dosage of additive. So, the absence of a significant effect on reducing the NH3 and GHG emissions could be explained by the fact that additives were added at the housing stage and the dosage applied did not significantly reduce or increase the gaseous emissions at the storage stage. Thus, the application of the additives at the housing stage is advantageous because it is important to consider the pollution swapping in the planning and implementation of mitigation measures [12]. The results showed that litter additive application in a single-stage approach was sufficient to mitigate housing emissions without increasing them in subsequent storage.
Previous studies [2,4,5,9,10,11,12,13] reported mitigation strategies to reduce gaseous emissions from poultry litter management like those in the UNECE guidance document. Alum is listed as a litter additive in the UNECE guidance document of the Best Available Techniques (BAT) to mitigate NH3 losses in broiler houses, but other additives are marketed to reduce losses but are not listed in the UNECE guidance document [11,12]. In this study, Biochar appears to be a good alternative to Alum due to its equal effectiveness in mitigating NH3 losses, without increasing the GWP potential in the housing and with additional advantages in the next stages of animal manure management, namely preserving fertilizer value and consequently increasing the availability of N for crop utilization after soil application [25].
Regarding the acquisition costs of each additive evaluated in the present study and excluding the costs of the application to the litter material, we estimate that Alum has a cost of 10€ per 1000 broilers, Biochar has a cost of 70€ per 1000 broilers, and Urease has a cost of 0.11€ per 1000 broilers. In terms of the application cost, Urease would be more expensive because it requires a specific housing spraying technology, while Alum and Biochar would be cheaper as they can be spread or mixed with the bedding material. Biochar would be more expensive than Alum, but it has several advantages due to the circular economy and the sustainability of broiler farming as well as the reduction in the amount of bedding needed.
4. Conclusions
The following conclusions can be obtained from the results of this study:
- At the housing stage, the results indicated that the NH3 emissions were significantly reduced by 40–60% by litter additives (Alum, Biochar, and Urease), while GWP emissions were significantly reduced by 31% by Alum. Furthermore, the addition of Biochar (a 58% reduction) had the same significant effect as Alum (a 60% reduction) to mitigate these losses. The reapplication of Urease (a 41% reduction) may be required to reach an equal or higher reduction.
- At the storage stage, the NH3 and GWP emissions were not significantly affected by the litter additives.
- At the combined housing and subsequent manure storage stages, the NH3 emissions were significantly reduced by 22–41% by litter additives, whereas GWP emissions were not significantly reduced.
- Overall, it can be concluded that Biochar appears to be a good alternative to Alum due to its equal effectiveness in mitigating NH3 losses, without increasing the GWP potential in the housing stage and avoiding pollution swapping. However, Biochar seems to be more expensive, although it has additional advantages related to the circular economy.
Author Contributions
Conceptualization, J.L.S.P. and H.T.; methodology, J.L.S.P., F.M., G.B., C.G., J.T. and H.T.; software, J.L.S.P., F.M., G.B., C.G., J.T. and H.T.; validation, J.L.S.P., F.M., G.B., C.G., J.T. and H.T.; formal analysis, J.L.S.P., F.M., G.B., C.G, J.T. and H.T.; investigation, J.L.S.P., F.M., G.B., C.G., J.T. and H.T.; resources, J.L.S.P., F.M., G.B., C.G., J.T. and H.T.; data curation, J.L.S.P., F.M., G.B., C.G., J.T. and H.T.; writing—original draft preparation, J.L.S.P.; writing—review and editing, J.L.S.P., F.M., G.B., C.G., J.T. and H.T.; visualization, J.L.S.P., F.M., G.B., C.G., J.T. and H.T.; supervision, J.L.S.P. and H.T.; project administration, J.L.S.P. and H.T.; funding acquisition, J.L.S.P., J.T. and H.T. All authors have read and agreed to the published version of the manuscript.
Funding
This research was funded by National Funds from the FCT—Portuguese Foundation for Science and Technology, under the projects UIDB/04033/2020 (https://doi.org/10.54499/UIDB/04033/2020) and UIDB/00681/2020 (https://doi.org/10.54499/UIDB/00681/2020) and the project FEEDVALUE PRR-C05-i03-I-000242.
Data Availability Statement
All data generated or analyzed during this study are included in this published article.
Acknowledgments
The authors acknowledge Savibel—Sociedade Avícola, S.A. for the broilers and feeding and Ibero Massa Florestal, S.A. for the litter additives.
Conflicts of Interest
The authors declare no conflicts of interest.
References
- INE. Estatísticas Agrícolas 2020; Instituto Nacional de Estatística (INE): Lisbon, Portugal, 2020; p. 181.
- IPCC. Refinement to the 2006 IPCC Guidelines for National Greenhouse Gas Inventories; Calvo Buendia, E., Tanabe, K., Kranjc, A., Baasansuren, J., Fukuda, M., Ngarize, S., Osako, A., Pyrozhenko, Y., Shermanau, P., Federici, S., Eds.; IPCC: Geneva, Switzerland, 2019. Available online: http://www.ipcc-nggip.iges.or.jp (accessed on 23 June 2024).
- Barnes, A.P.; Stockdale, E.; Norton, L.; Eory, V.; Macleod, M.; Buys, G. Achieving cleaner growth in agriculture: Establishing feasible mitigation through a bottom-up approach. J. Clean. Prod. 2024, 454, 142287. [Google Scholar] [CrossRef]
- EC. Best Available Techniques (BAT) Reference Document for the Intensive Rearing of Poultry or Pigs: Industrial Emissions Directive 2010/75/EU (Integrated Pollution Prevention and Control); European Commission (EC): Seville, Spain, 2017. JRC107189. p. 858. Available online: https://data.europa.eu/doi/10.2760/020485 (accessed on 23 June 2024).
- Naseem, S.; King, A.J. Ammonia production in poultry houses can affect health of humans, birds, and the environment-techniques for its reduction during poultry production. Environ. Sci. Pollut. Res. 2018, 25, 15269–15293. [Google Scholar] [CrossRef] [PubMed]
- Méda, B.; Hassouna, M.; Aubert, C.; Robin, P.; Dourmad, J.Y. Influence of rearing conditions and manure management practices on ammonia and greenhouse gas emissions from poultry houses. World’s Poult. Sci. J. 2011, 67, 441–456. [Google Scholar] [CrossRef]
- Pereira, J.L.S.; Ferreira, S.; Pinheiro, V.; Trindade, H. Effect of magnesium sulphate addition to broiler litter on the ammonia, nitrous oxide, carbon dioxide and methane emissions from housing. Atmos. Pollut. Res. 2019, 10, 1284–1290. [Google Scholar] [CrossRef]
- FAO. World Food and Agriculture—Statistical Yearbook 2021; Food and Agriculture Organization of the United Nations (FAO): Rome, Italy, 2021; p. 368. [Google Scholar]
- Hassouna, M.; van der Weerden, T.J.; Beltran, I.; Amon, B.; Alfaro, M.A.; Anestis, V.; Cinar, G.; Dragoni, F.; Hutchings, N.J.; Leytem, A.; et al. DATAMAN: A global database of methane, nitrous oxide, and ammonia emission factors for livestock housing and outdoor storage of manure. J. Environ. Qual. 2023, 52, 207–223. [Google Scholar] [CrossRef] [PubMed]
- Pereira, J.L.S.; Garcia, C.; Trindade, H. Review of measures to control airborne pollutants in broiler housing. In Air Pollution—Latest Status and Current Developments [Working Title]; Eyvaz, M., Albahnasawi, A., Alazaiza, M.Y.D., Eds.; IntechOpen: London, UK, 2023. [Google Scholar] [CrossRef]
- Bittman, S.; Dedina, M.; Howard, C.M.; Oenema, O.; Sutton, M.A. Options for Ammonia Mitigation: Guidance from the UNECE Task Force on Reactive Nitrogen; Project Reference: CEH Project no. C04910; NERC/Centre for Ecology & Hydrology: Edinburgh, UK, 2014; p. 83. [Google Scholar]
- Sutton, M.A.; Howard, C.M.; Mason, K.E.; Brownlie, W.J.; Cordovil, C.M.d.S. (Eds.) Nitrogen Opportunities for Agriculture, Food & Environment. UNECE Guidance Document on Integrated Sustainable Nitrogen Management; UK Centre for Ecology & Hydrology: Edinburgh, UK, 2022; p. 157. ISBN 978-1-906698-78-2. [Google Scholar]
- Bist, R.B.; Subedi, S.; Chai, L.; Yang, X. Ammonia emissions, impacts, and mitigation strategies for poultry production: A critical review. J. Environ. Manag. 2023, 328, 116919. [Google Scholar] [CrossRef] [PubMed]
- Pereira, J.L.S.; Perdigão, A.; Marques, F.; Wessel, D.F.; Trindade, H.; Fangueiro, D. Mitigating Ammonia and Greenhouse Gas Emissions from Stored Pig Slurry Using Chemical Additives and Biochars. Agronomy 2022, 12, 2744. [Google Scholar] [CrossRef]
- Cockerill, S.A.; Gerber, P.F.; Walkden-Brown, S.W.; Dunlop, M.W. Suitability of litter amendments for the Australian chicken meat industry. Anim. Prod. Sci. 2020, 60, 1469–1481. [Google Scholar] [CrossRef]
- Ni, J.Q.; Erasmus, M.A.; Croney, C.C.; Li, C.; Li, Y. A critical review of advancement in scientific research on food animal welfare-related air pollution. J. Hazard. Mater. 2021, 408, 124468. [Google Scholar] [CrossRef]
- EN 13040; Soil Improvers and Growing Media—Sample Preparation for Chemical and Physical Tests, Determination of Dry Matter Content, Moisture Content and Laboratory Compacted Bulk Density. European standards (ES) 13040. European Committee for Standardization: Brussels, Belgium, 1999.
- EN 13654-1; Soil Improvers and Growing Media—Determination of Nitrogen—Part 1: Modified Kjeldahl Method. European Standards (ES) 13654-1. European Committee for Standardization: Brussels, Belgium, 2002.
- EN 13652; Soil Improvers and Growing Media—Extraction of Water Soluble Nutrients and Elements. European Standards (ES) 13652. European Committee for Standardization: Brussels, Belgium, 2002.
- Eugene, B.; Moore, P.A., Jr.; Li, H.; Miles, D.M.; Trabue, S.; Burns, R.; Buser, M. Effect of alum additions to poultry litter on in-house ammonia and greenhouse gas concentrations and emissions. J. Environ. Qual. 2015, 44, 1530–1540. [Google Scholar] [CrossRef]
- Osman, A.I.; Fawzy, S.; Farghali, M.; El-Azazy, M.; Elgarahy, A.M.; Fahim, R.A.; Maksoud, M.I.A.A.; Ajlan, A.A.; Yousry, M.; Saleem, Y.; et al. Biochar for agronomy, animal farming, anaerobic digestion, composting, water treatment, soil remediation, construction, energy storage, and carbon sequestration: A review. Environ. Chem. Lett. 2022, 20, 2385–2485. [Google Scholar]
- Hagenkamp-Korth, F.; Haeussermann, A.; Hartung, E. Effect of urease inhibitor application on urease activity in three different cubicle housing systems under practical conditions. Agric. Ecosyst. Environ. 2015, 202, 168–177. [Google Scholar] [CrossRef]
- CR. Commission Regulation No 889/2008 of 5 September 2008 laying down detailed rules for the implementation of Council Regulation No 834/2007 on organic production and labelling of organic products with regard to organic production, labelling and control. Off. J. Eur. Union 2008, 250, 1–84. Available online: http://data.europa.eu/eli/reg/2008/889/oj (accessed on 23 June 2024).
- EN 13037; Soil Improvers and Growing Media—Determination of pH. European Standards (ES) 13037. European Committee for Standardization: Brussels, Belgium, 2011.
- Pereira, J.L.S.; Figueiredo, V.; Pinto, A.F.M.A.; Silva, M.E.F.; Brás, I.; Perdigão, A.; Wessel, D.F. Effects of biochar and clinoptilolite on composition and gaseous emissions during the storage of separated liquid fraction of pig slurry. Appl. Sci. 2020, 10, 5652. [Google Scholar] [CrossRef]
- NREAP. Decree number 81/2013 of 14 June regarding new regime to perform the livestock activity. In Diário da República; 113; Portugal, 2013; pp. 3304–3329. Available online: https://diariodarepublica.pt/dr/detalhe/decreto-lei/81-2013-496729 (accessed on 23 June 2024).
- Calvet, S.; Cambra-Lopez, M.; Estelles, F.; Torres, A.G. Characterization of gas emissions from a Mediterranean broiler farm. Poult. Sci. 2011, 90, 534–542. [Google Scholar] [CrossRef]
- Anderson, K.; Moore, P.A., Jr.; Martin, J.; Ashworth, A.J. Evaluation of a novel poultry litter amendment on greenhouse gas emissions. Atmosphere 2021, 12, 563. [Google Scholar] [CrossRef]
- Ritz, C.W.; Tasistro, A.S.; Kissel, D.E.; Fairchild, B. Evaluation of surface-applied char on the reduction of ammonia volatilization from broiler litter. J. Appl. Poult. Res. 2011, 20, 240–245. [Google Scholar] [CrossRef]
- Linhoss, J.E.; Purswell, J.L.; Street, J.T.; Rowland, M.R. Evaluation of biochar as a litter amendment for commercial broiler production. J. Appl. Poult. Res. 2019, 28, 1089–1098. [Google Scholar] [CrossRef]
- Singh, A.; Casey, K.D.; King, W.D.; Pescatore, A.J.; Gates, R.S.; Ford, M.J. Efficacy of urease inhibitor to reduce ammonia emission from poultry houses. J. Appl. Poult. Res. 2009, 18, 34–42. [Google Scholar] [CrossRef]
- Swelum, A.A.; El-Saadony, M.T.; Abd El-Hack, M.E.; Ghanima, M.M.A.; Shukry, M.; Alhotan, R.A.; Hussein, E.O.; Suliman, G.M.; Ba-Awadh, H.; Ammari, A.A. Ammonia emissions in poultry houses and microbial nitrification as a promising reduction strategy. Sci. Total Environ. 2021, 781, 146978. [Google Scholar] [CrossRef]
- Agyarko-Mintah, E.; Cowie, A.L.; Van Zwieten, L.; Singh, B.-P.; Smillie, R.; Harden, S.; Fornasier, F. Biochar lowers ammonia emission and improves nitrogen retention in poultry litter composting. Waste Manag. 2017, 61, 129–137. [Google Scholar] [CrossRef] [PubMed]
- Kalus, K.; Konkol, D.; Korczyński, M.; Koziel, J.A.; Opaliński, S. Laying hens biochar diet supplementation—Effect on performance, excreta N content, NH3 and VOCs emissions, Egg Traits and Egg Consumers Acceptance. Agriculture 2020, 10, 237. [Google Scholar] [CrossRef]
- Calvet, S.; Arrufat, B.; Salaet, I.; Atares, S.; Sobreviela, A.; Herrero, C.; Romero, J.; Estellés, F. A urease inhibitor reduces ammonia emission in fattening pigs reared on slatted floor in summer conditions. Biosyst. Eng. 2022, 221, 43–53. [Google Scholar] [CrossRef]
- Rodhe, L.; Karlsson, S. Ammonia emissions from broiler manure—Influence of storage and spreading method. Biosyst. Eng. 2002, 82, 455–462. [Google Scholar] [CrossRef]
- Drozdz, D.; Wystalska, K.; Malinska, K.; Grosser, A.; Grobelak, A.; Kacprzak, M. Management of poultry manure in Poland—Current state and future perspectives. J. Environ. Manag. 2020, 264, 110327. [Google Scholar] [CrossRef] [PubMed]
- Kreidenweis, U.; Breier, J.; Herrmann, C.; Libra, J.; Prochnow, A. Greenhouse gas emissions from broiler manure treatment options are lowest in well-managed biogas production. J. Clean. Prod. 2021, 280, 124969. [Google Scholar] [CrossRef]
- Li, H.; Xin, H.; Liang, Y.; Burns, R.T. Reduction of ammonia emissions from stored laying hen manure through topical application of zeolite, Al+ Clear, Ferix-3, or poultry litter treatment. J. Appl. Poult. Res. 2008, 17, 421–443. [Google Scholar] [CrossRef]
- Brouček, J.; Čermák, B. Emission of harmful gases from poultry farms and possibilities of their reduction. Ekológia 2015, 3, 89–100. [Google Scholar] [CrossRef]
- Pardo, G.; Moral, R.; Aguilera, E.; del Prado, A. Gaseous emissions from management of solid waste: A systematic review. Glob. Change Biol. 2015, 21, 1313–1327. [Google Scholar] [CrossRef]

Disclaimer/Publisher’s Note: The statements, opinions and data contained in all publications are solely those of the individual author(s) and contributor(s) and not of MDPI and/or the editor(s). MDPI and/or the editor(s) disclaim responsibility for any injury to people or property resulting from any ideas, methods, instructions or products referred to in the content. |
© 2024 by the authors. Licensee MDPI, Basel, Switzerland. This article is an open access article distributed under the terms and conditions of the Creative Commons Attribution (CC BY) license (https://creativecommons.org/licenses/by/4.0/).