Article

Gibberellins Regulate Expression of Cyclins to Control Leaf Width in Rice

1
Shenzhen Branch, Guangdong Laboratory of Lingnan Modern Agriculture, Genome Analysis Laboratory of the Ministry of Agriculture and Rural Affairs, Agricultural Genomics Institute at Shenzhen, Chinese Academy of Agricultural Sciences, Shenzhen 518120, China
2
College Plant Science and Technology, Huazhong Agricultural University, Wuhan 430070, China
*
Author to whom correspondence should be addressed.
Agronomy 2024, 14(7), 1597; https://doi.org/10.3390/agronomy14071597
Submission received: 11 April 2024 / Revised: 26 June 2024 / Accepted: 2 July 2024 / Published: 22 July 2024
(This article belongs to the Section Plant-Crop Biology and Biochemistry)

Abstract

:
Leaves are the nutritive organs of rice. Leaf shape influences rice photosynthesis, subsequently impacting yield. Gibberellins, GAs, are important hormones, but the way in which GAs regulate leaf width is largely unknown. This study focuses on the d18 mutant with broader leaves due to defective GA biosynthesis. Statistical analysis indicates broader leaves in the d18 mutant compared to the wild-type group. An examination of leaf cell morphology shows a higher count of secondary vascular bundles in d18 than in the wild-type group. RNA-seq analysis demonstrates significantly higher expression of CYCB (CYCLIN B) and H4 (HISTONE H4) in d18 compared to wild type. In summary, the leaf width of d18 may due to a higher activity of cell division at leaf margin.

1. Introduction

Leaves are a crucial element of a plant’s above-ground structure, playing a central role in photosynthesis. There is a significant correlation between photosynthetic efficiency and leaf morphology. Leaf development involves processes such as cell division, expansion, the establishment of developmental polarity, and tissue [1]. Recent research has systematically documented the developmental progression of rice leaves, outlining six stages from initiation to maturity [2].
In the initial stage, leaves initiate within the shoot apical meristem as leaf primordia. The rate of division in leaf primordia surpasses that in the SAM region, leading to outward growth from the SAM. Subsequently, in the second phase post leaf primordium formation, the leaf begins its upward growth towards the apical meristem. During the third stage, as the leaf primordium’s edge covers the shoot apical meristem, the apex of the leaf primordium extends further. Subsequently, in the fourth stage, differentiation occurs as the ligule primordium emerges at the leaf sheath boundary. Moving to the fifth stage, there is a rapid elongation of the leaf sheath. Finally, in the sixth stage, there is uneven elongation of cells on both the anterior and posterior sides of the leaf [2,3,4].
Leaf development is regulated by various plant hormones such as auxin and gibberellins. Gibberellins are endogenous plant hormones that regulate various growth and developmental processes, such as seed germination, stem elongation, tillering, leaf development, and reproductive organ maturation. These hormones also influence plants’ stress tolerance mechanism [5]. Initially, GGDP, the precursor for gibberellin synthesis, undergoes catalysis within the plastid by two terpenoid synthases, TPS, enantiomeric CPS, and KS, forming enantioent-kaurene, a tetracyclic hydrocarbon intermediate. Following plastid synthesis, the enzymes ent-kaurene oxidase (KO) and ent-kaurenoic acid oxidase (KAO) further process KO into GA12 in the endoplasmic reticulum through a two-step catalytic reaction. Ultimately, GA12 undergoes catalysis by 2ODDS in the cytoplasm to produce biologically active GA1 and GA4. Key enzymes contributing to catalytic synthesis include GA13OX, GA20OX, and GA3OX [6,7]. The OsD18 gene encodes GA3OX synthase, facilitating the conversion of GA20 to GA1 and GA9 to GA4, demonstrating carboxylase activity [8].
Furthermore, OsD18 is primarily expressed in the tapetum during the final phases of pollen differentiation. Although present in the tapetum at this juncture, the gene’s expression level is notably subdued. These findings imply that OsD18 plays a pivotal role in GA4 biosynthesis within anthers, providing a plausible rationale for the observed GA4 accumulation in d18 plants’ anthers [9]. Nevertheless, the mechanism behind leaf-width development related to the OsD18 gene remains unexplored. Researches indicate diverse roles of gibberellins in plant structures, distinguishing functions between underground and aerial components. Within the root apical meristem, gibberellins support cell proliferation, whereas in the shoot apical meristem, they impede cellular activity and proliferation [10]. KNOX1 gene exhibits specific expression within the SAM region, sustaining stem apical meristem activity. In Arabidopsis thaliana, KNOX1 intertwines with the gibberellin and cytokinin pathways, regulating elevated cytokinin levels and reduced gibberellin levels within the plant’s SAM. This is achieved by suppressing gibberellin synthesis while inducing the expression of cytokinin synthesis genes [11].
In additions, leaf development is regulated by a series of genes and pathways. First, OsNAL2 is a gene linked to the midrib development of rice leaves. Scientists’ investigations have primarily centered on leaf sheath cell nuclear strain height characteristics and do not address OsNAL2’s impact on GA regulation within leaves [12,13]. Second, scholars have demonstrated that the TCP gene families contribute to multilayered regulated leaf development [14]. Third, Class III homeodomain-leucine zipper (HD-ZIP III) proteins are the most extensively studied transcription factors involved in leaf development [15]. Moreover, ARF4 and ETT2 can regulate leaf development in Arabidopsis thaliana [16]. In Arabidopsis thaliana, FILAMENTOUS FLOWER (FIL) and YABBY3 (YAB3) encode YABBY domain proteins that regulate abaxial patterning, the growth of lateral organs, and inflorescence phyllotaxy. We want to explore the relationship between these genes and GAs, and how to control leaf development.
Last but not least, GAs’ regulation of leaf development may affect cell-cycle activity. The cell cycle denotes the period from parental cell division initiation to daughter cell division completion, involving the cell’s complete cycle. Scholars typically categorize the plant cell mitosis cycle into four phases: G1, S, G2, and M. Like in other eukaryotes, cyclins and cyclin-dependent kinases act as key regulatory factors in the plant cell cycle. Various CDKs and CYCs combine to form unique CYC-CDK complexes, triggering the G1/S to G2/M transition and regulating cellular proliferation and differentiation processes [17,18]. The coordination of plant mitosis and the nuclear replication cycle is crucial for the normal growth and development of plants.
Currently, there is a notable gap in research concerning the role of gibberellins in the establishment of leaf polarity. Additionally, the influence of gibberellins on leaf growth and development necessitates further investigation within the scientific community.
Our study focused on the leaf width of the d18 mutant in order to investigate the factors influencing leaf width. Subsequently, we employed molecular biology techniques to uncover the genes regulated by GA that impact leaf development.

2. Materials and Methods

2.1. Rice Materials

In this study, we utilized the d18 mutant and NIP (Oryza sativa L. spp. Japonica, Nipponbare) to complete our research [19]. The slr1 mutant is in the ZH11 background. In situ hybridization was performed using the NIP background and d18 mutant.

2.2. Plant Growth Conditions and Hormones Treatment

Initially, the seeds were soaked in steamed water and left to germinate for 2 to 3 days at 37 °C. Following germination, they were transferred into a 96-well culture plate and placed in a constant-temperature incubator set at 28 °C with a light–dark cycle of 16 h and 8 h, respectively. The seeds were then cultured using Yoshida (Coolaber) nutrient solution.
We treated 7-day-old-seedlings of NIP and d18 with 10 μM GA3 for 7 days by preparing GA3 with ethanol to make a 100 mM mother solution, and then diluting it before use. Then, 10 μM of PP333 was used to treat 7-day-old-seedlings of NIP and d18. Experimental treatments were usually carried out after 7 days of rice cultivation.
We selected 7-day-old-seedlings of NIP treated with GA3 and PP333 for which hormone concentrations were 0 μM, 0.1 μM, 1 μM and 10 μM. Each group had 15 biological replicates.

2.3. RNA Seq Analysis

The materials were obtained from the aboveground leaves and shoot apical meristems of 2-week-old seedlings from d18 mutant and NIP. Total RNA extraction was performed using RNAiso plus (TAKARA) [20]. The RNA was homogenized by adding the appropriate amount of RNAiso Plus and then centrifuged at 12,000× g for 5 min at 4 °C. The supernatant was transferred to a new centrifuge tube, and chloroform (0.2 volume of RNAiso Plus used) was added. After vigorous vortexing, the mixture was kept at room temperature for 5 min and then centrifuged at 12,000× g for 15 min at 4 °C. Isopropanol (0.5–1.0 volume of RNAiso Plus used) was added, followed by incubation at room temperature for 10 min and centrifugation at 12,000× g for 10 min at 4 °C. The RNA was washed with an equivalent amount of 75% ethanol, centrifuged at 7500× g for 5 min at 4 °C, and air-dried without heating to dry the precipitate. The RNA was then dissolved in an appropriate amount of DEPC-treated water. After discarding the supernatant and retaining the precipitate, the upper layer was transferred to a new centrifuge tube and kept at room temperature for 5 min.
Library construction and sequencing were executed by Tianjin Novogene Bio-technology Company. RNA integrity was appraised using a 1.0% agarose gel stained. Additionally, the quality and quantity of RNA were evaluated with a NanoDrop2000® spectrophotometer (Theromo, Waltham, MA, USA). For two tissues (leaves and SAM) from NIP and d18, RNA samples from the three individuals were combined together in equal proportions to form one mixed sample. These six mixed RNA samples were subsequently utilized in cDNA library construction and Illumina sequencing, which was accomplished by Tianjin Novogene Bioinformatics Technology. A total of 3 μg RNA per sample was employed to construct the cDNA library. The library was generated employing NEBNext® Ultra™ RNA Library Prep Kit for Illumina® (NEB, Ipswich, MA, USA) in accordance with the manufacturer’s recommendations. PCR products were purified (AMPure XP system) and the library quality was assessed on the Agilent Bioanalyzer 2100 system. The library preparations were sequenced on an Illumina Hiseq 2000 platform, and 100 bp paired-end reads were produced. All raw-sequence read data were deposited in NCBI Sequence Read Archive. Transcriptome sequencing data were analyzed using TB tools [21]. Initially, the transcriptome sequencing data underwent screening with FastP (V0.19.4) software to eliminate low-quality sequences and process splices. Subsequently, Hisat2 (2.1.0) software was utilized to map the processed transcript information to the RGAP7.0 rice reference genome. HTSeq (2.0.3) software was employed to generate an expression matrix for obtaining quantitative expression data of transcripts, while DESeq2 (1.42.0) software in R was used to analyze transcriptome expression differences. The R language DESeq2 software was utilized for transcriptome differential expression profiling analysis [22].
We chose CYC family genes and genes with leaf development to build a heatmap, for which we used bioinformatics web-finished analysis “http//bioinformatics.com.cn (accessed on 30 March 2024)” [23]. Each unit of heat map was measured by FPKM.

2.4. Sectioning of Rice Tissues

Healthy rice plants were selected, cleaned, and fixed in PFA before undergoing vacuum treatment for 20 min until one side could sink to the bottom. The plants were then subjected to a 4 °C gradient ethanol treatment (30%, 50%, 60%, 70%), with a final overnight incubation in 70% ethanol at 4 °C. Subsequent dehydration and wax impregnation were carried out using a Leica dehydrator. Embedding was performed on a Leica hot stage, followed by cutting the tissues into 10 μm thick slices using a microtome. The slices were dried on a graphite hot plate at 42 °C for 24 h to 72 h and stored in a refrigerator at 4 °C. Toluidine blue staining was conducted using Sevier toluidine blue, with dewaxing of paraffin and staining for 5 min. Plant tissue sections were examined under a microscope after washing and differentiation with 0.1% glacial acetic acid based on the degree of coloration. Slices that did not require differentiation were dried in an oven at 60 °C. For transparency, the slices were treated with xylene for 10 min and then sealed with neutral gum [24].

2.5. In Situ Hybridization

The paraffin sectioning process was the same as in Section 2.3; probe preparation was performed using Roch T7 Transcriptase Kit, SP6/T7 DIG RNA Labeling Kit (SP6/T7) (https://chemicalbook.com, accessed on 30 March 2024). First, paraffin sections were dewaxed; then, probe hybridization was performed, sections were washed, RNA was digested, and dye was soaked and stained [25]. Gene-specific sequences from OsD18, OsH4 and OsCYCB2 were amplified using primers (Table 1) and cloned into the pEasy vector (TransGene). Labeled RNA probes were synthesized through in vitro transcription (SP6/T7) using the DIG RNA labeling kit (Roche, Basel, Switzerland). Briefly, tissue section slides were subjected to protease treatment (20 min at 37 °C) followed by glycine neutralization (2 min) and acetic anhydride/triethanolamine treatment (10 min). Following hybridization with labeled probes (25 ng/slide) for 16–20 h at 55 °C, RNase A (20 µg/mL) treatment and stringency washes, the sections were incubated in 0.5% blocking reagent (Roche, Basel, Switzerland) for 45 min. After washing (1% BSA, 0.3%Triton X-100 in 19 TBS), sections were incubated with anti-digoxigenin-AP (1:1000 dilution, Roche, Basel, Switzerland) at 4 °C overnight in the dark, followed by another washing. Sections were then incubated in the dark for 2–3 days and then photographed under a light microscope (Olympus, Tokyo, Japan) [26].

2.6. Phylogenetic Tree and Sequences Analysis

In order to analyze and classify gibberellin synthase members Phaspalum vaginatum, Setaria italica, Setaria viridis, Panicum miliaceum, Sorghum bicolor and Zea mays, we aligned their protein sequences using the ClustalW algorithm provided by MEGA5.2 software. Following sequence alignment, the results were utilized to construct a phylogenetic tree using the neighbor-joining (NJ) method, with an emphasis on achieving robustness through 1000 bootstrap replications [27]. Sequence information was obtained from NCBI genebank: reed PaGA3BOX2 (XP_062194446.1); millet SiGA3BOX2 (XP_004968405.1); corn ZmGA3OX1 (NP_001266453.1); maize ZmGA3BOX2-2 (PWZ31809.1); and rice OsGA3BOX(BAB62154.1).
The multi-alignment of different gibberellin synthase sequences was performed with BioEdit software (V7.0.9.0). Amino acid sequences underwent multi-alignment from phylogenetic tree sequences.
SMART (Simple Modular Architecture Research Tool) is a web resource “https://smart.embl.de (accessed on 2nd March 2024)” used for identifying and annotating protein domains, as well as analyzing protein domain architectures [28]. We inputted OsD18 amino acid sequences into the SMART software on the web and obtained the domain structure.

3. Results

3.1. d18 Has Wider Blades Than NIP

In order to explore the relationship between leaf development and GAs, we obtained a d18 mutant and an slr1 mutant. The study found that d18 showed wider leaves than NIP. This phenotype in d18 was sustained in the 14-day-old seedlings stage (Figure 1a) and the 24-day-old seedlings stage (Figure 1b,c).
In addition, after treatment with GA3 for d18 and NIP for 7 days, the leaves of both groups became narrow (Figure 1d–f). In contrast, when NIP and d18 were treated with the GA inhibitor PP333, the leaves of both groups became wider (Figure 1g). However, OsSLR1 is a negative regulatory gene in the GA signaling pathway, and the slr1 mutant exhibits narrow leaves than the ZH11 group (Figure 1h). In conclusion, GA exerts a negative regulatory influence leaf width.
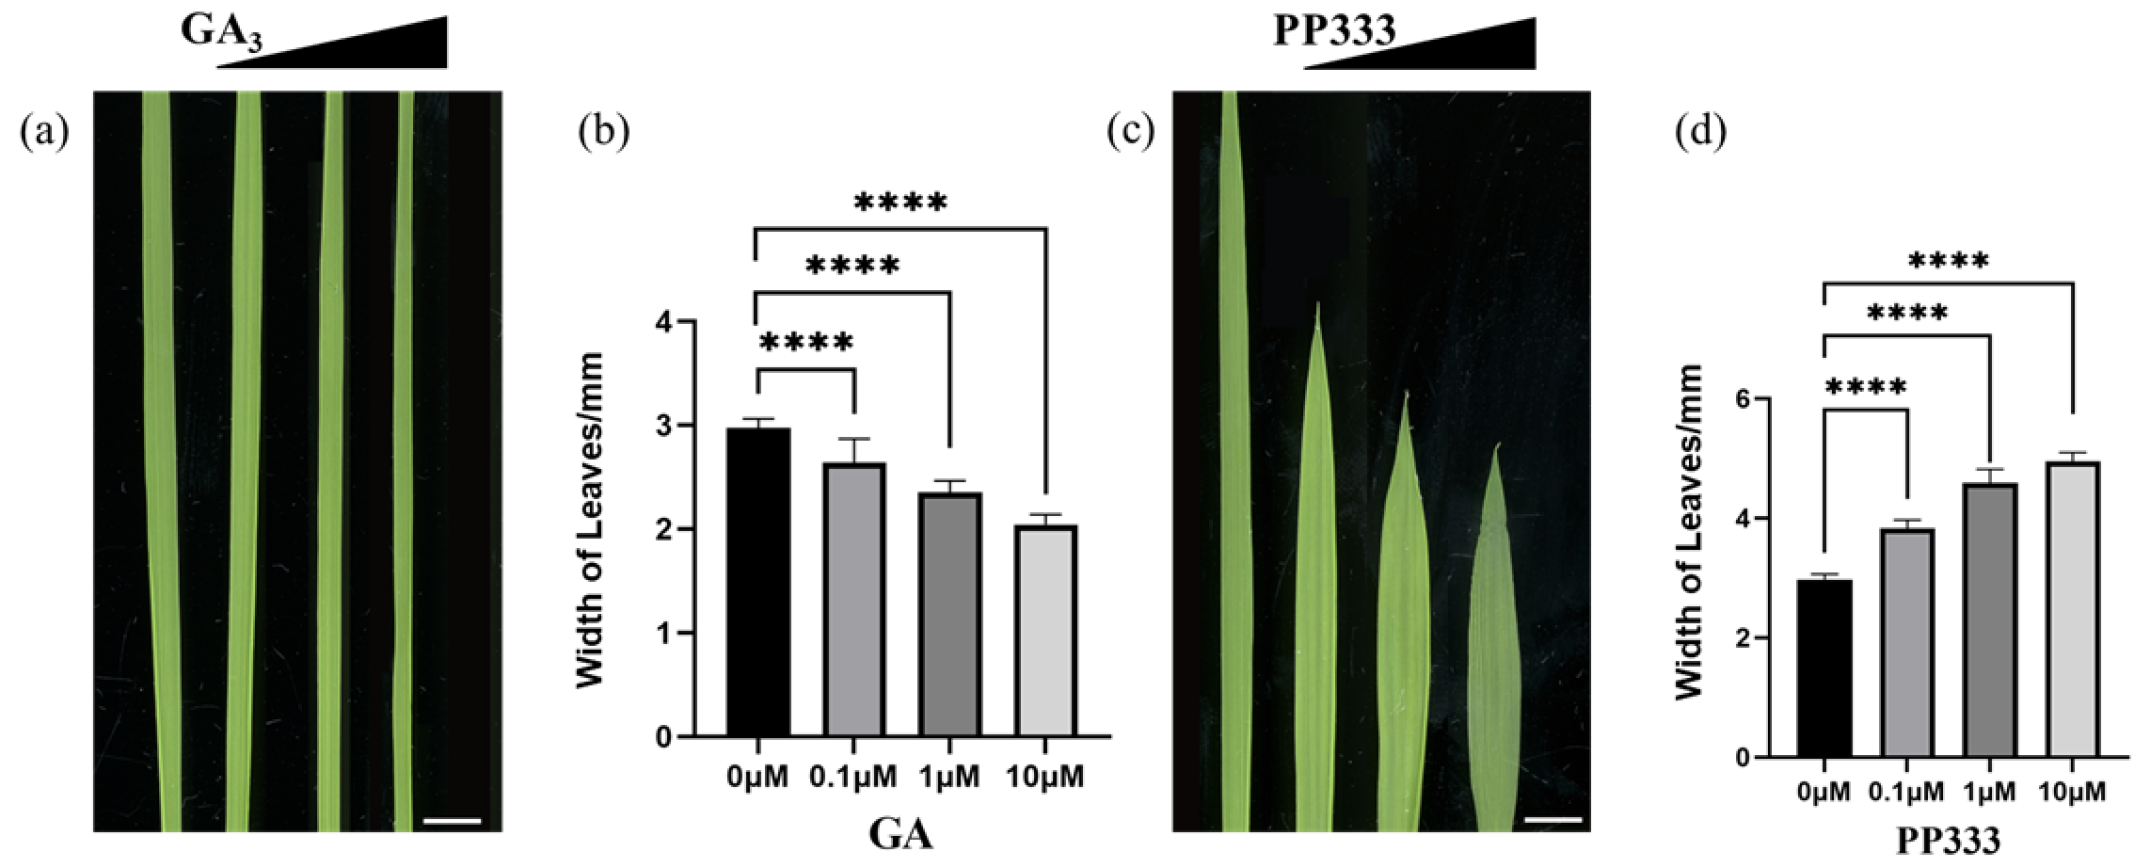
To explore the relationship between GA and leaf width in phenotype, we selected 7-day-old seedlings of NIP for treatment with GA3 and PP333 for 7 days. The results showed that leaf width would narrow as the concentration of GA3 increased. Then, as the concentration of PP333 increased, the leaf width became broader than the control group (Figure 2a–d). These results indicated that GA inhibits the lateral growth of leaf width.

3.2. OsD18 Encodes GA3OX and Participates in the GA Synthesis Process

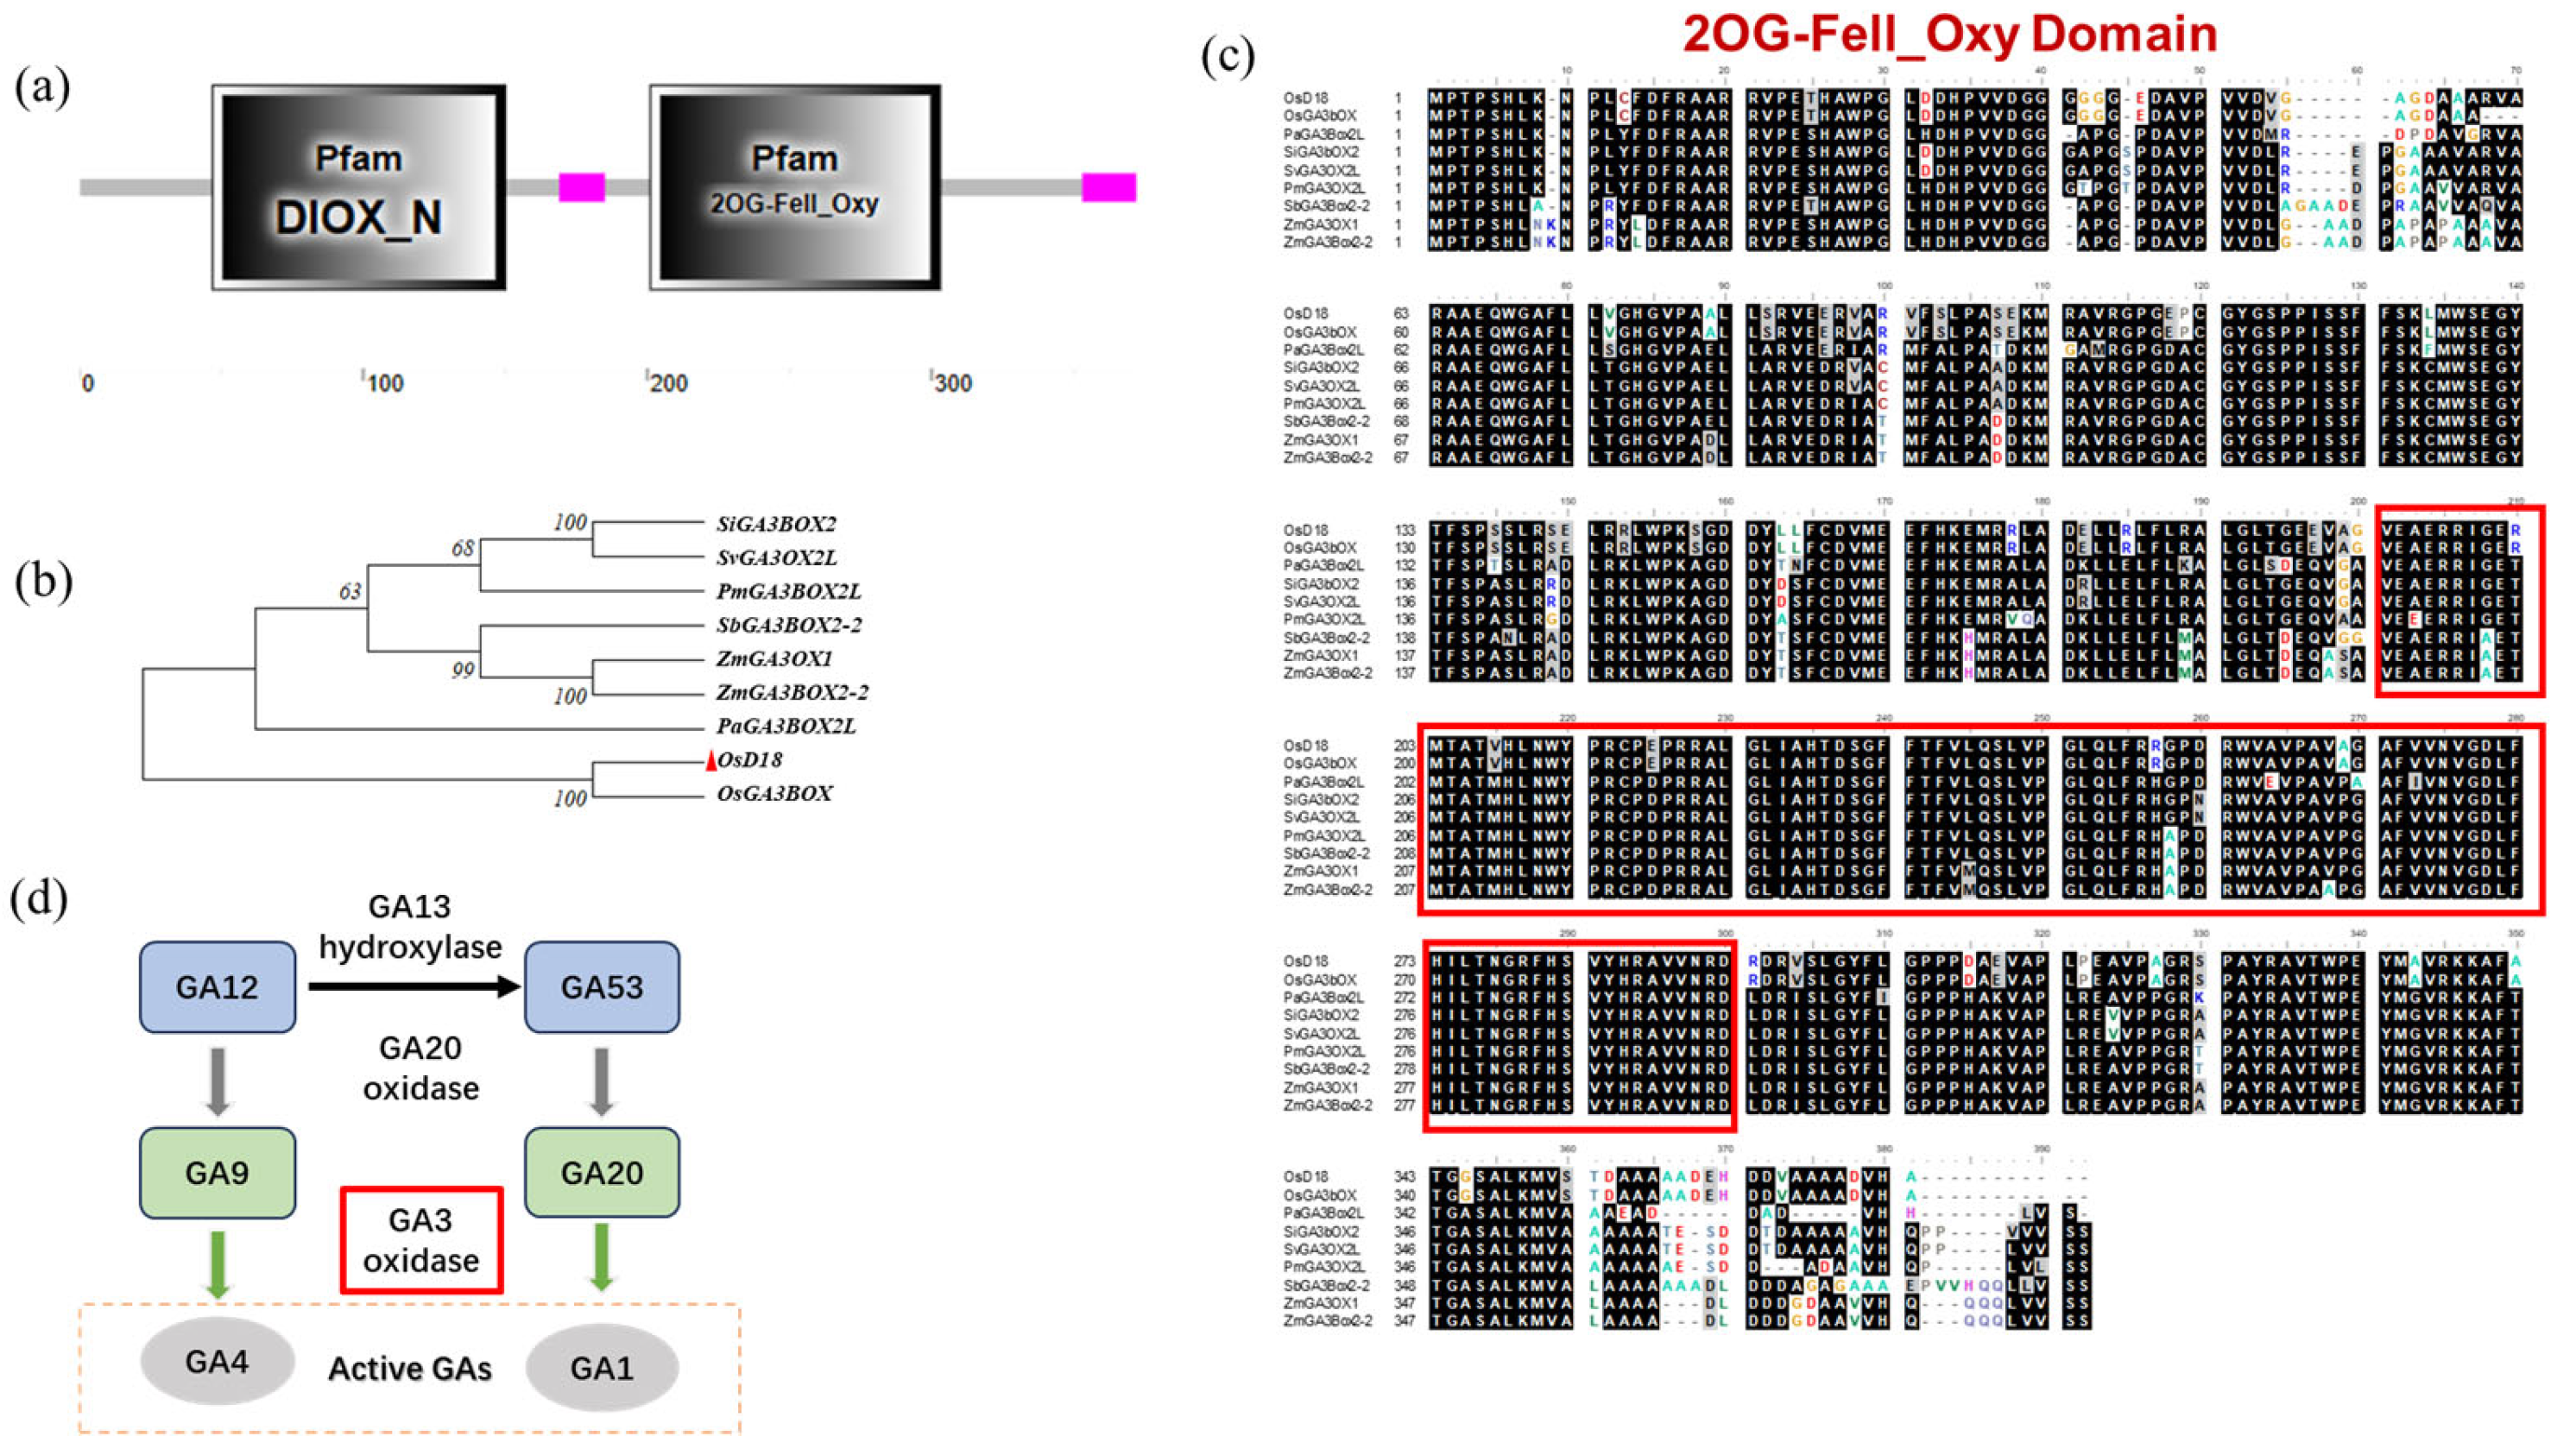
In order to further understand the function of OsD18, this study conducted bioinformatics analysis. Firstly, domain analysis shows that OsD18 comprises two domains (Figure 3a). The DIOX_N domain spans positions 47 to 150 of the amino acid sequence, exhibiting 2-oxoglutarate/iron (II)-dependent dioxygenase activity and featuring a highly conserved region at the N-terminus. The second domain, located between positions 201 and 304, is the Fe (II)2OG dioxygenase domain responsible for enzymatically catalyzing the biosynthesis of plant hormones such as ethylene, gibberellins, anthocyanins, flavonoids and other pigments. Secondly, our study selected nine amino acid sequences for phylogenetic tree analysis (Figure 3b) and sequence alignment analysis (Figure 3c). The evolutionary tree analysis indicated a close genetic relationship between OsD18 and OsGA3BOX. Multiple sequence alignment revealed that the structure of OsD18 was conserved, particularly at the Fe (II)2OG domain position. Last but not least, the working model diagram shows that OsD18 encodes the GA3OX enzyme, enabling the conversion of inactive GA20 to active GA1 (Figure 3d).

3.3. Cell Morphology Showed That OsD18 Had More Vascular Bundles

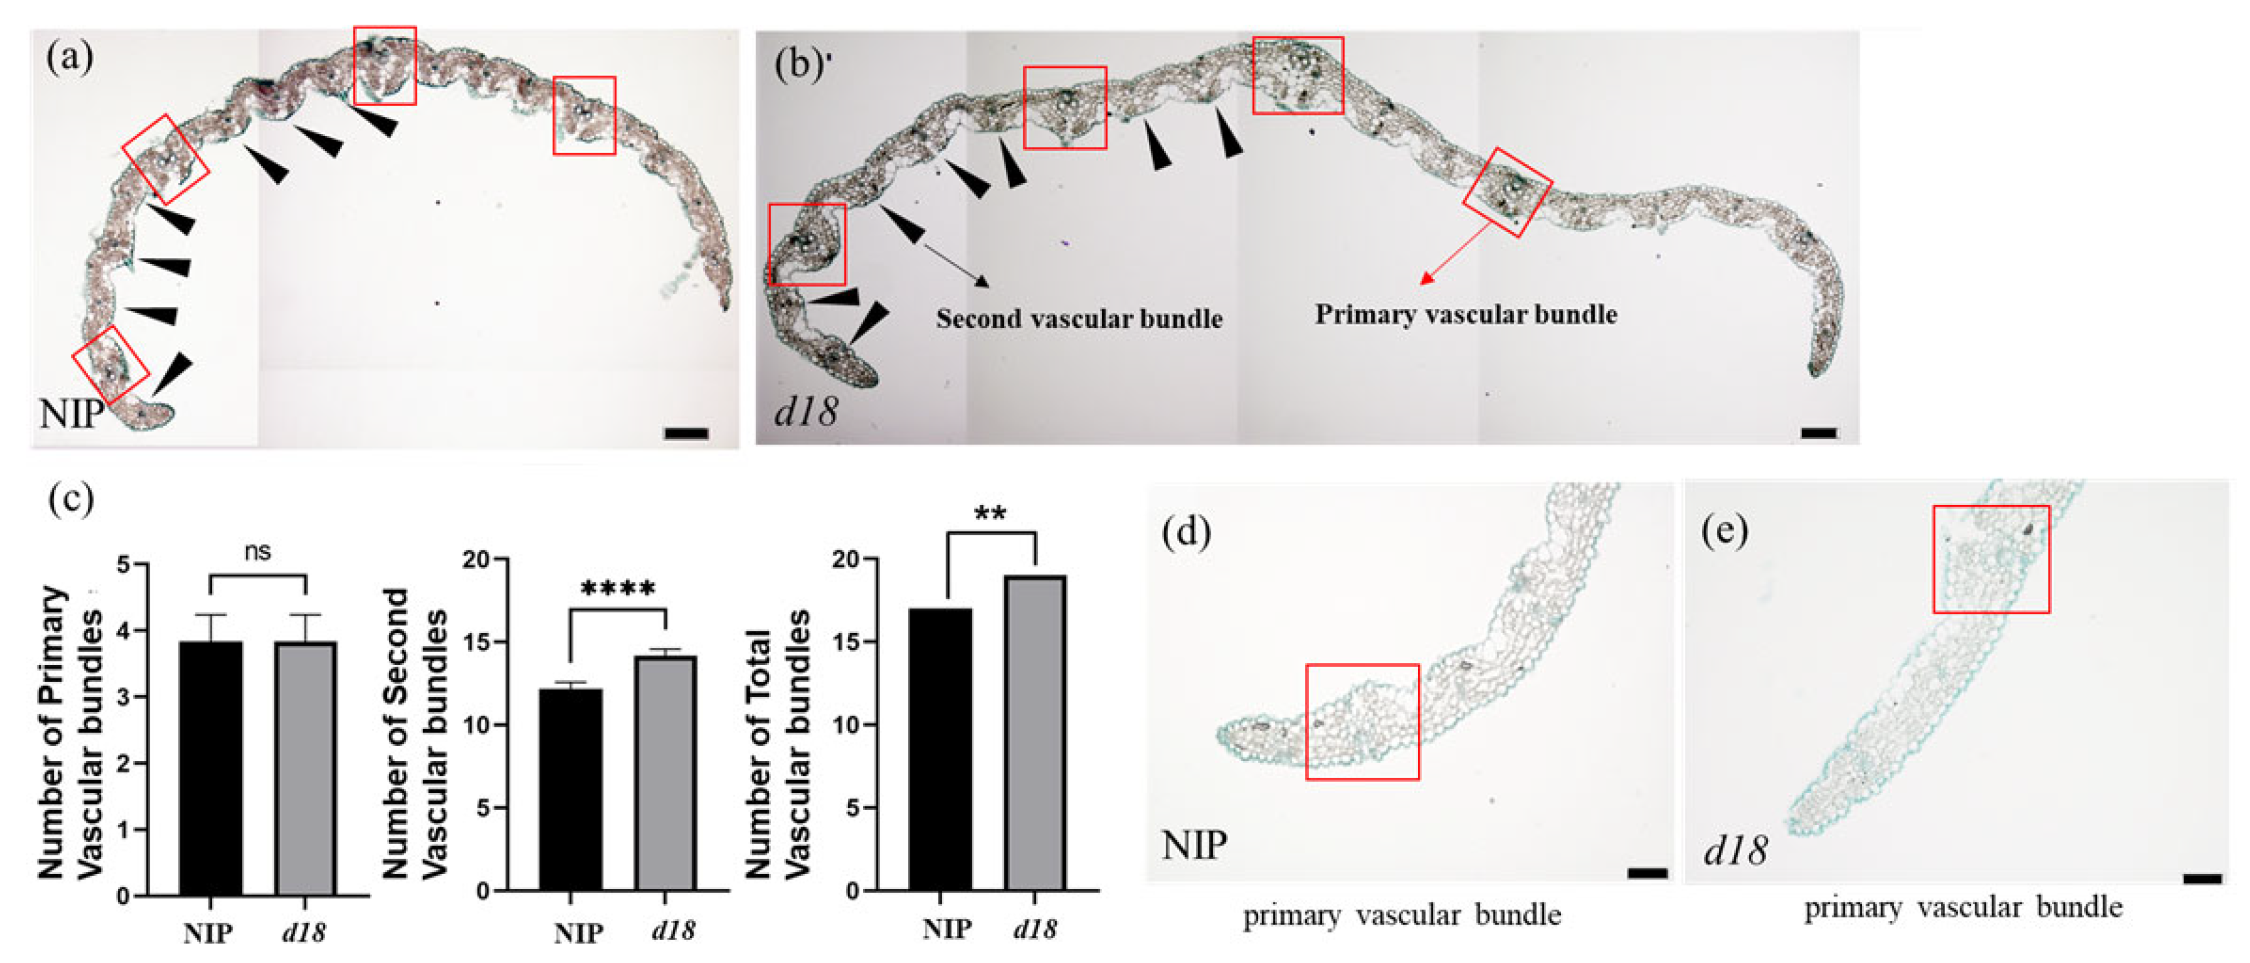
The study aimed to investigate the cytohistological factors contributing to leaf widening in OsD18. For this, paraffin sections were taken in this study. The findings indicated a substantial increase in the number of secondary vascular bundles in d18 leaves compared to those in the NIP group (Figure 4a–e).

3.4. OsD18 Is Highly Expressed at the Margin of Rice Leaves

In order to explore the expression pattern of OsD18 in aboveground tissues, we performed an RNA in situ hybridization experiment. Two consecutive slices were used from 2-week-old seedling shoot meristem apical tissues of NIP. The results showed that OsD18 was highly expressed on the leaf margin (Figure 5). This result revealed that OsD18 may regulate leaf development due to control leaf margin development.

3.5. RNA-Seq Analysis Showed That Expression of Several Leaf Development Genes and Cell-Cycle-Related Genes Was Altered in d18

To investigate the genes potentially regulated by GA in leaf development, this study utilized rice materials at the three-leaf stage to construct an RNA-seq library.
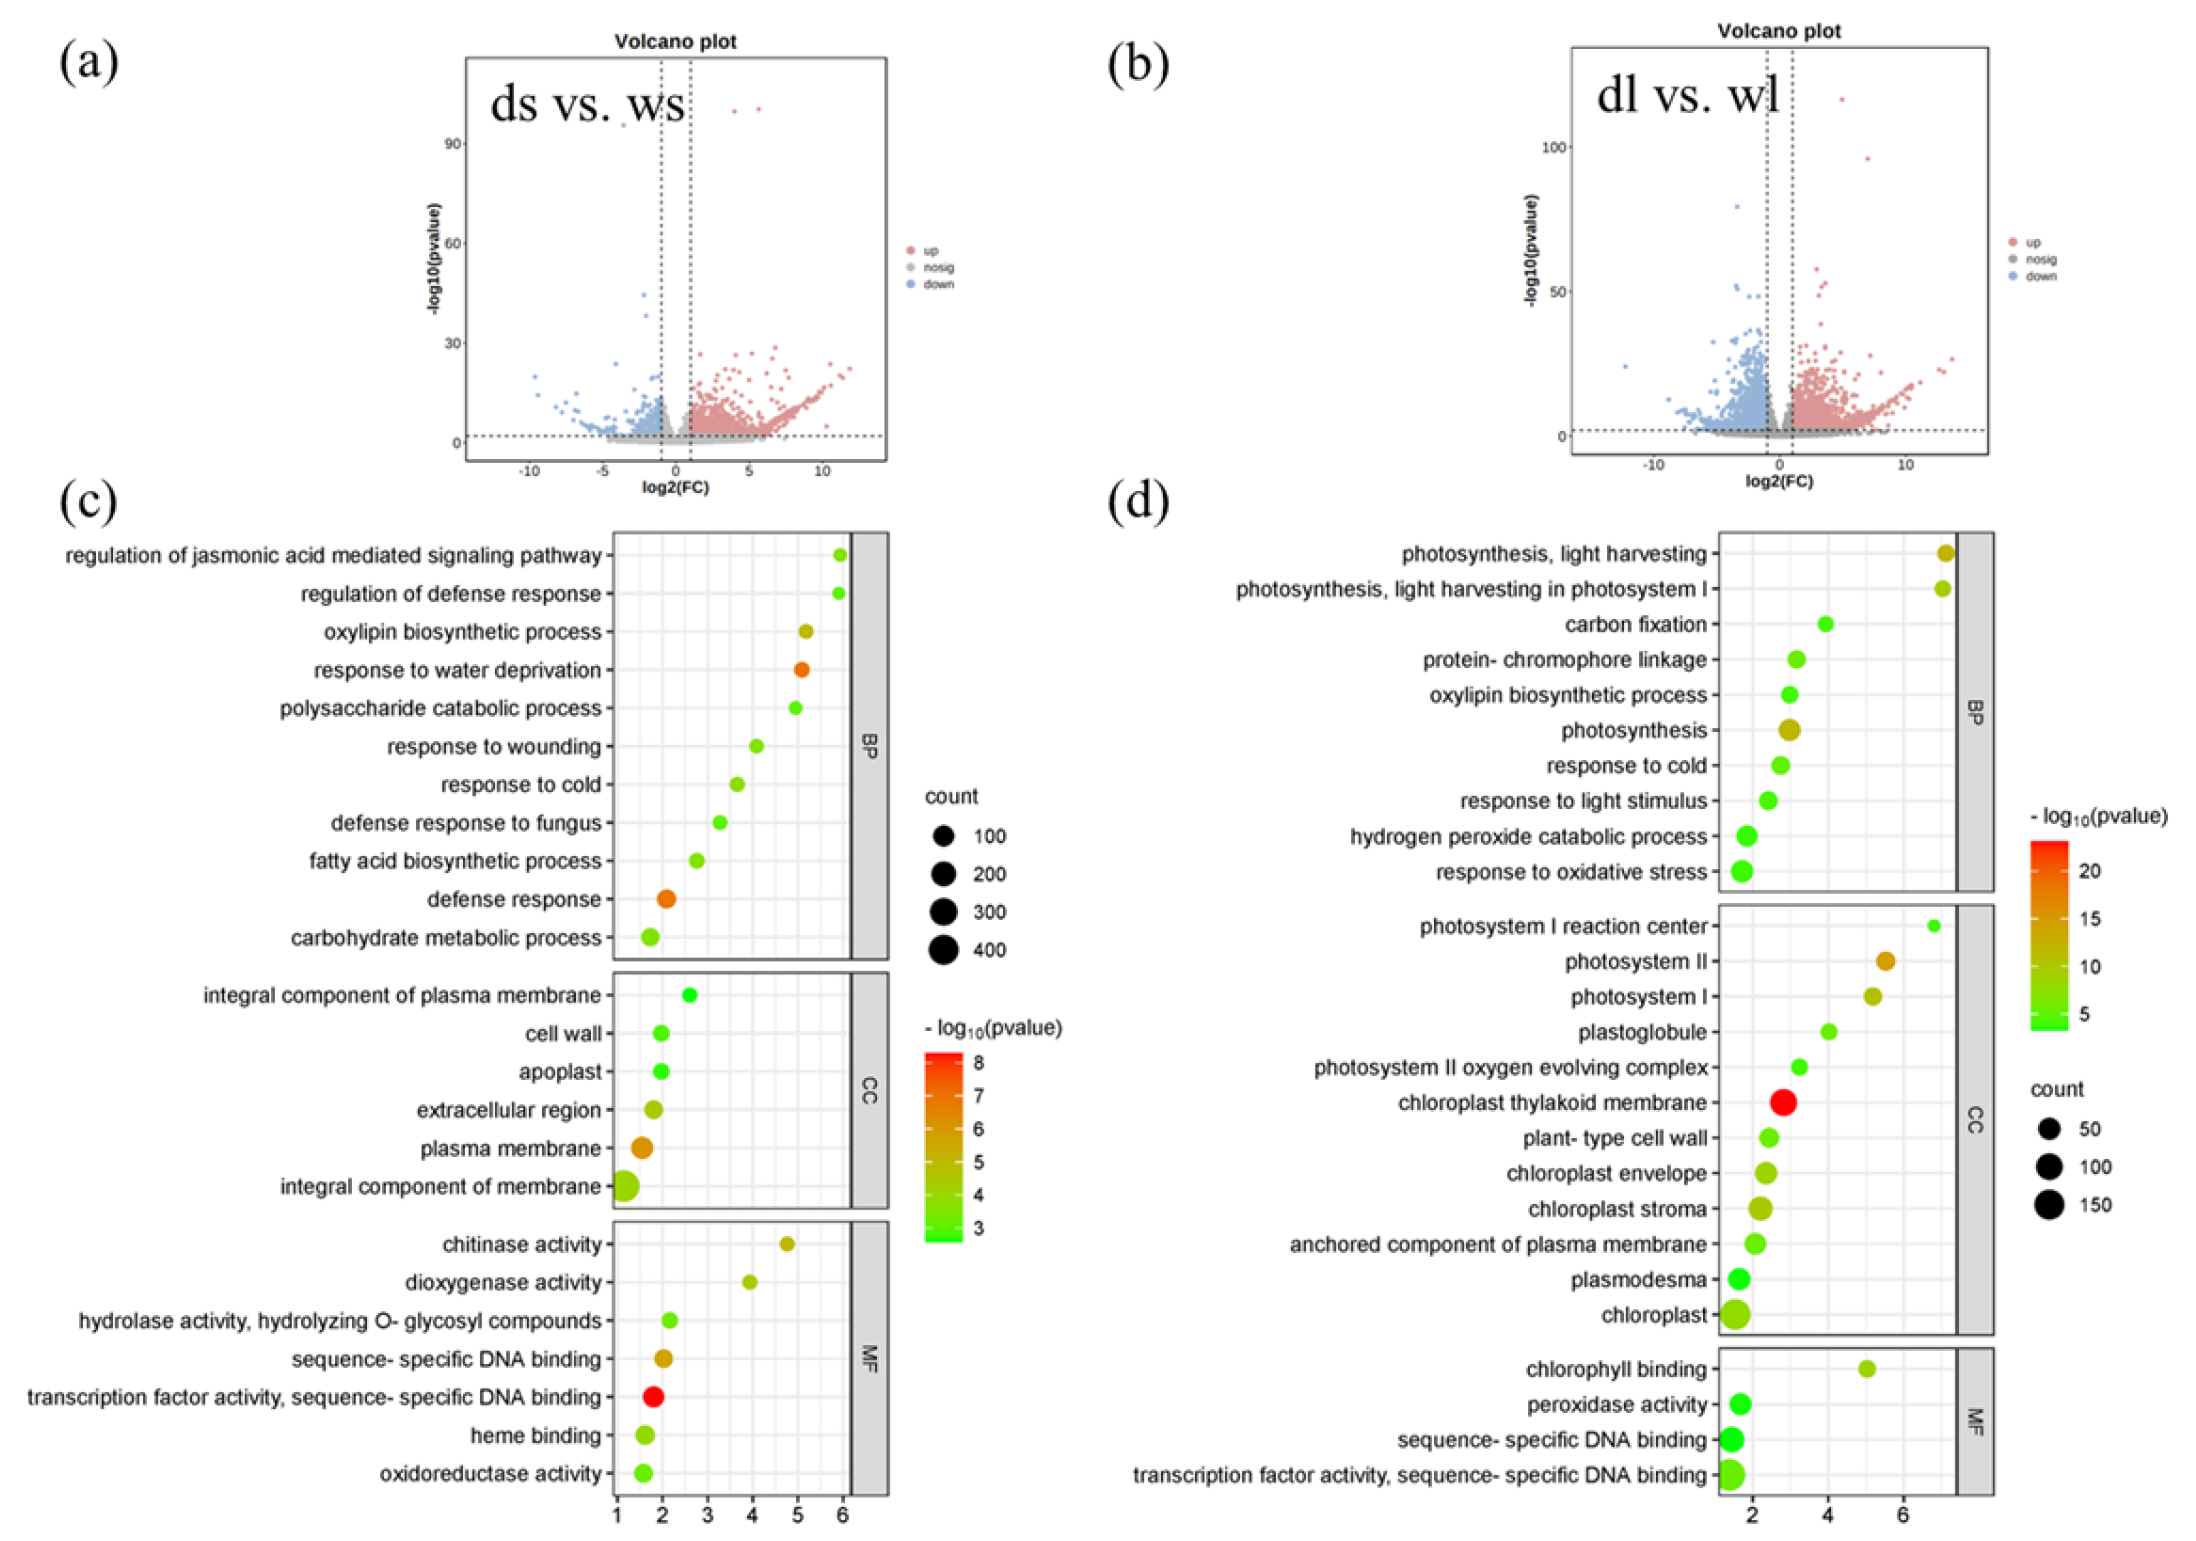
The results indicated that in the shoot apical meristem (SAM), there were 1091 up-regulated genes and 295 down-regulated genes in d18 (Figure 6a, p-value < 0.05, log2Fold > 2). Gene ontology (GO) enrichment analysis revealed a significant enrichment of stress-related and metabolic synthesis-related pathways among the differentially expressed genes (Figure 6c). KEGG analysis showed that differentially expressed genes were mainly concentrated in metabolic synthesis pathways. In addition, they were also somewhat enriched in plant signal transduction pathways.
In leaf tissue, a total of 5076 genes were found to be significantly differentially expressed between d18 and NIP, with 2795 being down-regulated and 2281 up-regulated. Gene ontology (GO) enrichment analysis highlighted a significant enrichment of photosynthesis-related pathways among the differentially expressed genes in leaves. Additionally, Kyoto Encyclopedia of Genes and Genomes (KEGG) analysis identified a differential expression of plant signal transduction pathways, including cytokinin pathways.

3.6. Several Cell-Cycle Related Genes Are More Active at the Margin of d18 Leaves

The histological analysis of cells revealed an increase in the number of vascular vessels in d18 leaves, with the widening of leaves primarily attributed to the augmented cell count. Subsequently, we examined the expression levels of selected cell-cycle-related genes in the shoot apical meristem (SAM) of NIP and d18. A clustering heat map analysis indicated a significant upregulation of cyclin-related genes such as CYCB2 and CYCA2 in d18 (Figure 7). In addition, this study performed in situ hybridization experiments from a molecular biology perspective. The detection probes used were H4 and CYCB2: H4 is a marker gene involved in cell division, and CYCB2 was used as the marker gene for the G2 to M phase transition. In both the wild-type and d18 samples, the signals for H4 and CYCB2 were prominently localized at the leaf margin (Figure 8a,c).

3.7. Leaf Development Marker Gene Expression Regulated by GA

In order to explore which kinds of genes were regulated by GA, we selected genes involved in leaf development from RNA seq. Then, we constructed a heatmap based on these findings (Figure 9). Expression levels of marker genes for leaf-curved development were altered in the d18 mutant (Figure 9a). The expression levels of genes associated with leaf-width development showed a significant change (Figure 9b). These genes are involved in various functions such as leaf development, hormone regulation, and histone protein structure. Consequently, we propose that GAs may participate in multiple biological pathways to regulate leaf development.
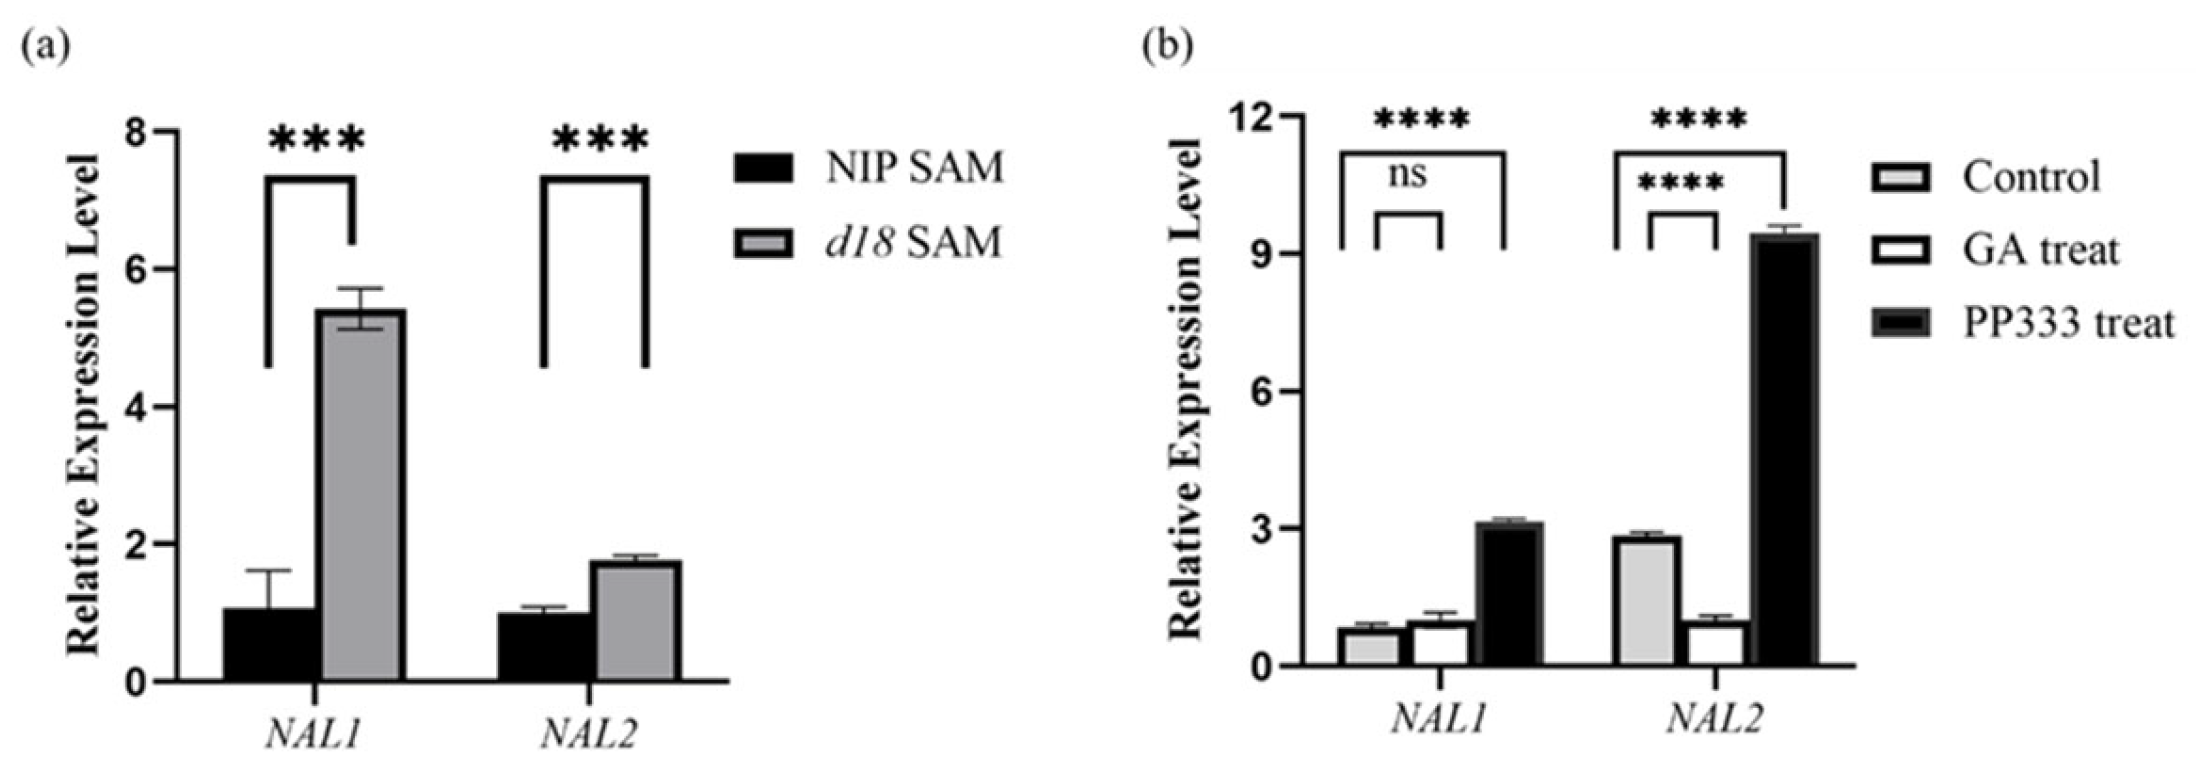
In addition, OsNAL1 and OsNAL2 have been reported to be involved in leaf development and the response to GA signaling. To assess the expression levels of OsNAL1/2 in the d18 mutant and wild-type plants, we conducted real-time PCR using 2-week-old seedlings sampled from d18 and NIP plants. The results show that OsNAL1/2 expression in d18 was significantly higher than in NIP (Figure 10a). Then, we wanted to explore the OsNAL1/2 expression level after GA and PP333 treatment. We used 10 μmol GA- and PP333-treated NIP leaves for each group and detected OsNAL1/2 expression levels using real-time PCR. The results indicated that PP333 significantly upregulated the expression of OsNAL1/2 compared to the control group. Additionally, GA downregulated the expression of OsNAL2 but did not affect the expression level of OsNAL1 (Figure 10b). Consequently, GA can modulate the expression of certain marker genes associated with leaf development.

4. Discussion

Leaf morphology plays a crucial role in determining plant architecture and has a significant impact on photosynthesis in rice. An optimal leaf shape can enhance canopy structure, expand the photosynthetic area, and ultimately improve grain yield. While the molecular mechanisms of leaf development have been extensively studied in the model dicot Arabidopsis thaliana [29], research in agronomically important monocots such as rice, which feature elongated leaves with parallel veins, is limited. In this study, we studied d18 mutant, which exhibited an increased leaf width. We reported that the d18 phenotype was induced by a mutation in OsD18, which encodes a kind of enzyme to take part in GA biosynthesis. GAs regulate plant height in rice [30]. However, how GAs help regulate leaf width is not well-studied.

4.1. Effects of Gibberellins on the Development of Mid-Leaf Rachis

The impact of hormones on plant growth and development is substantial. In particular, gibberellins have been reported to regulate stem length, seed dormancy, flowering, the development of floral organs, and so on [31,32,33]. In our study, gibberellins’ regulation of leaf width can be seen.
In previous research, Yang’s study showed that treating ZH11 seedlings with 10 μM GA3 for 5 days resulted in slender growth and narrower leaves. However, the focus was on the slender growth influenced by the YABBYs gene in rice, rather than exploring the reasons for leaf-width development [34]. In our study, it was observed that treating plants with GA resulted in a reduction in rice leaf width, whereas PP333 treatment led to an increase in leaf width. This indicates that gibberellins have a negative regulatory effect on the development of rice leaf width.
The d18 mutant gene is involved in gibberellin synthesis. Previous research by Hu demonstrated that the d18 mutant exhibits semi-dwarfed plants, but did not provide an explanation for the wider leaves observed in the mutant [16]. Our study was the first to discover the broad-leaf phenotype of the d18 mutant and to elucidate the underlying cellular morphology contributing to this trait. Scholars explain that vascular bundle patterning and cell number and size are the major cytological factors controlling leaf shape [35]. To explore the abnormal leaf development mechanism, we observed the leaves’ vascular bundle number from NIP and d18 plants. We found that the vascular number of leaves in the d18 mutant was significantly higher compared to the wild type. Our results suggest that GAs regulate leaf-width development by regulating vascular bundles’ lateral growth.
To further investigate the role of gibberellins in regulating leaf-width development, we also observed the phenotype of GA pathway gene mutants. DELLA plays an important role in the GA signaling pathway. In rice, SLR1 encodes DELLA proteins, and the slr1 mutant exhibits slender growth and narrow leaves [36]. In this study, we also observed that slr1 mutants displayed narrow leaves during their seedling stage. All of these findings suggest that GAs are involved in regulating the width of rice leaves.

4.2. GAs Regulate Active of Cell Division to Control Leaf Development

Cyclins play a crucial role in plant growth and development, with numerous studies reporting on how cyclin proteins regulate leaf development.
Zheng demonstrated that the overexpression of the CYCD1;1 gene in Arabidopsis can enhance cell division, resulting in smaller cells and a cytokinin response, ultimately leading to the formation of curved leaves [37]. CYCA2 can promote asymmetric division in stomatal initiation and the symmetric division of guard mother cells in rice [38]. B-type CDK (CDKB) is a family of mitotic CDKs expressed during the S/M phase. The overexpression of CYCB2;2 in rice plants resulted in the acceleration of root growth without any increase in cell size, indicating that CYCB2;2 promoted cell division probably through association with CDKB2 in the root meristem [39]. However, the relationship of cyclin proteins and leaf-width development in rice is not well reported. Our research found that the in situ hybridization results for CYCB2 in the shoot apical meristem (SAM) of the d18 mutant showed a stronger signal compared to the wild-type NIP. The expression levels of these two cell-cycle marker genes were predominantly concentrated in the marginal area. In addition, an RNA-seq analysis of the d18 mutant revealed an upregulation of cell-cycle-related protein expression within the SAM. Furthermore, our findings suggest that in the absence of gibberellins, there is robust proliferation at the leaf margins in rice, indicating that gibberellins suppress cell division and limit lateral growth in rice.

4.3. Loss of Gibberellin Changes Genes with Leaf Development Expression Level

The process of plant leaf-width development significantly influences crop yield, particularly in relation to optimal plant density. Leaf width is intricately linked to the growth of the midrib axis. A series of studies have shed light on various genes associated with leaf-width development, such as OsNAL2, OsNAL1, OsNAL7, and so on [40,41,42].
Scientists have identified a mutant gene in rice, known as COW1 (nal7), which leads to a significant reduction in the width of the leaf blade. The IAA content in the nal7 mutant differs from that of the wild type, indicating that NAL7 plays a role in auxin biosynthesis [41]. In our research, OsCOW1 expression level was changed in the d18 mutant. In addition,, the dnl-4 mutant showed reduced plant height and leaf blade width compared to the wild type, as well as increased leaf inclination. The morphological defects of the mutant were caused by the suppressed expression of the DNL-4 gene, which encodes a pfkB carbohydrate kinase protein. These results suggest that DNL-4 expression is involved in modulating plant height and leaf growth [43]. In our study, DNL4 gene expression was significantly upregulated in d18. To understand the molecular mechanisms of rice aerial organ development, scholars identified a mutant gene that caused a significant decrease in the width of aerial organs, termed NRL2 [44]. Our research revealed that NRL2 gene expression increased in d18. Histological analysis showed that the slender aerial organs were caused by cell number reduction. In nrl1 mutant, the number of vascular bundles in aerial organs was reduced, whereas the area of the vascular bundles was increased. The researchers concluded that NAL1 plays a critical role in leaf morphogenesis and vegetative development in rice, and the nal1-1 mutant had fewer longitudinal veins and smaller adaxial bulliform cells compared with the wild-type plant [45]. Our research also found that OsNAL1 expression showed a significant distinction in d18 and wild-type plants. In summary, GAs may control leaf development marker gene expression to regulate leaf development in rice.
In our study, we found that these leaf development marker genes can be regulated by GAs, and their expression level changed in d18. Next, we found OsNAL1 and OsNAL2 expression levels upregulated in the d18 mutant. In conclusion, our study found that hormone-related genes and cell-cycle-related genes were affected by GAs. Therefore, we speculate that GAs may be involved in regulatory processes such as hormones and cell division.

5. Conclusions

Firstly, GAs control leaf development, and the absence of GAs leads to wider rice leaves. Secondly, the d18 mutant has less vascular bundles than wild-type plants. Last but not least, GAs affect cyclin protein expression, thus contributing to more active cell division than found in wild-type plants. In addition, GAs regulate many narrow-leaf marker gene expression levels.
In summary, through physiological, cellular morphological, and molecular biological analyses, this study elucidated the negative regulatory role of gibberellins on midrib axis development in leaves across varying scales.

Author Contributions

Methodology, X.G.; Software, S.S.; Writing—original draft preparation, X.G. and R.Z.; Writing—review and editing, R.Z.; Supervision, Q.W.; Project administration, Q.W. All authors have read and agreed to the published version of the manuscript.

Funding

This research received no external funding.

Data Availability Statement

Data are contained within the article in Section 2.

Acknowledgments

Thanks for Qianqian Lab of China Rice Research Institute and Nanjing Agriculture University Xiong Guosheng Lab.

Conflicts of Interest

The authors declare no conflicts of interest.

References

  1. Poethig, R.S.; Sussex, I.M. The developmental morphology and growth dynamics of the tobacco leaf. Planta 1985, 165, 158–169. [Google Scholar] [CrossRef] [PubMed]
  2. Itoh, J.; Nonomura, K.; Ikeda, K.; Yamaki, S.; Inukai, Y.; Yamagishi, H.; Kitano, H.; Nagato, Y. Rice plant development: From zygote to spikelet. Plant Cell Physiol. 2005, 46, 23–47. [Google Scholar] [CrossRef] [PubMed]
  3. Laux, T.; Jurgens, G. Embryogenesis: A New Start in Life. Plant Cell 1997, 9, 989–1000. [Google Scholar] [CrossRef] [PubMed]
  4. Long, J.A.; Moan, E.I.; Medford, J.I.; Barton, M.K. A member of the KNOTTED class of homeodomain proteins encoded by the STM gene of Arabidopsis. Nature 1996, 379, 66–69. [Google Scholar] [CrossRef] [PubMed]
  5. Davière, J.M.; Achard, P. Gibberellin signaling in plants. Development 2013, 140, 1147–1151. [Google Scholar] [CrossRef] [PubMed]
  6. Yamaguchi, S. Gibberellin metabolism and its regulation. Annu. Rev. Plant Biol. 2008, 59, 225–251. [Google Scholar] [CrossRef] [PubMed]
  7. Lester, D.R.; Ross, J.J.; Davies, P.J.; Reid, J.B. Mendel’s stem length gene (Le) encodes a gibberellin 3 beta-hydroxylase. Plant Cell 1997, 9, 1435–1443. [Google Scholar] [CrossRef] [PubMed]
  8. Itoh, H.; Ueguchi-Tanaka, M.; Sentoku, N.; Kitano, H.; Matsuoka, M.; Kobayashi, M. Cloning and functional analysis of two gibberellin 3 beta -hydroxylase genes that are differently expressed during the growth of rice. Proc. Natl. Acad. Sci. USA 2001, 98, 8909–8914. [Google Scholar] [CrossRef]
  9. Hsieh, K.T.; Wu, C.C.; Lee, S.J.; Chen, Y.-H.; Shiue, S.-Y.; Liao, Y.-C.; Liu, S.-H.; Wang, I.-W.; Tseng, C.-S.; Li, W.-H.; et al. Rice GA3ox1 modulates pollen starch granule accumulation and pollen wall development. PLoS ONE 2023, 18, e0292400. [Google Scholar] [CrossRef]
  10. Achard, P.; Genschik, P. Releasing the brakes of plant growth: How GAs shutdown DELLA proteins. J. Exp. Bot. 2009, 60, 1085–1092. [Google Scholar] [CrossRef]
  11. Jasinski, S.; Piazza, P.; Craft, J.; Hay, A.; Woolley, L.; Rieu, I.; Phillips, A.; Hedden, P.; Tsiantis, M. KNOX action in Arabidopsis is mediated by coordinate regulation of cytokinin and gibberellin activities. Curr. Biol. 2005, 15, 1560–1565. [Google Scholar] [CrossRef] [PubMed]
  12. Cho, S.H.; Yoo, S.C.; Zhang, H.; Pandeya, D.; Koh, H.; Hwang, J.; Kim, G.; Paek, N. The rice narrow leaf2 and narrow leaf3 loci encode WUSCHEL-related homeobox 3A (OsWOX3A) and function in leaf, spikelet, tiller and lateral root development. New Phytol. 2013, 198, 1071–1084. [Google Scholar] [CrossRef]
  13. Sun, K.; Lu, H.; Fan, F.; Zhang, P.; Liu, G.; Yu, X. Occurrence of Chenopodium quinoa mitovirus 1 in Chenopodium quinoa in China. Plant Dis. 2020, 103, 715. [Google Scholar] [CrossRef]
  14. Koyama, T.; Sato, F.; Ohme-Takagi, M. Roles of miR319 and TCP Transcription Factors in Leaf Development. Plant Physiol. 2017, 175, 874–885. [Google Scholar] [CrossRef] [PubMed]
  15. Kim, Y.S.; Kim, S.G.; Lee, M.; Lee, I.; Park, H.-Y.; Seo, P.J.; Jung, J.-H.; Kwon, E.-J.; Suh, S.W.; Paek, K.-H.; et al. HD-ZIP III activity is modulated by competitive inhibitors via a feedback loop in Arabidopsis shoot apical meristem development. Plant Cell 2008, 20, 920–933. [Google Scholar] [CrossRef] [PubMed]
  16. Iwasaki, M.; Takahashi, H.; Iwakawa, H.; Nakagawa, A.; Ishikawa, T.; Tanaka, H.; Matsumura, Y.; Pekker, I.; Eshed, Y.; Vial-Pradel, S.; et al. Dual regulation of ETTIN (ARF3) gene expression by AS1-AS2, which maintains the DNA methylation level, is involved in stabilization of leaf adaxial-abaxial partitioning in Arabidopsis. Development 2013, 140, 1958–1969. [Google Scholar] [CrossRef]
  17. Komaki, S.; Sugimoto, K. Control of the plant cell cycle by developmental and environmental cues. Plant Cell Physiol. 2012, 53, 953–964. [Google Scholar] [CrossRef]
  18. Wood, D.J.; Endicott, J.A. Structural insights into the functional diversity of the CDK-cyclin family. Open Biol. 2018, 8, 180112. [Google Scholar] [CrossRef]
  19. Hu, S.; Hu, X.; Hu, J.; Shang, L.; Dong, G.; Zeng, D.; Guo, L.; Qian, Q. Xiaowei, a New Rice Germplasm for Large-Scale Indoor Research. Mol. Plant 2018, 11, 1418–1420. [Google Scholar] [CrossRef]
  20. Jiang, M.; Zhang, S.; Yin, H.; Zhuo, Z.; Meng, G. A comprehensive benchmarking of differential splicing tools for RNA-seq analysis at the event level. Brief Bioinform. 2023, 24, bbad121. [Google Scholar] [CrossRef]
  21. Mi, X.; Yue, Y.; Tang, M.; An, Y.; Xie, H.; Qiao, D.; Ma, Z.; Liu, S.; Wei, C. TeaAS: A comprehensive database for alternative splicing in tea plants (Camellia sinensis). BMC Plant Biol. 2021, 21, 280. [Google Scholar] [CrossRef] [PubMed]
  22. Love, M.I.; Huber, W.; Anders, S. Moderated estimation of fold change and dispersion for RNA-seq data with DESeq2. Genome Biol. 2014, 15, 550. [Google Scholar] [CrossRef] [PubMed]
  23. Chen, L.; Yang, A.; Li, Y.; Liu, X.; Jiang, W.; Hu, K. Molecular mechanism of oroxyli semen against triple-negative breast cancer verified by bioinformatics and in vitro experiments. Medicine 2023, 102, e34835. [Google Scholar] [CrossRef]
  24. Kiernan, J.A. Staining paraffin sections without prior removal of the wax. Biotech. Histochem. 1996, 71, 304–310. [Google Scholar] [CrossRef] [PubMed]
  25. Liu, G.; Zhang, T. Single Copy Oligonucleotide Fluorescence In Situ Hybridization Probe Design Platforms: Development, Application and Evaluation. Int. J. Mol. Sci. 2021, 22, 7124. [Google Scholar] [CrossRef] [PubMed]
  26. Malik, N.; Ranjan, R.; Parida, S.K.; Agarwal, P.; Tyagi, A.K. Mediator subunit OsMED14_1 plays an important role in rice development. Plant J. 2020, 101, 1411–1429. [Google Scholar] [CrossRef] [PubMed]
  27. Tian, C.; Zhai, L.; Zhu, W.; Qi, X.; Yu, Z.; Wang, H.; Chen, F.; Wang, L.; Chen, S. Characterization of the TCP Gene Family in Chrysanthemum nankingense and the Role of CnTCP4 in Cold Tolerance. Plants 2022, 11, 936. [Google Scholar] [CrossRef]
  28. Letunic, I.; Khedkar, S.; Bork, P. SMART: Recent updates, new developments and status in 2020. Nucleic Acids Res. 2021, 49, D458–D460. [Google Scholar] [CrossRef] [PubMed] [PubMed Central]
  29. Yasui, Y.; Ohmori, Y.; Takebayashi, Y.; Sakakibara, H.; Hirano, H.Y. WUSCHEL-RELATED HOMEOBOX4 acts as a key regulator in early leaf development in rice. PLoS Genet. 2018, 14, e1007365. [Google Scholar] [CrossRef]
  30. Hao, X.H.; Hu, S.; Zhao, D.; Tian, L.-F.; Xie, Z.-J.; Wu, S.; Hu, W.-L.; Lei, H.; Li, D.-P. OsGA3ox genes regulate rice fertility and plant height by synthesizing diverse active GA. Yi Chuan 2023, 45, 845–855. [Google Scholar] [CrossRef]
  31. Liao, Z.; Yu, H.; Duan, J.; Yuan, K.; Yu, C.; Meng, X.; Kou, L.; Chen, M.; Jing, Y.; Liu, G.; et al. SLR1 inhibits MOC1 degradation to coordinate tiller number and plant height in rice. Nat. Commun. 2019, 10, 2738. [Google Scholar] [CrossRef] [PubMed]
  32. Shu, K.; Liu, X.D.; Xie, Q.; He, Z.H. Two Faces of One Seed: Hormonal Regulation of Dormancy and Germination. Mol. Plant 2016, 9, 34–45. [Google Scholar] [CrossRef] [PubMed]
  33. Chen, G.; Li, J.; Liu, Y.; Zhang, Q.; Gao, Y.; Fang, K.; Cao, Q.; Qin, L.; Xing, Y. Roles of the GA-mediated SPL Gene Family and miR156 in the Floral Development of Chinese Chestnut (Castanea mollissima). Int. J. Mol. Sci. 2019, 20, 1577. [Google Scholar] [CrossRef]
  34. Yang, C.; Ma, Y.; Li, J. The rice YABBY4 gene regulates plant growth and development through modulating the gibberellin pathway. J. Exp. Bot. 2016, 67, 5545–5556. [Google Scholar] [CrossRef] [PubMed]
  35. Qi, J.; Qian, Q.; Bu, Q.; Li, S.; Chen, Q.; Sun, J.; Liang, W.; Zhou, Y.; Chu, C.; Li, X.; et al. Mutation of the rice Narrow leaf1 gene, which encodes a novel protein, affects vein patterning and polar auxin transport. Plant Physiol. 2008, 147, 1947–1959. [Google Scholar] [CrossRef] [PubMed]
  36. Jung, Y.J.; Kim, J.H.; Lee, H.J.; Kim, D.H.; Yu, J.; Bae, S.; Cho, Y.-G.; Kang, K.K. Generation and Transcriptome Profiling of Slr1-d7 and Slr1-d8 Mutant Lines with a New Semi-Dominant Dwarf Allele of SLR1 Using the CRISPR/Cas9 System in Rice. Int. J. Mol. Sci. 2020, 21, 5492. [Google Scholar] [CrossRef]
  37. Zheng, T.; Dai, L.; Liu, Y.; Li, S.; Zheng, M.; Zhao, Z.; Qu, G.-Z. Overexpression Populus d-Type Cyclin Gene PsnCYCD1;1 Influences Cell Division and Produces Curved Leaf in Arabidopsis thaliana. Int. J. Mol. Sci. 2021, 22, 5837. [Google Scholar] [CrossRef] [PubMed]
  38. Qu, X.; Yan, M.; Zou, J.; Jiang, M.; Yang, K.; Le, J. A2-type cyclin is required for the asymmetric entry division in rice stomatal development. J. Exp. Bot. 2018, 69, 3587–3599. [Google Scholar] [CrossRef] [PubMed]
  39. Lee, J.; Das, A.; Yamaguchi, M.; Hashimoto, J.; Tsutsumi, N.; Uchimiya, H.; Umeda, M. Cell cycle function of a rice B2-type cyclin interacting with a B-type cyclin-dependent kinase. Plant J. 2003, 34, 417–425. [Google Scholar] [CrossRef]
  40. You, J.; Xiao, W.; Zhou, Y.; Shen, W.; Ye, L.; Yu, P.; Yu, G.; Duan, Q.; Zhang, X.; He, Z.; et al. The APC/CTAD1-WIDE LEAF 1-NARROW LEAF 1 pathway controls leaf width in rice. Plant Cell 2022, 34, 4313–4328. [Google Scholar] [CrossRef]
  41. Zhou, L.; Chen, S.; Cai, M.; Cui, S.; Ren, Y.; Zhang, X.; Liu, T.; Zhou, C.; Jin, X.; Zhang, L.; et al. ESCRT-III component OsSNF7.2 modulates leaf rolling by trafficking and endosomal degradation of auxin biosynthetic enzyme OsYUC8 in rice. J. Integr. Plant Biol. 2023, 65, 1408–1422. [Google Scholar] [CrossRef] [PubMed]
  42. Fujino, K.; Matsuda, Y.; Ozawa, K.; Nishimura, T.; Koshiba, T.; Fraaije, M.W.; Sekiguchi, H. NARROW LEAF 7 controls leaf shape mediated by auxin in rice. Mol. Genet. Genomics 2008, 279, 499–507. [Google Scholar] [CrossRef] [PubMed]
  43. Bae, K.D.; Um, T.Y.; Yang, W.T.; Park, T.-H.; Hong, S.-Y.; Kim, K.-M.; Chung, Y.-S.; Yun, D.-J.; Kim, D.-H. Characterization of dwarf and narrow leaf (dnl-4) mutant in rice. Plant Signal. Behav. 2021, 16, 1849490. [Google Scholar] [CrossRef] [PubMed]
  44. Ma, L.; Sang, X.; Zhang, T.; Yu, Z.; Li, Y.; Zhao, F.; Wang, Z.; Wang, Y.; Yu, P.; Wang, N.; et al. ABNORMAL VASCULAR BUNDLES regulates cell proliferation and procambium cell establishment during aerial organ development in rice. New Phytol. 2017, 213, 275–286. [Google Scholar] [CrossRef]
  45. Hu, J.; Zhu, L.; Zeng, D.; Gao, Z.; Guo, L.; Fang, Y.; Zhang, G.; Dong, G.; Yan, M.; Liu, J.; et al. Identification and characterization of NARROW AND ROLLED LEAF 1, a novel gene regulating leaf morphology and plant architecture in rice. Plant Mol. Biol. 2010, 73, 283–292. [Google Scholar] [CrossRef]
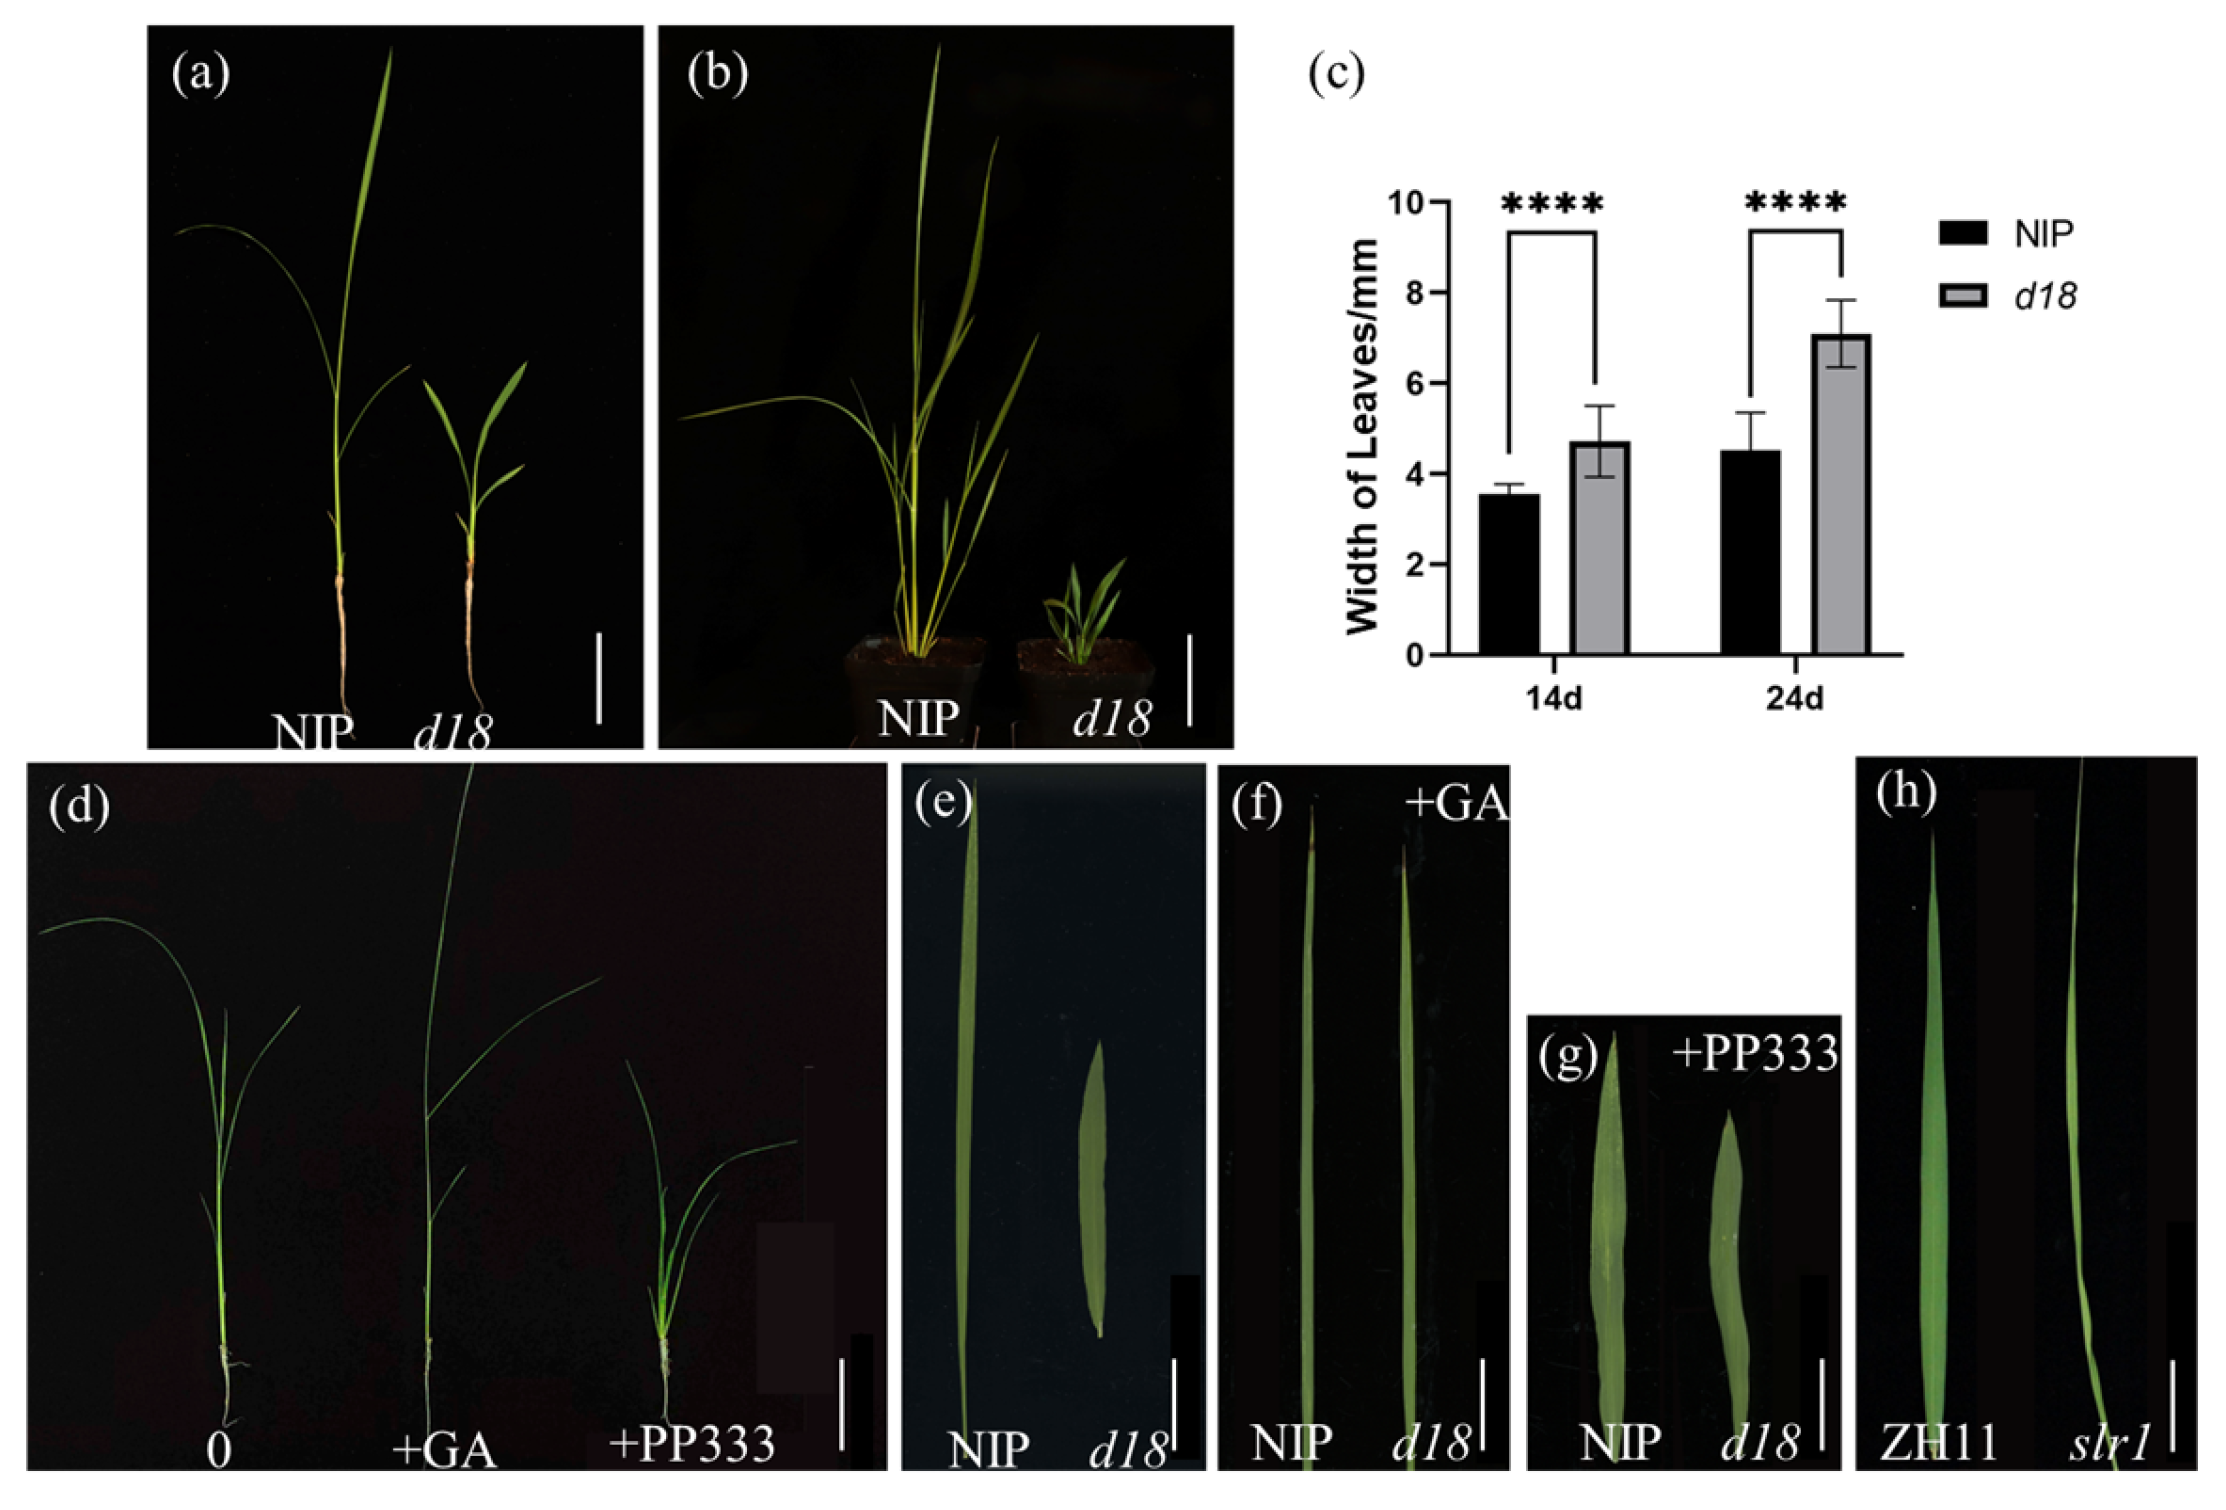
Figure 1. GA controls rice leaf width. (a) Fourteen-day-old seedlings in WT and d18; scale bar = 5 cm. (b) Twenty-four-day-old seedlings in WT and d18; scale bar = 7 cm. (c) Analysis width of leaves in d18 and NIP; t-test; **** represent significant distinction and p-value < 0.0001. (d) GA and PP333 treatment seedings for 7 days; scale bar = 7 cm. (e) L3 from NIP and d18; scale bar = 1.65 cm. (f) L5 after GA treatment for 7 d from NIP and d18; scale bar = 2.36 cm. (g) L5 treatment PP333 for 7 d in NIP and d18; scale bar = 1.74 cm. (h) Flag leaf from ZH11 and slr1; scale bar = 1.96 cm.
Agronomy 14 01597 g001
Figure 2. Gibberellins were negatively correlated with leaf width. (a) L3 leaf treated with GA3 for 7 days; concentrations from left to right were 0 μM, 0.1 μM, 1 μM, 10 μM, scale bar = 5 mm. (b) Statistics of leaf width of each GA treatment group (n = 15), and t-test was performed for each treatment group and control group; **** indicates highly significant differences (p-value < 0.0001). (c) The third leaf of rice treated with PP333 for 7 days; PP333 concentrations from left to right were 0 μM, 0.1 μM, 1 μM, and 10 μM; scale bar = 5 mm. (d) Statistics of leaf width of each PP333 treatment group (n = 15), and t-test was performed for each treatment group and control group; **** indicates highly significant differences (p-value < 0.0001).
Agronomy 14 01597 g002
Figure 3. Two conservative domains of OsD18. (a) Domain structure analysis. The first box indicates the domain is the highly conserved N-terminal region of proteins with 2-oxoglutarate/Fe (II)-dependent dioxygenase activity. The second box indicates that the domain is iron 2OG dioxygenase domain. Second domain of D18 was annotated about the formation of plant hormones, such as ethylene, gibberellins, anthocyanidins and pigments such as flavones. (b) Phylogenetic tree analysis. Eight proteins sequences were used to build a phylogenetic tree from PaGA3BOX2; SiGA3BOX2; SvGA3OX2L; PmGA3OX2L; SbGA3BOX2-2; ZmGA3OX1; ZmGA3BOX2-2; OsGA3BOX; and OsD18. Red triangle indicates OsD18. (c) Multiple alignment analysis of sequences; amino acid sequences from (b). Black shadow indicates highly conservative regions; red box is 2OG-Fell_Oxy Domain. (d) GA biosynthesis pathway model. Red box indicates OsD18 active product GA3 oxidase.
Agronomy 14 01597 g003
Figure 4. Fewer vascular bundles in d18. (a) Twelve-day-old seedlings from L3 in NIP; scale bar = 100 μm; red boxes indicate primary vascular bundles; black arrows indicate second vascular bundles. (b) Twelve-day-old seedlings from L3 in d18; scale bar = 100 μm; red boxes indicate primary vascular bundles; black arrows indicate second vascular bundles. (c) Number of primary vascular bundles, second vascular bundles, and total vascular bundles. Statistical analysis by t-test; ns indicates no significant distinction; ** indicates significant distinction, p-value < 0.01; **** indicates significant distinction, p-value < 0.0001; n = 3 in each group. (d) Red box is the primary vascular bundle in NIP; scale bar = 50 μm. (e) Red box is the primary vascular bundle in d18; scale bar = 50 μm.
Agronomy 14 01597 g004
Figure 5. In situ hybridization of OsD18 in shoots’ apical meristem. In situ hybridization to detect OsD18 transcripts in NIP SAM tissue, scale bar = 50 μm. The black arrows indicate the blade margin area; the red boxes indicate the blade margin area and shoot apical meristem area. The black box shows the enlarged image of the blade margin area. The figure shows two consecutive slices.
Agronomy 14 01597 g005
Figure 6. RNA-seq differential expression analysis and GO annotation enrichment analysis. (a,b) Volcanic map by DEseq2 showing the differential expression of genes between d18 and WT samples (p-value < 0.05, log2FC > 1 or log2FC < −1). Ds vs. ws, comparing d18 SAM tissue; de vs. wl, comparing d18 leaf with control leaf tissue. (c) GO-annotated enriched bubble map of differential expression genes in d18 SAM samples. (d) GO-annotated enrichment bubble map of differential expression gene in leaf samples of d18.
Agronomy 14 01597 g006
Figure 7. Expression profile analysis of some cell-cycle marker genes in SAM tissues. Cluster heat was drawn according to the differential expression of CYCs in d18 and wild-type SAM tissue. Red represents gene expression above the mean, green represents gene expression below the mean, and color shades indicate the degree of difference.
Agronomy 14 01597 g007
Figure 8. In situ hybridization to detect H4 and CYCB2 transcription in NIP and d18 SAM tissue. (a) Section of wild-type SAM tissues; OsH4 probe; scale bar = 50 μm. (b) Section of SAM tissue in PP333 treatment group; OsH4 probe; scale bar = 50 μm. (c) Section of NIP SAM tissues; OsCYCB2 probe; scale bar = 50 μm. (d) Section of d18 SAM tissues; OsCYCB2 probe; scale bar = 50 μm. Blue markers indicate leaf margin; black arrows indicate signal.
Agronomy 14 01597 g008
Figure 9. Expression profile analysis of leaf development marker genes in SAM tissues. Cluster heatmaps were generated based on the differential expression of leaf width in d18 and wild-type SAM tissue. (a) indicates marker genes for leaf-curved development; (b) indicates genes associated with leaf-width development. “d18” represents SAM tissues from d18 plants, while “WT” represents SAM tissues from wild-type plants. In the heatmap, red indicates gene expression above the mean, green indicates gene expression below the mean, and different shades of color indicate varying degrees of difference.
Agronomy 14 01597 g009
Figure 10. Expression level of OsNAL1 and OsNAL2. (a) The abscissa represents the two genes tested, the ordinate represents their relative expression, black represents NIP SAM tissue, gray represents d18 SAN tissue, and *** represents a highly significant difference (p < 0.0001); (b) the abscissa represents the two genes tested, the ordinate represents their relative expression, black represents the PP333 treatment group, gray represents the control group, the white box represents GA treatment group, and **** represents a highly significant difference (p < 0.0001); ns is no difference.
Agronomy 14 01597 g010
Table 1. Primer list.
Primer NameTypeSequence (5′-3′)
Histone H4-FForward PrimerATGTCTGGGAGAGGCAAGGG
Histone H4-RReverse PrimerTAATACGACTCACTATAGGGAGACTAGCCGCCGAATCCGTAGA
CYCB2-FForward PrimerATGGAGAACATGAGATCTGAG
CYCB2-RReverse PrimerTAATACGACTCACTATAGGGAGATTACAGTGCCACGCTCTT
D18-FForward PrimerGAGGATCGGCGAGAGGATGA
D18-RReverse PrimerTAATACGACTCACTATAGGGAGAGAGGAAGTAGCCGAGCGAGA
NAL1-qFForward PrimerGATGACTTTGACATTTCCACCGT
NAL1-qRReverse PrimerGAGTGATTCATTGGTAATGATA
NAL2-qFForward PrimerCCGGAGCAGCTGATGATCC
NAL2-qRReverse PrimerGGATCATCAGCTGCTCCGG
Disclaimer/Publisher’s Note: The statements, opinions and data contained in all publications are solely those of the individual author(s) and contributor(s) and not of MDPI and/or the editor(s). MDPI and/or the editor(s) disclaim responsibility for any injury to people or property resulting from any ideas, methods, instructions or products referred to in the content.