Abstract
Inland arid basins face the challenge of ecological deterioration due to insufficient water availability. The irrigation water consumption depletes the water flowing into the downstream tailrace ecological wetland, leading to increasing ecological deterioration. It is urgent to optimize the management of irrigation water resources in the middle reaches and improve the ecological sustainability of the lower reaches. To ensure sustainable development, improving water use efficiency and preserving the health of basin ecosystems should be simultaneously considered in the agricultural water management of these regions. Therefore, a 0–1 integer multi-objective programming approach was proposed to optimize midstream crop planting. This method has advantages in (1) effectively balancing ecological sustainability, agricultural production, and water-saving goals; (2) linking irrigation district management with grid geographic information to develop land use strategies; and (3) obtaining optimal solutions for multi-objective synergies. The proposed approach is applied to a typical inland river basin in China, the Heihe River Basin in Gansu Province. Results indicate that the optimization schemes can increase agricultural benefits, crop suitability, water use efficiency, and ecological quality by 12.37%, 6.82%, 13.00%, and 8.04% (compared to 2022), respectively, while irrigation water can be saved about 7.53%. The optimization results and proposed approach can help decision-makers manage water resources in the Heihe River Basin and similar regions.
1. Introduction
Water and soil resources are essential strategic assets for agricultural production and socio-economic development [1]. However, global freshwater resources constitute only 0.325% of the total water volume [2], severely limiting their availability. Rapid economic growth and continuous population increases have made water scarcity an increasingly urgent global issue [3]. According to United Nations statistics [4], around 1.10 billion people face water scarcity, and this number continues to rise. Agriculture, the largest water-consuming sector, has an immense demand for water and significantly impacts the ecological environment [5]. In China, a major agricultural country, per capita water resources are just one-third of the global average. Inefficient agricultural water use and severe irrigation wastage pose direct threats to sustainable agricultural development [6]. Improving agricultural water use efficiency has become a priority in addressing these challenges. In arid and semi-arid regions, it is vital to apply scientifically grounded management and technological measures to promote the coordinated development of food production, ecological protection, and water resource utilization for sustainable development [7]. In practice, water managers realized that the optimization of cropping structures could mitigate irrigation water consumption, improve wetland quality, and address ecological challenges, thus ensuring enduring agricultural sustainability.
Optimizing cropping structure involves scientifically adjusting crop types, proportions, and layouts to enhance land and water resource efficiency, increase crop yield and quality, boost farmers’ income, and protect the ecological environment [8]. Allocating appropriate crop types to different irrigation areas is crucial for promoting the integrated development of regional agricultural production, rational water resource utilization, and ecological sustainability [9]. Previous studies have established a foundation in cropping structure optimization. Tang et al. [10] optimized the cropping structure in the middle reaches of the Heihe River Basin by considering crop suitability, water requirements, and economic benefits, providing an optimized structure at the grid scale. Yu et al. [11] used water footprint and multi-objective models to optimize Zhangjiakou City’s agricultural structure in three aspects: saving water, reducing pollution, and increasing economic output. Liu et al. [12] developed a multi-objective spatial CPSO model to maximize regional economic water productivity (EWP), minimize blue water reliance (BWFrate), and reduce grey water footprint (GWFgrey), achieving optimal cropping layout. Optimizing cropping structures can significantly reduce excessive irrigation water consumption and improve water use efficiency. It positively impacts downstream ecosystems, mitigating wetland area reduction caused by excessive irrigation. Therefore, factors like irrigation water efficiency and ecological quality should be considered when adjusting the cropping structure.
Ecological issues caused by irrigation in arid areas are crucial yet largely overlooked in the management of agricultural land–water resources [13,14]. Irrigation in arid regions heavily relies on surface runoff [15]. In typical inland river basins, the midstream regions, serving as critical agricultural hubs for human sustenance, are heavily dependent on the runoff for irrigation from the upstream areas. The availability of surface water from the upstream regions is a prerequisite for the sustenance and productivity of these agricultural zones [16]. Midstream irrigation water consumption determines the amount of water flowing to downstream tail-end wetlands. Different crops have different irrigation water requirements, and thus, strategically planning crop planting structures can improve water use efficiency and reduce midstream water consumption. Then, more water flows to downstream wetlands, and ecological degradation downstream can be mitigated [17]. This forms a system where upstream runoff supplies water, midstream areas consume it for irrigation, and downstream ecosystems depend on the flow. Optimizing midstream cropping structures can significantly benefit downstream ecosystems. This strategy improves agricultural productivity and enhances tail-end wetlands’ ecological health, ensuring a sustainable balance between agricultural demands and environmental protection.
Optimization models are essential for managing agricultural water resources at the irrigation district scale and have seen widespread application [18]. Irrigation water management is complex, involving natural conditions, human activities, and socio-economic factors [19]. Traditional optimization models for agricultural water resources are typically deterministic, but agricultural irrigation involves many uncertainties. These uncertainties include water availability, irrigation quotas, imprecise data, and temporal market price variations [20]. The development of remote sensing technology and Geographic Information Systems (GIS) allows for the acquisition and processing of large amounts of spatial information. These technologies improve the description of spatiotemporal changes in data, aiding accurate and rational water resource optimization at the irrigation district level [21]. As the demand for precision in agricultural water management intensifies, large-scale optimization methods increasingly fail to meet decision-makers’ needs. Higher spatial resolution and grid-based allocation schemes are needed to determine optimal crop types and water allocations for each grid. At the grid scale, the primary task is to identify suitable crop types and water allocations for specific locations [22]. Previous studies have developed a mixed 0–1 integer multi-objective programming approach to optimize crop structures in farmlands [23]. Mature water resource management models consider multiple factors for reasonable irrigation allocation but primarily focus on the irrigation district scale [24]. Few studies optimize crop types and water allocations at the grid scale, linking grid information with irrigation management to enhance cropping structure optimization. This study aims to fill this gap by developing a grid-based optimization method for agricultural water resources integrated with irrigation district management. This approach will provide precise water distribution plans and optimal crop structures, thereby improving resource efficiency and ecological sustainability.
Therefore, to effectively enhance water resource efficiency in arid agricultural areas and protect downstream ecological wetlands, this study proposes a 0–1 integer multi-objective programming approach considering crop suitability, irrigation water efficiency, and ecological wetland quality. The advantages of this method are as follows: (1) effectively balancing conflicts between ecological sustainability, agricultural production, and water conservation goals; (2) integrating irrigation district management levels with grid geographic coordinate information to develop agricultural land use strategies at the grid scale; (3) accurately obtaining optimal solutions that coordinate multiple objectives. This paper mainly focuses on the following three parts: (1) a detailed introduction of the 0–1 integer multi-objective programming approach based on the synergy between irrigation districts and grids; (2) a case study of the proposed method in arid areas of Northwest China; (3) a performance evaluation analysis of the method.
2. Methodology
2.1. Overview of the Problem
In modern agriculture, increasing pressures on resources and the environment require considering various factors and optimizing strategies to mitigate these pressures [25]. Different crops have varying water requirements and suitability. Integrating the spatiotemporal characteristics of crop water needs with hydrological conditions can enhance crop water use efficiency. The response of downstream tail-end wetlands to optimized cropping structure allocation is crucial, as the sustainability of the ecological environment is key to regional development [26]. A transmission effect exists between cropping structure, water, and downstream ecology. Optimizing cropping structures can reduce midstream irrigation water consumption, increase downstream water supply, and improve downstream wetland quality. Irrigation water use efficiency is a direct measure of water resource management in arid agricultural areas. Different crops have varying irrigation water needs, and different irrigation districts have varying canal and field water use efficiencies, contributing differently to cropping structure optimization [27]. Decision-makers should consider improving irrigation water use efficiency as a key component of the optimization process. Ecological issues downstream of arid inland river basin areas are becoming increasingly severe. Midstream irrigation water consumption reduces downstream water supply, leading to decreased wetland areas and loss of vegetation cover. Optimizing midstream cropping structures is crucial for mitigating downstream ecological crises and reducing dust production.
This study addresses two critical issues: (1) How to quantify the spatial suitability of crops based on the irrigation district and grid system, establish the relationship between downstream ecological wetlands and midstream cropping structures, and calculate the irrigation water efficiency of various crops in different spatial locations. (2) How to optimize spatial cropping structures to achieve a satisfactory solution that balances agricultural yield, ecological quality, and efficient water use.
This study integrates considerations of agricultural production, water management, and ecological quality. The study framework is shown in Figure 1.
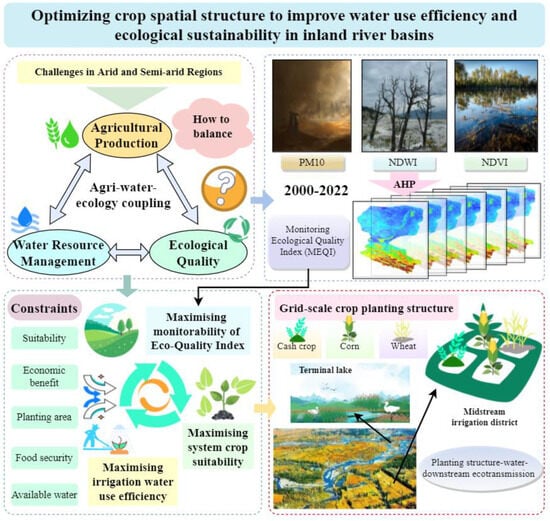
Figure 1.
Study framework.
2.2. Ecological Quality Index
Based on the study by Jiang et al. [28], this study integrates the spatial distribution information of Normalized Difference Vegetation Index (NDVI), Normalized Difference Water Index (NDWI), and particulate matter with particle size below 10 microns (PM10), to measure the ecological quality. NDVI can reflect the vegetation cover change downstream. NDWI can quantify the area change of wetlands downstream. PM10 can monitor the extent of dust impact on downstream areas. Adhering to the analytical framework proposed by Zhang et al. [29], this investigation employed the hierarchical analysis method (AHP) to apportion weights to the NDVI, the NDWI, and the PM10. The objective was to discern the ecological dynamics within the wetland area at the watershed’s tailrace, which necessitated the establishment of a correlative model linking these indices to the river’s midstream discharge volume. The weights were meticulously allocated to reflect the individual significance of each index: NDWI was weighted to capture the variations in the wetland’s water surface area, NDVI to gauge the alterations in terrestrial cover, and PM10 to quantify the downstream generation of particulate matter. Given the antagonistic nature of PM10’s influence, its weight was inversely proportional to the positive contributions of NDVI and NDWI. To account for the divergent correlational impacts, NDVI was assigned a weight of 0.5, with both NDWI and PM10 receiving equal weights of 0.25. The PM10’s combined value was then adjusted by the discrepancy from the unit sum, reflecting its inverse relationship with the other indices. Subsequently, leveraging the ArcGIS raster calculator, a composite indicator, the Monitoring Ecological Quality Index (MEQI), was formulated. This index amalgamates the weighted indices to provide a comprehensive assessment of the ecological integrity within the watershed’s downstream and midstream regions, thereby facilitating a more nuanced understanding of the interplay between hydrological and ecological processes.
In arid agricultural regions, there is a system of upstream runoff supply, midstream irrigation consumption, and downstream wetland discharge. Therefore, the water demand for midstream irrigation directly affects the downstream discharge, leading to insufficient replenishment of terminal wetlands and subsequent ecological degradation. There is a correlation between discharge and the area of downstream terminal wetlands. Curve fitting can establish a function between the MEQI and midstream discharge. The formula is shown as follows.
In the equation, MEQI represents the Monitoring Ecological Quality Index, Q denotes the upstream runoff, and GIWC stands for the midstream irrigation water consumption.
2.3. 0–1 Integer Multi-Objective Programming Model and Solving Method
The general form of a 0–1 integer multi-objective programming approach can be expressed as follows [30].
Objective function:
Constraints:
where f1,…, fn represent the 1st to nth objective function, a1,…, an represent the coefficients of the 1st to nth objective function, bq is the right-hand side constraint, and xm represents the 0–1 integer decision variable.
The primary advantage of the 0–1 integer multi-objective programming is its ability to determine the most suitable crop type for each grid. It uses integers to identify crop selection, assigning 1 to the optimal crop and 0 to others. This method can also integrate with multi-objective approaches to simultaneously consider conflicts between multiple goals, achieving a balanced optimal result.
The model combines multi-objective programming, integer programming, and nonlinear programming. Therefore, the multi-objective model is transformed into a single-objective model using the minimum deviation method to solve the multi-objective problem. The specific steps are listed as follows [31].
- (1)
- Constructing the model;
- (2)
- Converting each objective function into a minimization model;
- (3)
- Solving each objective separately to obtain the maximum and minimum values of each objective:
- (4)
- Transforming the multi-objective model into a single-objective model and obtaining the spatial crop planting structure by solving following formulas [32].
Objective function:
Constraints:
In the equation, ρ1,…, ρm are the weights of each objective obtained through the AHP method, c1,…, cn represent the coefficients of the first to the nth objective functions, bq is the right-side constraint, and ys represents the 0–1 integer decision variables.
The normalization function fm is defined as follows.
2.4. Optimization Model for Spatial Cropping Structure of Crops
2.4.1. Objective Function
- (1)
- Maximizing crop growth suitability
Due to the spatial heterogeneity of soil, topography, and meteorological conditions, there are differences in crop suitability between different grid cells [33]. Therefore, when optimizing the spatial distribution of crop planting, it is necessary to consider the adaptability of different crops to the environment. The suitability of various crops for each grid can be assessed through evaluation methods. The objective of maximizing crop growth suitability at the system level is outlined as follows:
- (2)
- Maximizing irrigation water use efficiency at the system level
Due to variations in canal efficiency and field efficiency among different irrigation districts, corresponding irrigation water allocations need to be adopted for different management levels. Therefore, to effectively allocate limited irrigation water resources, it is imperative to maximize the irrigation water use efficiency of the entire system. The objective function can be expressed as follows:
- (3)
- Maximizing ecosystem monitoring quality index
The sustainable and efficient utilization of water resources is directly linked to the health of ecosystems [34]. The ecological quality of the tailrace wetlands in the lower part of the basin is contingent upon the quantity of water discharged in the middle reaches. This quantity is equal to the upstream runoff minus the consumption of irrigation water in the middle reaches. Different cropping structures in the midstream region of the basin consume varying amounts of water, leading to reduced water inflow into downstream wetlands. This affects vegetation coverage, changes in wetland area (refers to the amount of actual change in current wetland area), and the concentration of dust particles in the atmosphere, all of which reflect regional ecological quality [35]. The sustainability of the regional ecological environment is evaluated using an MEQI constructed from NDVI, NDWI, and PM10 data on different grids. A higher Ecosystem Quality Index indicates a longer-lasting sustainable ecological effect. Utilizing this relationship, the objective of the Ecosystem Quality Index can be formulated as
2.4.2. Constraints
- (1)
- Suitability constraint
m is the decision variable. If it is suitable to plant the j th crop in the i th grid, then m = 1; otherwise, m = 0. Only one crop can be planted in each grid. This decision variable allows us to determine the most suitable type of crop to be planted in each grid with the following constraints:
- (2)
- Food security constraint
Every individual requires a basic supply of food for survival each year, thus imposing constraints on the minimum supply of food. This constraint can be expressed as
- (3)
- Economic efficiency constraints
Optimization of the cropping structure should not reduce the economic efficiency of the area. This constraint is as follows:
- (4)
- Limitations on the area of arable land
The area under each crop should be appropriate to local conditions. The upper and lower limits of the area of each crop shall be determined in accordance with local policies and cultivation conditions. According to the Zhangye City Territorial Spatial Master Plan (2021–2035).
- (5)
- Water availability limits
The total water requirement of crops within a grid shall not exceed the total water availability of the study area:
Program all the above objective functions and constraints in Lingo18.0 software. And follow the appropriate solution method to obtain the final optimization result.
The meaning of variables and parameters can be found in Table 1.

Table 1.
Naming and meaning of variables and parameters.
3. Case Study
3.1. Overview of the Study Area
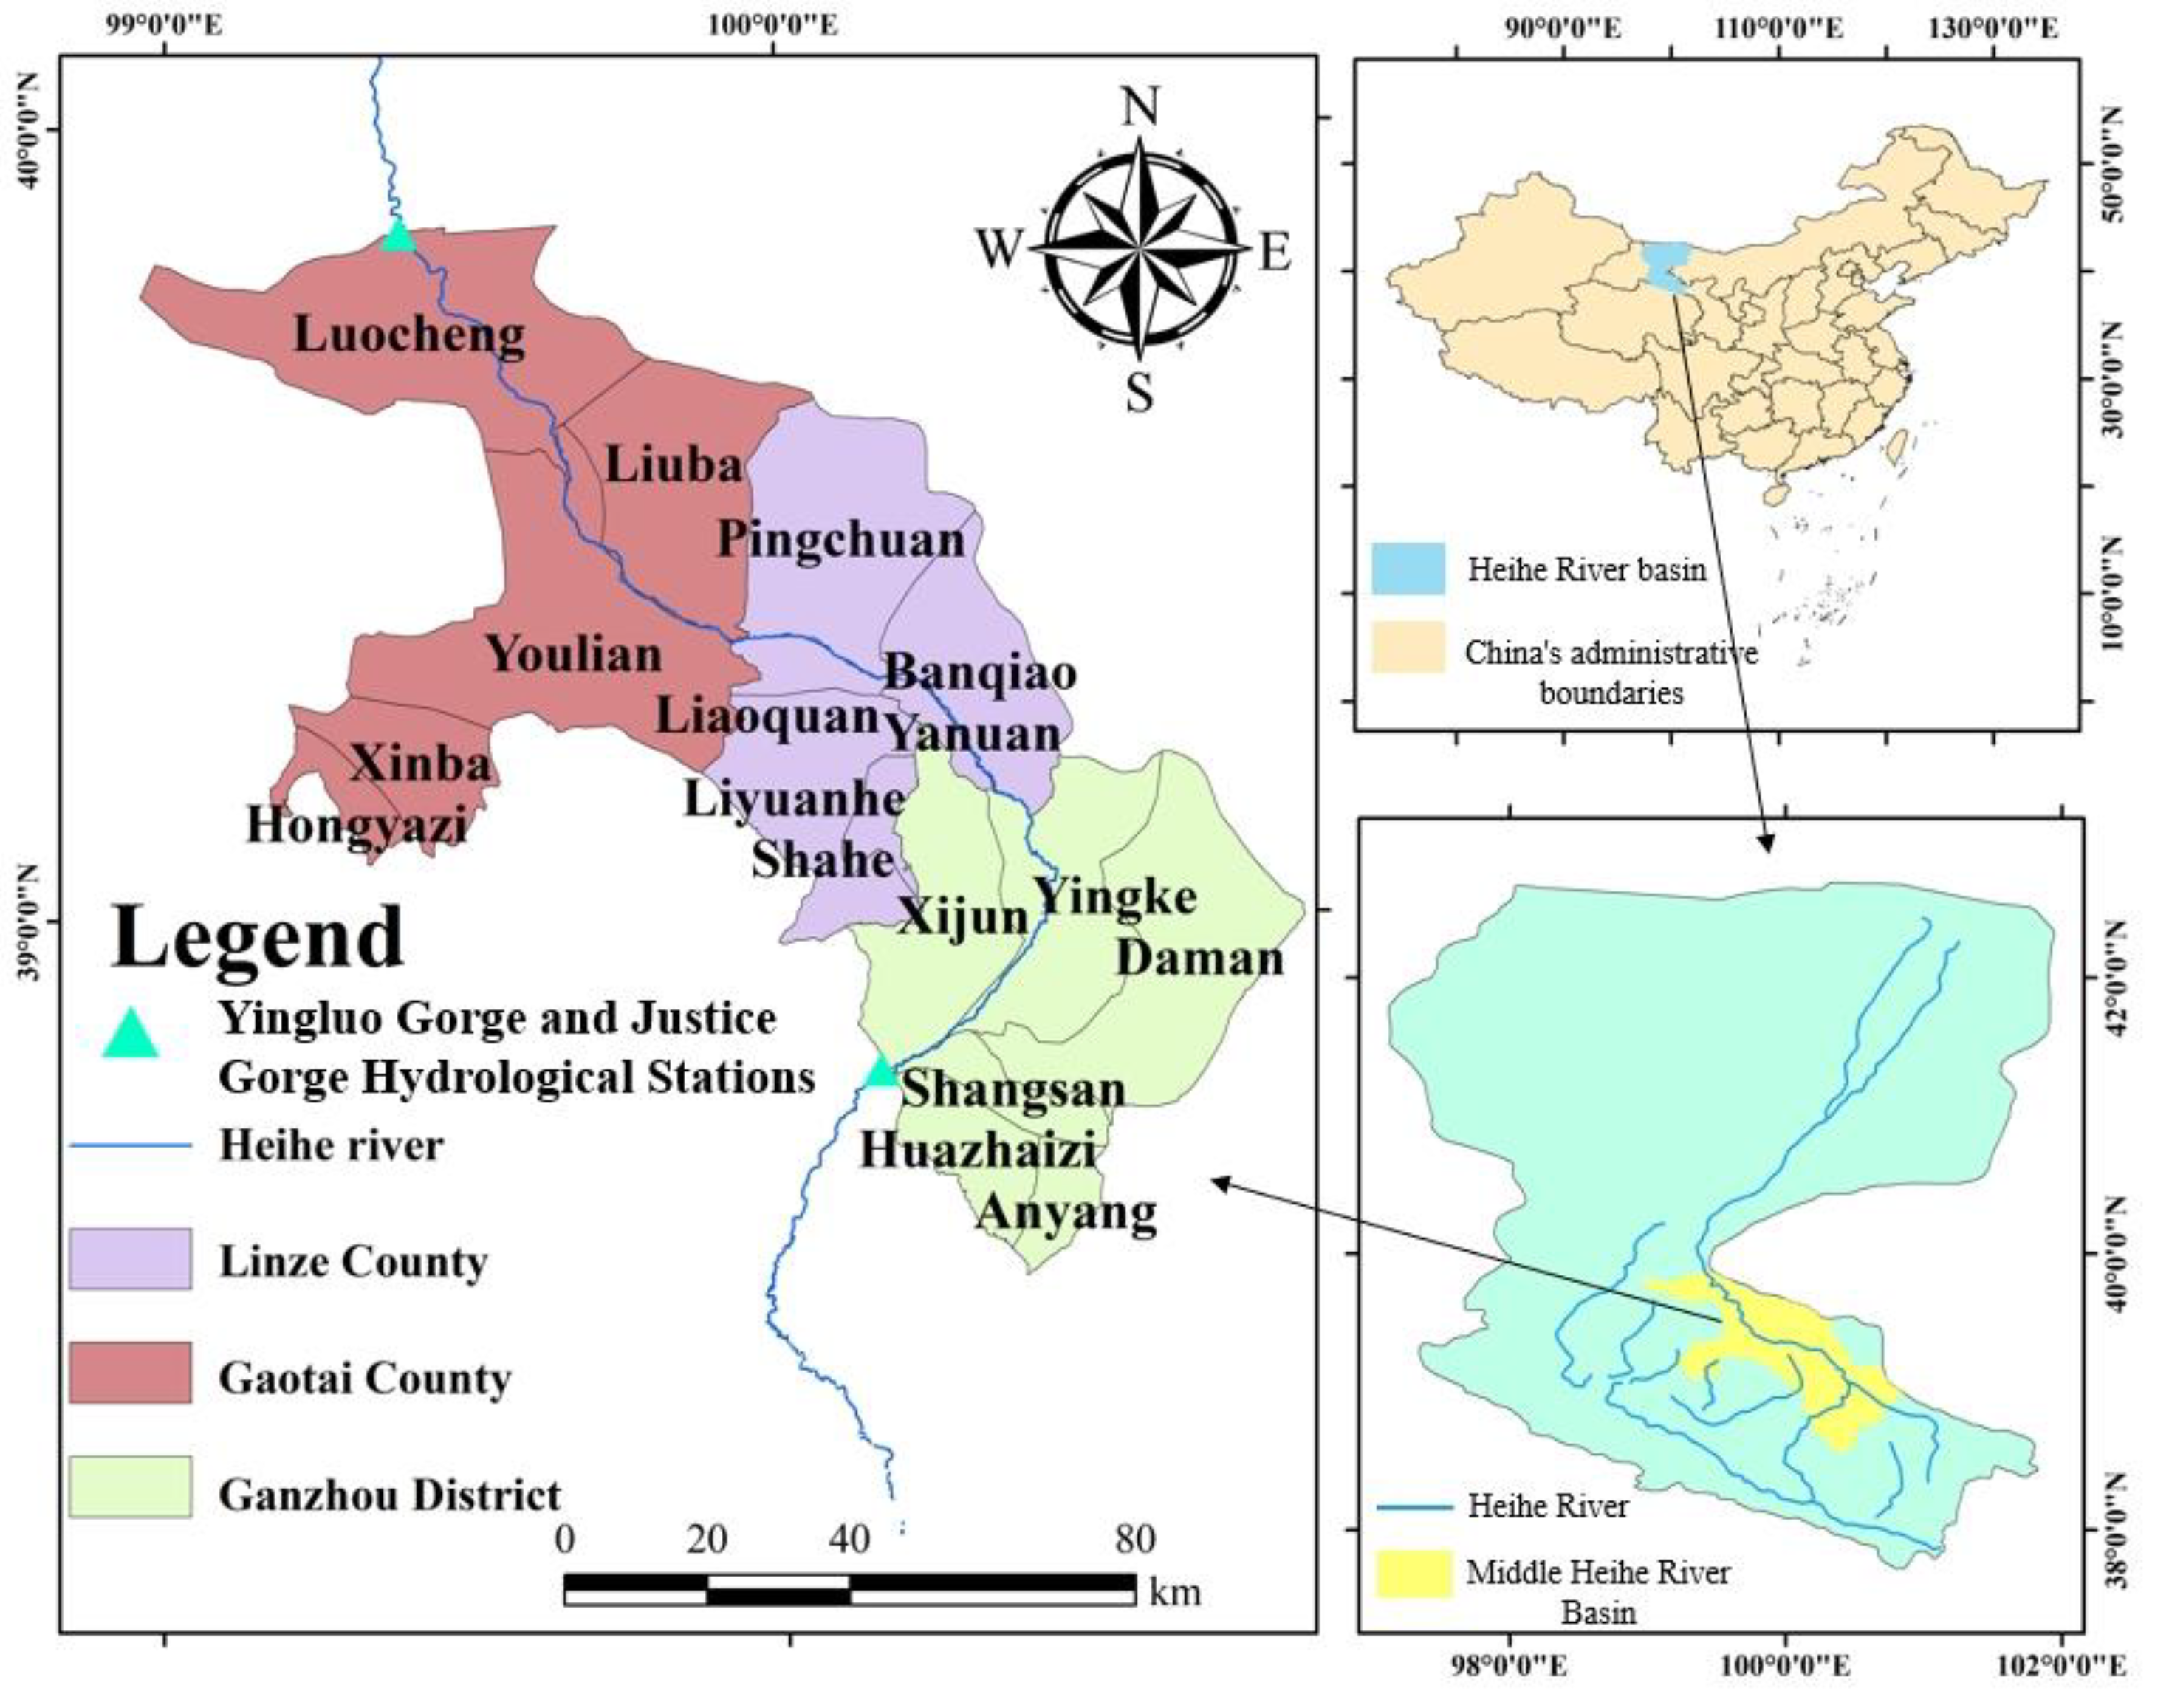
Heihe River, the second-largest inland river in China, is located in the midstream region of Gansu Province in northwest China (98°00′–100°55′ E, 38°50′–40°00′ N) (Figure 2). Originating from the Qilian Mountains in Qinghai Province, it flows through the Hexi Corridor and into Juyan Lake in Inner Mongolia, covering three provinces: Qinghai, Gansu, and Inner Mongolia. The administrative regions include Ganzhou District, Linze County, and Gaotai County of Zhangye City. The area is divided into 17 districts based on irrigation zoning. The upstream, midstream, and downstream segments of the Heihe River are divided by the Yingluo Gorge and Zhengyi Gorge. The midstream region of the Heihe River, with abundant land resources, ample sunlight, and convenient irrigation conditions, has long been a crucial agricultural center in China. Major crops include field corn, seed corn, wheat, and other cash crops, with a growing season from April to September. The cultivated area and water use in the midstream region account for over 80% of the entire basin [36]. Due to high evapotranspiration and limited precipitation, irrigation is the primary water source for crops. Increasing irrigation water demand has led to a sharp decline in water flow to the tail-end wetlands, exacerbating ecological problems downstream of the Heihe River basin [37]. Midstream irrigation water consumption reduces downstream water supply, resulting in reduced wetland area, loss of vegetation cover, and making the region a major source of dust storms in China [38]. Therefore, effective water conservation and comprehensive reduction of water consumption have become urgent issues for local water resource managers to ensure agricultural production.
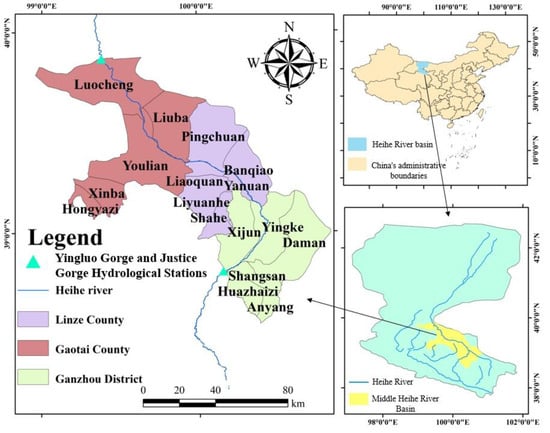
Figure 2.
Geolocation of the study area.
3.2. Data Collection and Pre-Processing
This study uses the year 2022 as a representative year for analysis. Data sources are listed in Table 2.
Table 2.
Data sources.
The ET0 is calculated using the single Hargreaves formula, as provided in FAO-56, for conditions lacking solar radiation and relative humidity data [39]:
where Tmax is the maximum temperature in the study area during a certain period of time, Tmin is the minimum temperature during the same period of time, and Tmean is the average temperature during the same period of time. The parameter a represents the Hargreaves coefficient. λ indicates the temperature difference index, and ω represents the regional temperature correction value. Ra is the extraterrestrial radiation (MJ·m−2·day−1), calculated using the following formula [40]:
where GSC is the solar constant (GSC = 0.0820 MJ·m−2·min−1); dr is the inverse relative distance between the Earth and the sun; ωS is the solar hour angle (rad); φ is the latitude (rad); and δ is the solar declination (rad).
Crop suitability data for wheat, maize, and cash crops in the study area were derived from previous studies, with a spatial resolution of 1 km. It was assumed that field corn and seed corn have the same suitability. Field and canal water use coefficients for each irrigation district were obtained from Zhang et al. [41]. Effective precipitation (EP) was calculated using the following formula:
where EP is the effective precipitation (mm); ε is the effective precipitation coefficient (dimensionless); based on the previous study, ε is taken as 0.8 in this region; and P is the amount of precipitation in mm. Crop water requirement can be calculated by using the formula [42]:
where KC is the crop coefficient (dimensionless), and ET0 is the evapotranspiration. KC is used for field maize, seed maize, wheat, and cash crops and is given with reference to previous studies [43].
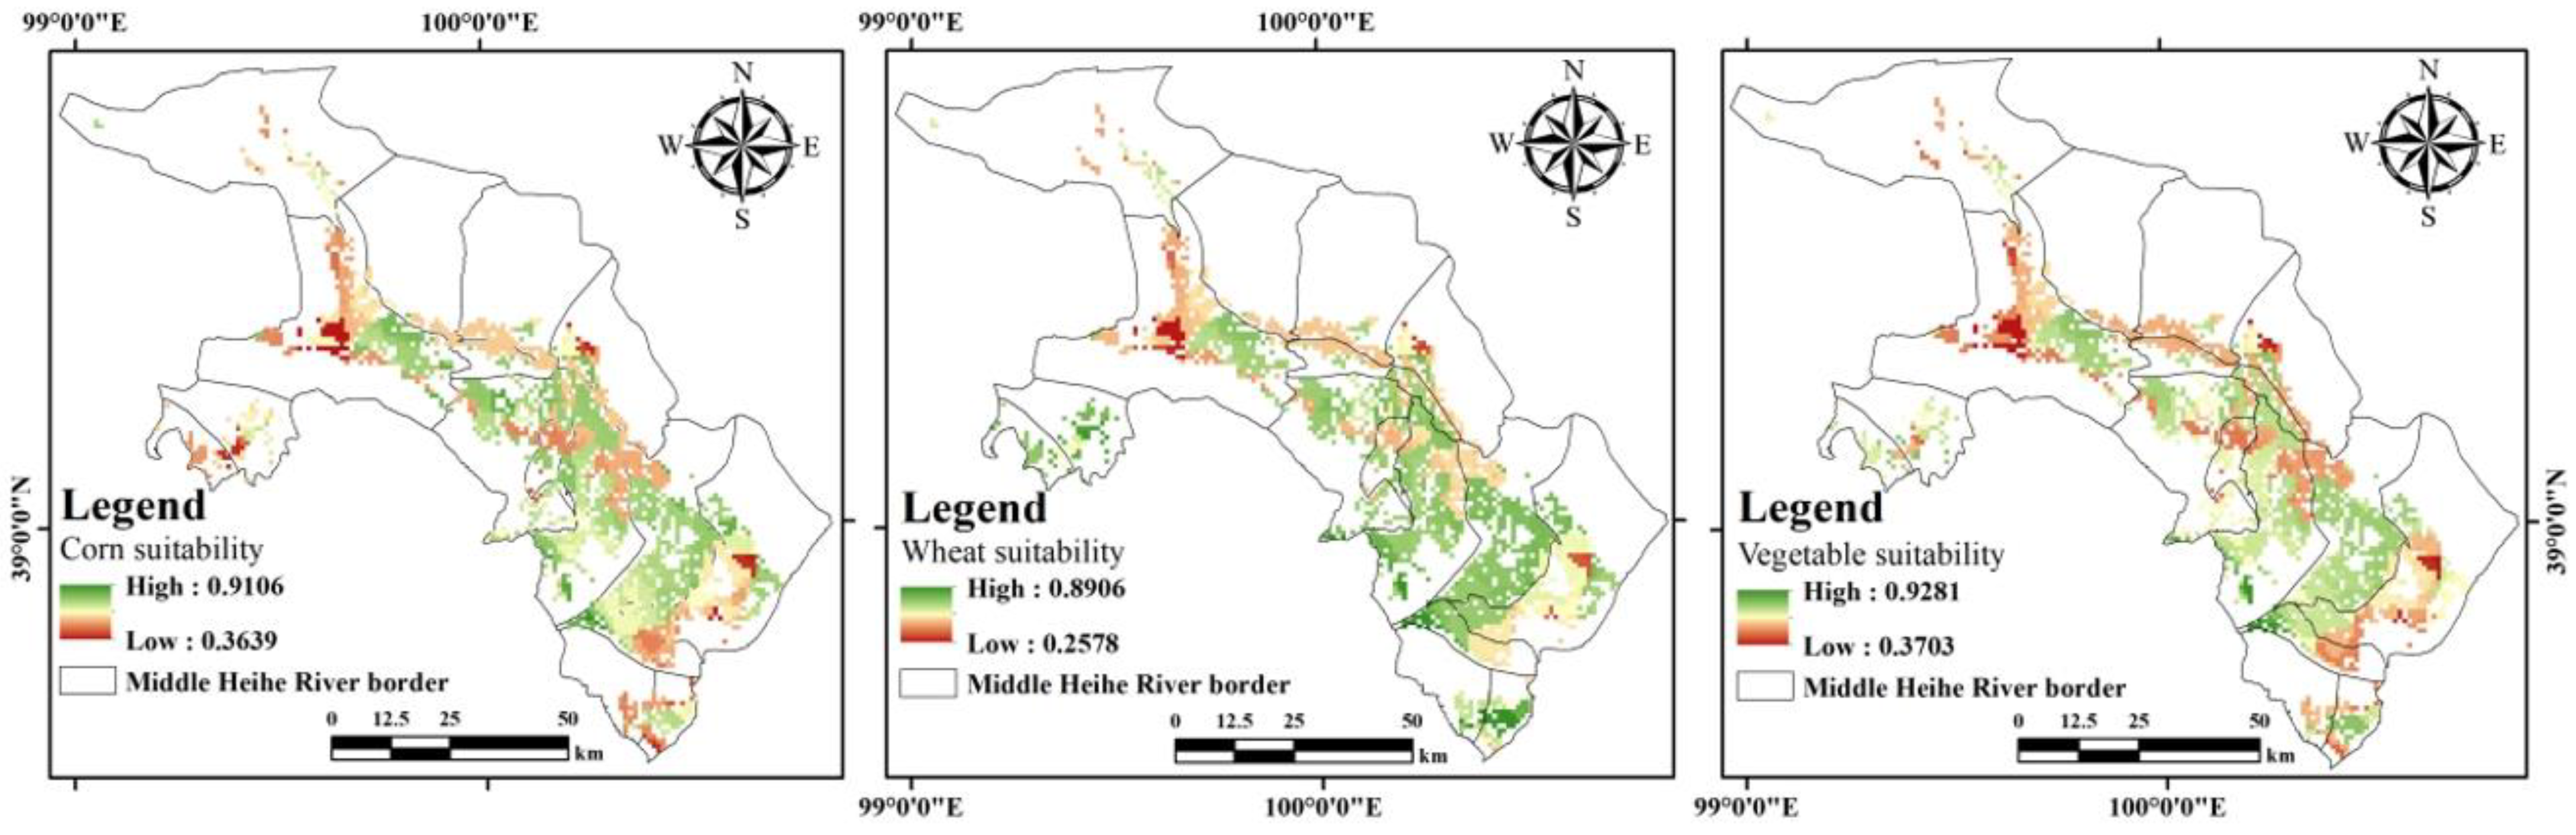
Figure 3 shows the crop suitability distribution of maize, wheat, and cash crops obtained from the collection. Figure 4 shows the calculated evapotranspiration distribution for the reference crops.
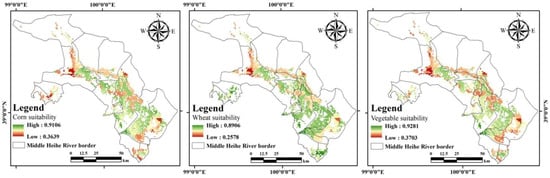
Figure 3.
Distribution of suitability for cultivation of maize, wheat, and cash crops.
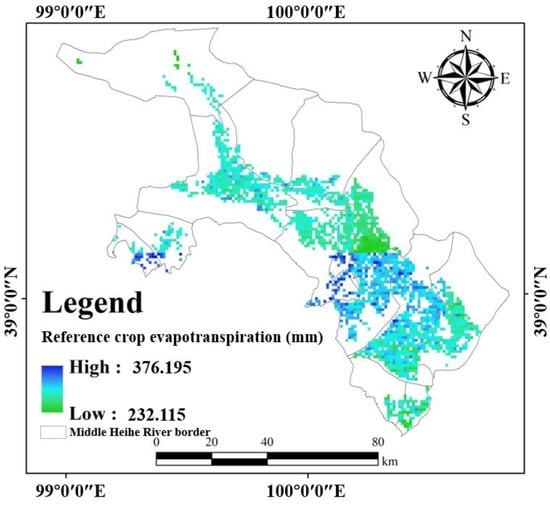
Figure 4.
Reference crop evapotranspiration distribution.
Using statistical data from regional yearbooks and development reports obtained through field surveys, the basic information for different crops is provided in Table 3. The field and canal water use coefficients for each irrigation district, shown in Table 4, were derived from the studies by Li et al. [44], Fan et al. [45], and Zhang et al. [46] and adapted to the actual conditions of the study area. Based on field surveys and data queries, the population of the study area in 2022 was 931,400, with an annual per capita food demand of 400 kg.
Table 3.
Basic crop information.
Table 4.
Coefficients of field and canal water use in each irrigation district.
4. Results Analysis
4.1. Changes in Ecological Quality in the Heihe River Basin
AHP method was applied to assign weights to NDVI (0.5), NDWI (0.25), and PM10 (0.25) data, respectively, the spatial and temporal distributions of MEQI in the Heihe River Basin from 2000 to 2022 were constructed using the raster calculator in ArcGIS. The results are shown in Figure 5. From 2000 to 2022, the overall ecological quality (MEQI) of the Heihe River Basin showed a gradual improvement trend and fluctuated from 2000 to 2008. The MEQI continues to increase and fluctuate less from 2008 to 2016, indicating that the ecological management measures are gradually taking effect. The MEQI for 2016–2022 remains high, as does the MEQI for 2010. This indicates that soil and water conservation play an important role. The MEQI in 2016–2022 maintains a high level and continues to increase slightly, indicating that the ecological quality continues to improve.
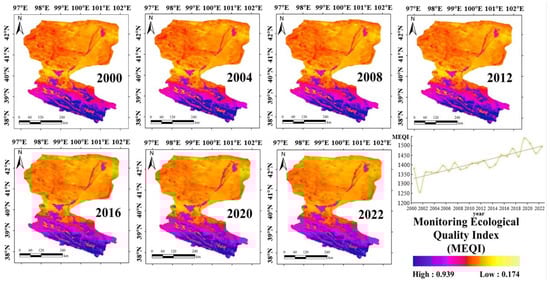
Figure 5.
Spatial and temporal distribution of MEQI in the Heihe River Basin from 2000 to 2022.
The MEQI changes in the upper, middle, and lower reaches of the Heihe River Basin are different in different time periods. In the upper reaches, the MEQI basically remained at a high level from 2000 to 2022, and the overall ecological quality was stable. This is because the upstream area has a better water supply, and the land has not been extensively used for agriculture, so the ecological protection is better. The MEQI in the middle reaches is slightly lower than that in the upper reaches but has basically remained at a good level (>0.5) from 2000 to 2022, showing a slow upward trend. This is due to the fact that the middle reaches are the main agricultural production area, and agricultural activities have some impact on the ecological quality, but the stable water supply in the upper reaches provides good irrigation conditions and slows down the ecological degradation. The downstream area has the lowest MEQI values, especially in the northwest, where ecological quality is gradually deteriorating. A few areas in the northeastern part of the downstream area had better and increasing ecological quality. The downstream wetlands depend on water recharge from upstream and midstream, but irrigation in the midstream consumes some of the water, resulting in downstream wetland shrinkage and ecological degradation. The arid northwestern region has long been affected by dust and sand with high PM10 content, which has a negative impact on ecological quality.
Overall, there is variability in change trends in the upper and lower reaches. The upper reaches have the highest ecological quality and the least change. The middle reaches have medium ecological quality and relatively stable changes. The downstream area has the lowest ecological quality and the most obvious changes, especially the deteriorating trend in the northwest. Water resources in the upstream area are abundant and stable, while agricultural water consumption in the middle reaches is high, leading to a decrease in water resources in the downstream area and affecting wetland ecology. Conversely, the upstream land is better protected, while the midstream agricultural activities have some ecological impacts. The downstream wetlands depend on water resources and are most affected by their reduction. The northwestern part of the downstream has been affected by dust and sand for a long time, with a high PM10 content, which has a reverse containment effect on ecological quality.
The MEQI values in the downstream area, particularly in the northwest, are low and exhibit a declining trend, which reflects the vulnerability of the downstream ecology. The downstream wetland ecosystem is highly dependent on water supply from upstream and midstream. Consequently, a reduction in the water supply will result in a reduction in the wetland area and an associated deterioration in the ecological quality. The region has long been subject to the adverse effects of sandstorms and dust storms, with elevated PM10 levels exerting continuous pressure on the ecosystem [47]. It is, therefore, evident that the downstream area requires the implementation of additional ecological protection measures, including the rational allocation of water resources, a reduction in agricultural water use, and the restoration of vegetation, in order to enhance the stability and resilience of the ecosystem [48].
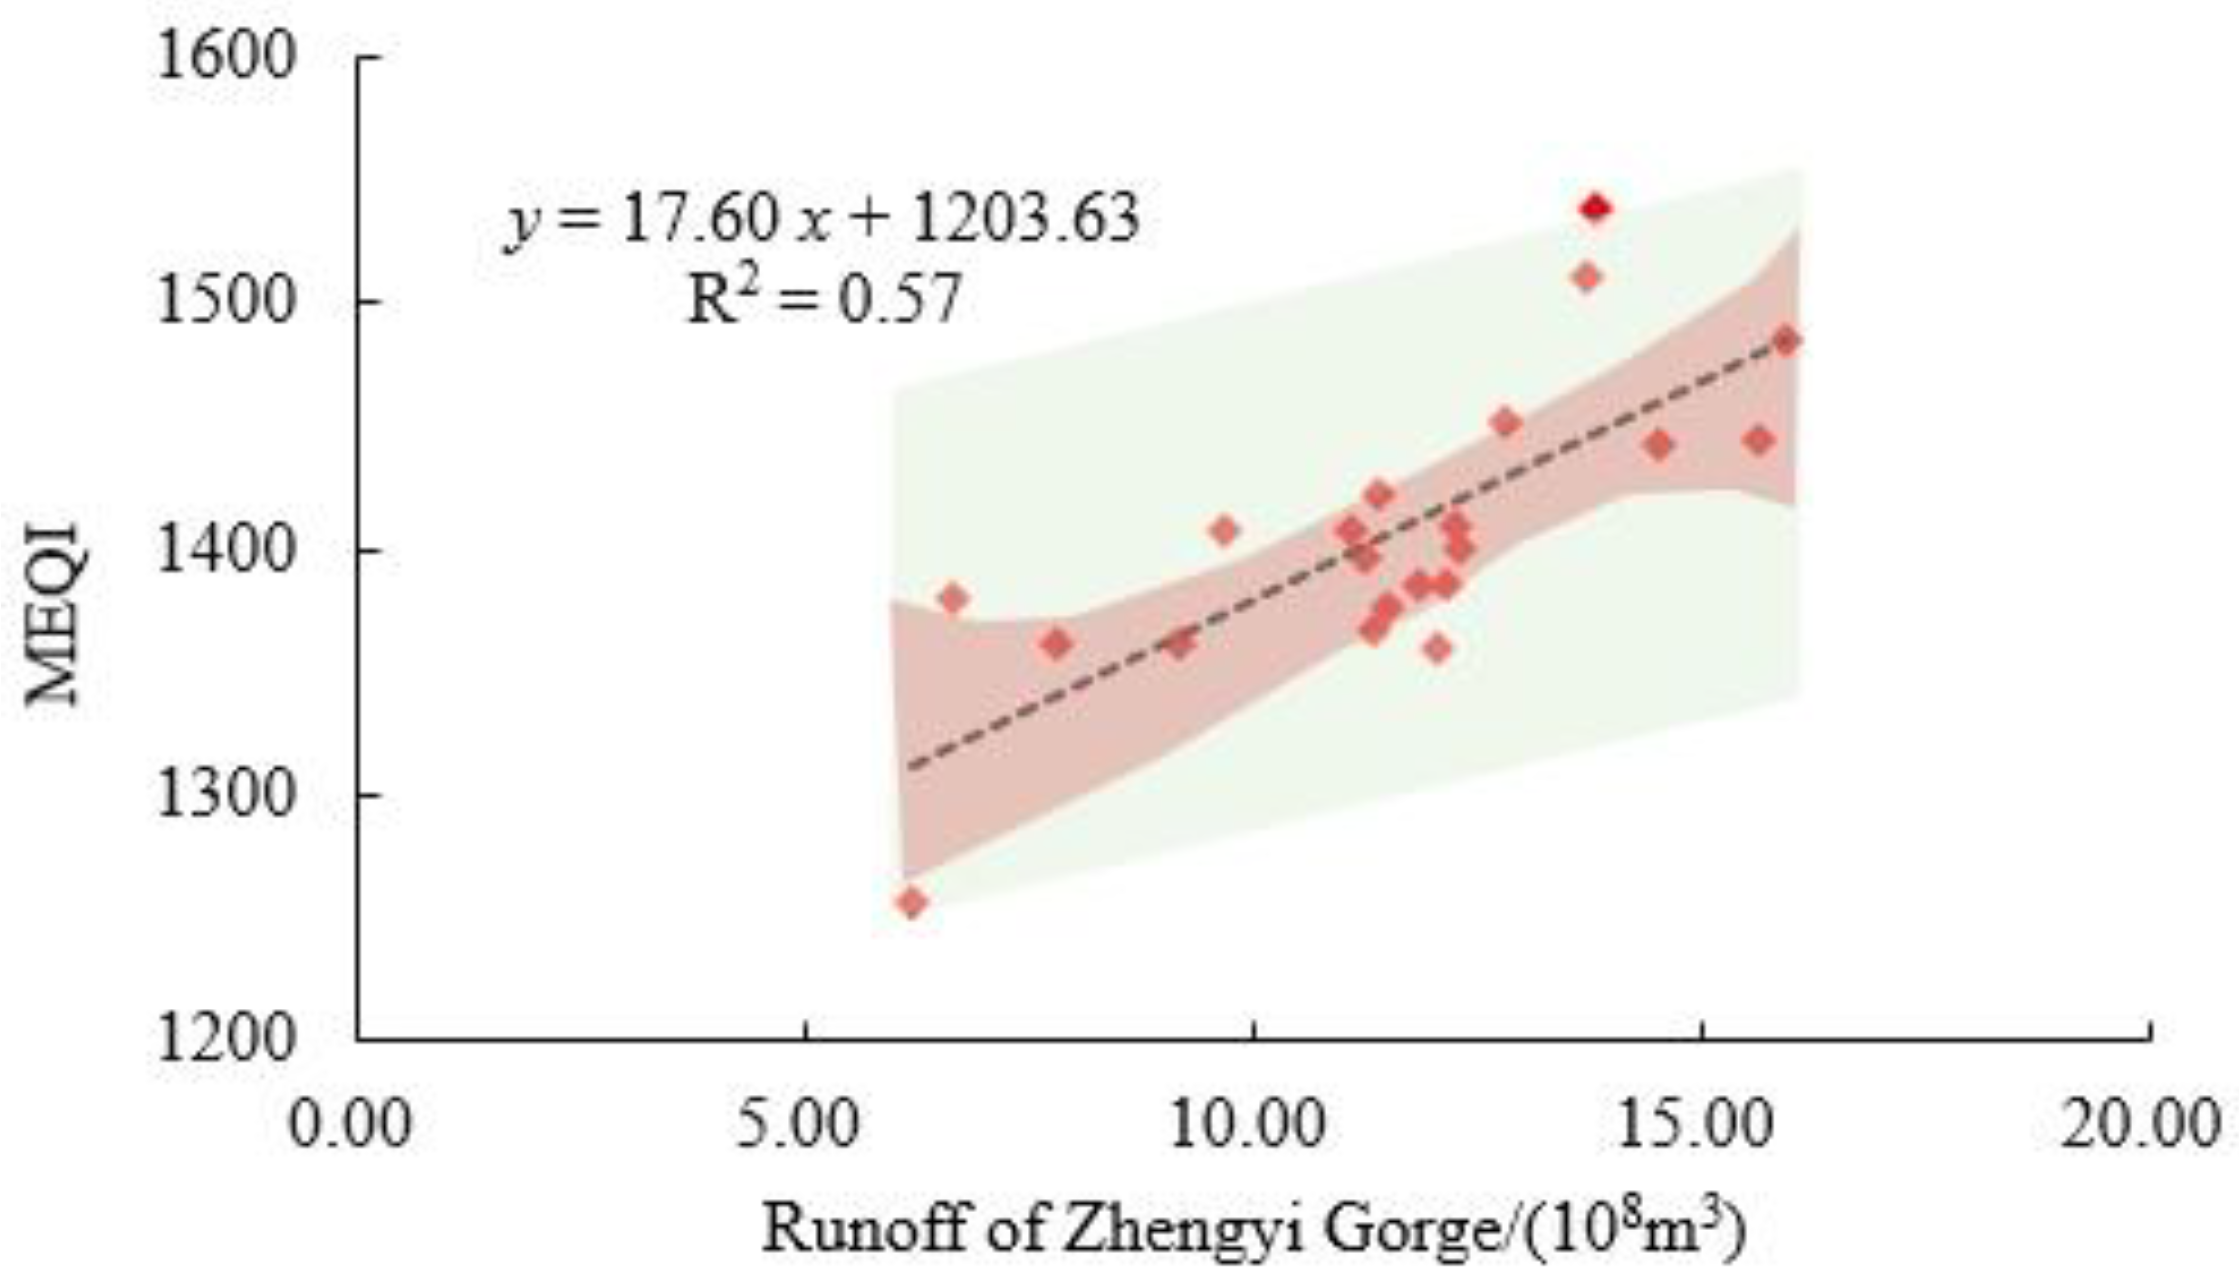
The discharge of Zhengyi Gorge in the middle reaches of the Heihe River Basin directly affects the water replenishment of the downstream ecological tailing wetland to a certain extent. By constructing a relationship between the total MEQI and the discharged flow of Zhengyi Gorge in the lower reaches of the Heihe River Basin, a functional relationship line was obtained, as shown in the following Figure 6. The regression equation y = 17.60x + 1203.63 and the R2 value of 0.57 indicate that there is a moderately strong positive correlation between runoff volume and MEQI. This relationship emphasizes the dependence of downstream MEQI on water availability and highlights the important role of hydrological inputs in maintaining vegetation and overall ecological health. Although runoff is a significant factor, other variables such as land use, soil quality, and human activities also impact ecological quality [49].

Figure 6.
The relationship between the ecological quality index of lower Heihe River and runoff from the Zhengyi Gorge.
4.2. Optimization Model Results for Crop Cropping Structure
The results of the multi-objective cropping structure optimization model are presented in Figure 7, with the objective of maximizing crop suitability, irrigation water efficiency, and MEQI. Figure 7a illustrates the crop allocation resulting from the optimization model based on suitability, irrigation water use efficiency, and ecological quality enhancement. Figure 7b depicts the spatial distribution of field maize, seed maize, wheat, and cash crops in the base year. The optimization model prioritizes areas with high precipitation and favorable climatic conditions for crop growth. Cash crops, which are particularly susceptible to water shortages, are concentrated in the southern region, where precipitation levels are higher. The optimization results indicate a notable enhancement in irrigation water efficiency. The optimized model (Figure 7a) demonstrates that field and seed maize production is concentrated in the central region, where water resources are moderate and crop suitability is high. This configuration minimizes water usage and ensures optimal growing conditions. In comparison to the more dispersed crop distribution observed in the base year (Figure 7b), the optimized model demonstrates a more prudent utilization of water resources, particularly in the northern region where evapotranspiration is high and precipitation is low. This redistribution serves to illustrate the efficacy of the model in reducing water demand and enhancing irrigation efficiency. The MEQI is optimized by considering the suitability of crops and the sustainability of the environment. Areas with high evapotranspiration, low precipitation, and low crop suitability were designated as fallow land (labeled ‘No crop’ areas). This decision has the beneficial effect of reducing ecological stress and promoting soil conservation. Conversely, the base year exhibited a more dispersed crop distribution, including in areas of low suitability. This could potentially exacerbate soil degradation and ecological stress. The optimized model allocation strikes a balance between agricultural productivity and ecological conservation in accordance with regional policy objectives for sustainable land use.
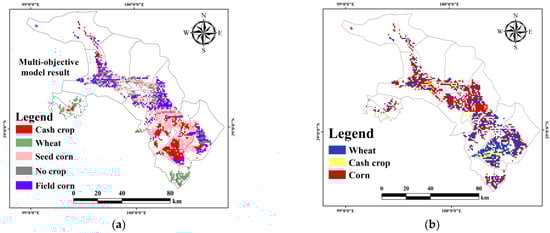
Figure 7.
Comparison of model optimization results (a) and actual cropping structure (b) in 2022.
A comparison of the base year with the optimized model reveals a number of significant improvements. The total area planted for each crop type in the optimized model is 458 km2 for field maize, 863 km2 for seed maize, 289 km2 for wheat, and 361 km2 for cash crops. These figures reflect more efficient and sustainable land use. Due to the high returns and high-water consumption of cash crops, they are concentrated in areas with the most favorable economic conditions and water availability, primarily in the vicinity of the Ganja district. In contrast, wheat is distributed in areas where water conservation is critical, thereby improving water use efficiency throughout the system. The multi-objective optimization model significantly improved the spatial distribution of crops by optimizing crop suitability, irrigation efficiency, and ecological quality indices. The model enables the implementation of more sustainable and profitable agricultural practices, thereby providing valuable insights for decision-makers to optimize land use and overall system benefits.
The multi-objective model was able to provide more precise planting guidance to decision-makers by providing information on the specific planting locations of seed maize and field maize compared to the base year crop planting structure map. The results of the multi-objective optimization demonstrate that the planting area of cash crops and seed production maize increased in the southern region. Consequently, the proportion of income derived from agricultural cultivation in the Ganzhou region increased, with cash crops becoming the primary source of income.
Figure 8 illustrates the change in acreage from the base year to the optimized state. Among the various crop shift percentages, the largest shift from the base year is the shift of cash crops to maize production, which accounts for 40 percent of the total. The transfer of wheat to maize production was the second most significant change, representing 36.42 percent of the total. The transfer of maize to cash crops ranked third at 16.36 percent. The area of wheat transferred to maize production and the area of cash crops transferred to maize production accounted for 6.32% and 3.68% of the total area of maize production in the optimized state, respectively. Furthermore, an analysis of the change in crop acreage enables decision-makers to adjust the cropping structure of crops. Based on the results of the acreage conversion, decision-makers may consider reducing maize cultivation in climatically suitable areas in the south in favor of cash crops. Furthermore, there may be instances where the current distribution of cash crops is not optimal, and policymakers may wish to consider shifting them to maize cultivation.
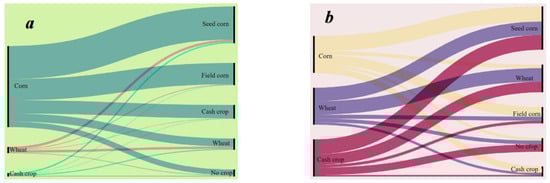
Figure 8.
Values (a) and proportions (b) of area shifts with the optimization model compared to 2022.
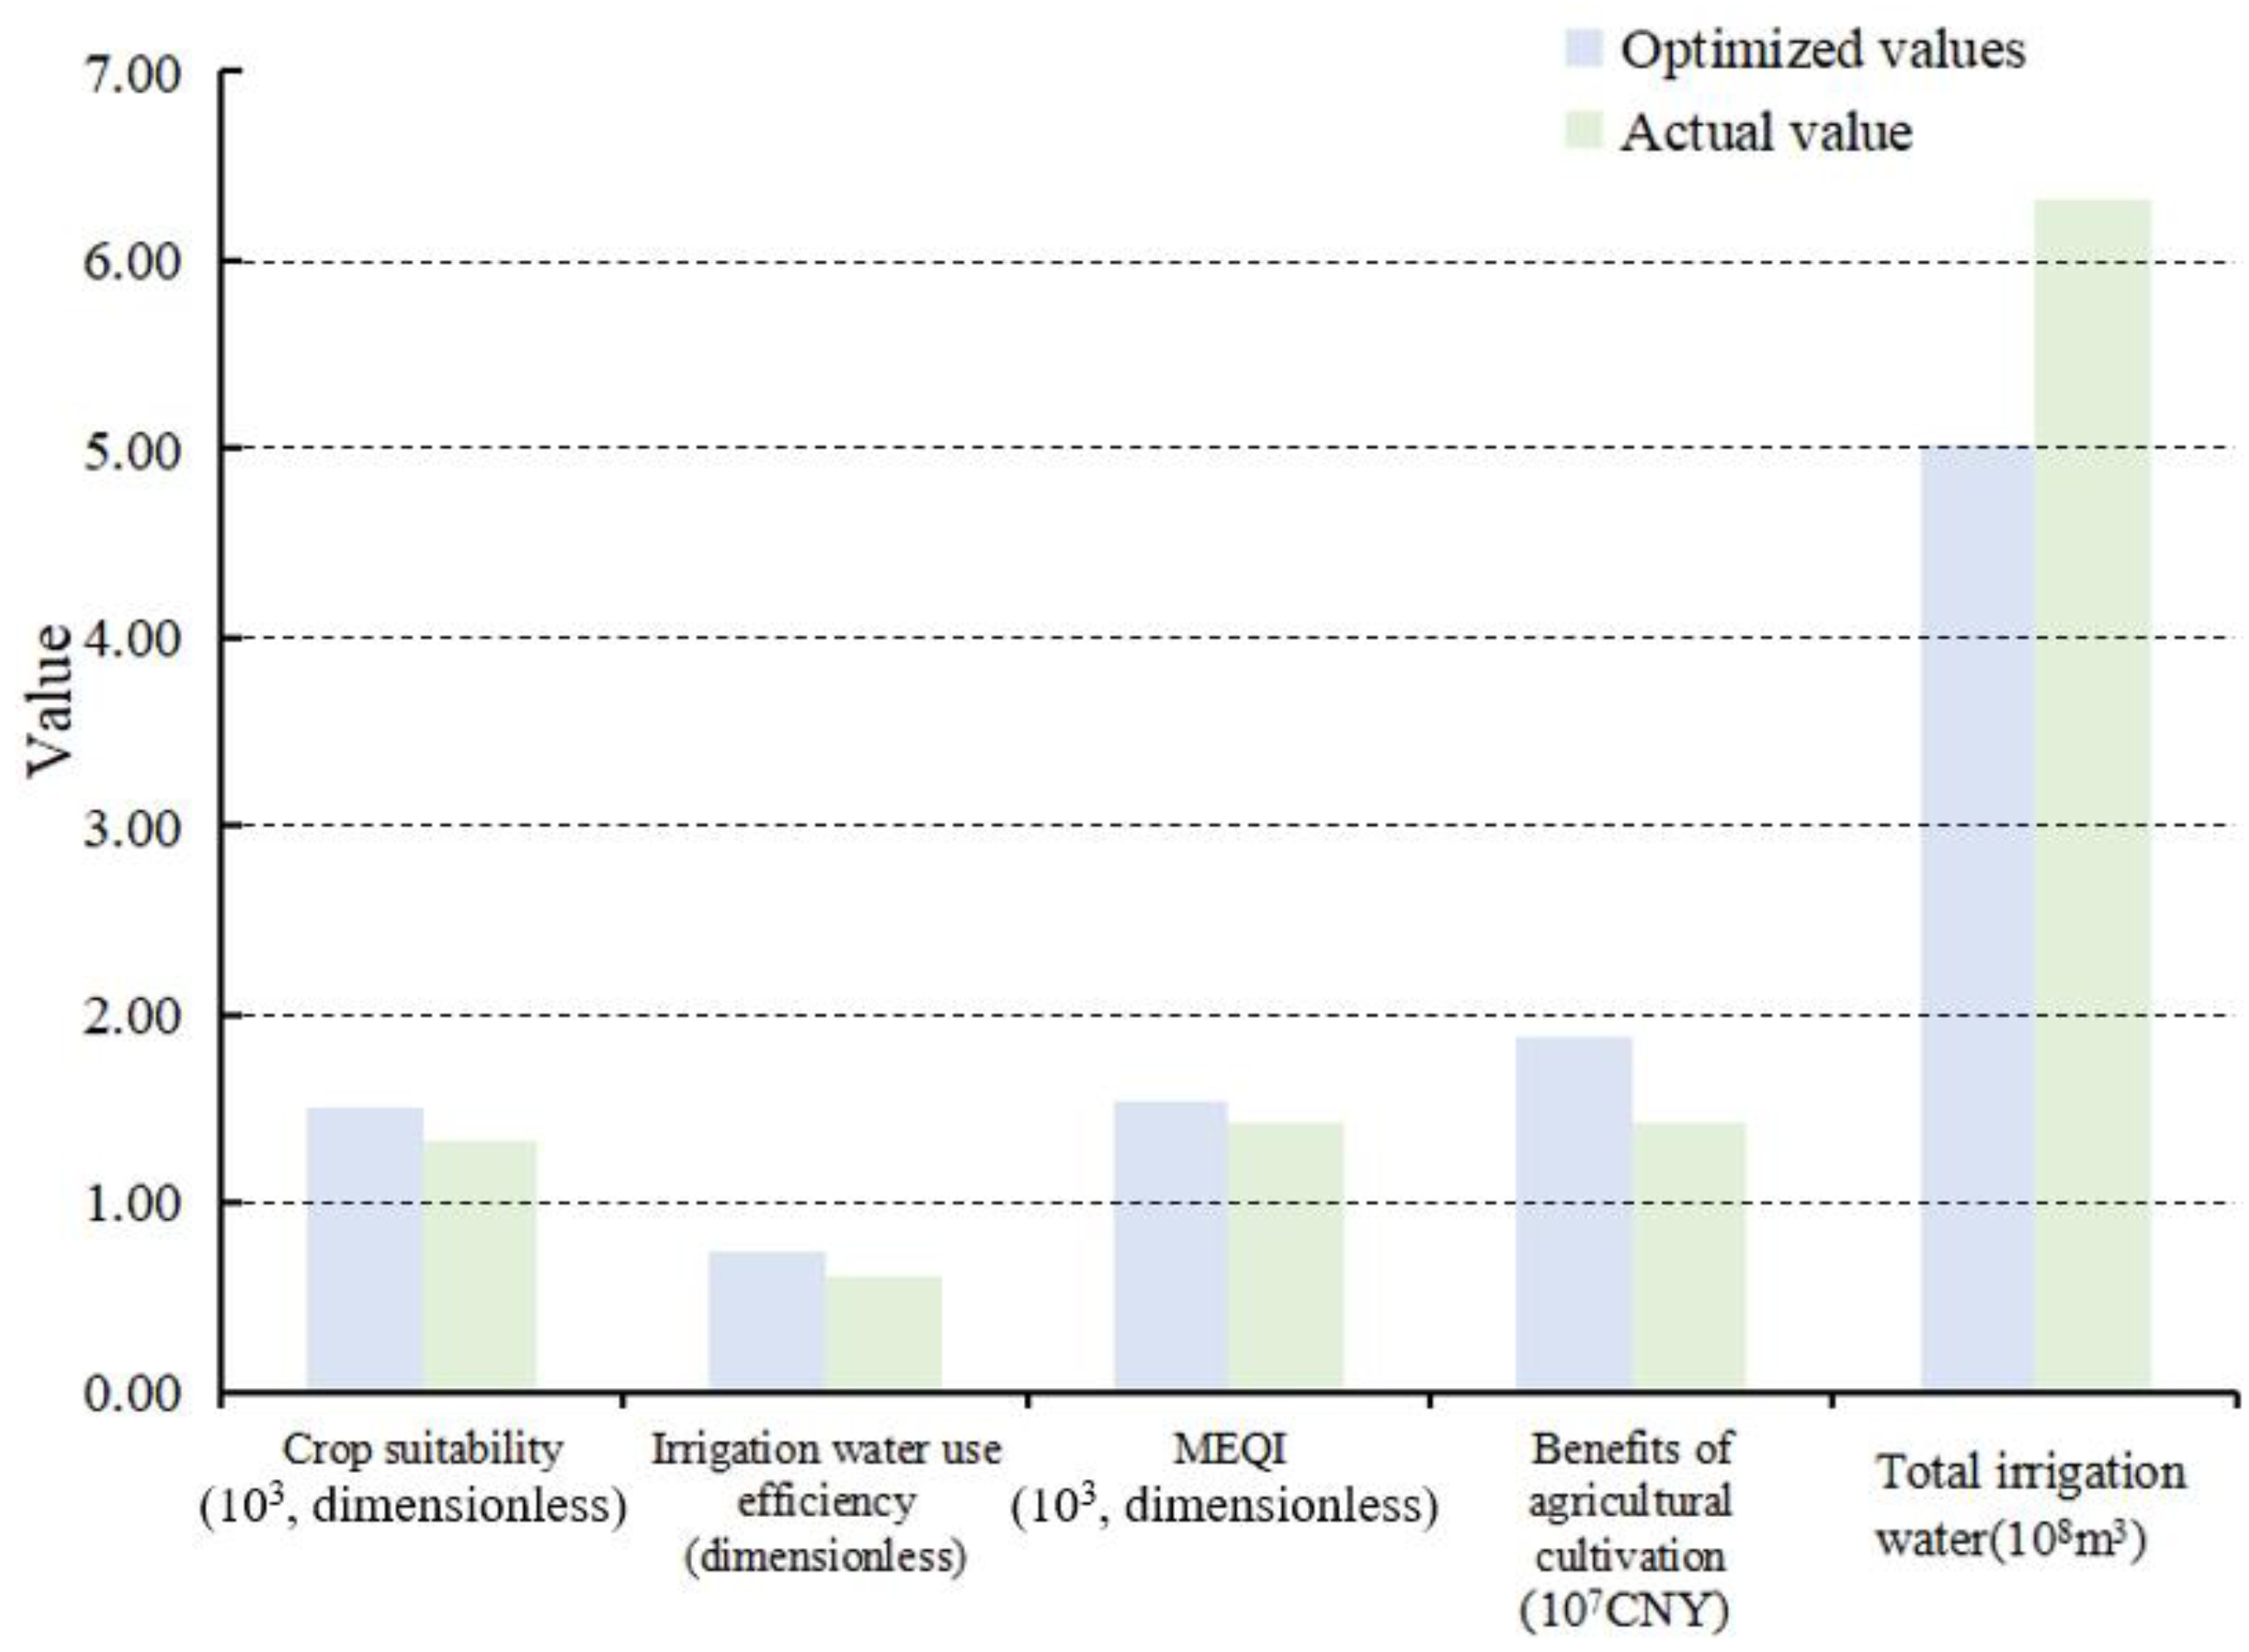
Figure 9 presents a comparative analysis of the results and indicators of each optimization model. In comparison to the cropping structure observed in the base year, the results of the multi-objective model indicate an increase in agricultural cropping economic benefits by 4.45 × 10⁶ CNY, an increase in the sum of system crop suitability by 1.82 × 10³, a decrease in the total irrigation water requirement by 1.31 × 10⁸ m3, an increase in the system irrigation water-use efficiency by 13.00%, and an increase in the sum of the system monitoring ecological indices by 8.04%.
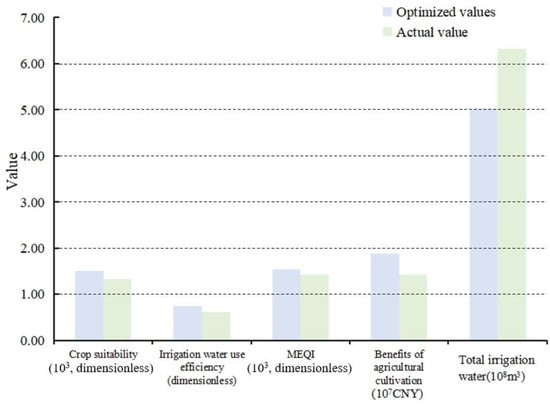
Figure 9.
Comparison of the optimized model with the base year indicators.
4.3. Model Performance
In order to facilitate comparisons with the multi-objective results, three single-objective optimization models were developed: Model 1, Model 2, and Model 3. Each model was designed to achieve a specific objective: to maximize crop suitability, to maximize irrigation water use efficiency, and to maximize a system-monitored ecological quality index. The three models are subject to the same constraints as the multi-objective optimization models. The objective values for each model can be generated by solving the aforementioned models, as illustrated in Figure 10.
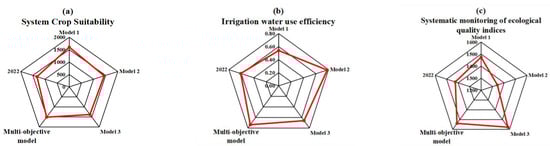
Figure 10.
Comparison of the performance of different models in terms of crop suitability (a), irrigation water use efficiency (b), and ecological quality (c).
The single-objective models (Model 1, Model 2, Model 3) are constrained to obtain the optimal value of the objective to which they belong. Consequently, they are unable to consider the balance of other objectives, which results in relatively poor performance. Figure 10. presents the outcomes of the three single-objective models, the 2022 actual, and the optimization approach. As illustrated in Figure 10a, Model 1 demonstrates satisfactory performance in terms of crop suitability. However, it is evident that irrigation water use efficiency and ecological quality are not adequately considered Figure 10b illustrates that Model 2 prioritizes enhancing irrigation water efficiency, yet fails to consider crop suitability and ecological sustainability. Model 3, as shown in Figure 10c, prioritizes the conservation of ecological effects, although it performs poorly in terms of crop suitability and irrigation water use efficiency. In contrast, the optimization approach enables an integrated consideration of the entire picture.
5. Discussion
There is a notable struggle for resources between agricultural irrigation and ecological balance in the Heihe River Basin. In this study, a 0–1 integer multi-objective programming approach is proposed as a means of managing and adjusting the crop cropping structure for the middle reaches of the basin. The objective is to minimize the consumption of irrigation water and increase the amount of water flowing into the downstream area. The results obtained from the model enable decision-makers to integrate agricultural production, water use efficiency, and ecological sustainability. The optimized cropping structure, as determined by the model, resulted in a higher overall level of benefits than the actual cropping situation in 2022. The systematic planning of coupled crop suitability, irrigation water use efficiency, and downstream ecological tailrace wetland area enhances economic, agricultural, and environmental development in a number of ways.
Tang et al. [10] developed a remote sensing-based multi-target (RSM) approach, which considered maximizing economic benefits, maximizing water productivity, and minimizing blue water utilization were considered to optimize irrigation water allocation. Unlike their study, this research takes into account the relationship with irrigation districts at the grid scale for integrated planning of agriculture, water resources, and ecology. Gong et al. [50] analyzed the correlation of climatic, topographic, and soil factors for each crop and screened for the most suitable crop for each grid with the help of the MaxEnt model predictions. This allows them to determine the optimal cropping pattern without taking ecological factors into account. In addition to the multifactor coupled water–energy–food–land planning model constructed by He et al. [51], the downstream terminal lakes area was considered as one of the decision objectives. However, the attribution linkage between the irrigation district level and the grid scale was not included in the analysis [52]. Following a comparative analysis, the ecological factors, crop suitability, and irrigation water use efficiency were identified as the optimal objectives for the planting structure. The study scale was accurately calibrated to the grid scale in the middle reaches of the basin. In order to achieve precise planning of the management level of irrigation districts and the allocation of crops in the grids, it was necessary to establish an attribution relationship between the grids and the irrigation districts to which they belonged. This would help to alleviate the ecological deterioration in the downstream area and provide decision-makers with a more consistent approach to agricultural life, water resource management scheduling, and ecological sustainability.
The present study introduces a 0–1 integer multi-objective programming approach designed to address the conundrum of conflicting priorities inherent in agricultural planning. This method adeptly accounts for a constellation of variables, namely crop adaptability, irrigation water use efficiency (IWUE), and ecological sustainability, thereby adeptly navigating the intricacies of decision-making uncertainties and the nebulous nature of constraints. The salient features of this methodology are delineated as follows: (1) The holistic integration of water resources, agricultural productivity, and ecological balance within the planning framework is achieved through the meticulous construction of interdependencies between the upstream run-off water supply, the midstream irrigation demand, and the downstream ecological replenishment within the tailrace. This approach ensures a comprehensive and cohesive strategy that underpins the planning and scheduling processes. (2) The allocation of grid scales at the irrigation district management level is strategically linked, thereby achieving a congruence between the macro-level decision-making processes and the micro-level operational configurations. As depicted in Figure 9, the study’s model output, which takes into account agricultural productivity, water resource optimization, and ecological quality indices, indicates that each strategic objective falls within an acceptable range. This finding underscores the model’s efficacy in offering pragmatic support for the attainment of decision-making objectives across various strata of decision-making.
The methodology proposed in this study is an optimization model that aims to conserve regional water resources, promote efficient agricultural production, and ensure ecological sustainability. It is assumed that the suitability of the two selected crops, field maize and seed production maize, is identical; however, there may be some differences in the actual production life. The study indicates that groundwater has a relatively minor influence on overall irrigation when optimizing based on irrigation water use efficiency objectives. Conversely, the collection of large-scale basic data and field surveys appears to be crucial in the design process of the optimal cropping structure model as a prerequisite for the calculation and operation of its important weights. However, before the methodology can be applied in practice, it is necessary to collect more comprehensive and accurate basic data and conduct field surveys at an earlier stage. This will ensure the reliability and accuracy of the model [53]. Furthermore, some fundamental data (e.g., ET, precipitation, and soil moisture) and the spatial variability of certain hydrological processes may be simplified excessively in the model construction, resulting in the loss of information, which will directly affect the applicability of the optimization results [54]. In future studies, it would be beneficial to consider the spatial variability of these basic data with greater care in order to enhance the realism and fidelity of the model.
Although a variety of uncertainties, including randomness, ambiguity, and intervals, have been considered in the optimization model, quantified and integrated relationships have been determined through 0–1 multi-objective programming. Furthermore, the mutual correspondence between the irrigation district management level and grid scale has been combined with the subjective judgment factors of upper and lower decision-makers to effectively measure the subjective judgment factors of upper and lower decision-makers. However, the actual soil and water resources planning system has broad influencing factors and subjective condition constraints and their interactions [55]. Consequently, future research should integrate these factors in order to consider their impacts on the model in a comprehensive manner, with the aim of reducing constraints and improving the applicability and portability of the model. In the further development of the methodology, the challenges of data insufficiency and model simplicity will be deeply considered in order to develop a more comprehensive and accurate model for the management of planting structures.
6. Conclusions
In this study, the 0–1 integer multi-objective programming approach was employed to consider crop suitability, irrigation water use efficiency, and ecological quality. This method facilitated the assignment of varying irrigation management levels on a grid-scale, identification of the most appropriate crop types for each grid, and adjustment of crop planting structures. Moreover, it introduced an effective strategy for managing agricultural land and water resources.
Using the middle reaches of the Heihe River Basin, a typical arid agricultural area in Northwest China, as a case study, this 0–1 integer multi-objective programming approach considered agricultural production, water resource optimization, and ecological sustainability. The study yielded several key findings: (1) The overall monitored ecological quality index of the Heihe River Basin exhibited a positive trend from 2000 to 2022. (2) The optimization results indicated that seed production maize constituted the largest proportion of the planted area in the study area, occupying 43.00% of the total. (3) Among the proportions of various crops that exhibited a change between the model and the actual, the largest change was in the shift of cash crops to maize, which accounted for 40.00%. This was followed by the shift from wheat to maize, which accounted for 36.42%. (4) The results of the multi-objective model indicate that there is potential for increasing agricultural cropping efficiency by 12.37%, increasing the sum of system crop suitability by 6.82%, reducing the total irrigation water demand by 7.53%, increasing the system irrigation water use efficiency by 13.00%, and increasing the sum of system monitoring ecological index by 8.04%. The 0–1 integer multi-objective programming approach proposed in this study effectively addresses the integrated agriculture–water–ecology problems in arid agricultural areas.
The proposed ecological enhancement strategy aims to augment the environmental quality, resource efficiency, and agricultural yields in the Heihe River basin, with broader implications for arid and semi-arid regions. Despite its proven effectiveness, the model is limited by its lack of comprehensive soil–water planning and exclusion of groundwater dynamics in water use estimations. The ecological impact assessment is also simplified, employing an AHP method that might neglect the complexity of real-world agricultural operations. To refine the model, future research should integrate water conservation measures and advanced irrigation techniques into crop planning, extending the model’s scope to include a multi-level decision-making framework that addresses redundancy and fuzzy constraints. These amendments promise to expand the model’s utility in the precise management of soil and water resources.
Author Contributions
Conceptualization, Z.W. and F.Z.; methodology, Z.W. and S.Z.; software, Z.W.; validation, Z.W., F.Z. and B.S.; formal analysis, Z.W. and S.Z.; investigation, S.Z., X.C. and F.Z.; resources, Z.W. and F.Z.; data curation, Z.W.; writing—original draft preparation, Z.W.; writing—review and editing, S.Z., B.S., F.Z. and X.C.; supervision, F.Z.; project administration, F.Z.; funding acquisition, F.Z. All authors have read and agreed to the published version of the manuscript.
Funding
The National Key Research and Development Program of China (NO. 2023YFF1305101) and Open Research Fund of State Key Laboratory of Efficient Utilization of Agricultural Water Resources (NO. SKLAWR-2024–13).
Data Availability Statement
Data will be made available upon request.
Conflicts of Interest
The authors declare no conflicts of interest. The funders had no role in the design of the study; in the collection, analyses, or interpretation of data; in the writing of the manuscript; or in the decision to publish the results.
References
- Chen, J.; Zhang, C.; Guo, P. A credibility-based interval multi-objective crop area planning model for agricultural and ecological management. Agric. Water Manag. 2022, 269, 107687. [Google Scholar] [CrossRef]
- Guo, S.; Zhang, F.; Engel, B.A.; Wang, Y.; Guo, P.; Li, Y. A distributed robust optimization model based on water-food-energy nexus for irrigated agricultural sustainable development. J. Hydrol. 2022, 606, 127394. [Google Scholar] [CrossRef]
- Liu, Q.; Niu, J.; Du, T.; Kang, S. A full-scale optimization of a crop spatial planting structure and its associated effects. Engineering 2023, 28, 139–152. [Google Scholar] [CrossRef]
- Dai, C.; Qin, X.S.; Lu, W.T. A fuzzy fractional programming model for optimizing water footprint of crop planting and trading in the Hai River Basin, China. J. Clean. Prod. 2021, 278, 123196. [Google Scholar] [CrossRef]
- Neill, B.C.; Kriegler, E.; Riahi, K.; Ebi, K.L.; Hallegatte, S.; Carter, T.R.; Mathur, R.; van Vuuren, D.P. A new scenario framework for climate change research: The concept of shared socioeconomic pathways. Clim. Change 2014, 122, 387–400. [Google Scholar] [CrossRef]
- Jiang, T.; Su, X.; Singh, V.P.; Zhang, G. A novel index for ecological drought monitoring based on ecological water deficit. Ecol. Indic. 2021, 129, 107804. [Google Scholar] [CrossRef]
- Endo, A.; Tsurita, I.; Burnett, K.; Orencio, P.M. A review of the current state of research on the water, energy, and food nexus. J. Hydrol. Reg. Stud. 2017, 11, 20–30. [Google Scholar] [CrossRef]
- Peng, Q.; Shen, R.; Li, X.; Ye, T.; Dong, J.; Fu, Y.; Yuan, W. A twenty-year dataset of high-resolution maize distribution in China. Sci. Data 2023, 10, 658. [Google Scholar] [CrossRef] [PubMed]
- Pratzer, M.; Fernández-Llamazares, Á.; Meyfroidt, P.; Krueger, T.; Baumann, M.; Garnett, S.T.; Kuemmerle, T. Agricultural intensification, Indigenous stewardship and land sparing in tropical dry forests. Nat. Sustain. 2023, 6, 671–682. [Google Scholar] [CrossRef]
- Tang, Y.; Zhang, F.; Engel, B.A.; Liu, X.; Yue, Q.; Guo, P. Grid-scale agricultural land and water management: A remote-sensing-based multiobjective approach. J. Clean. Prod. 2020, 265, 121792. [Google Scholar] [CrossRef]
- Yu, H.; Liu, K.; Bai, Y.; Luo, Y.; Wang, T.; Zhong, J.; Liu, S.; Bai, Z. The agricultural planting structure adjustment based on water footprint and multi-objective optimisation models in China. J. Clean. Prod. 2021, 297, 126646. [Google Scholar] [CrossRef]
- Liu, Y.; Yang, M.; Yao, C.; Zhou, X.; Li, W.; Zhang, Z.; Gao, Y.; Sun, Z.; Wang, Z.; Zhang, Y. Optimum water and nitrogen management increases grain yield and resource use efficiency by optimizing canopy structure in wheat. Agronomy 2021, 11, 441. [Google Scholar] [CrossRef]
- Sauer, T.; Havlík, P.; Schneider, U.A.; Schmid, E.; Kindermann, G.; Obersteiner, M. Agriculture and resource availability in a changing world: The role of irrigation. Water Resour. Res. 2010, 46, W06503. [Google Scholar] [CrossRef]
- Ren, C.; Xie, Z.; Zhang, Y.; Wei, X.; Wang, Y.; Sun, D. An improved interval multi-objective programming model for irrigation water allocation by considering energy consumption under multiple uncertainties. J. Hydrol. 2021, 602, 126699. [Google Scholar] [CrossRef]
- Zhang, F.; Guo, S.; Zhang, C.; Guo, P. An interval multiobjective approach considering irrigation canal system conditions for managing irrigation water. J. Clean. Prod. 2019, 211, 293–302. [Google Scholar] [CrossRef]
- Wang, H.; Huang, J.; Zhou, H.; Deng, C.; Fang, C. Analysis of sustainable utilization of water resources based on the improved water resources ecological footprint model: A case study of Hubei Province, China. J. Environ. Manag. 2020, 262, 110331. [Google Scholar] [CrossRef]
- Gayen, J.; Datta, D. Application of pressure–state–response approach for developing criteria and indicators of ecological health assessment of wetlands: A multi-temporal study in Ichhamati floodplains, India. Ecol. Process. 2023, 12, 34. [Google Scholar] [CrossRef]
- Bian, L.; Qin, X.; Zhang, C.; Guo, P.; Wu, H. Application, interpretability and prediction of machine learning method combined with LSTM and LightGBM—A case study for runoff simulation in an arid area. J. Hydrol. 2023, 625, 130091. [Google Scholar] [CrossRef]
- Li, M.; Li, H.; Fu, Q.; Liu, D.; Yu, L.; Li, T. Approach for optimizing the water-land-food-energy nexus in agroforestry systems under climate change. Agric. Syst. 2021, 192, 103201. [Google Scholar] [CrossRef]
- Assouline, S.; Russo, D.; Silber, A.; Or, D. Balancing water scarcity and quality for sustainable irrigated agriculture. Water Resour. Res. 2015, 51, 3419–3436. [Google Scholar] [CrossRef]
- Feng, Z.; Huang, G.; Chi, D. Classification of the complex agricultural planting structure with a semi-supervised extreme learning machine framework. Remote Sens. 2020, 12, 3708. [Google Scholar] [CrossRef]
- Herman, J.D.; Quinn, J.D.; Steinschneider, S.; Giuliani, M.; Fletcher, S. Climate adaptation as a control problem: Review and perspectives on dynamic water resources planning under uncertainty. Water Resour. Res. 2020, 56, e24389. [Google Scholar] [CrossRef]
- Wang, X.; Shi, K.; Zhang, Y.; Qin, B.; Zhang, Y.; Wang, W.; Woolway, R.I.; Piao, S.; Jeppesen, E. Climate change drives rapid warming and increasing heatwaves of lakes. Sci. Bull. 2023, 68, 1574–1584. [Google Scholar] [CrossRef]
- Konapala, G.; Mishra, A.K.; Wada, Y.; Mann, M.E. Climate change will affect global water availability through compounding changes in seasonal precipitation and evaporation. Nat. Commun. 2020, 11, 3044. [Google Scholar] [CrossRef] [PubMed]
- Straffelini, E.; Tarolli, P. Climate change-induced aridity is affecting agriculture in Northeast Italy. Agric. Syst. 2023, 208, 103647. [Google Scholar] [CrossRef]
- Shi, H.; Luo, G.; Zheng, H.; Chen, C.; Bai, J.; Liu, T.; Ochege, F.U.; De Maeyer, P. Coupling the water-energy-food-ecology nexus into a Bayesian network for water resources analysis and management in the Syr Darya River basin. J. Hydrol. 2020, 581, 124387. [Google Scholar] [CrossRef]
- Huang, H.; Xie, P.; Duan, Y.; Wu, P.; Zhuo, L. Cropping pattern optimization considering water shadow price and virtual water flows: A case study of Yellow River Basin in China. Agric. Water Manag. 2023, 284, 108339. [Google Scholar] [CrossRef]
- Jiang, T.; Su, X.; Zhang, G.; Zhang, T.; Wu, H. Estimating propagation probability from meteorological to ecological droughts using a hybrid machine learning copula method. Hydrol. Earth Syst. Sci. 2023, 27, 559–576. [Google Scholar] [CrossRef]
- Zhang, S.; Hou, X.; Wu, C.; Zhang, C. Impacts of climate and planting structure changes on watershed runoff and nitrogen and phosphorus loss. Sci. Total Environ. 2020, 706, 134489. [Google Scholar] [CrossRef]
- Zhu, D.; Chen, T.; Wang, Z.; Niu, R. Detecting ecological spatial-temporal changes by Remote Sensing Ecological Index with local adaptability. J. Environ. Manag. 2021, 299, 113655. [Google Scholar] [CrossRef]
- Livneh, B.; Badger, A.M. Drought less predictable under declining future snowpack. Nat. Clim. Change 2020, 10, 452–458. [Google Scholar] [CrossRef]
- Schumacher, D.L.; Keune, J.; Dirmeyer, P.; Miralles, D.G. Drought self-propagation in drylands due to land–atmosphere feedbacks. Nat. Geosci. 2022, 15, 262–268. [Google Scholar] [CrossRef] [PubMed]
- Zhao, M.; Geruo, A.; Zhang, J.; Velicogna, I.; Liang, C.; Li, Z. Ecological restoration impact on total terrestrial water storage. Nat. Sustain. 2021, 4, 56–62. [Google Scholar] [CrossRef]
- Reiker, T.; Golumbeanu, M.; Shattock, A.; Burgert, L.; Smith, T.A.; Filippi, S.; Cameron, E.; Penny, M.A. Emulator-based Bayesian optimization for efficient multi-objective calibration of an individual-based model of malaria. Nat. Commun. 2021, 12, 7212. [Google Scholar] [CrossRef] [PubMed]
- Vahabzadeh, M.; Afshar, A.; Molajou, A. Energy simulation modeling for water-energy-food nexus system: A systematic review. Environ. Sci. Pollut. Res. 2023, 30, 5487–5501. [Google Scholar] [CrossRef] [PubMed]
- He, L.; Du, Y.; Wu, S.; Zhang, Z. Evaluation of the agricultural water resource carrying capacity and optimization of a planting-raising structure. Agric. Water Manag. 2021, 243, 106456. [Google Scholar] [CrossRef]
- Zhang, F.; Cui, N.; Guo, S.; Yue, Q.; Jiang, S.; Zhu, B.; Yu, X. Irrigation strategy optimization in irrigation districts with seasonal agricultural drought in southwest China: A copula-based stochastic multiobjective approach. Agric. Water Manag. 2023, 282, 108293. [Google Scholar] [CrossRef]
- Gamo, M.; Shinoda, M.; Maeda, T. Classification of arid lands, including soil degradation and irrigated areas, based on vegetation and aridity indices. Int. J. Remote Sens. 2013, 34, 6701–6722. [Google Scholar] [CrossRef]
- Chiang, F.; Mazdiyasni, O.; AghaKouchak, A. Evidence of anthropogenic impacts on global drought frequency, duration, and intensity. Nat. Commun. 2021, 12, 2754. [Google Scholar] [CrossRef]
- Yin, J.; Gentine, P.; Slater, L.; Gu, L.; Pokhrel, Y.; Hanasaki, N.; Guo, S.; Xiong, L.; Schlenker, W. Future socio-ecosystem productivity threatened by compound drought–heatwave events. Nat. Sustain. 2023, 6, 259–272. [Google Scholar] [CrossRef]
- Zhang, G.; Hou, Y.; Zhang, H.; Fan, H.; Wen, X.; Han, J.; Liao, Y. Optimizing planting pattern and nitrogen application rate improves grain yield and water use efficiency for rain-fed spring maize by promoting root growth and reducing redundant root growth. Soil Tillage Res. 2022, 220, 105385. [Google Scholar] [CrossRef]
- Christian, J.I.; Basara, J.B.; Hunt, E.D.; Otkin, J.A.; Furtado, J.C.; Mishra, V.; Xiao, X.; Randall, R.M. Global distribution, trends, and drivers of flash drought occurrence. Nat. Commun. 2021, 12, 6330. [Google Scholar] [CrossRef] [PubMed]
- Mondal, S.; Mishra, A.K.; Leung, R.; Cook, B. Global droughts connected by linkages between drought hubs. Nat. Commun. 2023, 14, 144. [Google Scholar] [CrossRef] [PubMed]
- Li, M.; Zhao, L.; Zhang, C.; Liu, Y.; Fu, Q. Optimization of agricultural resources in water-energy-food nexus in complex environment: A perspective on multienergy coordination. Energy Convers. Manag. 2022, 258, 115537. [Google Scholar] [CrossRef]
- Fan, Y.; He, L.; Liu, Y.; Wang, S. Optimal cropping patterns can be conducive to sustainable irrigation: Evidence from the drylands of Northwest China. Agric. Water Manag. 2022, 274, 107977. [Google Scholar] [CrossRef]
- Zhang, F.; Guo, S.; Liu, X.; Wang, Y.; Engel, B.A.; Guo, P. Towards sustainable water management in an arid agricultural region: A multi-level multi-objective stochastic approach. Agric. Syst. 2020, 182, 102848. [Google Scholar] [CrossRef]
- Stocker, B.D.; Tumber-Dávila, S.J.; Konings, A.G.; Anderson, M.C.; Hain, C.; Jackson, R.B. Global patterns of water storage in the rooting zones of vegetation. Nat. Geosci. 2023, 16, 250–256. [Google Scholar] [CrossRef] [PubMed]
- Pokhrel, Y.; Felfelani, F.; Satoh, Y.; Boulange, J.; Burek, P.; Gädeke, A.; Gerten, D.; Gosling, S.N.; Grillakis, M.; Gudmundsson, L.; et al. Global terrestrial water storage and drought severity under climate change. Nat. Clim. Change 2021, 11, 226–233. [Google Scholar] [CrossRef]
- Romashchenko, M.; Bohaienko, V.; Shatkovskyi, A.; Saidak, R.; Matiash, T.; Kovalchuk, V. Optimisation of crop rotations: A case study for corn growing practices in forest-steppe of Ukraine. J. Water Land Dev. 2022, 56, 194–202. [Google Scholar] [CrossRef]
- Gong, X.; Zhang, H.; Ren, C.; Sun, D.; Yang, J. Optimization allocation of irrigation water resources based on crop water requirement under considering effective precipitation and uncertainty. Agric. Water Manag. 2020, 239, 106264. [Google Scholar] [CrossRef]
- He, L.; Wang, S.; Peng, C.; Tan, Q. Optimization of water consumption distribution based on crop suitability in the middle reaches of Heihe River. Sustainability 2018, 10, 2119. [Google Scholar] [CrossRef]
- He, L.; Bao, J.; Daccache, A.; Wang, S.; Guo, P. Optimize the spatial distribution of crop water consumption based on a cellular automata model: A case study of the middle Heihe River basin, China. Sci. Total Environ. 2020, 720, 137569. [Google Scholar] [CrossRef] [PubMed]
- Li, X.; Zhang, C.; Huo, Z. Optimizing irrigation and drainage by considering agricultural hydrological process in arid farmland with shallow groundwater. J. Hydrol. 2020, 585, 124785. [Google Scholar] [CrossRef]
- Lenton, T.M.; Xu, C.; Abrams, J.F.; Ghadiali, A.; Loriani, S.; Sakschewski, B.; Zimm, C.; Ebi, K.L.; Dunn, R.R.; Svenning, J.; et al. Quantifying the human cost of global warming. Nat. Sustain. 2023, 6, 1237–1247. [Google Scholar] [CrossRef]
- Büntgen, U.; Urban, O.; Krusic, P.J.; Rybníček, M.; Kolář, T.; Kyncl, T.; Ač, A.; Koňasová, E.; Čáslavský, J.; Esper, J.; et al. Recent European drought extremes beyond Common Era background variability. Nat. Geosci. 2021, 14, 190–196. [Google Scholar] [CrossRef]


Disclaimer/Publisher’s Note: The statements, opinions and data contained in all publications are solely those of the individual author(s) and contributor(s) and not of MDPI and/or the editor(s). MDPI and/or the editor(s) disclaim responsibility for any injury to people or property resulting from any ideas, methods, instructions or products referred to in the content. |
© 2024 by the authors. Licensee MDPI, Basel, Switzerland. This article is an open access article distributed under the terms and conditions of the Creative Commons Attribution (CC BY) license (https://creativecommons.org/licenses/by/4.0/).