Article

Effects of Controlled-Release Nitrogen Fertilizer at Different Release Stages on Rice Yield and Quality

1
State Key Laboratory of Nutrient Use and Management, Institute of Agricultural Resources and Environment, Shandong Academy of Agricultural Sciences, Jinan 250100, China
2
National Engineering Research Center for Efficient Utilization of Soil and Fertilizer Resources, National Engineering & Technology Research Center for Slow and Controlled Release Fertilizers, College of Resources and Environment, Shandong Agricultural University, Tai’an 271018, China
3
Department of Soil and Water Science, Tropical Research and Education Center, IFAS, University of Florida, Homestead, FL 33031, USA
*
Author to whom correspondence should be addressed.
These authors contributed equally to the work.
Agronomy 2024, 14(8), 1685; https://doi.org/10.3390/agronomy14081685
Submission received: 8 April 2024 / Revised: 17 July 2024 / Accepted: 24 July 2024 / Published: 31 July 2024
(This article belongs to the Special Issue Innovative Controlled Release Fertilizer Technologies in Agriculture)

Abstract

:
The replacement of common urea with controlled-release nitrogen fertilizer can improve rice yield and quality, but the effect of controlled-release nitrogen fertilizer on rice yield and quality at different release stages is still unclear. In this experiment, two nitrogen application rates (240 kg/ha and 300 kg/ha) and five different nutrient release characteristics (urea and coated urea with controlled release periods of 30, 50, 70 and 90 days, respectively) were set up to explore the effects of nitrogen application rate, release characteristics and their interactions on rice yield, quality, starch structure, and physicochemical properties. The results showed that, compared with other controlled-release nitrogenous fertilizers, application of controlled-release nitrogenous fertilizers for 30 days and 90 days could increase rice yield (14.17% to 20.83%), and application of controlled-release nitrogenous fertilizers for 70 days and 90 days had the highest comprehensive evaluation of rice quality. The decrease of amylose content and the increase of protein content significantly improved the eating and nutritional quality of rice by changing the structure and physicochemical properties of starch particles. The results showed that in the comprehensive evaluation system based on rice yield and quality, under the condition of 300 kg/ha, controlled-release nitrogen treatment with a controlled release period of 90 days had the highest comprehensive score, which could increase rice yield and improve grain quality.

1. Introduction

As an important food crop, rice (Oryza sativa L.) is the staple food for more than 3.5 billion people around the world, especially in China, and the demand for rice is increasing [1]. To meet the rice needs of a growing population, a great deal of new rice varieties with high yield potential have been bred and grown. In addition, with the gradual opening of rice markets and the continuous improvement of living standards, the basis of demand for staple rice was changing from quantity to quality and taste, and it is difficult to meet the demand of the market to pursue rice yield alone [2]. How to achieve the synchronous improvement of quality and yield of rice is a great challenge.
Nitrogen had a great effect on rice yield and quality, but its use efficiency is only 30–35% [3]. Meanwhile, the excessive application of chemical fertilizers leads to serious environmental problems and soil degradation, and causes a decline in rice productivity and quality [4]. In order to produce higher yields and quality of rice as well as to achieve a high use efficiency, many optimized agronomic practices have been applied in rice cultivation, including the application of controlled-release nitrogen fertilizer (CN) [5]. Previous studies have shown that the CN is an effective approach for high yield and high efficiency of traditional chemical fertilizers [6]. Compared with traditional nitrogen fertilizer, CN can improve nitrogen use efficiency by prolonging the release of nutrients, thus increasing rice yield and quality. However, despite all these findings, relatively little research has been done to reveal the relationship between fertilizer application condition and rice yield and quality. It is very important to optimize nitrogen application rates, nutrient release characteristics and their interaction with CN for rice production.
The content of starch in milled rice is more than 90%, and the quality of the rice grain is characterized by the component, structure and accumulation of starch [7]. Therefore, it is of great significance to reveal the structure and physicochemical properties of starch by chemical means to evaluate the quality of rice [8]. Rice quality includes milling quality, appearance quality, nutritional quality, eating quality and cooking quality [9]. The starch particle size, degree of order, amylose content, gelatinization and retrogradation play important roles in the quality of rice [10]. The application of nitrogen fertilizer affects the rice quality by affecting the structure and physicochemical properties of rice starch [11]. A recent study shows that the amylose content increased with the increasing nitrogen fertilizer, while the opposite trend was found in gelatinization and retrogradation of rice starch [12]. Compared with conventional nitrogen fertilizer, CN application can improve nutritional quality and eating quality of rice [13]. However, previous studies were mainly concentrated on the quality traits of rice, so it is of great significance to establish a comprehensive evaluation system for rice yield and quality traits for evaluating its commodity value and providing consumers with purchasing decisions.
In this study, a new rice cultivar, Shengxiang 66, was cultivated to explore the effects of nitrogen application rate, release characteristics and their interaction on the rice yield and quality by affecting the structure and physicochemical properties of rice starch. A comprehensive evaluation model of rice yield and quality was established based on the analysis of quality and yield traits. We hypothesized that: (1) the changes of starch granule structure and physicochemical properties significantly affected rice quality and (2) the synchronous realization of high quality and high yield of rice could be achieved with an appropriate nitrogen application rate and nutrient release characteristics. The objective of this study was to determine optimal nitrogen management to improve rice yield and quality.

2. Materials and Methods

2.1. Plant Materials and Experimental Design

Field experiments were conducted at the Linyi Fengtian Rice Planting Cooperative (E 118°29′, N 35°11′) during the 2020 growing season. Linyi experimental sites belong to the main rice-growing areas of China and the soil was classified as paddy soil following the Chinese Soil Classification System, equal to alfisol in the USDA soil classification system. A typical local rice (Oryza sativa L.) cultivar (Shengxiang66) was seeded on 28 April, rice seedlings were transplanted at a spacing of 25 × 13.5 cm on 27 June and rice plants were harvested on 19 October. The soil samples were collected prior to planting and analyzed for physicochemical properties (Table 1). According to local fertilization practices, phosphate fertilizer (150 kg/ha) and potash fertilizer (200 kg/ha) as basal fertilizers were applied the day before transplanting. The field experiment included two levels of N rates of 300 kg/ha and 240 kg/ha and four controlled-release nitrogen fertilizers: (1) 0 N control (CK); (2) 300 kg/ha urea (N); (3) 240 kg/ha urea (LN); (4) 300 kg/ha controlled-release nitrogen fertilizer with a 30-day release period (CN1); (5) 240 kg/ha controlled-release nitrogen fertilizer with a 30-day release period (LCN1); (6) 300 kg/ha controlled-release nitrogen fertilizer with a 50-day release period (CN2); (7) 240 kg/ha controlled-release nitrogen fertilizer with a 50-day release period (LCN2); (8) 300 kg/ha controlled-release nitrogen fertilizer with a 70-day release period (CN3); (9) 240 kg/ha controlled-release nitrogen fertilizer with a 70-day release period (LCN3); (10) 300 kg/ha controlled-release nitrogen fertilizer with a 90-day release period (CN4); (11) 240 kg/ha controlled-release nitrogen fertilizer with a 90-day release period (LCN4). All controlled-release nitrogen fertilizer was applied as base fertilizer while the proportion of urea application was adjusted as follows: base, tillering, panicle and spikelet with percentages of 55%, 15%, 15% and 15% (Table 2). Randomized Complete Block Design was used to arrange the experiment, and each treatment was replicated with three plots (6.75 × 3.25 m each).

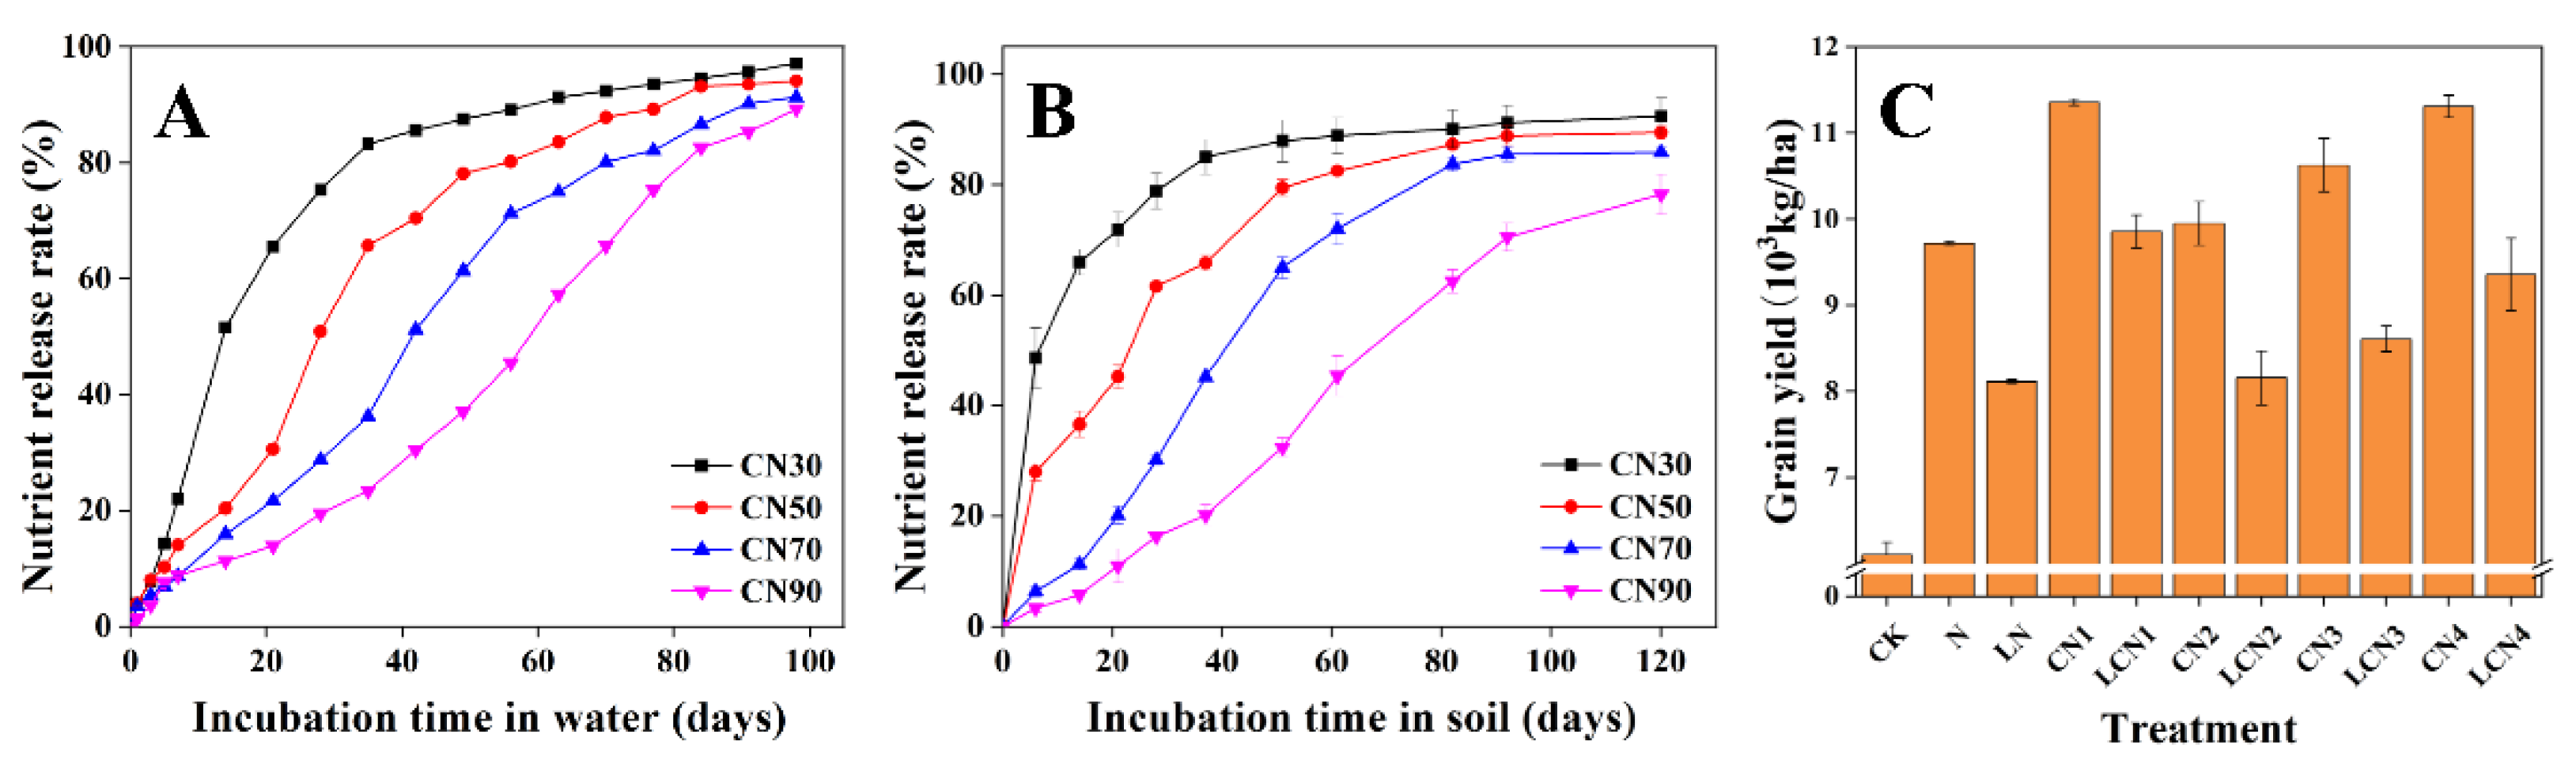
2.2. Nitrogen Release Characteristics in Water and Soil

Using soybean oil and isocyanate as coating materials, bio-based polyurethane coated controlled-release urea was prepared according to the previously reported method [6]. The N release rates of 4 different controlled-release nitrogen fertilizers in 25 °C water was measured according to the Chinese national standard for slow-release fertilizer GB/T 23348-2009. The N release rates of 4 different controlled-release nitrogen fertilizer in soil was measured as follow method: briefly, 10.0 g samples were placed in a net bag and then sealed, fertilizers bags were buried in the soil next to the two field experiment sites at a depth of 15 cm. The fertilizers samples was dug out periodically, and after cleaned and dried at 105 °C for 4 h at the same sampling time as the static water test, then ground to break them up, and continued to be dried at 105 °C for 0.5 h. The residues were weighed after cooling, The ratio of the reduced weight of the fertilizer sample to the initial weight is the nutrient release rate of controlled-release nitrogen fertilizer in the soil [14].

2.3. Rice Yield and Appearance Quality

The rice yield was measured by sampling the estimation yield (2 m × 2 m), then the samples were air dried and weighed to calculate the yield. The grain shape characteristics (length, width and length/width) and 1000-grain weight of rice materials were measured by automatic seed analyzer (SC-G, Wanshen, Hangzhou, China). The chalky grain characteristics were measured according to the national standard for high quality paddy GB/T 17891-1999, the People’s Republic of China. The husked rice yield and head rice yield were measured according to the Chinese national standard for paddy GB 1350-2009 by means of husking and sensory inspection.

2.4. Extraction of Rice Starch

The head rice (20 g) was soaked overnight in 0.1 M NaOH solution (pH 8.0–8.5). After the scum was removed, the sample was mixed for 3 min using organizing homogenizer (T25, IKA, Staufen, Germany) at 17,500 rpm, and sieved through a 300-mesh sieve. To the filtered homogenate, alkaline protease (1 g) was added, as well as sodium azide solution (25 μL, 0.04 g/mL), the product of which was then agitated at 42 °C for 16 h. Afterwards, the treated homogenate was centrifuged at 3000 rpm for 10 min and the precipitate was collected. The last step was to remove fat by adding 50 mL CHCL3/methanol (1, v/v), which was then agitated at 45 °C for 30 min. The sample was centrifuged at 3000 rpm for 10 min, then the precipitates were washed with absolute ethanol and dried at 30 °C [15].

2.5. Analysis of Rice Starch

The amylose and protein contents of the head rice were measured using a near infrared grain analyzer (Infratec TM 1241, FOSS, Hilleroed, Denmark). The starch granule morphology was observated using a scanning electron microscope (LMS, TESCAN MIRA, Brno, Czech Republic). ATR-FTIR spectra of starch was recorded on infrared spectrometer (TENSOR II, Bruker, Billerica, MA, USA). The XRD analysis of starch was measured by X-ray diffractometer (D8 Advance, Bruker, Billerica, MA, USA). The granule size of starch was carried out using laser diffraction particle size analyzer (Zetasizer Nano ZS90, Malvern, England).

2.6. Rice Starch Pasting Characteristics

The starch pasting properties were measured using a rapid viscosity analyzer (RVA 4500, Perten, Stockholm, Sweden) following the RVA standard procedures: the rice flour solution was heated from 50 °C, raised to 95 °C after 7.5 min and held for 5 min. After 7.5 min, it was cooled to 50 °C, and held for 2 min at 50 °C. The instrument automatically drew a gelatinization curve [16].

2.7. Statistical Analysis

All statistical analysis data were checked for normality using Kolmogorov–Smirnov tests and homogeneity of variances using Levene’s tests. Two-way ANOVA was used to test for treatment differences in rice yield and quality index, and paired comparison of treatment means was achieved by LSD post hoc test at p < 0.05. The above analyses were implemented using IBM SPSS Statistics 26. Calculations of Pearson correlation coefficients between rice yields and quality indexes were performed using R package “corrplot” [17] and “sysfonts” [18], and were then visualized in R studio. The Euclidean method was used for cluster analysis of different treatments. The correlation matrix was constructed with rice yield and rice quality indexes treated in different treatments. SPSS was used for data standardization processing, and then Origin 2021 was used for principal component analysis. The principal component score was calculated according to the eigenvalues and eigenvectors of principal components, and the corresponding variance contribution rate is taken as the weight to obtain the principal component comprehensive evaluation score.

3. Results and Discussion

3.1. Effect of Different Nitrogen Fertilizer on Rice Yield

To evaluate the actual nutrient release of CN in soils, fertilizer samples of four controlled-release periods were prepared for measuring their nutrients release rates in water and soil (Figure 1A,B). For CN30, CN50, CN70 and CN90, the nutrient release longevities were 35, 56, 70 and 84 days, respectively. The N cumulative release curve of four fertilizer samples in 25 °C water was similar to those in rice fields. However, the fertilizer samples released nitrogen more evenly and steadily in water than in soil, possibly due to temperature changes in the fields.
The rice yield was significantly varied among all fertilizer treatments (Figure 1C). Overall, compared with conventional nitrogen fertilizer, the CN significantly improved the rice yield, and thus increased the commodity value of rice, but there were significant differences among CN treatments with different controlled-release characteristics. Compared with other CN treatments, the rice yields with CN30 and CN90 were significantly increased with the same nitrogen rate. The increase in rice yield by applying CN30 can be explained by the sufficient nutrients supply during the rice tillering stage and by the promoted rice tiller. In addition, the CN90 also significantly increased rice yield due to an adequate supply of nutrients throughout the growth period of rice [19]. In this experiment, both CN30 and CN90 significantly improved rice yield, but their effects on rice quality remain to be further studied.

3.2. Effect of Different Nitrogen Fertilizers on Rice Quality

Multivariate analysis of variance showed that nitrogen application rate, controlled-release characteristics, and their interactions had significant differences on different quality indexes (p < 0.05) (Table 3). More specifically, nitrogen application rate had no significant effect on husked rice rate and head rice rate. In contrast, the husked rice and head rice rates were significantly increased among CN70 and CN90 compared to the other treatments. There was no significant change in rice grain length, width, and aspect ratio of grain shape between different nitrogen treatments (Table 4). The chalkiness of rice increased significantly with the decrease in nitrogen application level. The CN30 and CN50 treatments significantly increased chalky rate and chalkiness, respectively, compared with the urea treatment. In addition, the husked rice rate and chalky rate were affected by the interaction of the nitrogen application rate and controlled-release characteristics. As an important character for evaluating rice appearance quality, chalkiness is the opaque white part of the endosperm of rice grain caused by loose tissue [20], which leads to a decrease in head rice yield [21]. The milling quality and appearance quality of rice are the main factors determining the price of rice and are important indexes in affecting consumer purchase decisions. Previous research found that the insufficient supply of nitrogen at the rice filling stage would reduce leaf photosynthetic rate [22], resulting in a lack of filling substance and inadequate endosperm filling and further cause an increase in rice chalkiness rate. A long controlled-release period improves nitrogen supply capacity in the later growing period of rice. Thus, the significantly higher percentage of head rice yield and a lower percentage of chalkiness in CN70 and CN90 can be explained by the normal grouting speed and adequate supply of filling substances as compared to the other CN.
The amylose and protein contents of the rice were important factors affecting the eating quality and nutritional quality of the rice. Nitrogen fertilizer application rate had no significant effects on rice amylose and protein. Compared with urea treatment, all CN treatment reduced the content of rice amylose, while the opposite trend was found in protein content. Overall, CN70 and CN90 showed lower amylose content and higher protein content. The rice amylose and protein content were affected by the interaction of nitrogen application rate and controlled-release characteristics. The previous studies indicated that the rice amylose significantly negatively correlated with eating quality, and there was a significant positive correlation between protein content and nutritional quality [23]. Amylose is mainly distributed in the amorphous region of starch grains, and higher amylose content increases the degree of crystallization, resulting in tightly packed starch granules and increased hardness of the rice [24]. Although the increase in protein content improves the nutritional quality of rice, proteins readily form complexes with starch granules, thereby affecting the properties of starch granules [25].
The pasting properties of rice starch were significantly affected by different nitrogen treatments (Table 5). Starch granules swell and rupture in the gelatinization due to the breakage of hydrogen bonds and hydration [26]. The RVA character reflects the change characteristics of starch viscosity in the process of heating and cooling rice flour, which is an important index affecting rice eating quality. The breakdown viscosity value had a negative effect on the heating resistance of starch, and the setback viscosity value reflected the aging degree of starch. Rice with high eating value usually had a higher breakdown viscosity value and lower setback viscosity value. The result showed that the breakdown viscosity value significantly increased with the reduction of nitrogen application, and CN70 showed a higher breakdown value as compared to the other treatments.
The evaluation system of rice quality is complex, containing processing, appearance, eating and nutritional quality. The comprehensive evaluation of quality traits is of great significance for determining quality fertilization measures for rice and helping consumers make purchasing decisions. The quality data were exposed to the principal component analysis (PCA). As shown in Figure 2A, the first two principal components (PC1 and PC2) explained 70.2% of the total variance of quality data. The scores of the first two principal components were calculated according to the eigenvalues and eigenvectors of the principal components, and the corresponding variance contribution rate of the principal components was taken as the weight to obtain the comprehensive evaluation scores of the principal components (Figure 2B). According to this evaluation system, the quality of rice with 300 kg/ha CN90 was the best, and the rice quality of 300 kg/ha urea was the worst.

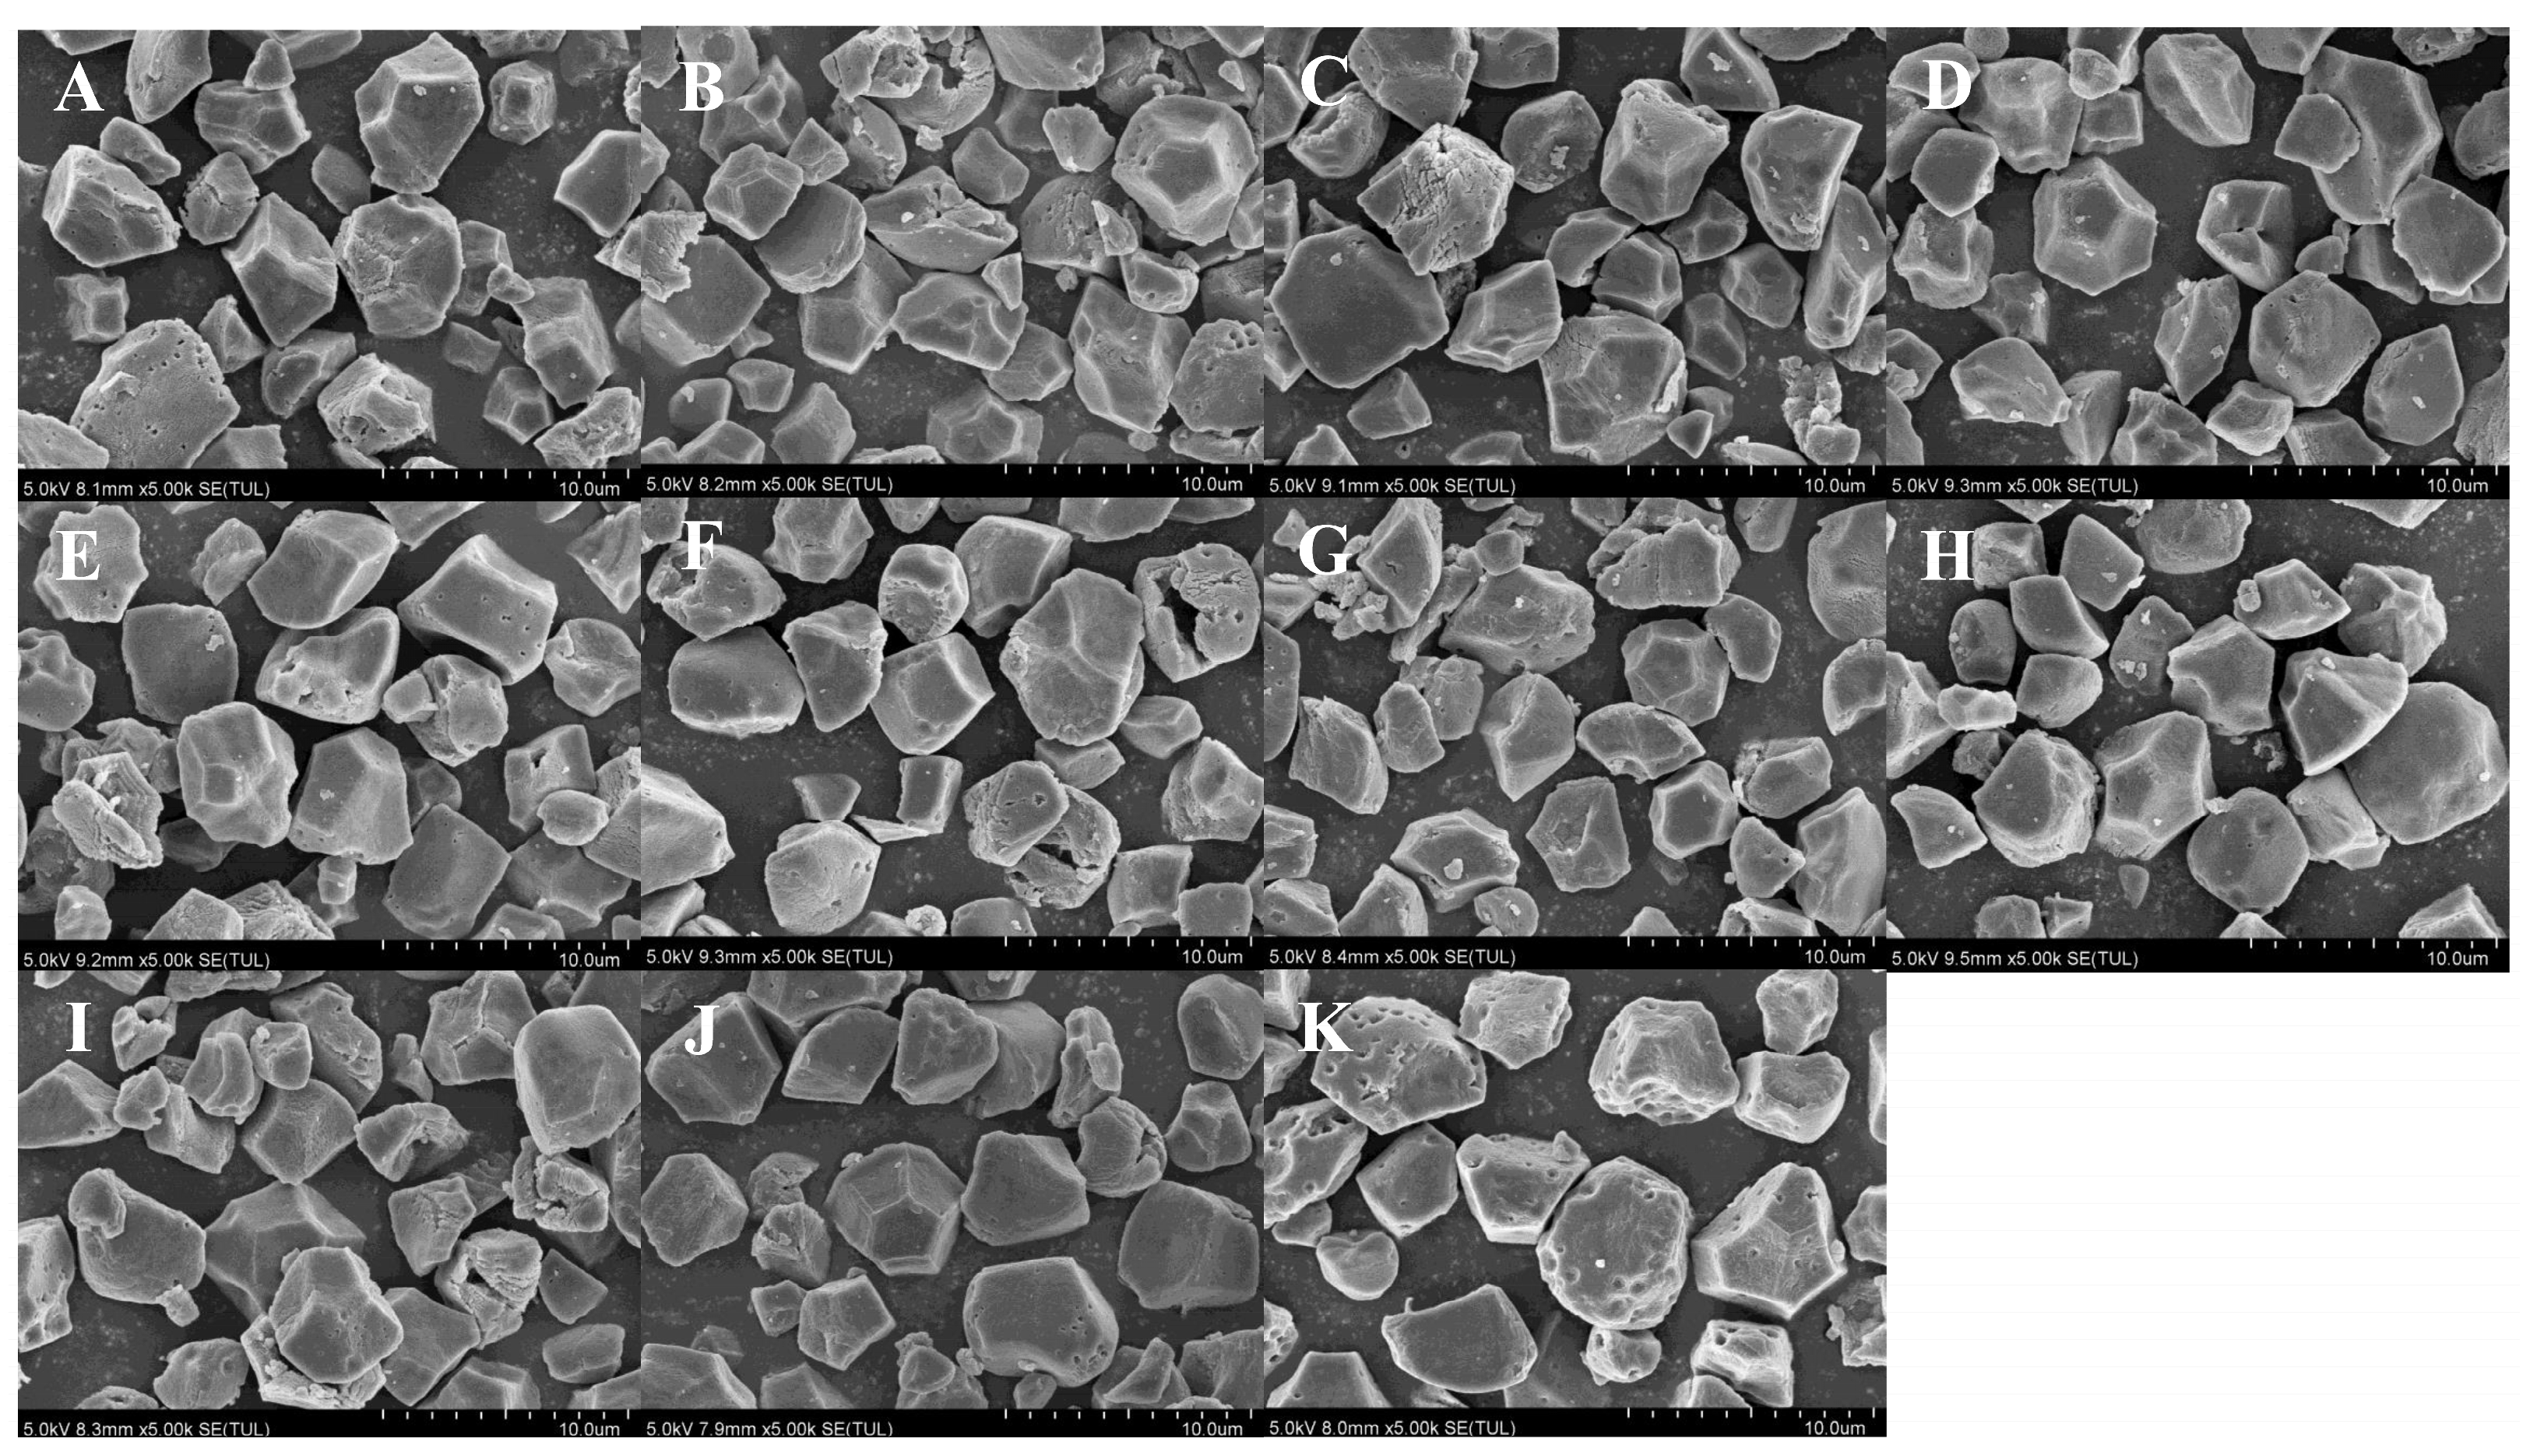
3.3. Effect of Different Nitrogen Fertilizers on Rice Starch Structure

The change (i.e., contents of amylose and protein) of internal components of rice altered the starch granule structure and physicochemical properties, and thus significantly affected rice quality [27]. Rice starch grains with different fertilization treatments exhibit sharp-edged polyhedron (Figure 3). Both application rate and release characteristics of nitrogen fertilizer had effects on the morphology of rice starch grains. The surface of starch granules under CK and LCN4 was scattered with more micropores than other treatments. Compared with the CN, the size consistency of starch granules decreased under conventional fertilization treatment.
The size distribution of rice starch granules was similar in all treatments (Figure 4A–C). The starch granule distribution showed unimodal distribution and two typical high peaks occurred at around 0.56 and 0.63 μm (Figure 4A). The volume and surface area distribution of starch granules showed bimodal distribution. The effect of larger starch granules on volume and surface was greater than that of smaller granules (Figure 4B,C). In our research, compared with conventional fertilization, the number, volume, and area of large starch particles in LCN4 significantly decreased. In contrast, the small starch particles were increased dramatically under iso-nitrogen conditions. Previous studies have shown that appropriate nitrogen application can promote grain filling and starch synthesis, and inhibit the development of starch grains forming large grains [28]. The compact small starch grains can inhibit the formation of chalkiness, which is consistent with the results of our previous study.
The FTIR spectra peaks of rice starch with different treatments appeared in the same position, while the relative absorbance of peak values was different (Figure 4D). The FTIR absorption peaks of 1045 cm−1 were assigned to ordered structures of rice starch, the FTIR absorption peaks of 1022 cm−1 were assigned to structural characteristics of the starch amorphous region. The FTIR absorption peaks of 955 cm−1 correspond to the hydrogen bond structure formed between hydroxyl groups of starch macromolecules [29]. The intensity ratio of the two peaks (1045/1022 cm−1 and 1022/955 cm−1) in the FTIR spectra was regarded as the index of the ordered structure of starch grains, and the ratio of the peak intensities of 1045/1022 cm−1 reflected the degree of order of starch granules (Table 6). The higher the ratio of the peak intensities of 1045/1022 cm−1, the higher the order degree of the starch granules. The ordered structure of starch was highly resistant to hydrolase [30]. In our study, the ordered degree of CN was lower than that of conventional fertilization treatment, and starch network structure was more compact, thus showing good digestion and resistance to retrogression.
The rice starches, with different treatments, showed similar XRD spectra (Figure 4E). Two strong 2θ peaks appeared at 15° and 23°, respectively, and there were successive 2θ peaks at 17° and 18°. The result shows that the rice starches, with different treatments, showed A-type crystals [31], and that the controlled-release period and nitrogen fertilizer rate had no effects on starch crystal type.

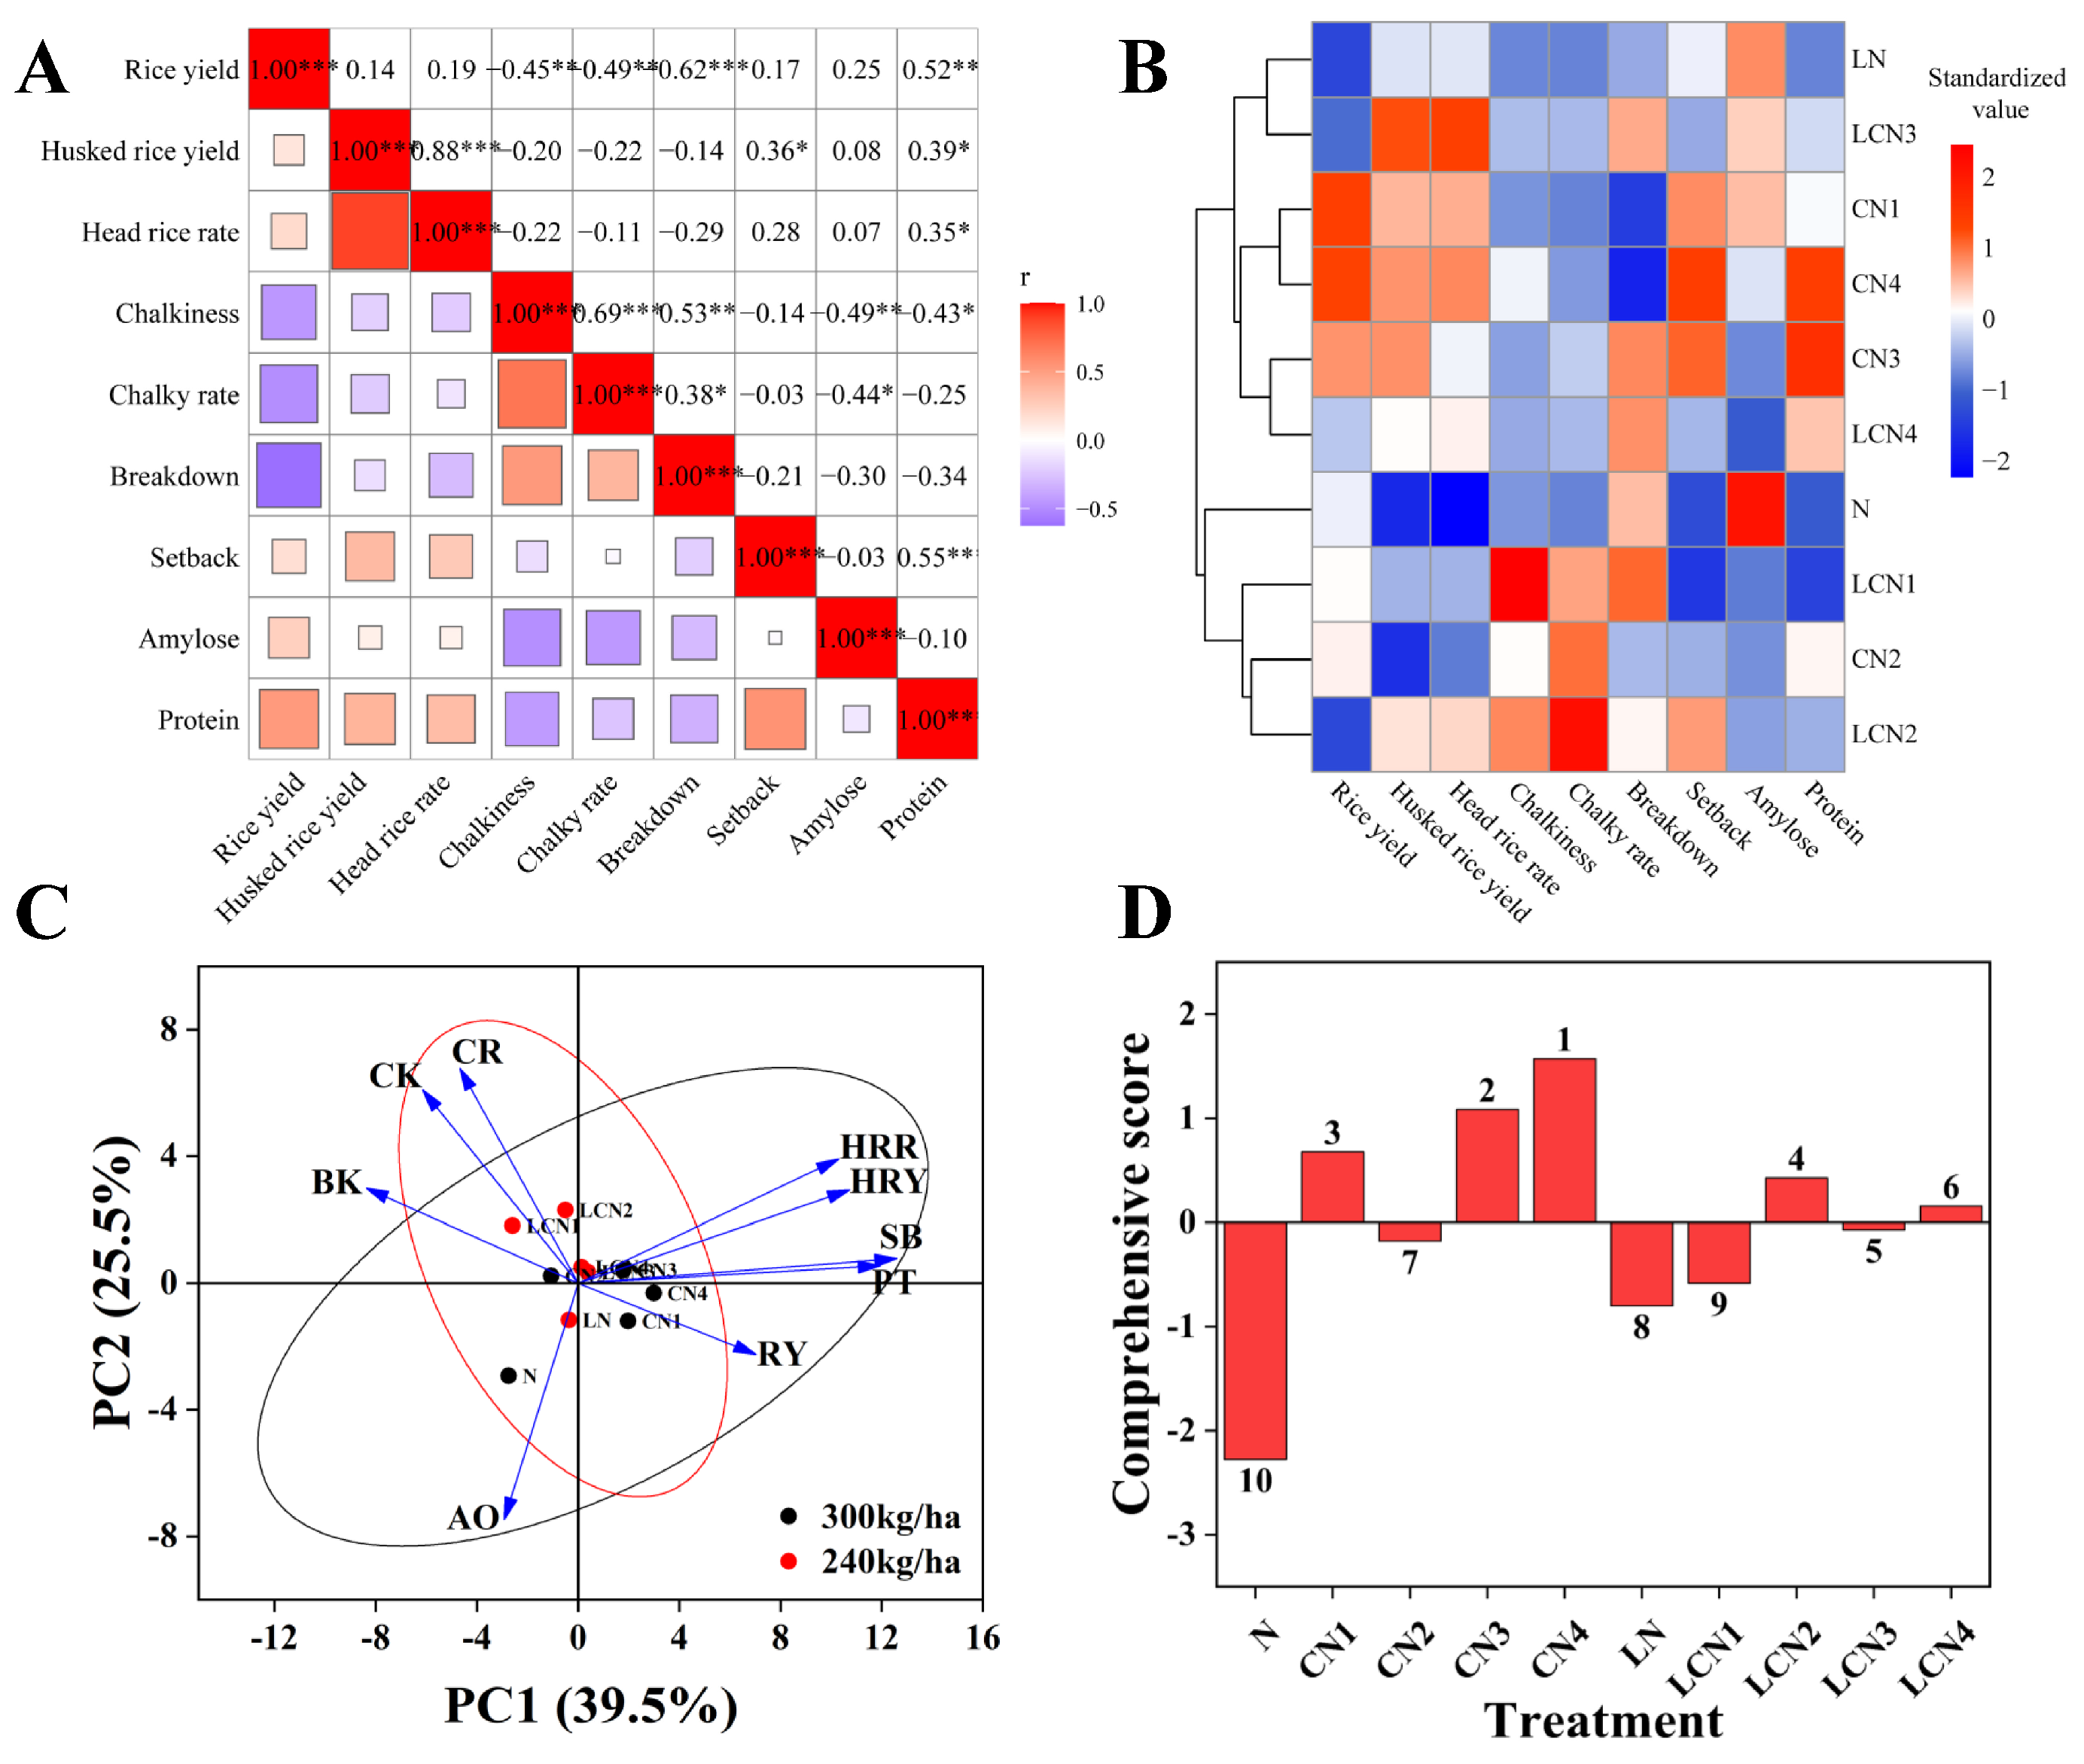
3.4. Comprehensive Evaluation of Rice Commodity Value

It is of great significance to realize that co-enhancing rice yield and quality and increasing the commodity value of rice may guarantee national food security. Correlation analysis and principal component analysis were applied to yield and quality index data sets (Figure 5). Figure 5A shows the correlation between yield and various quality indicators. The rice grain yield was negatively correlated with chalky rate, chalkiness, and breakdown viscosity value, while the opposite trend was found in protein content. The chalky rate and chalkiness negatively correlated with amylose content while the opposite trend was found in breakdown viscosity value. This result showed that rice yield was positively correlated with appearance quality and nutritional quality, but negatively correlated with food taste and cooking quality. The cluster analysis results showed that all treated rice could be divided into four groups (Figure 5B). Figure 5C shows the principal component analysis (PCA) based on yield and quality indicators under different nitrogen treatments. The first two principal components (PC1 and PC2) together explained 65.0% of the total variance of quality data. PC1 was highly correlated with protein content and setback viscosity value, and PC2 was highly correlated with amylose content and chalkiness. As indicated above, the structure and physicochemical properties of rice starch were significantly affected by amylose and protein content, which further affected the rice quality. Therefore, amylose and protein content are the main factors affecting rice yield and quality, and the changes in these two indexes should have close attention paid to them in future research. As in the method of quality index evaluation, we established the comprehensive evaluation model of rice yield and quality, and calculated the corresponding score (Figure 5D). The rice yield and quality of CN4 were significantly higher than those of other treatments, and the comprehensive ranking was the highest. Although the rice quality of CN1 was worse than that of LCN2, the ranking in the comprehensive evaluation has been improved due to its higher yield.

4. Conclusions

The study results showed that the effects of different nitrogen applications and nutrient release characteristics on rice yield and quality were significantly different. With appropriate nitrogen application, amylose content decreased, and protein content increased; thus, there were decreases in starch granule size and increases in the order degree of structure, the surface of the starch granules became smoother, and finally, there were improvements to the quality of rice. According to the comprehensive evaluation between yield and quality indexes of rice with different treatments, CN4 treatment achieved the synergistic improvement of yield and quality due to the adequate supply of nutrients throughout the growth period of the rice. The results confirm our earlier hypothesis, which may provide a valuable reference for optimal nitrogen management to improve rice yield and quality.

Author Contributions

Conceptualization, Z.Y. and Y.Y. (Yuechao Yang); Data curation, R.W. and X.W.; Formal analysis, Y.Y. (Yuanyuan Yao) and X.W.; Funding acquisition, Y.Y. (Yuechao Yang); Investigation, Z.Y., R.W. and X.W.; Methodology, Z.Y. and R.W.; Software, Z.Y.; Writing—original draft, Z.Y. and R.W.; Writing—review & editing, Y.Y. (Yuanyuan Yao), J.H. and Y.Y. (Yuechao Yang). All authors have read and agreed to the published version of the manuscript.

Funding

This research was funded by Shandong Agricultural Innovation Team (SDAIT-2021-04), the Great Innovation Projects in Agriculture of Shandong Province (Grant No. 2021CXGC010804-05-02) and the National Key Research and Development Program of China (Grant 2021YFD190090103).

Data Availability Statement

The original contributions presented in the study are included in the article, further inquiries can be directed to the corresponding author.

Conflicts of Interest

The authors declare no conflict of interest.

References

  1. Ch, R.; Chevallier, O.; McCarron, P.; McGrath, T.F.; Wu, D.; Nguyen Doan Duy, L.; Kapil, A.P.; McBride, M.; Elliott, C.T. Metabolomic fingerprinting of volatile organic compounds for the geographical discrimination of rice samples from China, Vietnam and India. Food Chem. 2021, 334, 127553. [Google Scholar] [CrossRef] [PubMed]
  2. Hu, Q.; Liu, Q.; Jiang, W.; Qiu, S.; Wei, H.; Zhang, H.; Liu, G.; Xing, Z.; Hu, Y.; Guo, B.; et al. Effects of mid-stage nitrogen application timing on the morphological structure and physicochemical properties of japonica rice starch. J. Sci. Food Agric. 2021, 101, 2463–2471. [Google Scholar] [CrossRef] [PubMed]
  3. Lee, S. Recent Advances on Nitrogen Use Efficiency in Rice. Agronomy 2021, 11, 753. [Google Scholar] [CrossRef]
  4. Liu, C.; Chen, F.; Li, Z.; Cocq, K.L.; Liu, Y.; Wu, L. Impacts of nitrogen practices on yield, grain quality, and nitrogen-use efficiency of crops and soil fertility in three paddy-upland cropping systems. J. Sci. Food Agric. 2021, 101, 2218–2226. [Google Scholar] [CrossRef] [PubMed]
  5. Ding, W.; Xu, X.; He, P.; Ullah, S.; Zhang, J.; Cui, Z.; Zhou, W. Improving yield and nitrogen use efficiency through alternative fertilization options for rice in China: A meta-analysis. Field Crops Res. 2018, 227, 11–18. [Google Scholar] [CrossRef]
  6. Yu, Z.; Yang, Y.; Wang, C.; Shi, G.; Xie, J.; Gao, B.; Li, Y.C.; Wan, Y.; Cheng, D.; Shen, T.; et al. Nano-soy-protein microcapsule-enabled self-healing biopolyurethane-coated controlled-release fertilizer: Preparation, performance, and mechanism. Mater. Today Chem. 2021, 20, 100413. [Google Scholar] [CrossRef]
  7. Zhou, T.; Zhou, Q.; Li, E.; Yuan, L.; Wang, W.; Zhang, H.; Liu, L.; Wang, Z.; Yang, J.; Gu, J. Effects of nitrogen fertilizer on structure and physicochemical properties of ‘super’ rice starch. Carbohydr. Polym. 2020, 239, 116237. [Google Scholar] [CrossRef] [PubMed]
  8. Zhu, D.; Fang, C.; Qian, Z.; Guo, B.; Huo, Z. Differences in starch structure, physicochemical properties and texture characteristics in superior and inferior grains of rice varieties with different amylose contents. Food Hydrocoll. 2021, 110, 106170. [Google Scholar] [CrossRef]
  9. Bian, J.-l.; Xu, F.-f.; Han, C.; Qiu, S.; Ge, J.-l.; Xu, J.; Zhang, H.-c.; Wei, H.-y. Effects of planting methods on yield and quality of different types of japonica rice in northern Jiangsu plain, China. J. Integr. Agric. 2018, 17, 2624–2635. [Google Scholar] [CrossRef]
  10. Deng, F.; Li, Q.; Chen, H.; Zeng, Y.; Li, B.; Zhong, X.; Wang, L.; Ren, W. Relationship between chalkiness and the structural and thermal properties of rice starch after shading during grain-filling stage. Carbohydr. Polym. 2021, 252, 117212. [Google Scholar] [CrossRef]
  11. Tang, S.; Zhang, H.; Liu, W.; Dou, Z.; Zhou, Q.; Chen, W.; Wang, S.; Ding, Y. Nitrogen fertilizer at heading stage effectively compensates for the deterioration of rice quality by affecting the starch-related properties under elevated temperatures. Food Chem. 2019, 277, 455–462. [Google Scholar] [CrossRef] [PubMed]
  12. Huang, S.-j.; Zhao, C.-f.; Zhu, Z.; Zhou, L.-h.; Zheng, Q.-h.; Wang, C.-l. Characterization of eating quality and starch properties of two Wx alleles japonica rice cultivars under different nitrogen treatments. J. Integr. Agric. 2020, 19, 988–998. [Google Scholar] [CrossRef]
  13. Wu, Q.; Wang, Y.; Chen, T.; Zheng, J.; Sun, Y.; Chi, D. Soil nitrogen regulation using clinoptilolite for grain filling and grain quality improvements in rice. Soil Tillage Res. 2020, 199, 104547. [Google Scholar] [CrossRef]
  14. Ni, B.; Liu, M.; Lu, S.; Xie, L.; Wang, Y. Environmentally friendly slow-release nitrogen fertilizer. J. Agric. Food Chem. 2011, 59, 10169–10175. [Google Scholar] [CrossRef] [PubMed]
  15. El Halal, S.L.M.; Kringel, D.H.; Zavareze, E.d.R.; Dias, A.R.G. Methods for Extracting Cereal Starches from Different Sources: A Review. Starch-Stärke 2019, 71, 1900128. [Google Scholar] [CrossRef]
  16. Bhat, F.M.; Riar, C.S. Effect of composition, granular morphology and crystalline structure on the pasting, textural, thermal and sensory characteristics of traditional rice cultivars. Food Chem. 2019, 280, 303–309. [Google Scholar] [CrossRef] [PubMed]
  17. Wei, T.; Simko, V. R Package ‘Corrplot’: Visualization of a Correlation Matrix (Version 0.92). 2021. Available online: https://github.com/taiyun/corrplot (accessed on 20 May 2022).
  18. Qiu, Y. Sysfonts: Loading Fonts into R (R Package Version 0.8.9). 2024. Available online: https://github.com/yixuan/sysfonts (accessed on 20 May 2022).
  19. Tian, C.; Zhou, X.; Ding, Z.; Liu, Q.; Xie, G.; Peng, J.; Rong, X.; Zhang, Y.; Yang, Y.; Eissa, M.A. Controlled-release N fertilizer to mitigate ammonia volatilization from double-cropping rice. Nutr. Cycl. Agroecosyst. 2021, 119, 123–137. [Google Scholar] [CrossRef]
  20. Ishibashi, Y.; Hanyu, N.; Nakada, K.; Suzuki, Y.; Yamamoto, T.; Takahashi, T.; Kawasaki, N.; Kawakami, M.; Matsushima, M.; Urashima, M. Endothelin protein expression as a significant prognostic factor in oesophageal squamous cell carcinoma. Eur. J. Cancer 2003, 39, 1409–1415. [Google Scholar] [CrossRef] [PubMed]
  21. Yoshioka, Y.; Iwata, H.; Tabata, M.; Ninomiya, S.; Ohsawa, R. Chalkiness in Rice: Potential for Evaluation with Image Analysis. Crop Sci. 2007, 47, 2113–2120. [Google Scholar] [CrossRef]
  22. Yoon, D.-K.; Ishiyama, K.; Suganami, M.; Tazoe, Y.; Watanabe, M.; Imaruoka, S.; Ogura, M.; Ishida, H.; Suzuki, Y.; Obara, M.; et al. Transgenic rice overproducing Rubisco exhibits increased yields with improved nitrogen-use efficiency in an experimental paddy field. Nat. Food 2020, 1, 134–139. [Google Scholar] [CrossRef] [PubMed]
  23. Tao, K.; Yu, W.; Prakash, S.; Gilbert, R.G. High-amylose rice: Starch molecular structural features controlling cooked rice texture and preference. Carbohydr. Polym. 2019, 219, 251–260. [Google Scholar] [CrossRef] [PubMed]
  24. Wani, A.A.; Singh, P.; Shah, M.A.; Schweiggert-Weisz, U.; Gul, K.; Wani, I.A. Rice Starch Diversity: Effects on Structural, Morphological, Thermal, and Physicochemical Properties-A Review. Compr. Rev. Food Sci. Food Saf. 2012, 11, 417–436. [Google Scholar] [CrossRef]
  25. Martin, M.; Fitzgerald, M.A. Proteins in rice grains influence cooking properties! J. Cereal Sci. 2002, 36, 285–294. [Google Scholar] [CrossRef]
  26. Blazek, J.; Gilbert, E.P. Application of small-angle X-ray and neutron scattering techniques to the characterisation of starch structure: A review. Carbohydr. Polym. 2011, 85, 281–293. [Google Scholar] [CrossRef]
  27. Lin, L.; Cai, C.; Gilbert, R.G.; Li, E.; Wang, J.; Wei, C. Relationships between amylopectin molecular structures and functional properties of different-sized fractions of normal and high-amylose maize starches. Food Hydrocoll. 2016, 52, 359–368. [Google Scholar] [CrossRef]
  28. Lv, X.; Ding, Y.; Long, M.; Liang, W.; Gu, X.; Liu, Y.; Wen, X.J. Effect of foliar application of various nitrogen forms on starch accumulation and grain filling of wheat (Triticum aestivum L.) under drought stress. Front. Plant Sci. 2021, 12, 463. [Google Scholar] [CrossRef] [PubMed]
  29. Warren, F.J.; Gidley, M.J.; Flanagan, B.M. Infrared spectroscopy as a tool to characterise starch ordered structure—A joint FTIR–ATR, NMR, XRD and DSC study. Carbohydr. Polym. 2016, 139, 35–42. [Google Scholar] [CrossRef] [PubMed]
  30. Sevenou, O.; Hill, S.; Farhat, I.; Mitchell, J.R. Organisation of the external region of the starch granule as determined by infrared spectroscopy. Int. J. Biol. Macromol. 2002, 31, 79–85. [Google Scholar] [CrossRef] [PubMed]
  31. Cheetham, N.W.; Tao, L. Variation in crystalline type with amylose content in maize starch granules: An X-ray powder diffraction study. Carbohydr. Polym. 1998, 36, 277–284. [Google Scholar] [CrossRef]
Figure 1. Nutrient release characteristics of different nitrogen fertilizers and their effects on rice yield. N release curves of CN30, CN50, CN70 and CN90 in 25 °C water (A) and field soil (B); (C) Grain yield of rice under different fertilization treatments. Notes: CK (without N fertilizer), N (N300 × Urea), LN (N240 × Urea), CN1 (N300 × CN30), LCN1 (N240 × CN30), CN2 (N300 × CN50), LCN2 (N240 × CN50), CN3 (N300 × CN70), LCN3 (N240 × CN70), CN4 (N300 × CN90), LCN4 (N240 × CN90).
Agronomy 14 01685 g001
Figure 2. (A) Principal component analysis (PCA) based on quality indicators; (B) Comprehensive score of different fertilization treatments based on PCA. Notes: CK (without N fertilizer), N (N300 × Urea), LN (N240 × Urea), CN1 (N300 × CN30), LCN1 (N240 × CN30), CN2 (N300 × CN50), LCN2 (N240 × CN50), CN3 (N300 × CN70), LCN3 (N240 × CN70), CN4 (N300 × CN90), LCN4 (N240 × CN90).
Agronomy 14 01685 g002
Figure 3. SEM images of rice starch grains with different fertilization treatments. (AK), CK, N, LN, CN1, LCN1, CN2, LCN2, CN3, LCN3, CN4, LCN4 treatment of cultivar Shengxiang 66, respectively.
Agronomy 14 01685 g003
Figure 4. Effect of different nitrogen fertilizer on the structure of rice starch. Number (A), volume (B) and area (C) distribution of starch granules; ATR-FTIR spectra of rice starch (D) and X-ray diffraction patterns of rice starch (E). Notes: CK (without N fertilizer), N (N300 × Urea), LN (N240 × Urea), CN1 (N300 × CN30), LCN1 (N240 × CN30), CN2 (N300 × CN50), LCN2 (N240 × CN50), CN3 (N300 × CN70), LCN3 (N240 × CN70), CN4 (N300 × CN90), LCN4 (N240 × CN90).
Agronomy 14 01685 g004
Figure 5. Comprehensive evaluation of rice yield and quality. (A) The Pearson correlation between yield and quality indicators; (B) The clustering analysis of different fertilization treatments; (C) Principal component analysis (PCA) based on yield and quality indicators; (D) Comprehensive score of different fertilization treatments based on PCA. Notes: N (N300 × Urea), LN (N240 × Urea), CN1 (N300 × CN30), LCN1 (N240 × CN30), CN2 (N300 × CN50), LCN2 (N240 × CN50), CN3 (N300 × CN70), LCN3 (N240 × CN70), CN4 (N300 × CN90), LCN4 (N240 × CN90). Rice yield (RY); Husked rice yield (HRY); Head rice rate (HRR); Chalkiness (CK); Chalky rate (CR); Breakdown (BK); Setback (SB); Amylose (AO); Protein (PT); (*: p < 0.05; **: p < 0.01; ***: p < 0.001).
Agronomy 14 01685 g005
Table 1. The physicochemical properties of experimental soil.
pHOrganic Matter
(g/kg)
Total Nitrogen
(g/kg)
Available Phosphorus
(mg/kg)
Available Potassium
(mg/kg)
7.049.761.4633.2478.52
Table 2. The field experiment design.
NumberTreatmentN Level
(kg/ha)
1CK0
2N300
3LN240
4CN1300
5LCN1240
6CN2300
7LCN2240
8CN3300
9LCN3240
10CN4300
11LCN4240
Table 3. Effect of different nitrogen fertilizers (type, amount and their interaction) on quality indicators in rice.
TreatmentHusked Rice Rate (%)Head Rice Rate (%)Chalky Rate (%)Chalkiness (%)Content of Amylose (%)Protein Content (%)Breakdown (cP)Setback (cP)
N level
N30075.83a67.16a5.13a0.93b18.01a9.92a655b739a
N24076.64a67.96a7.47a1.48a17.69a9.63a724a706a
Types of N fertilizers
Urea74.65c66.07b3.00c0.64c18.83a9.48d691b690b
CN3076.37abc67.71ab6.17b1.92a17.75b9.57c675b705ab
CN5075.08bc67.27ab13.17a1.60a17.43b9.73b682b731ab
CN7078.03a68.51a5.00bc0.84bc17.75b10.02a748a737ab
CN9077.04ab68.28a4.17bc1.02b17.47b10.08a652b749a
N level × Types interaction
CK75.63ab66.27bc12.7ab3.17a17.37de9.53ef900a745abc
N300 × Urea73.21b64.62c3.0c0.69e19.27a9.43fg730bcd658de
N240 × Urea76.09ab67.51ab3.0c0.60e18.40b9.53ef651de723abcd
N300 × CN3077.27a68.40ab3.0c0.67e18.20bc9.80c577ef765abc
N240 × CN3075.47ab67.01abc9.3b3.17a17.30e9.33g773b645e
N300 × CN5073.39b66.47bc10.7b1.31c17.40de9.83bc661cde700cde
N240 × CN5076.77a68.06ab15.7a1.89b17.47cde9.63de703bcd761abc
N300 × CN7076.77a67.63ab5.3c0.75de17.37de10.30a756b778ab
N240 × CN7077.66a69.39a4.7c0.93cde18.13bcd9.73cd740bcd697cde
N300 × CN9078.40a68.71ab3.7c1.23cd17.80bcde10.23a553f795a
N240 × CN9077.61a67.84ab4.67c0.80de17.13e9.93b752bc702bcde
Source of variance
N level---***--*-
Types of N fertilizers**-*************-
N level × Types *-**************
Notes: Values in the same column with different letters are significantly different (p < 0.05) (-: p > 0.05; *: p < 0.05; **: p < 0.01; ***: p < 0.001).
Table 4. Effect of different fertilization treatments on rice grain shape.
TreatmentLength (mm)Width (mm)Length/Width (mm)
CK5.76 ± 0.02a2.57 ± 0.01a2.26 ± 0.01d
N5.70 ± 0.04a2.47 ± 0.02c2.32 ± 0.00ab
LN5.64 ± 0.05a2.47 ± 0.02bc2.29 ± 0.00bc
CN15.68 ± 0.04a2.48 ± 0.01bc2.30 ± 0.01abc
LCN15.69 ± 0.03a2.52 ± 0.01abc2.28 ± 0.02cd
CN25.70 ± 0.03a2.49 ± 0.02bc2.30 ± 0.01bc
LCN25.76 ± 0.05a2.50 ± 0.02bc2.32 ± 0.02ab
CN35.75 ± 0.03a2.46 ± 0.02c2.34 ± 0.01a
LCN35.76 ± 0.05a2.53 ± 0.03ab2.29 ± 0.00bcd
CN45.68 ± 0.02a2.48 ± 0.01bc2.31 ± 0.00abc
LCN45.70 ± 0.02a2.51 ± 0.00abc2.29 ± 0.01bcd
Notes: CK (without N fertilizer), N (N300 × Urea), LN (N240 × Urea), CN1 (N300 × CN30), LCN1 (N240 × CN30), CN2 (N300 × CN50), LCN2 (N240 × CN50), CN3 (N300 × CN70), LCN3 (N240 × CN70), CN4 (N300 × CN90), LCN4 (N240 × CN90). Values in the same column with different letters are significantly different (p < 0.05).
Table 5. Effect of different nitrogen fertilizers on rice starch pasting properties.
TreatmentPeak Viscosity (cP)Hot Viscosity (cP)Breakdown (cP)Final Viscosity (cP)Setback (cP)Peaking Time (S)Pasting Temperature (°C)
CK2774a2153a900a3628a745abc6.53a75.10d
N2487cd1757cd730bcd3144d658de6.40a89.38bc
LN2396de1745cd651de3119d723abcd6.33a88.57c
CN12254f1637d577ef3019e765abc6.51a91.47a
LCN12509c1736cd773b3154d645e6.40a88.78c
CN22406de1821c661cde3106de700cde6.47a89.85abc
LCN22547c1774cd703bcd3326b761abc6.49a90.42abc
CN32483cd1644d756b3183d778ab6.33a90.52abc
LCN32653b1988b740bcd3284bc697cde6.47a89.27bc
CN42342ef1804c553f3192cd795a6.56a90.95ab
LCN42349ef1762cd752bc3207cd702bcde6.36a89.88abc
Notes: CK (without N fertilizer), N (N300 × Urea), LN (N240 × Urea), CN1 (N300 × CN30), LCN1 (N240 × CN30), CN2 (N300 × CN50), LCN2 (N240 × CN50), CN3 (N300 × CN70), LCN3 (N240 × CN70), CN4 (N300 × CN90), LCN4 (N240 × CN90). Values in the same column with different letters are significantly different (p < 0.05).
Table 6. Effect of different nitrogen fertilizers on IR ratio of rice starch.
TreatmentIR Ratio
1045/1022 cm−11022/995 cm−1
CK0.5451.139
N0.7762.100
LN0.5381.184
CN10.5131.129
LCN10.5081.170
CN20.4921.064
LCN20.5121.132
CN30.4911.176
LCN30.5901.358
CN40.5031.066
LCN40.4791.031
Notes: CK (without N fertilizer), N (N300 × Urea), LN (N240 × Urea), CN1 (N300 × CN30), LCN1 (N240 × CN30), CN2 (N300 × CN50), LCN2 (N240 × CN50), CN3 (N300 × CN70), LCN3 (N240 × CN70), CN4 (N300 × CN90), LCN4 (N240 × CN90).
Disclaimer/Publisher’s Note: The statements, opinions and data contained in all publications are solely those of the individual author(s) and contributor(s) and not of MDPI and/or the editor(s). MDPI and/or the editor(s) disclaim responsibility for any injury to people or property resulting from any ideas, methods, instructions or products referred to in the content.

