Article

Comprehensive Dissection of Metabolites in Response to Low Phosphorus Stress in Different Root-Type Alfalfa at Seedling Stage

Key Laboratory of Forage Germplasm Innovation and New Variety Breeding of Ministry of Agriculture and Rural Affairs (Co-Sponsored by the Ministry and Gansu Province), Key Laboratory of Grassland Ecosystem of Ministry of Education, College of Pratacultural Science, Gansu Agricultural University, Lanzhou 730070, China
*
Author to whom correspondence should be addressed.
Agronomy 2024, 14(8), 1697; https://doi.org/10.3390/agronomy14081697
Submission received: 6 June 2024 / Revised: 1 July 2024 / Accepted: 4 July 2024 / Published: 1 August 2024
(This article belongs to the Section Plant-Crop Biology and Biochemistry)

Abstract

:
Medicago sativa is a high-quality legume forage that is widely cultivated around the world. However, low phosphorus (LP) stress is one of the main limiting factors for its yield and quality. Currently, it is unclear how various alfalfa root types respond to LP stress. Thus, the creeping-rooted M. varia ‘Gannong No. 4’ (or GN), tap-rooted M. sativa ‘Longdong’ (or LD), and rhizomatous-rooted M. sativa ‘Qingshui’ (or QS) were selected to detect changes in growth, metabolites, phytohormones, and organic acids after 34 days of LP stress treatment (0.01 mmol·L−1 KH2PO4). We observed LP stress significantly inhibited plant growth, and 123, 73, and 42 considerably upregulated differential metabolites were categorized into 33, 26, and 20 metabolic pathways in GN, LD, and QS under LP stress, respectively. Amino acids, plant growth regulators, and organic acids are the main metabolites. After 34 d of LP treatment, the plant height, total surface area, leaf length, ground biomass, leaf width, total volume, leaf area, and ZT content of different root types of alfalfa significantly decreased, while the contents of malic acid, citric acid, oxalic acid, IAA, ABA, and GA3 significantly increased. The plant height, leaf length, leaf width, leaf area, total surface area, total volume, ground biomass, root biomass, the number of different metabolites, and the contents of malic, citric, and oxalic acid, and IAA of GN were significantly higher than those of QS and LD under LP stress. From this point of view, GN was more tolerant than LD and QS under the LP condition.

1. Introduction

Alfalfa or lucerne (Medicago spp.), a perennial legume species, is widely cultivated worldwide due to its drought resistance, strong regeneration ability, and wide adaptability [1]. As an economically significant legume, alfalfa is commonly used as fodder for livestock and as green manure to improve soil fertility. The available phosphorus (P) required for alfalfa production is usually 10–15 mg·kg−1, and plants can absorb 0.1–10 µmol·L−1 of available P from the soil [2,3]. While alfalfa can withstand a wide range of environmental stresses, LP stress inhibits normal growth and is the primary factor influencing alfalfa output and quality.
P is the second most crucial mineral element required for healthy plant growth [4]. It is component of nucleic acids, phospholipids, and high-energy phosphate compounds [5]. It is involved in regulating many metabolic pathways, including sugar metabolism, respiration, photosynthesis, signal transduction, energy metabolism, and many other processes [6]. Of particular importance, P is often easily fixed in the soils, causing plants to frequently encounter P limitations in many farmlands and ecosystems [7]. Crop production in 30–40% of the world’s arable land is limited by P supply [8]. As such, P is usually the most restrictive and indispensable nutrient element for plants among all soil nutrients. In order to overcome LP availability, plants have developed various tactics to promote P uptake and utilization, such as secreting organic acids, modifying root architecture, raising acid phosphatase activity, and stimulating metabolite production [9]. Therefore, determining the mechanism of alfalfa’s response to LP stress is of great significance for achieving high yield and cultivation of P-resistant varieties.
Organic acids are not only a prerequisite for the synthesis of many metabolites, but also vital products of the plant’s energy metabolism, which is crucial in response to changes in the external environment [10]. Previous studies have demonstrated that LP stress stimulates plant roots to secrete organic acids, thereby changing the pH of the soil, promoting the conversion of organic P to soluble inorganic P, and improving P utilization efficiency [11]. Phytohormones are vital in regulating plant responses to abiotic stress, mainly including abscisic acid (ABA), gibberellin (GA3), indole-3-acetic acid (IAA), and zeatin (ZT). IAA stimulates root growth and cell proliferation [12]. GA3 primarily stimulates flower bud differentiation and the elongation and growth of plant stem nodes. In addition, it collaborates with other phytohormones to govern plant development and growth under adverse conditions [13]. ZT promotes plant cell proliferation, prevents the degradation of chlorophyll and protein, delays plant senescence, slows plant respiration, and maintains cell viability [14].
Metabolomics is a method used to investigate the interactions between biological systems and their environment, which has been widely applied to the analysis of plant tolerance to abiotic stress [15,16]. When plants are exposed to abiotic stress, metabolites participate in various processes such as cell signaling, energy storage, membrane formation, and the whole process of plant material distribution [17]. Plants achieve defense against biotic and abiotic stresses by regulating metabolic networks and triggering the production of special metabolites, which aid in damage repair [18]. Previous studies have shown that cowpea (Vigna unguiculata) perception ability was strongly correlated with the contents of amino acids, soluble sugar, and proanthocyanidin increasing in the root of the initial stage of drought stress [19]. Ye et al. analyzed the metabolites of bermudagrass (Cynodon dactylon) and discovered considerably higher concentrations of 37 metabolites, including amino acids, soluble sugars, and organic acids under salt stress [20]. The content of amino acids increased, and a decrease in osmotic potential was observed in alfalfa after drought stress [21]. Research has shown that under LP stress, plants can regulate sugar, amino acid, and organic acid contents to lessen the negative consequences of inadequate P supply and ensure their regular physiological metabolism [22].
Root types of alfalfa are divided into creeping-rooted, tap-rooted, rhizomatous-rooted, and branch-rooted [23]. The tap-rooted alfalfa has an obvious tap-root and a vertical standing stem, which are suitable for cutting. The branch-rooted alfalfa has many lateral roots extended in a large area and a vertical or semi-vertical standing stem, but does not have an obvious tap-root, which can be cut or grazed. Creeping-rooted alfalfa has a high resistance to cold, aridity, and grazing and a large covering shaped area per plant, which has many horizontal roots extended in a large area and many adventitious buds. The adventitious bud can grow to a new plant. Rhizomatous-rooted alfalfa is used to establish grasslands both for grazing and mowing, and has a relatively low root crown. The low root crown generates a stem similar to a root, and the stem becomes a vegetative branch at a later stage [24]. To some extent, creeping-rooted, rhizomatous-rooted, and branch-rooted alfalfa have the genes of wild M. falcata, which have a strong resistance to extreme environments such as drought and cold [25].
At present, research on different root-type alfalfa focuses on root system development ability [24], cold tolerance and cutting intensities [26], crown characteristics [27], changes in rhizosphere microorganisms, and differential metabolites under drought stress [28]. However, there are few studies on the plant growth, metabolites, organic acids, and phytohormones of different root-type alfalfa under LP stress. In this study, we identify growth parameters, endogenous hormones, organic acids, and metabolites altered under LP stress, which may help us comprehend how different root-type alfalfa cope with LP. These findings may offer new insights and practical guidance for stress-resistance breeding and nutrient-efficient breeding of alfalfa.

2. Materials and Methods

2.1. Plant Materials and Sand Culture

Three root-type alfalfa were used, creeping-rooted M. varia ‘Gongnong No. 4’ (or GN), tap-rooted M. sativa ‘Longdong’ (or LD), and rhizomatous-rooted M. sativa ‘Qingshui’ (or QS). Alfalfa seeds were supplied by the Key Laboratory of Grassland Ecosystems of the Ministry of Education. The seeds were disinfected using NaClO (1%) and washed repeatedly with ultrapure water. The river sand was washed repeatedly with distilled water and finally disinfected at a high temperature (121 °C) for 12 h. We selected 15 kg of disinfected river sand and put it into a flowerpot (a depth of 40 cm and a diameter of 20 cm). The seeds were spread evenly in the flowerpot and placed in the plant growth chamber. They were watered with Hoagland nutrient solution (500 mL) every 2 days [29].

2.2. Stress Treatments and Sampling

When three root-type alfalfa grew to the branching stage (about 45 cm plant height), the plants were randomly allocated to control treatment (normal phosphorus, NP) and stress treatment (LP). LP stress treatment was created by adding 0.01 mmol·L−1 KH2PO4 Hoagland solution, and K+ balance was adjusted by KCl. NP stress treatment was infused with a P content of 1.00 mmol·L−1 KH2PO4 Hoagland nutrient. After 34 d of continuous treatment, the roots of three root-type alfalfa were collected, dried with paper after flushing thoroughly with distilled water, and quickly frozen in liquid nitrogen (stored at −80 °C).

2.3. Evaluation of Growth Indices

After 34 d of treatment, the plant tissue was harvested, divided into roots, stems, and leaves, and fresh weights (FWs) were taken (n = 10). Dry weights (DWs) were measured after the samples were oven-dried at 65 °C to a constant weight. Root/shoot ratio = root biomass/ground biomass. Leaf area was measured using the LI-3000C leaf area meter; measurements of plant height were performed with a tape measure (n = 10).

2.4. Determination of Morphological Indicators

After 34 d of treatment, we washed the root samples with distilled water and measured the root morphology parameters according to a method described by Wang et al. [23].

2.5. Measurement of Phytohormones

The fresh root samples were collected in liquid nitrogen and then stored at −80 °C. The frozen alfalfa root samples were quickly ground into powder in liquid nitrogen, washed with 10 mL 80% chromatographic methanol (prepared with ultrapure water) in 15 mL centrifuge tubes for three times, extracted in a refrigerator at 4 °C for 24 h, and centrifuged at 10,000 rpm for 15 min at 4 °C. The supernatant was concentrated with a rotary evaporator at 40 °C to remove methanol, and about 2 mL of concentrated solution was obtained. The wall of the evaporation bottle was rinsed with 50% methanol, and finally the volume was fixed to 10 mL. A disposable syringe was used to filter 2 mL of that through a 0.22 μm organic membrane, which was then loaded into a 1.5 mL centrifuge tube and injected into a quaternary gradient ultra-fast liquid chromatograph (Waters Arc-2998 PDA Waters, Waters Corporation, Pleasanton, CA, USA) to determine the contents of IAA, ABA, GA3, and ZT (Aladdin Reagent Co., Ltd., Shanghai, China) [30].

2.6. Measurement of Organic Acids

The fresh alfalfa roots were cleaned with ultra-pure water and cut into pieces, accurately weighed to 6 g, ground into homogenate, and transferred to a 30 mL centrifuge tube. Then, 25 mL ultra-pure water was added and they were ultrasonically extracted in a water bath at 80 °C for 1 h, so that the organic acid was fully leached. The samples were centrifuged at 10,000 rpm for 15 min after cooling, the supernatant was filtered into a 50 mL volumetric flask, and the residue was added to 15 mL ultra-pure water for re-extraction. The supernatant was combined and diluted with ultra-pure water to a scale. The test solution was filtered through a 0.22 μm water filtration membrane, and the filtrate was placed in a 2 mL injection vial for chromatographic determination [31].

2.7. Metabolite Extraction and Determination

A total of 100 mg of tissue samples was ground in liquid nitrogen, and then the homogenate was added to 500 μL of 80% aqueous methanol solution. The resulting mixture was centrifuged and the supernatant was collected for LC-MS analysis [32]. The sample was injected into a column (Thermo Fisher, Hypesil Gold, C18, Vacaville, CA, USA). Detection conditions: temperature, 40 °C; flow rate, 0.2 mL/min; mobile phase A, 0.1% formic acid (Thermo Fisher, USA); mobile phase B, methanol (Thermo Fisher, USA); pH 9.0.

2.8. Statistical Analysis

Microsoft Excel 2019 was utilized to analyze the data on morphology and physiology, create charts, and conduct statistical analysis. The SPSS 20.0 program was employed for variance analysis, utilizing the Duncan method for multiple comparisons. The significant metabolites in three root-type alfalfa were analyzed by multidimensional statistics on VIP value (VIP > 1), differences in multiple p-values (p < 0.05), and fold change (FC ≤ 2). Use R (Version 3.5.0) language and Origin 2021 (9.8) to draw principal component analysis maps, volcano maps, and cluster heatmaps [33].

3. Results

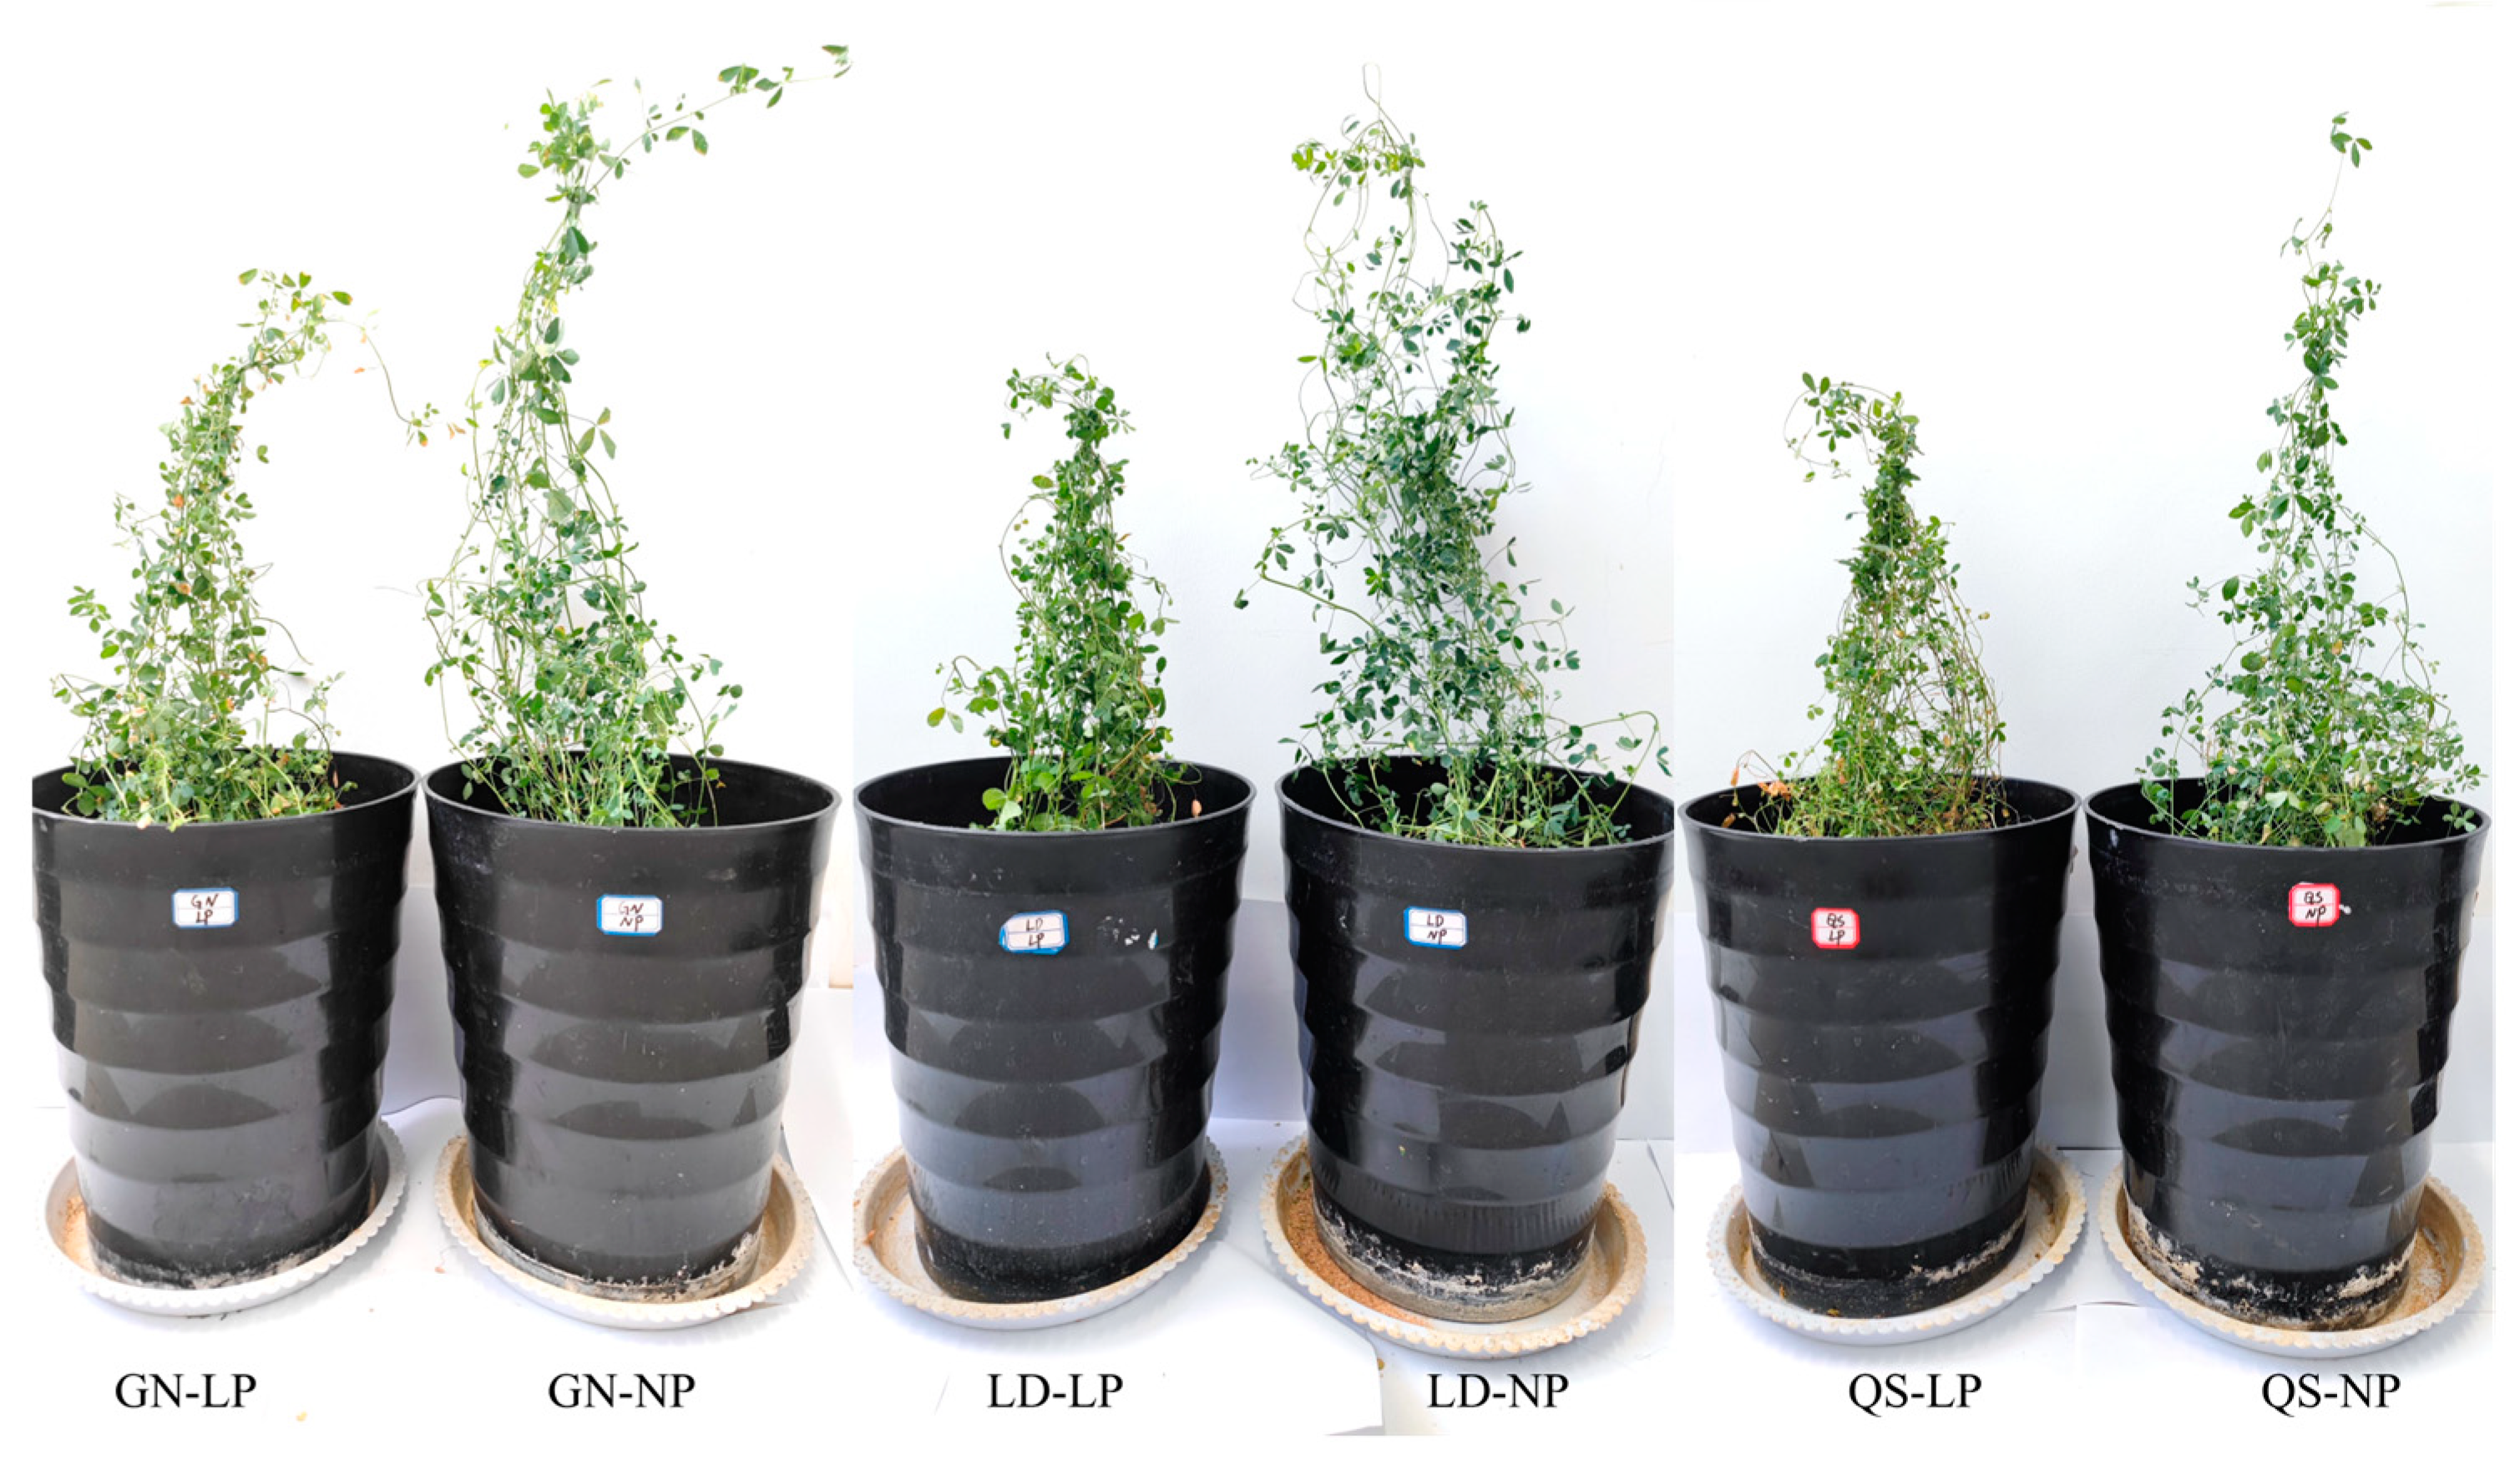
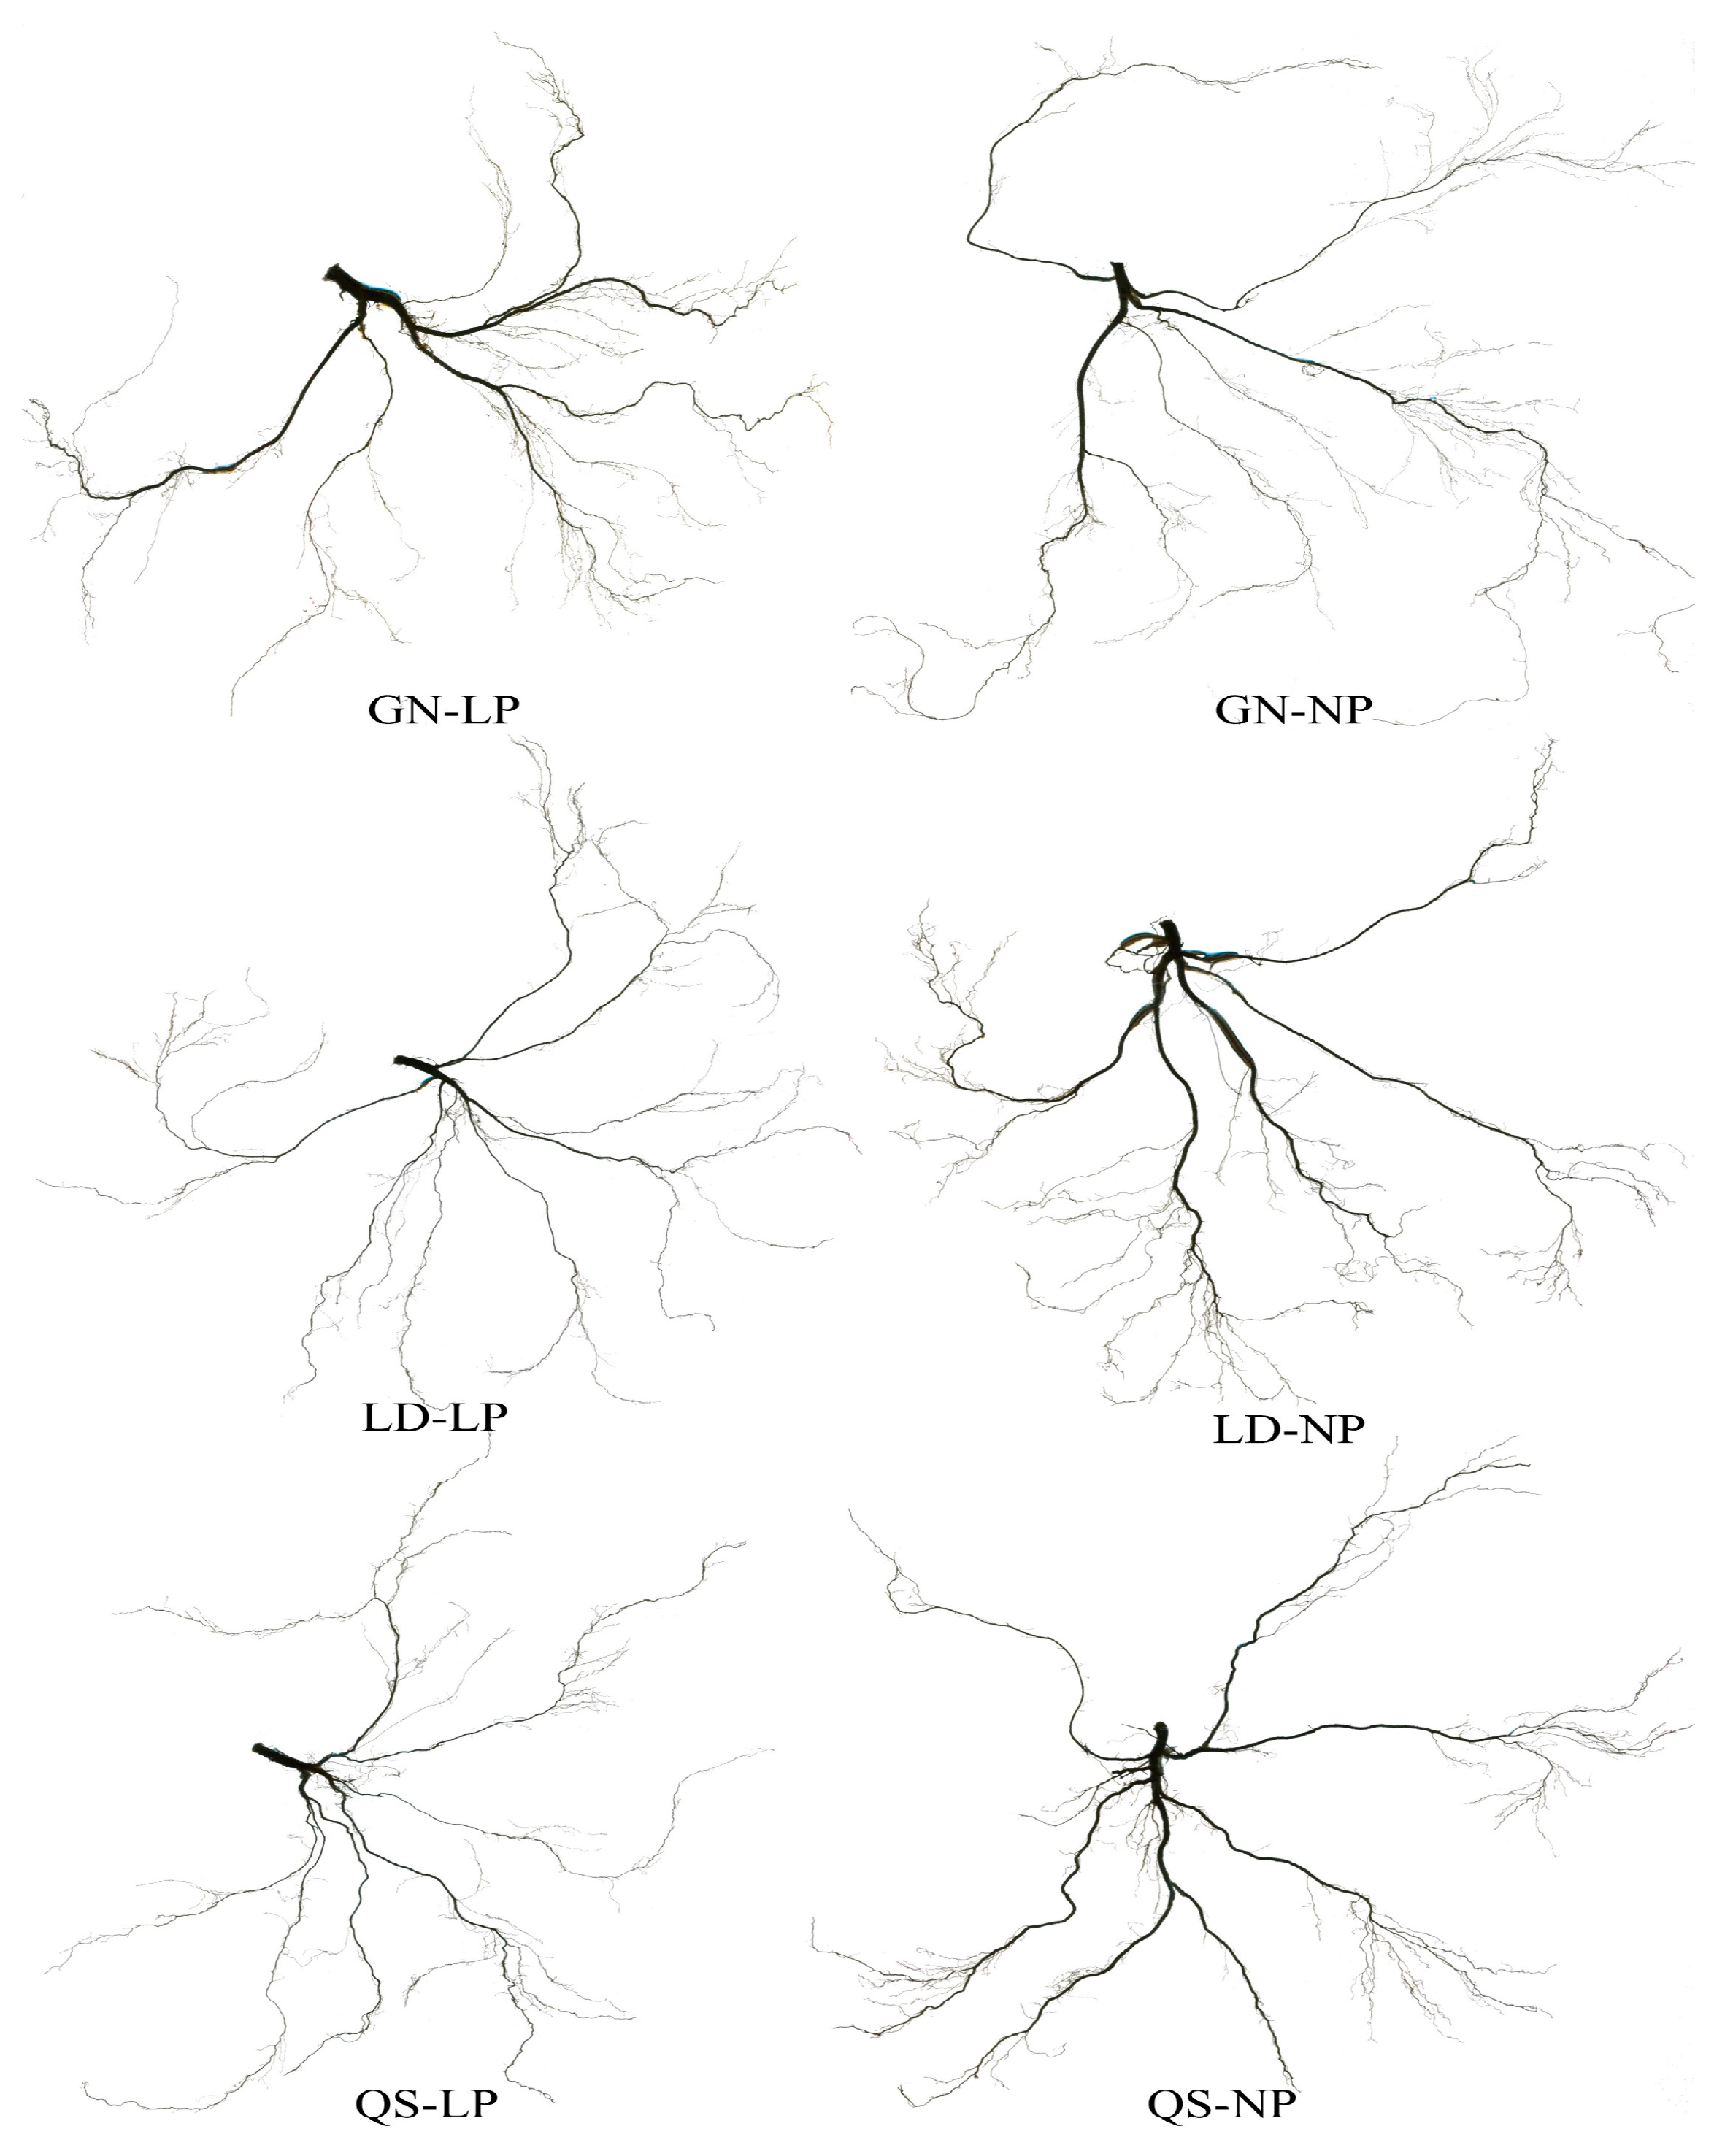
3.1. Effects of P Stress on the Growth of Different Root-Type Alfalfa

After 34 d of treatment, plant height, total volume, leaf length, leaf width, ground biomass, leaf area, and total surface area were reduced while total length, root biomass, and root/shoot ratio were increased when compared with their respective controls (Figure 1 and Figure 2; Table 1). Under LP stress, the plant height, total volume, leaf length, leaf width, ground biomass, leaf area, root biomass, and total surface area of GN were significantly higher than those of QS and LD.

3.2. Metabolomics Analysis

3.2.1. The Establishment of the Mass Spectrometry Analysis System

The correlation coefficients of the QC samples are all close to 1, indicating that the data quality was high (Figure 3A). The same metabolite exhibits different enrichment trends under stress treatments (Figure 3B). The PCA diagram (Figure 3C) shows that QC samples are clustered together, indicating minimal systematic error and excellent data repeatability throughout the entire experimental process. Thus, these data can be used for subsequent analysis. The contribution rates of PC1 and PC2 are 19.95% and 16.58%, respectively. PC1 effectively separates the QS and GN treatment groups from the control group, indicating significant differences in metabolic regulation under LP stress.

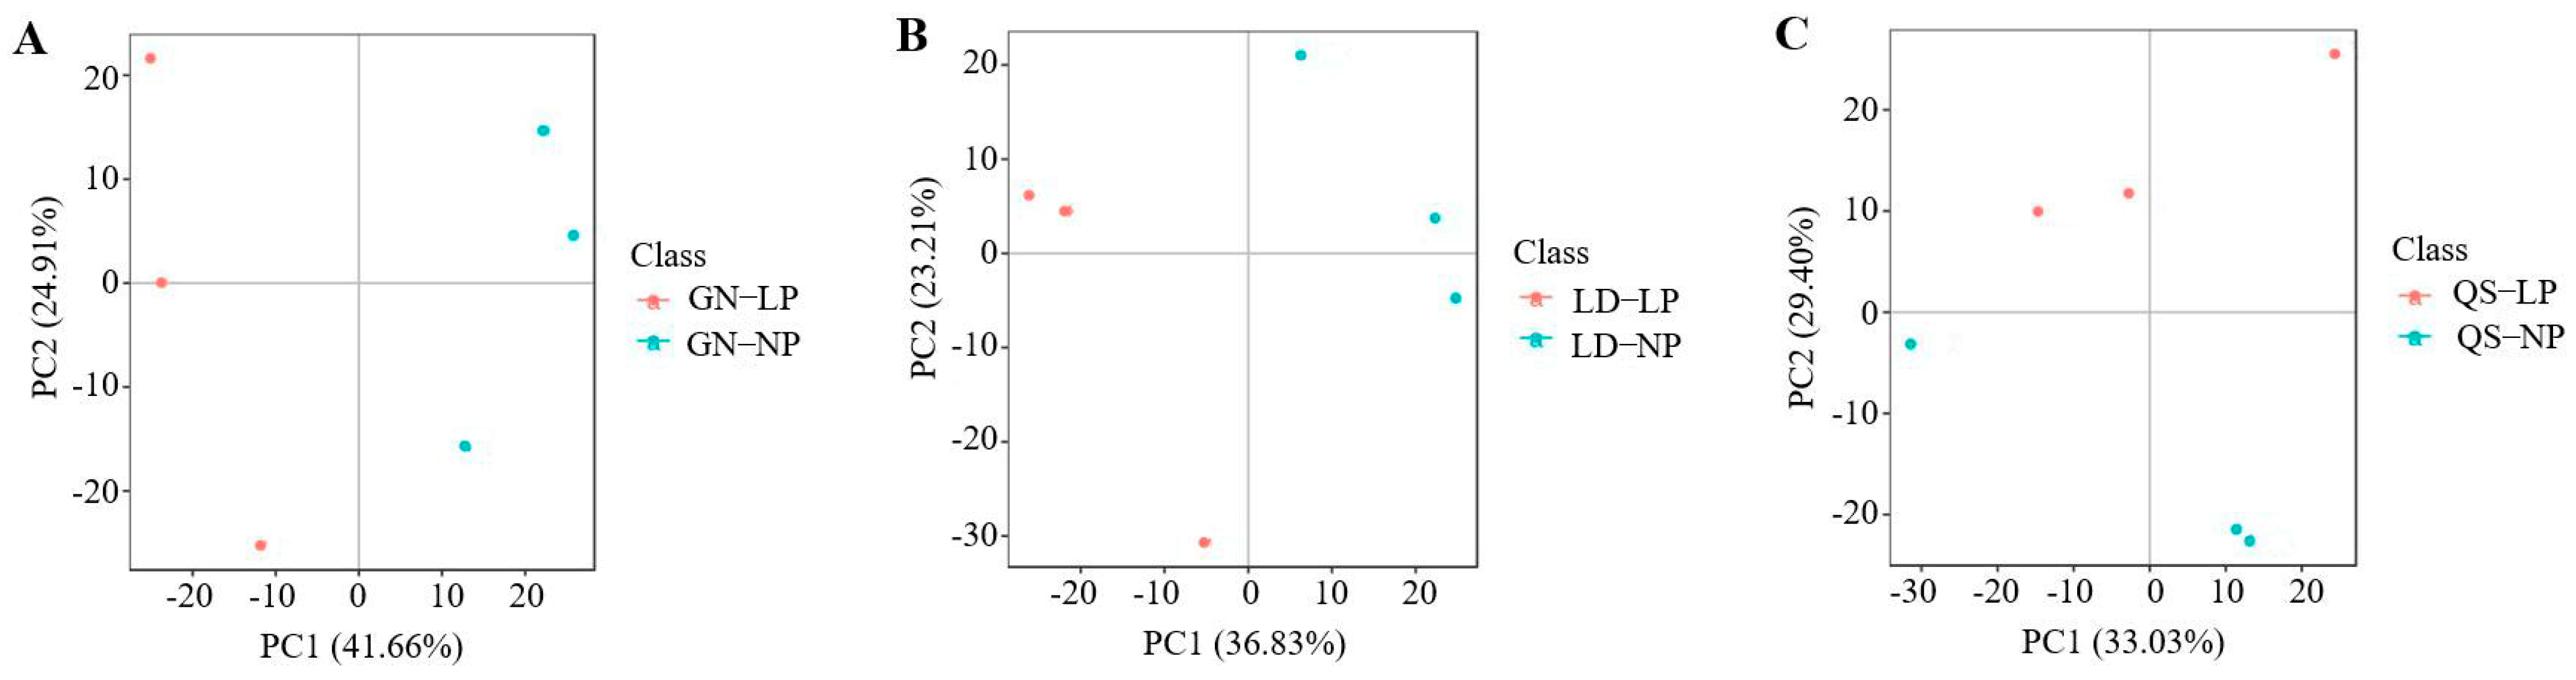
3.2.2. Principal Component Analysis

The samples between GN groups were significantly separated by PC1 (41.66%), and PC2 explained 24.91% of the total variables. Notably, PC1 successfully distinguished the metabolite profiles between the control and LP stress (Figure 4). PC1 and PC2 of LD in the PCA plot could account for 36.83% and 23.21% of the variation in metabolites, respectively. Similarly, in the PCA plot of QS, PC2 significantly isolated the metabolite profiles between the control and LP stress, and the contribution rate of PC2 was 29.40%. During the whole period of stress, the variation contribution rate of PC1 for GN was higher than that of PC1 for LD and QS, indicating that GN’s metabolic phenotype was more profoundly altered by LP stress.

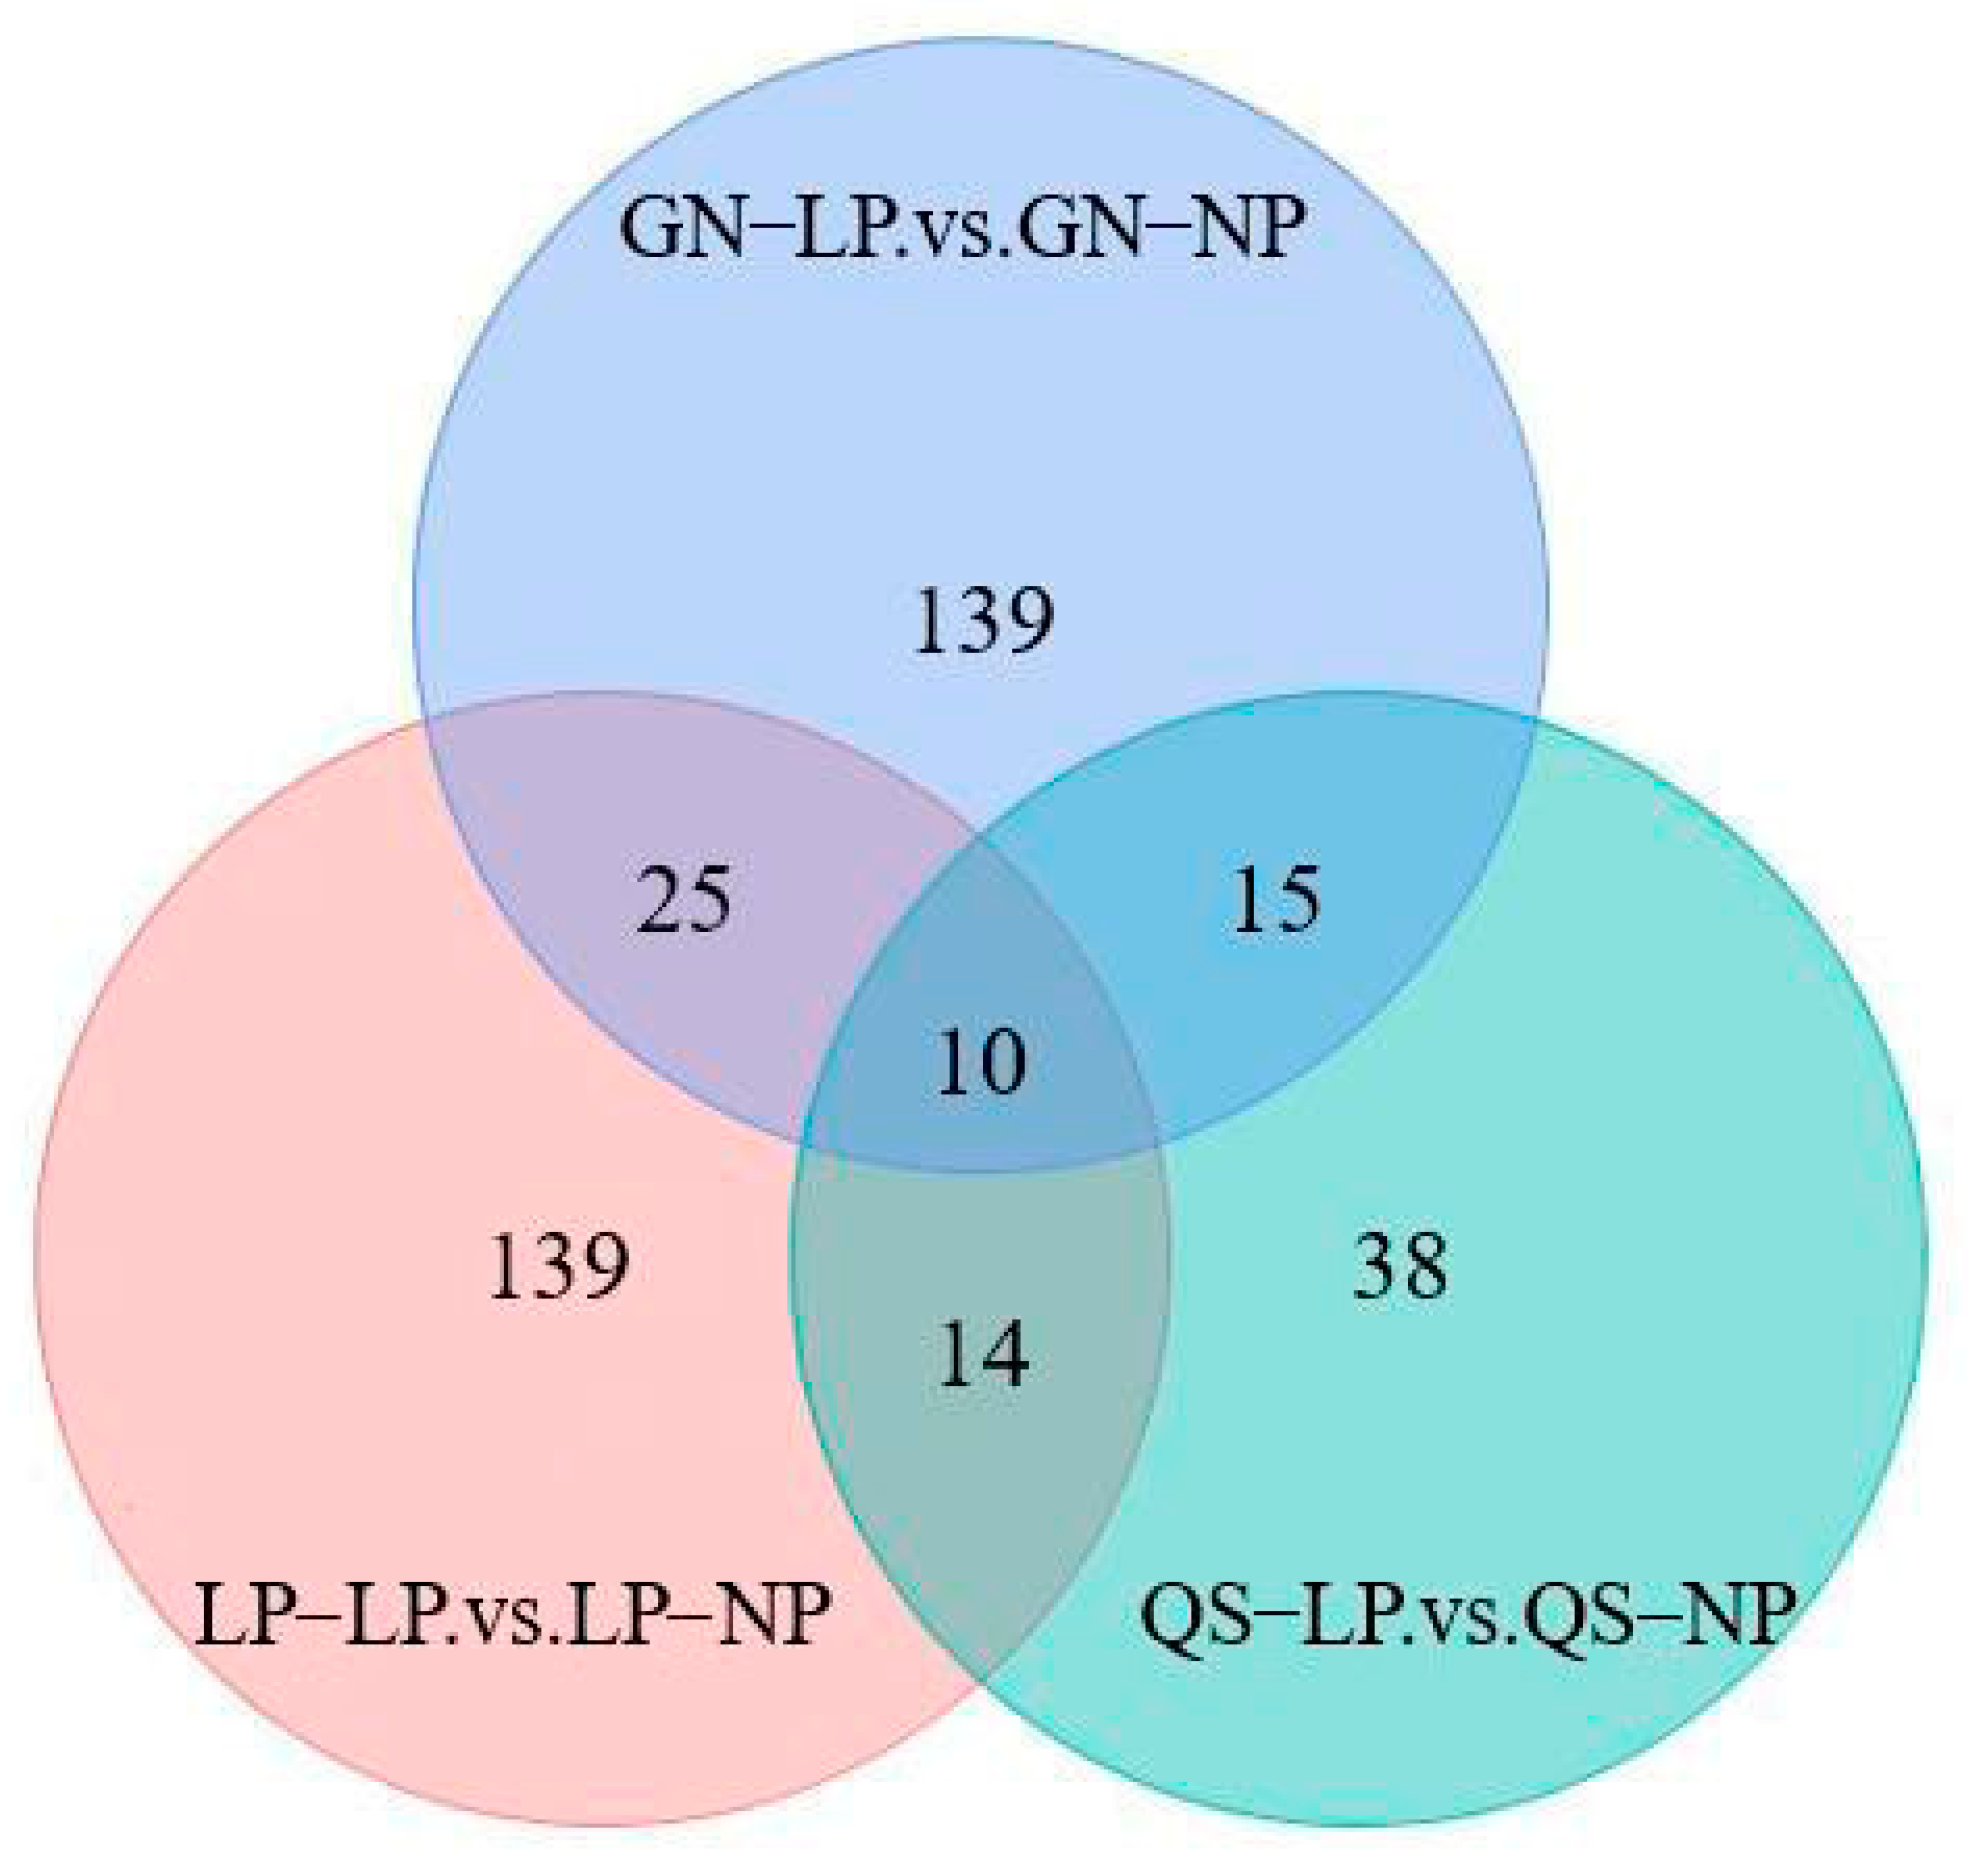
3.2.3. Differential Metabolite Screening

There were 189, 180, and 77 significantly different metabolites annotated in GN, LD, and QS, respectively (Figure 5 and Figure 6). Among them, the differential metabolites in GN and QS were predominantly up-regulated, accounting for 65.08 and 54.55%, respectively. The majority of differential metabolites in LD were mainly down-regulated, representing 59.44% of the total. The Venn diagram (Figure 7) illustrates that GN had the highest number of unique differential metabolites, with 139 species. Conversely, QS had the lowest number, with only 38 species. And only 10 different metabolites coexisted among the three root-type alfalfa.

3.2.4. Analysis of Differentially Metabolized Substances

The fold change (FC) plots of the GN, LD, and QS (Figure 8) reveal the metabolites that ranked in the top 20 (up-regulated plus down-regulated). The FC of GN up-regulation was all above 3.23, while those of the LD group were all over 2.79, and the QS group showed FC values over 1.88. Among the GN and QS groups, only two coexisting metabolites, Com_5124 and Com_314, were up-regulated under LP stress. Similarly, the LD and QS groups shared two coexisting metabolites, Com_11576 and Com_2376 which were down-regulated under LP stress.

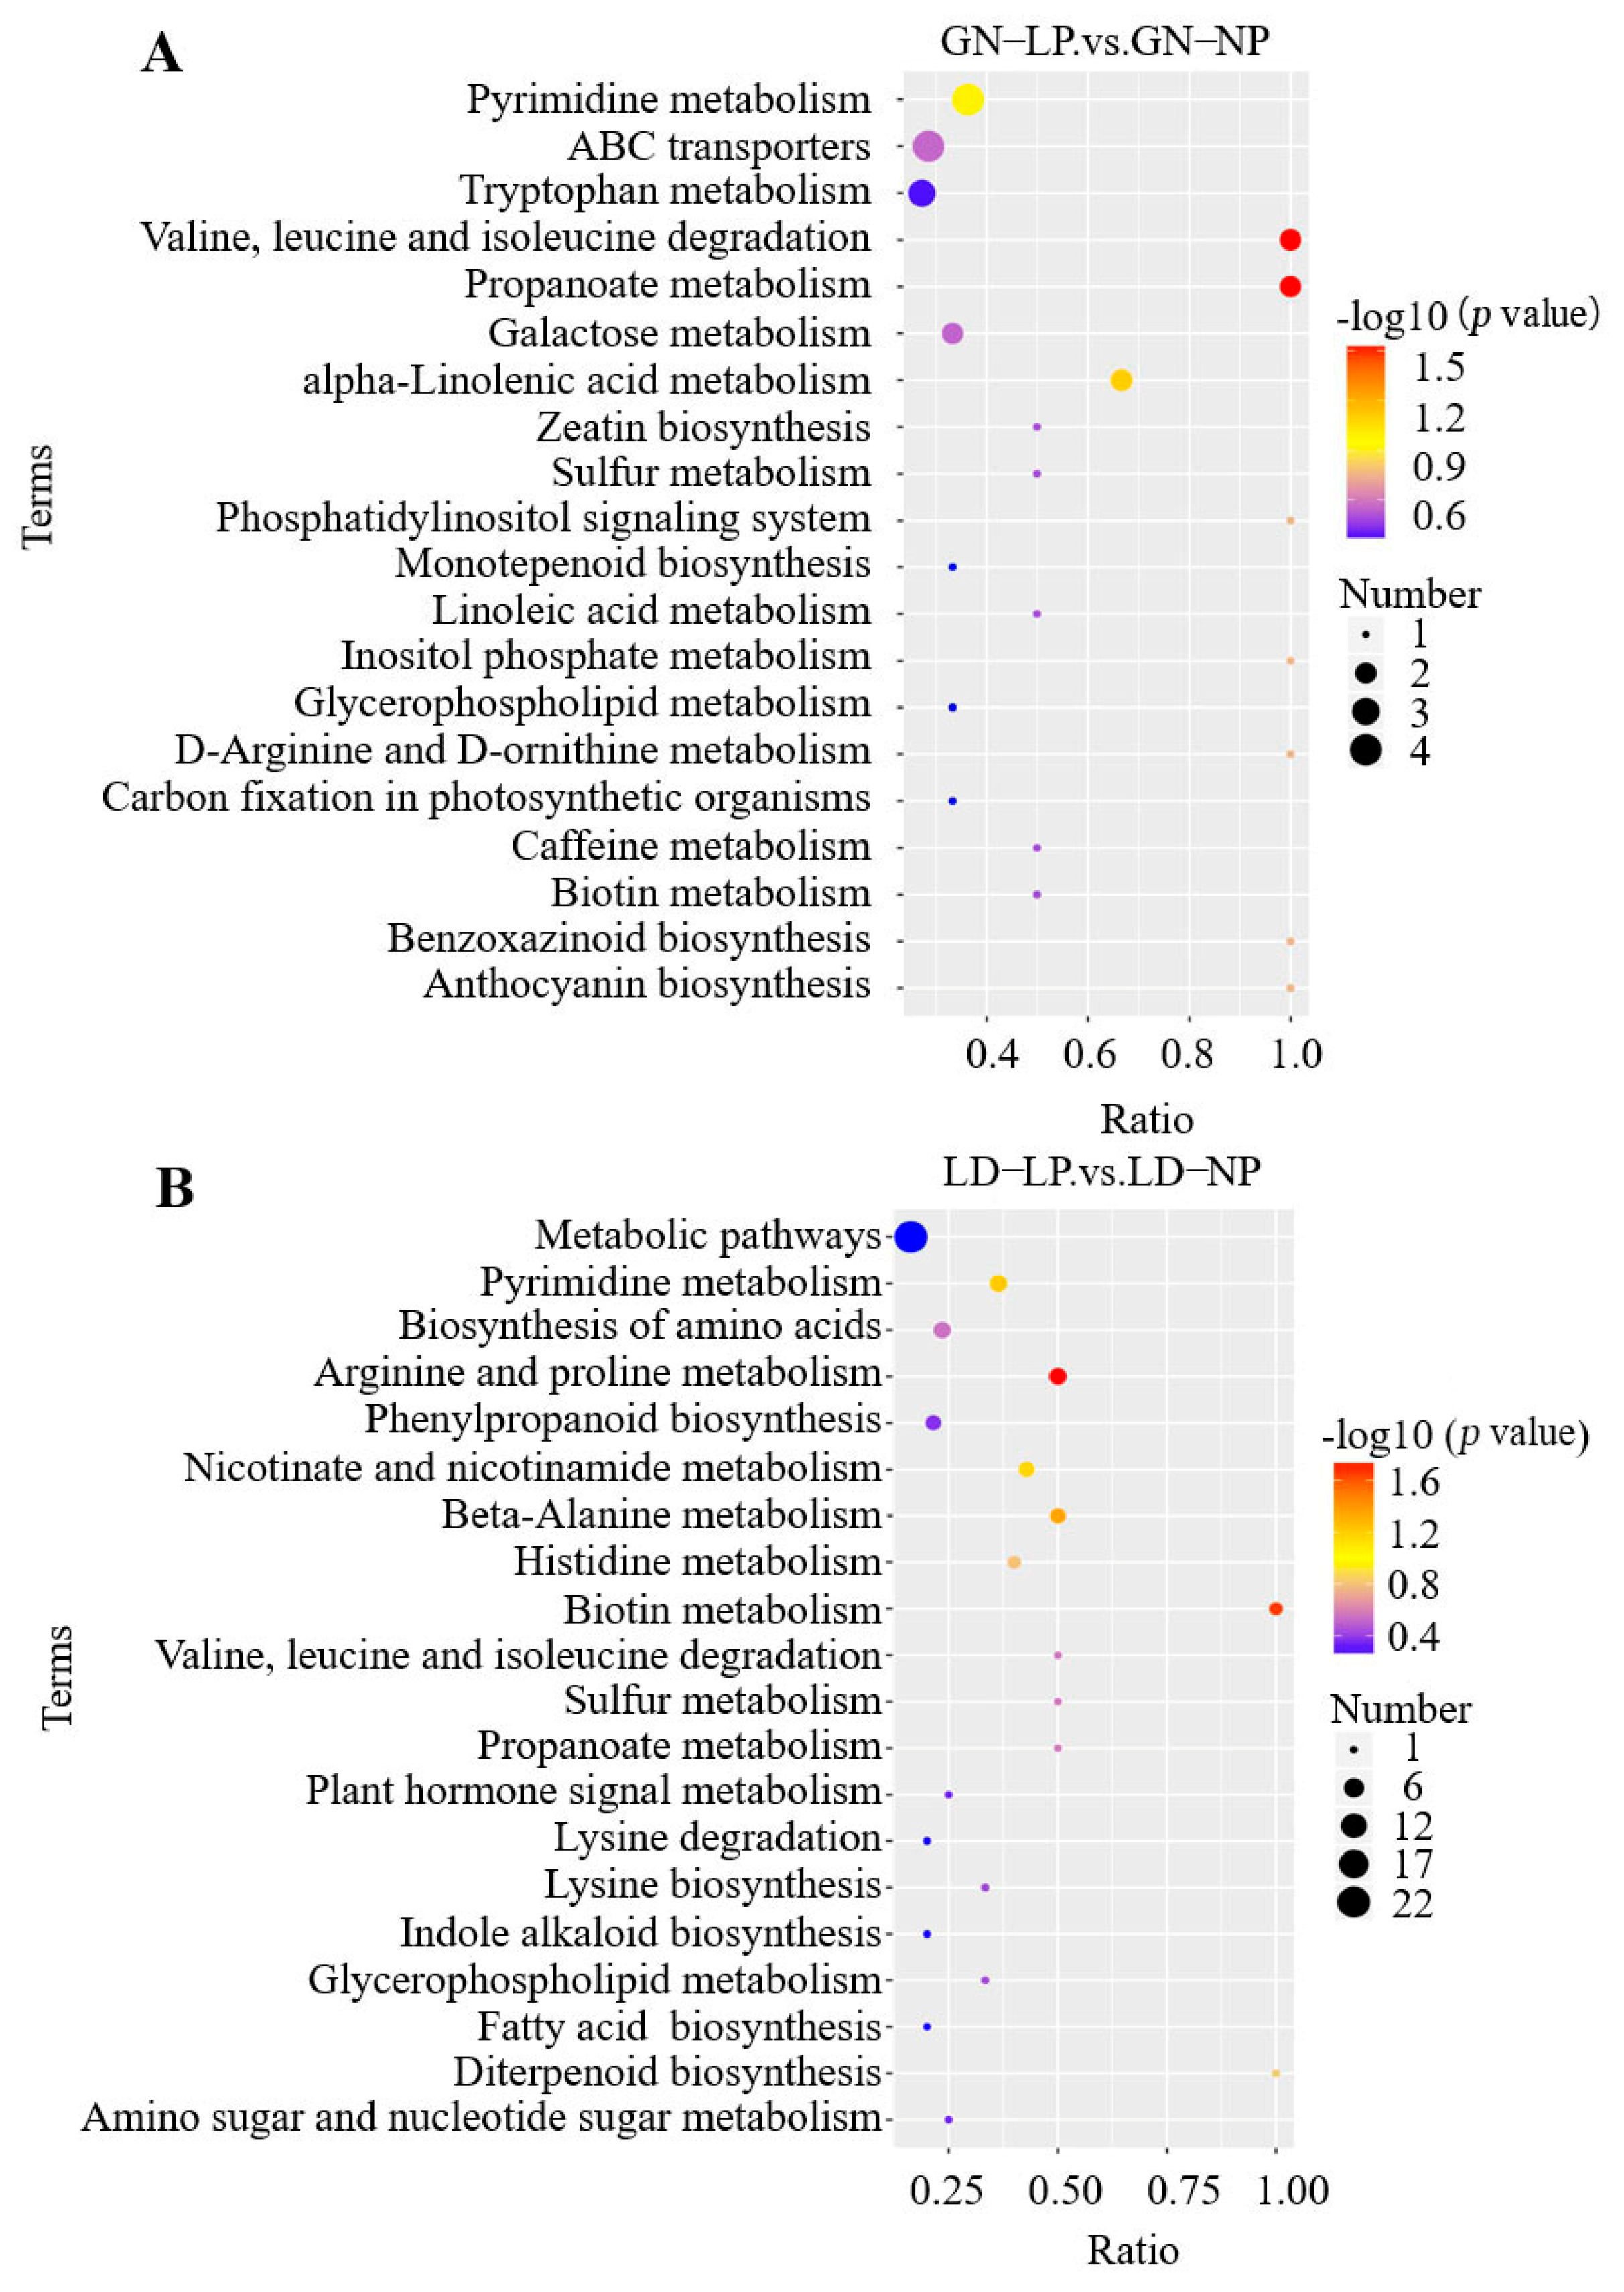
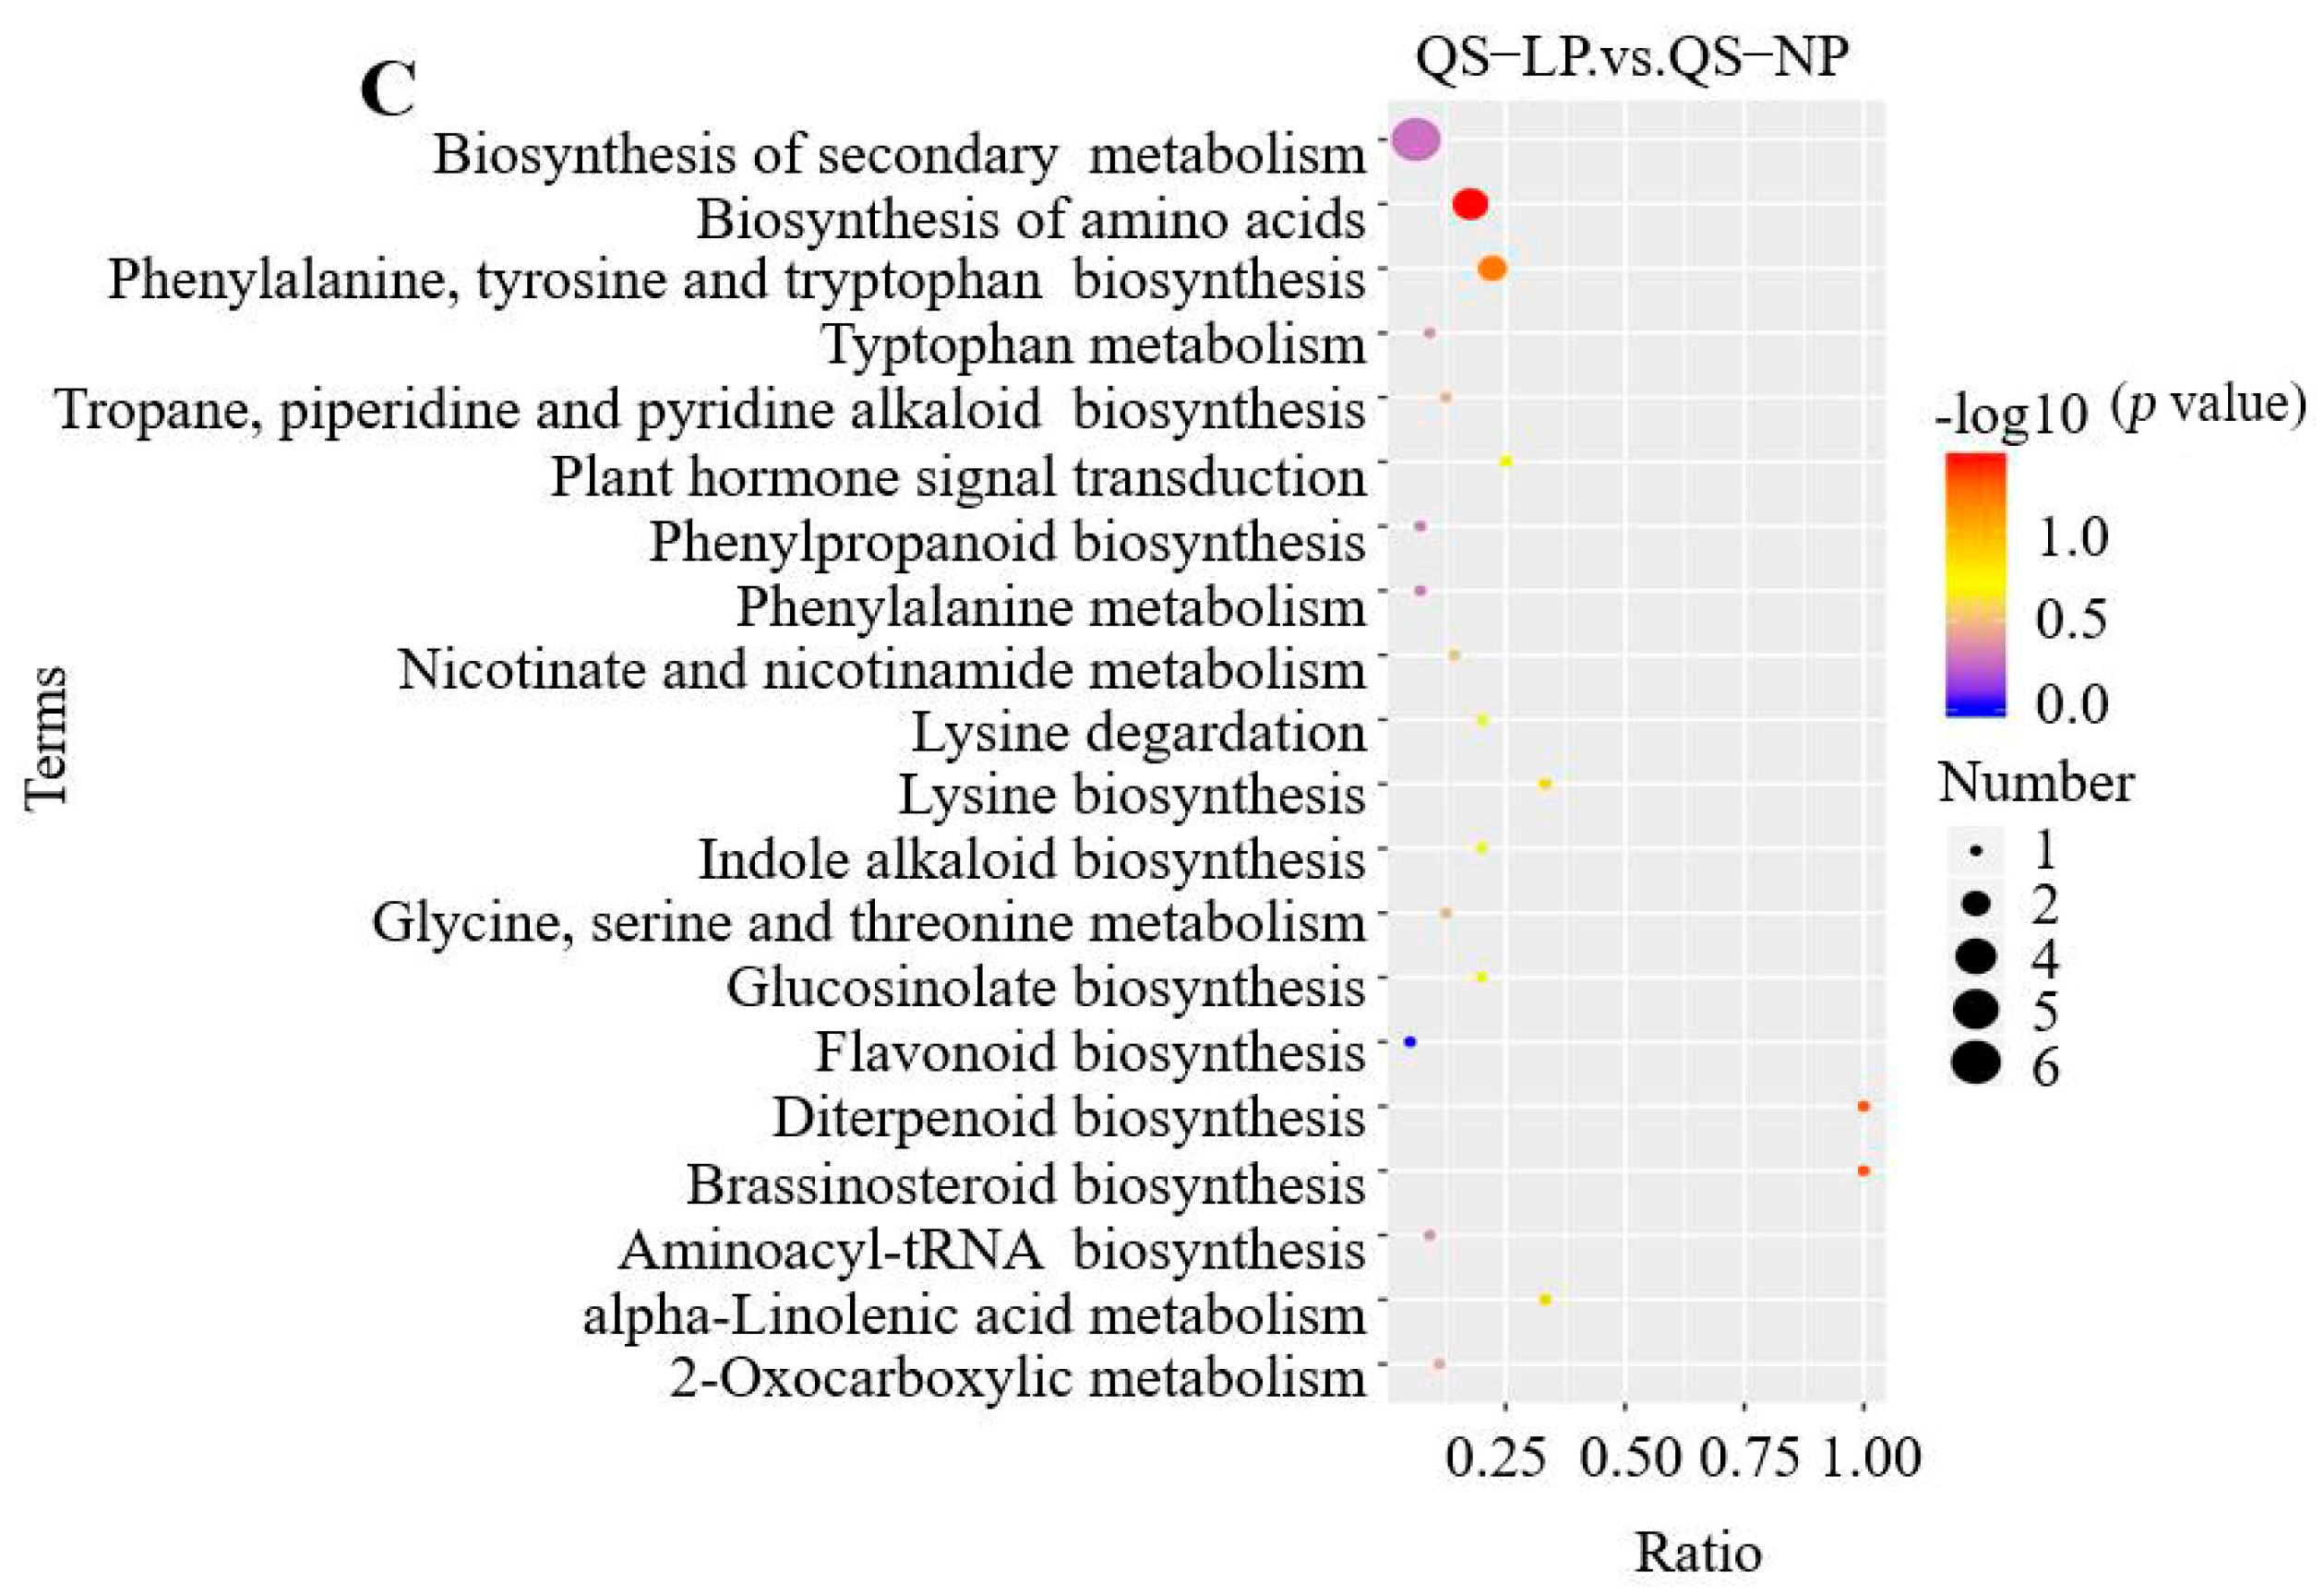
3.2.5. KEGG Pathway Enrichment Analysis

Through KEGG pathway enrichment analysis (Figure 9), a total of 33 metabolic pathways were annotated in GN, including 2 significantly different metabolic pathways (p < 0.05), which were propanoate metabolism, and valine, leucine and isoleucine degradation, and the metabolite of methylmalonic acid was significantly down-regulated in both pathways. A total of 26 metabolic pathways were annotated in the LD, including 3 significantly different metabolic pathways (p < 0.05), which were arginine and proline metabolism, biotin metabolism, and beta-alanine metabolism. Up-regulated differential metabolites (D-proline, L-histidine, biotin, desthiobiotin, malonic acid) and down-regulated differential metabolites (4-oxoproline, agmatine, 5-aminopentanoate, quinolinic acid) were dramatically enriched in these three pathways. A total of 20 metabolic pathways were annotated in QS, of which 3 were significantly enriched (p < 0.05), including biosynthesis of amino acids, diterpenoid biosynthesis, and brassinosteroid biosynthesis. Among the different metabolites involved in these three pathways, there were three down-regulated (L-saccharopine, shikimic acid, gibberellic acid) and two up-regulated (L-tryptophan, brassinolide). Four metabolic pathways coexisted in QS, LD, and GN, which were tryptophan metabolism, lysine biosynthesis, biosynthesis of amino acids, and plant hormone signal transduction. These differential metabolites significantly enriched in the KEGG pathway were summarized (Table 2). The main metabolites involved in these eight differential metabolic pathways were amino acids, organic acids, and plant growth regulators, indicating that these three types of different metabolites may be present in the tested alfalfa to resist LP stress.

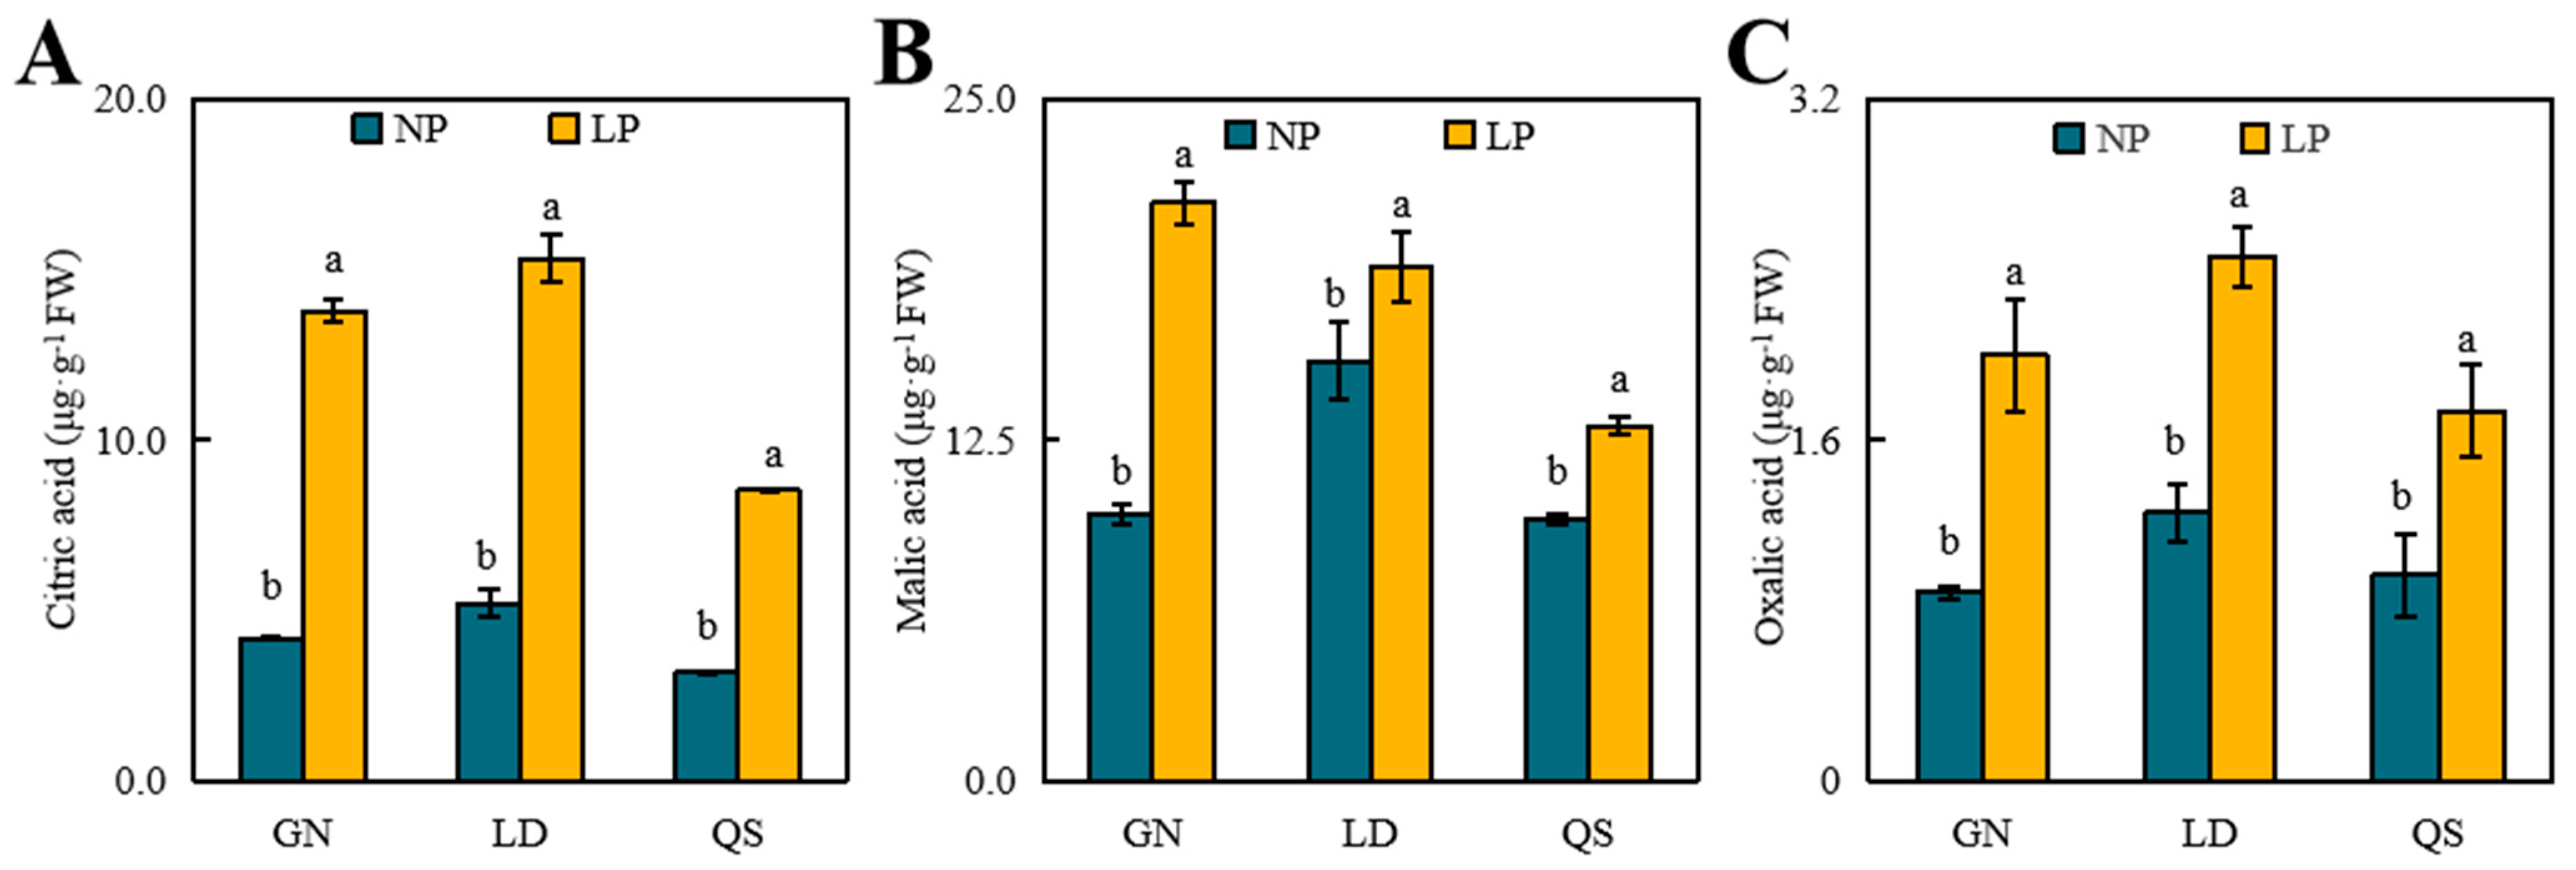
3.3. Effects of P Stress on Levels of Organic Acid Content

Under LP treatment, the levels of citric, malic, and oxalic acid significantly increased (Figure 10) by 230.7, 116.5, and 55.8% for GN, by 194.1, 22.3, and 48.9% for LD, and by 168.9, 36.0, and 44.5% for QS compared to their respective controls. The citric and oxalic acid levels in LD were substantially greater than those in GN and QS under LP stress.

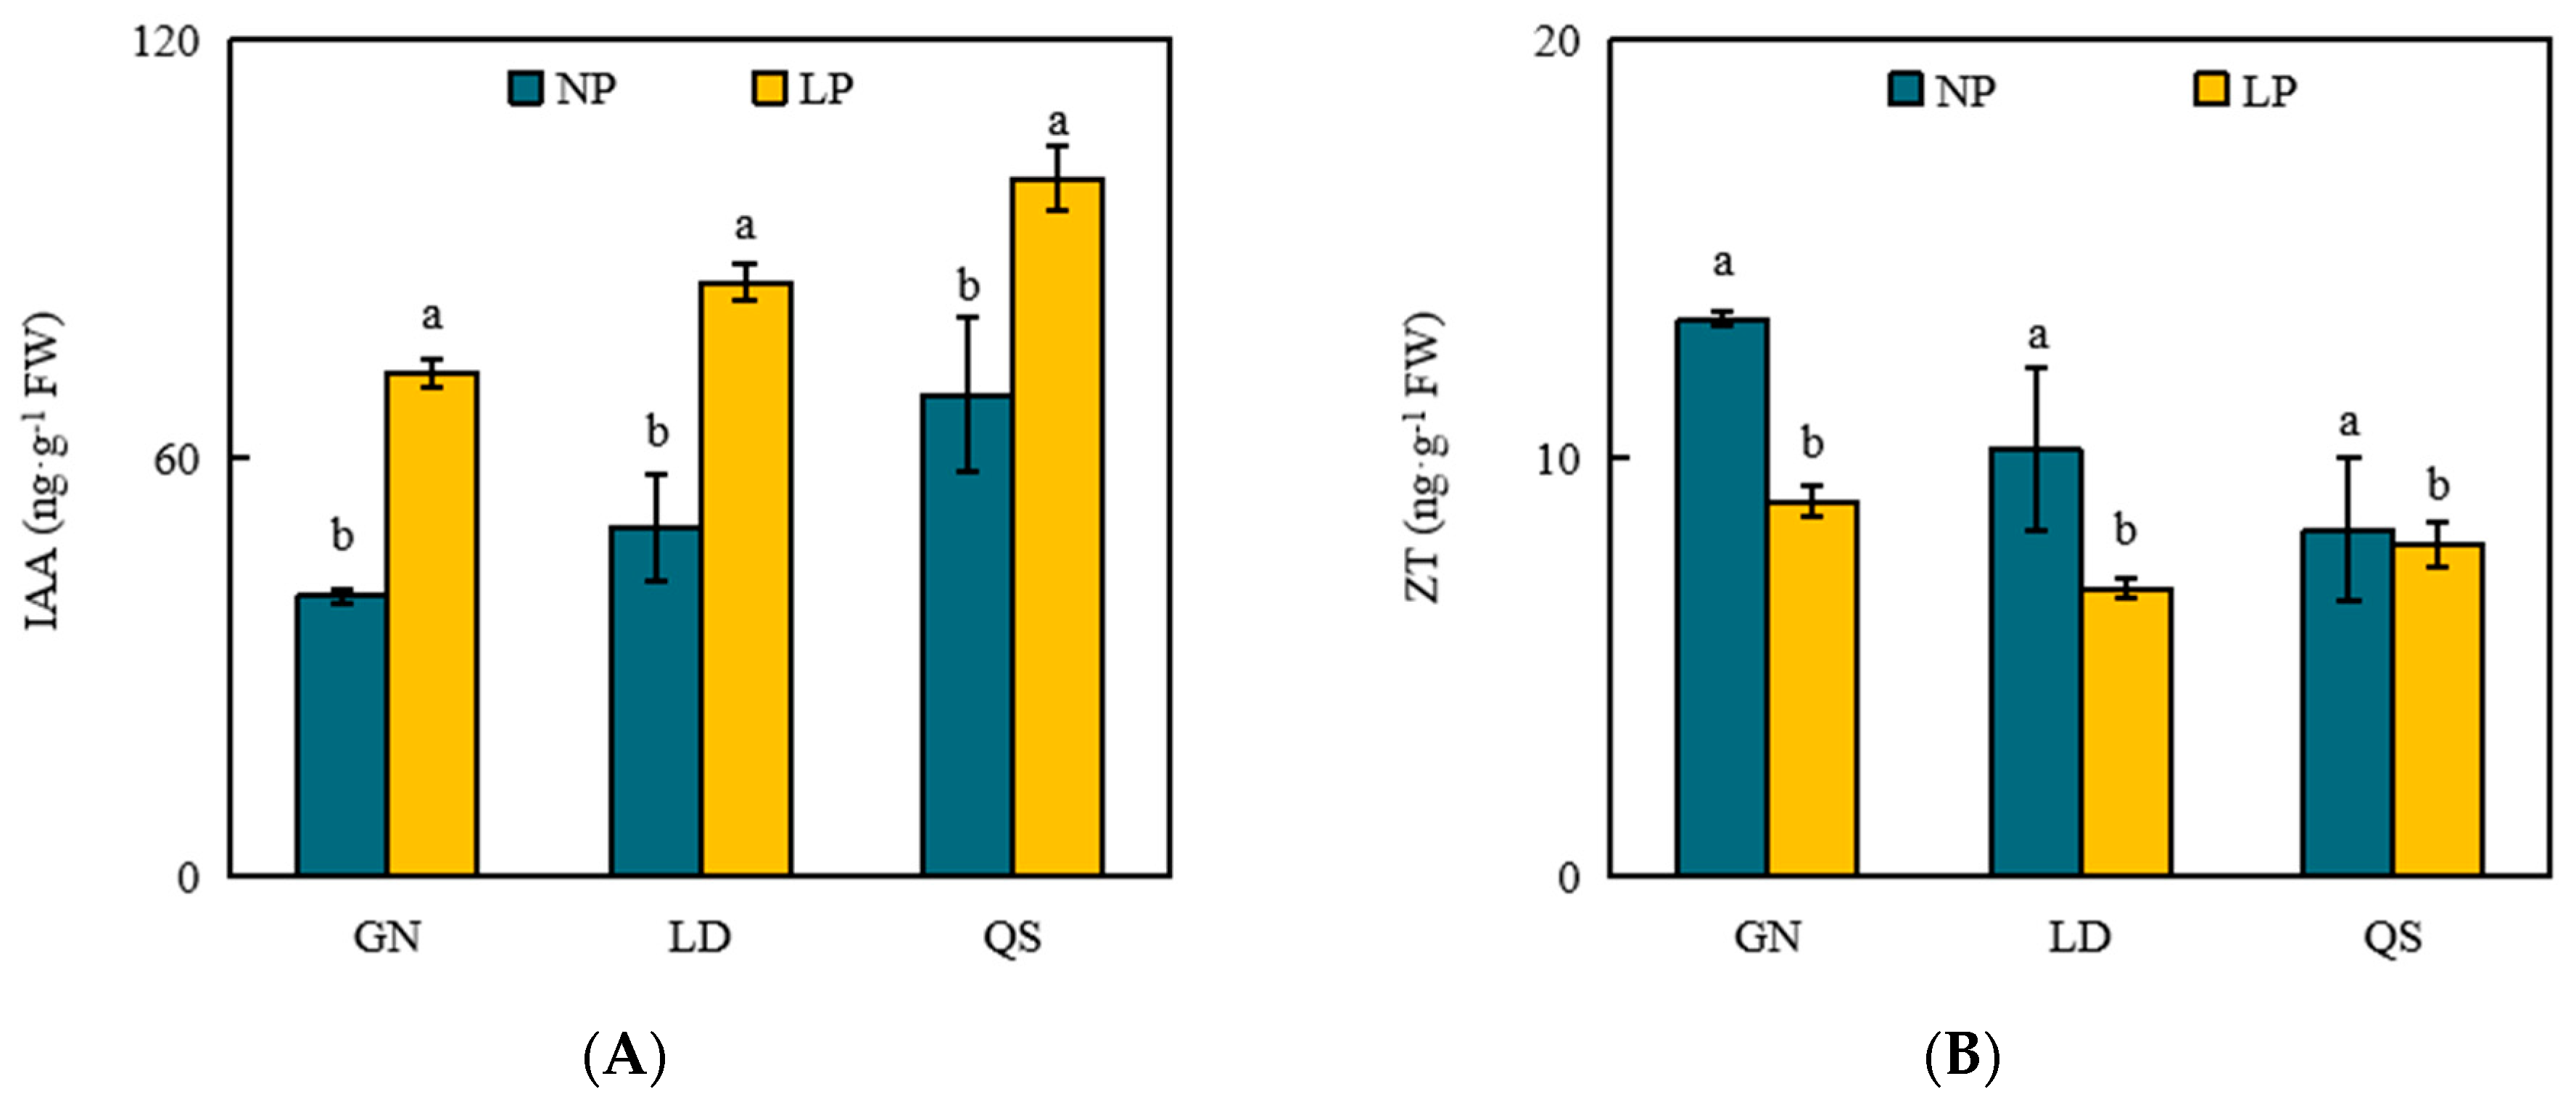
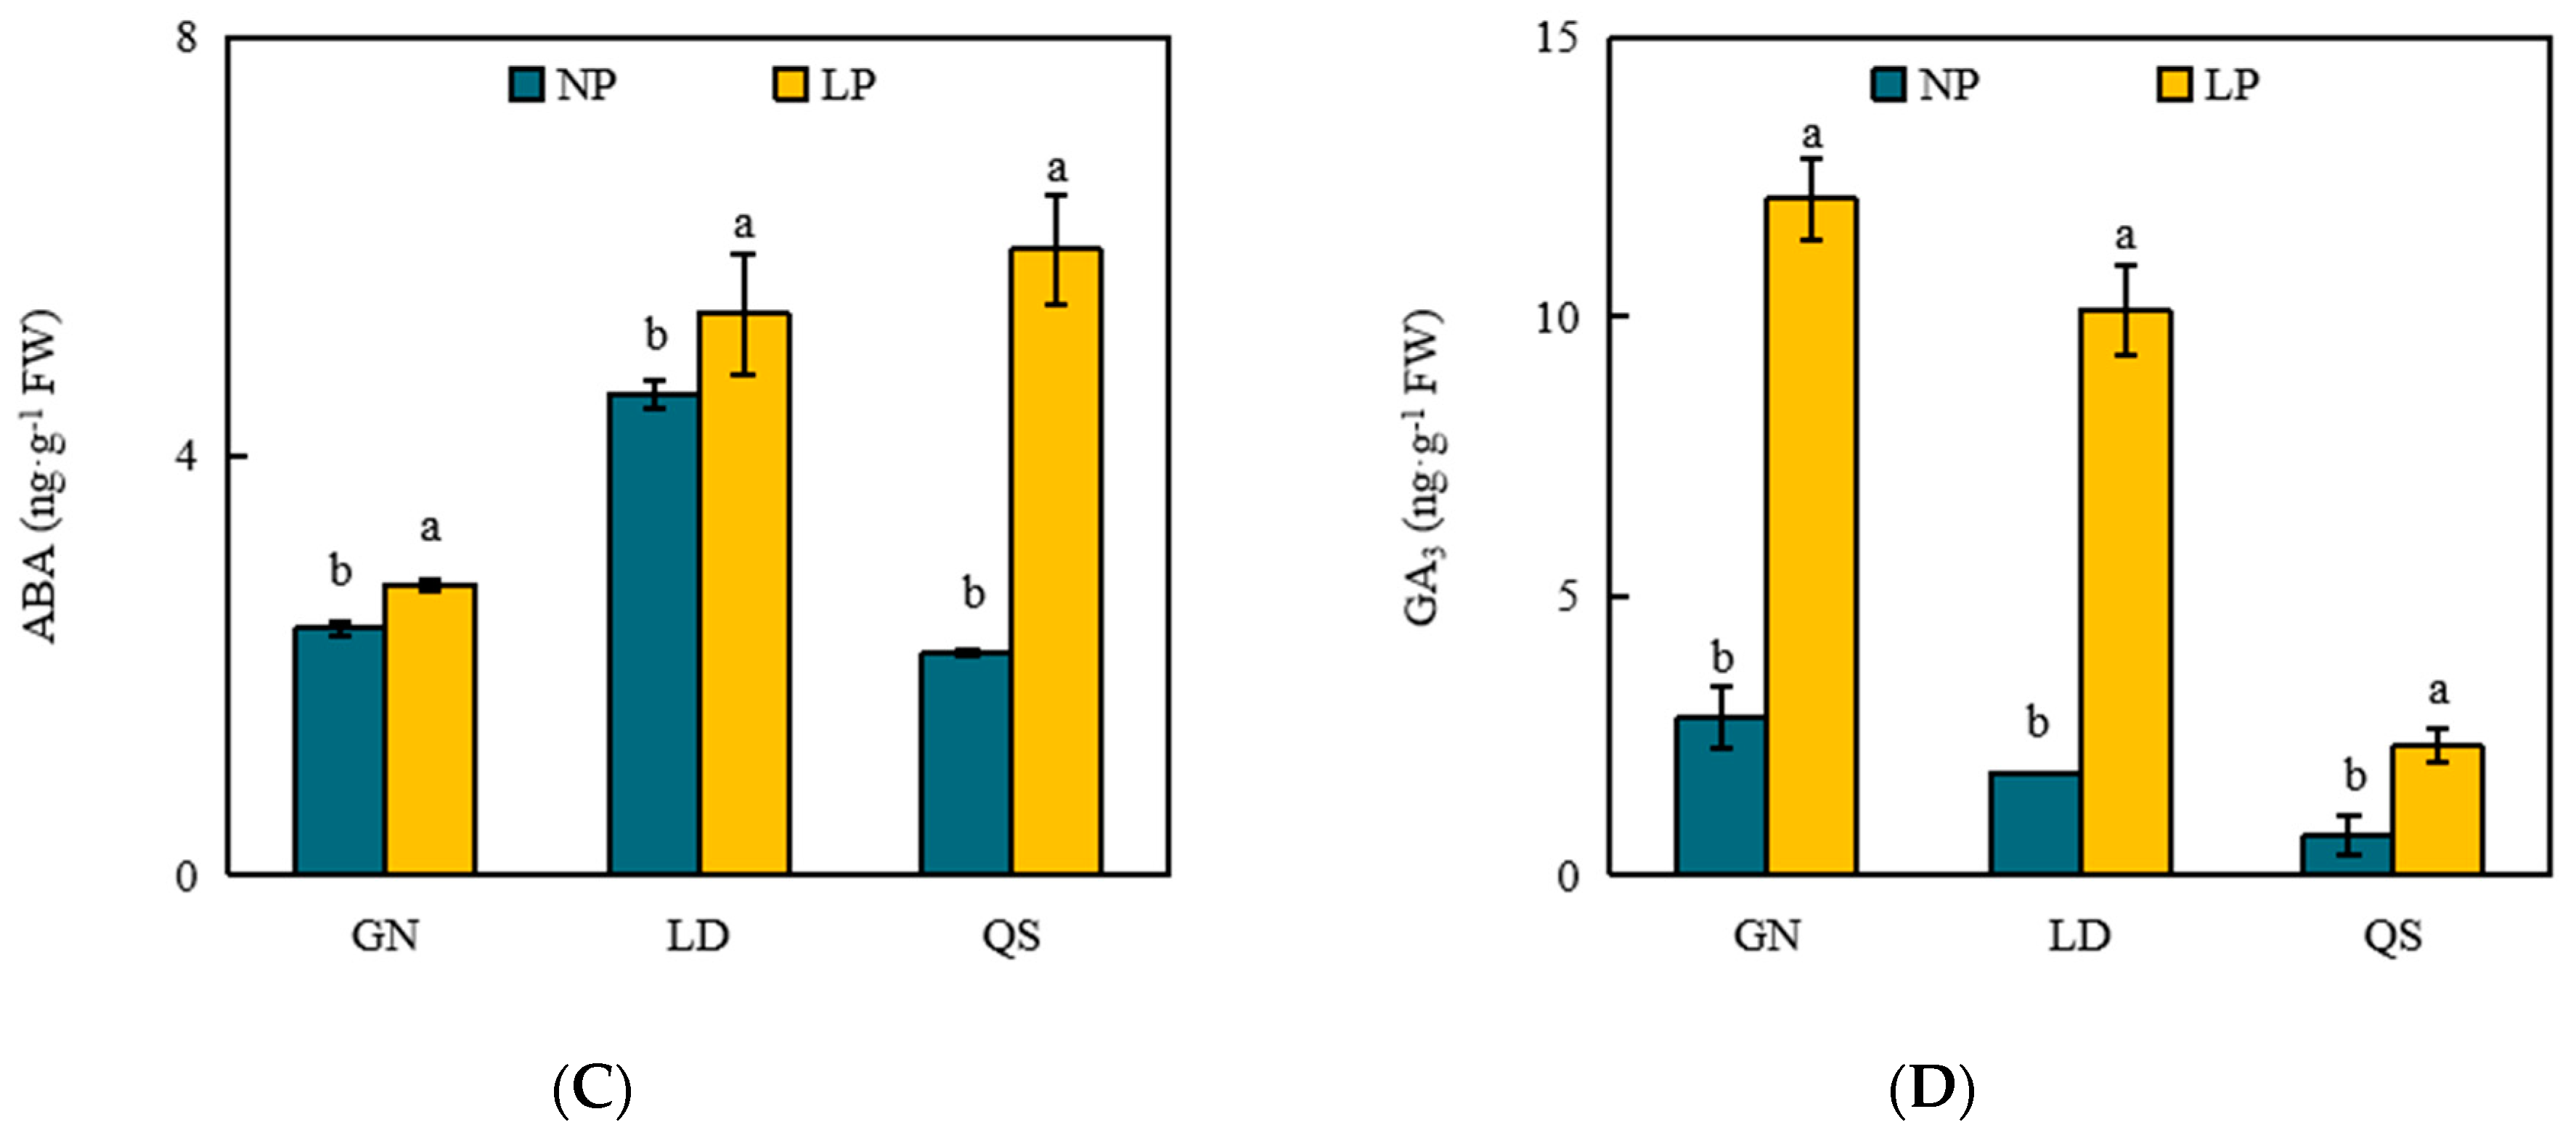
3.4. Effects of P Stress on Levels of Phytohormones

The concentrations of IAA, ABA, and GA3 drastically increased, while the concentration of ZT significantly decreased under LP stress (Figure 11). The IAA (79.3%) content of GN showed a significantly increased, while the IAA (44.7%) and GA3 (221.9%) contents of QS showed the lowest growth rate compared to their respective controls. ZT had the lowest decrease in QS (4.4%) and the largest decrease in GN (32.5%).

4. Discussion

4.1. Effects of LP Stress on the Growth of Different Root-Type Alfalfa

LP stress clearly inhibits plant growth [34]. For example, the ground biomass, plant height, leaf width, leaf length, and leaf area of three root-type alfalfa decreased in this study. LP availability modifies root morphology and architecture traits [35]. Similarly, we found that the induction of LP stress was related to a significant increase in total root length, root biomass, and root/shoot ratio, and the decrease in total root volume and total surface area of the three root-type alfalfa. However, the magnitude of these reductions or increases varies, indicating that different root-type alfalfa varieties have different tolerances to LP stress, which is consistent with the research results of Motte et al. [36].

4.2. Effects of LP Stress on Differential Metabolites in Roots

Amino acids, as osmotic regulators, are essential for maintaining the stability of biofilms in the process of plants responding to abiotic threats [37,38]. Plants can mitigate stress damage by utilizing various amino acid metabolites, which play a crucial role in enhancing their tolerance to LP conditions [22]. They achieve this by regulating the intracellular pH, adjusting the osmotic pressure, and producing antioxidants to counteract the harmful effects of abiotic stress [39]. In this research, LP stress led to the accumulation of various amino acids and their derivatives, which is consistent with the results of others [37], suggesting their essential role in maintaining protein structural integrity and intracellular osmotic regulation, thereby aiding the adaptation of alfalfa to LP stress.
Tryptophan is an indispensable amino acid that participates in a series of biosynthetic processes. It not only scavenges reactive oxygen species (ROS) but also serves as a precursor for various secondary metabolites like auxin, glycosides, terpenoids, and lignin structural units [40,41]. The level of tryptophan was significantly increased in the amino acid biosynthesis pathway under LP stress, indicating that different root-type alfalfa effectively alleviate the production of ROS under P stress by increasing tryptophan levels, thereby reducing the oxidative stress response and membrane lipid peroxidation of alfalfa and alleviating the oxidative damage caused by P stress on alfalfa. Proline is a small highly water-soluble molecule of organic matter; it is one of the most effective osmotic adjustment chemicals and is known as an anti-dehydration agent for plants [42]. The accumulation of proline not only evaluates the strength of plant stress resistance but also plays an important role in energy storage and free radical scavenging [43]. This study found that under LP conditions, the proline content in the metabolic pathways of arginine and proline significantly increased, indicating that the three root types of alfalfa maintain cellular osmotic balance by accumulating proline, thereby helping them alleviate and resist stress-induced damage. Similarly, Batista-Silva et al. believed that amino acid metabolism is closely related to plant stress resistance [44].

4.3. Effects of LP Stress on Organic Acids in Roots

Research has demonstrated the role of organic acid metabolism in controlling osmotic adjustment and maintaining ion balance in plants [45]. Organic acids could facilitate the release of soluble P through anion exchange or chelating metal ions, enhancing its absorption by plant roots; thereby, the increase in organic acid content is a universal adaptation mechanism of plants under LP conditions [46,47]. We also observed that P stress led to an increase in the levels of malic acid, citric acid, and oxalic acid, which chelated with metal ions, resulting in the release of soluble P. Consequently, plants can absorb soluble P released by organic acid dissolution to solve the problem of P deficiency in soil. Compared with LD and QS, GN contains higher levels of malic acid, citric acid, and oxalic acid, indicating that GN may have a stronger ability to release soluble P in the soil.

4.4. Effects of LP Stress on Phytohormones in Roots

Plants often adapt to nutrient-deficient environments by regulating root morphology, reducing photosynthetic rate, and adjusting biomass allocation through hormonal changes under adverse stress [48]. Research indicates that both low-nitrogen and LP stress can induce the synthesis of IAA in active parts of Arabidopsis thaliana, such as young leaves and shoot tips, and then transfer it to the roots through polar transport. Meanwhile, stress can also promote the synthesis of IAA in plant roots [49]. Our study found that LP stress increases IAA content, indicating that alfalfa regulates root architecture by accumulating IAA content, causing redistribution of dry matter within alfalfa, and transporting a large amount of assimilated IAA to the roots to meet lateral root development, thereby resisting LP stress. Jiang et al. found that GA3 may boost plant root growth by influencing the elongation of root cells [50]. This is also found in the results of this study. LP stress increased levels of GA3, which could be alfalfa’s self-defense mechanism against stress as high concentrations of GA3 can alleviate the negative influence of P deficiency on growth and development.
ABA affects the unloading of photosynthetic products and the conversion of stomata; furthermore, its concentration rapidly increases when plants experience drought, salinity, and low-temperature stress, which activates the plant’s stress resistance systems [51,52]. Our study observed that the ABA content increased with P deficiency, with the ZT content decreased in three root-type alfalfa. This suggests that alfalfa may resist LP stress by increasing their own ABA content, promoting leaf stomatal closure, reducing plant water loss, and enhancing photosynthetic carbon fixation.

5. Conclusions

LP stress influences plant growth, phytohormones, and organic acid levels of different root-type alfalfa. Under LP stress, the main differential metabolic pathways of GN, LD, and QS were propionic acid metabolism; valine, leucine, and isoleucine degradation; arginine and proline metabolism; biotin metabolism; amino acid biosynthesis; and diterpenoid biosynthesis. The main metabolites were amino acids, plant growth regulators, and organic acids. Plant height, total surface area, leaf length, leaf width, leaf area, total volume, ground biomass, and ZT level all decreased after 34 days of P stress treatment. On the contrary, the contents of malic, citric, oxalic acid, IAA, ABA, and GA3 all increased. Under LP stress, the plant height, leaf length, leaf width, leaf area, total surface area, total volume, ground biomass, and root biomass of GN were all higher than those of QS and LD. Compared with QS and LD, GN had the highest number of differential metabolites, and the malic acid, citric acid, oxalic acid, and IAA contents increased the most under the P condition, indicating that GN had more resistance than LD and QS under LP stress.

Author Contributions

L.N. planned and designed the research. J.X. wrote and revised the manuscript. K.W. and Y.Y. performed the statistical analysis. All authors have read and agreed to the published version of the manuscript.

Funding

This work was supported by the National Natural Science Foundation of China (No. 32160327) and the China Forage and Grass Research System (No. CARS-34).

Data Availability Statement

Data will be made available on request.

Conflicts of Interest

The authors declare no conflicts of interest.

References

  1. Nan, L.L.; Nie, Z.N.; Zollinger, R.; Guo, Q.E. Evaluation of morphological and production characteristics and nutritive value of 47 lucerne cultivars/lines in temperate Australia. Plant Prod. Sci. 2019, 22, 490–500. [Google Scholar] [CrossRef]
  2. Avijit, G.; Ranjan, D.B.; Ranjan, B.; Shrila, D. Rice residue promotes mobilisation and plant acquisition of soil phosphorus under wheat (Triticum aestivum)-rice (Oryza sativa) cropping sequence in a semi-arid Inceptisol. Sci. Rep. 2023, 13, 17545. [Google Scholar]
  3. Chao, Y.; Kang, J.; Sun, Y.; Yang, Q.; Wang, P.; Wu, M.; Li, Y.; Long, R.; Qin, Z. Molecular cloning and characterization of a novel gene encoding zinc finger protein from Medicago sativa L. Mol. Biol. Rep. 2009, 36, 2315–2321. [Google Scholar]
  4. Jia, X.; Wang, L.; Nussaume, L.; Yi, K. Cracking the code of plant central phosphate signaling. Trends Plant Sci. 2023, 28, 267–270. [Google Scholar]
  5. Zhu, J.; Li, M.; Whelan, M. Phosphorus activators contribute to legacy phosphorus availability in agricultural soils: A review. Sci. Total Environ. 2018, 612, 522–537. [Google Scholar] [CrossRef]
  6. Sulieman, S.; Tran, L.S.P. Phosphorus homeostasis in legume nodules as an adaptive strategy to phosphorus deficiency. Plant Sci. 2015, 239, 36–43. [Google Scholar]
  7. Lambers, H. Phosphorus acquisition and utilization in plants. Annu. Rev. Plant Biol. 2022, 73, 17–42. [Google Scholar]
  8. Priyam, A.; Das, R.K.; Schultz, A.; Singh, P.P. A new method for biological synthesis of agriculturally relevant nanohydroxyapatite with elucidated effects on soil bacteria. Sci. Rep. 2019, 9, 15083. [Google Scholar] [CrossRef]
  9. Dissanayaka, S.; Ghahremani, M.; Siebers, M.; Wasaki, J.; Plaxton, W.C. Recent insights into the metabolic adaptations of phosphorus deprived plants. J. Exp. Bot. 2020, 72, 199–223. [Google Scholar]
  10. Panchal, P.; Miller, A.J.; Giri, J. Organic acids: Versatile stress-response roles in plants. J. Exp. Bot. 2021, 72, 4038–4052. [Google Scholar] [CrossRef]
  11. Zhao, Y.Y.; Duan, X.; Zhang, J.C. Effects of different phosphorus supply levels on organic acid secretion in hydrilla verticillata roots in plateau wetland. Int. J. Agric. Biol. 2020, 23, 1033–1043. [Google Scholar]
  12. Wei, L.J.; Zhang, J.; Wei, S.H.; Hu, D.L.; Liu, Y.Y.; Feng, L.; Li, C.; Qi, N.; Wang, C.; Liao, W. Nitric oxide enhanced salt stress tolerance in tomato seedlings, involving phytohormone equilibrium and photosynthesis. Int. J. Mol. Sci. 2022, 23, 4539. [Google Scholar] [CrossRef]
  13. Wang, B.; Si, W.; Wu, Y.; Zhang, X.; Wang, S.; Wu, C.; Lin, H.; Yin, L. Research progress in biosynthesis and metabolism regulation of gibberellins in Gibberella fujikuroi. Sheng Wu Gong Cheng Xue Bao 2020, 36, 189–200. [Google Scholar]
  14. Márquez-López, R.E.; Quintana-Escobar, A.O.; Loyola-Vargas, V.M. Cytokinins, the cinderella of plant growth regulators. Phytochem. Rev. 2019, 18, 1387–1408. [Google Scholar] [CrossRef]
  15. Katam, R.; Lin, C.W.; Grant, K.; Katam, C.S.; Chen, S.X. Advances in plant metabolomics and its applications in stress and single-cell biology. Int. J. Mol. Sci. 2022, 23, 6985. [Google Scholar] [CrossRef]
  16. Li, Y.; Liu, S.; Zhang, D.; Liu, A.; Zhu, W.; Zhang, J.; Yang, B. Integrative omic analysis reveals the dynamic change in phenylpropanoid metabolism in Morus alba under different stress. Plants 2023, 12, 3265. [Google Scholar] [CrossRef]
  17. Guo, X.; Xin, Z.; Yang, T.; Ma, X.; Zhang, Y.; Wang, Z.; Ren, Y.; Lin, T. Metabolomics response for drought stress tolerance in Chinese wheat genotypes (Triticum aestivum). Plants 2020, 9, 520. [Google Scholar] [CrossRef]
  18. Cardoso, L.L.; Freire, F.B.S.; Daloso, D.M. Plant metabolic networks under stress: A multi-species/stress condition Meta-analysis. J. Soil Sci. Plant Nut. 2023, 23, 4–21. [Google Scholar] [CrossRef]
  19. Goufo, P.; Moutinho-Pereira, J.M.; Jorge, T.F.; Correia, C.M.; Oliveira, M.R.; Rosa, E.A.S.; António, C.; Trindade, H. Cowpea (Vigna unguiculata L. Walp.) metabolomics: Osmoprotection as a physiological strategy for drought stress resistance and improved yield. Front. Plant Sci. 2017, 8, 586. [Google Scholar] [CrossRef]
  20. Ye, T.T.; Shi, H.T.; Wang, Y.P.; Yang, F.; Chan, Z.L. Contrasting proteomic and metabolomic responses of bermudagrass to drought and salt stresses. Front. Plant Sci. 2016, 7, 1694. [Google Scholar] [CrossRef]
  21. Aranjuelo, I.; Molero, G.; Erice, G.; Avice, J.C.; Nogués, S. Plant physiology and proteomics reveals the leaf response to drought in alfalfa (Medicago sativa L.). J. Exp. Bot. 2011, 62, 111–123. [Google Scholar] [CrossRef]
  22. Liu, Y.; Hou, W.; Jin, J.; Christensen, M.J.; Gu, L.; Cheng, C.; Wang, J. Epichloëgansuensis increases the tolerance of Achnatherum inebrians to low-P stress by modulating amino acids metabolism and phosphorus utilization efficiency. J. Fungi 2021, 7, 390. [Google Scholar] [CrossRef]
  23. Wang, K.; Nan, L.L.; Guo, Q.E.; Yao, Y.H.; He, H.P.; Xia, J.; Ma, B. Effects of drought stress on root architecture of different root-type alfalfa. Acta Ecol. Sin. 2022, 42, 8365–8373. [Google Scholar]
  24. Nan, L.L.; Shi, S.L.; Zhang, J.H. Study on root system development ability of different root-type alfalfa. Acta Prataculturae Sin. 2014, 23, 117–124. [Google Scholar]
  25. Wang, K.; Nan, L.L.; Xia, J.; Wu, S.W.; Yang, L.L. Metabolomics reveal root differential metabolites of different root-type alfalfa under drought stress. Front. Plant Sci. 2024, 15, 1341826. [Google Scholar] [CrossRef]
  26. Nan, L.L.; Shi, S.L.; Chen, J.G.; Zhu, X.Q.; Guo, Q.E.; Zhao, W.H. Field evaluation of the response and resistance to low temperature of alfalfa root with different root types during over-wintering. Chin. J. Eco-Agric. 2011, 19, 619–625. [Google Scholar] [CrossRef]
  27. Nan, L.L.; Shi, S.L.; Guo, Q.E.; Tian, F.; Fan, J.J. Analysis of dynamic variations in crown characteristics of different root-type alfalfa plants. Chin. J. Eco-Agric. 2012, 20, 914–920. [Google Scholar] [CrossRef]
  28. Wang, K.; Nan, L.L.; Guo, Q.E. Changes in root endogenous hormone levels and rhizosphere fungi diversity in alfalfa under drought stress. Plant Growth Regul. 2023, 10, 874–894. [Google Scholar] [CrossRef]
  29. Hoagland, D.R.; Arnon, D.I. The water-culture method for growing plants without soil. Open Access Libr. J. 1950, 347, 32. [Google Scholar]
  30. Al-Amri, S.M. Response of growth, essential oil composition, endogenous hormones and microbial activity of Mentha piperita to some organic and biofertilizers agents. Saudi J. Biol. Sci. 2021, 28, 5435–5441. [Google Scholar] [CrossRef]
  31. Zhang, Y.Z.; Li, P.M.; Cheng, L.L. Developmental changes of carbohydrates, organic acids, amino acids, and phenolic compounds in ‘Honeycrisp’ apple flesh. Food Chem. 2010, 123, 1013–1018. [Google Scholar] [CrossRef]
  32. Want, E.J.; Masson, P.; Michopoulos, F.; Wilson, I.D.; Theodoridis, G.; Plumb, R.S.; Shockcor, J.; Loftus, N.; Holmes, E.; Nicholson, J.K. Global metabolic profiling of animal and human tissues via UPLC-MS. Nat. Protoc. 2013, 8, 17–32. [Google Scholar] [CrossRef]
  33. Wen, B.; Mei, Z.L.; Zeng, C.W.; Liu, S.Q. metaX: A flexible and comprehensive software for processing metabolomics data. BMC Bioinform. 2017, 18, 183. [Google Scholar] [CrossRef]
  34. Hermans, C.; Hammond, J.P.; White, P.J.; Verbruggen, N. How do plants respond to nutrient shortage by biomass allocation? Trends Plant Sci. 2006, 11, 610–617. [Google Scholar] [CrossRef]
  35. Dissanayaka, D.M.S.B.; Maruyama, H.; Nishida, S.; Tawaraya, K.; Wasaki, J. Landrace of japonica rice, Akamai exhibits enhanced root growth and efficient leaf phosphorus remobilization in response to limited phosphorus availability. Plant Soil. 2017, 414, 327–338. [Google Scholar] [CrossRef]
  36. Motte, H.; Vanneste, S.; Beeckman, T. Molecular and environmental regulation of root development. Annu. Rev. Plant Biol. 2019, 70, 465–488. [Google Scholar] [CrossRef]
  37. Li, M.; Zhou, J.; Liu, Q.; Mao, L.; Li, H.; Li, S.; Guo, R. Dynamic variation of nutrient absorption, metabolomic and transcriptomic indexes of soybean (Glycine max) seedlings under phosphorus deficiency. AoB Plants 2023, 15, plad014. [Google Scholar] [CrossRef]
  38. Ingrisano, R.; Tosato, E.; Trost, P.; Gurrieri, L.; Sparla, F. Proline, cysteine and branched-chain amino acids in abiotic stress response of land plants and microalgae. Plants 2023, 12, 3410. [Google Scholar] [CrossRef]
  39. Widodo, J.H.P.; Newbigin, E.; Tester, M.; Bacic, A.; Roessner, U. Metabolic responses to salt stress of barley (Hordeum vulgare L.) cultivars, sahara and clipper which differ in salinity tolerance. J. Exp. Bot. 2009, 60, 4089–4103. [Google Scholar] [CrossRef]
  40. Zemanová, V.; Pavlík, M.; Pavlíková, D.; Tlustoš, P. The significance of methionine, histidine and tryptophannbsp in plant responses and adaptation to cadmium stress. Plant Soil Environ. 2014, 60, 426–432. [Google Scholar] [CrossRef]
  41. Ge, C.R.; Georgiev, A.; Öhman, A.; Wieslander, A.; Kelly, A.A. Tryptophan residues promote membrane association for a plant lipid glycosyl transferase involved in phosphate stress. J. Biol. Chem. 2011, 286, 6669–6684. [Google Scholar] [CrossRef] [PubMed]
  42. Li, C.; Feng, Y.; Tian, P.; Yu, X. Mathematical estimation of endogenous proline as a bioindicator to regulate the stress of trivalent chromium on rice plants grown in different nitrogenous conditions. Toxics 2023, 11, 803. [Google Scholar] [CrossRef] [PubMed]
  43. Forlani, G.; Bertazzini, M.; Cagnano, G. Stress-driven increase in proline levels, and not proline levels themselves, correlates with the ability to withstand excess salt in a group of 17 Italian rice genotypes. Plant Biol. 2018, 21, 336–342. [Google Scholar] [CrossRef] [PubMed]
  44. Batista-Silva, W.; Heinemann, B.; Rugen, N.; Nunes-Nesi, A.; Araújo, W.L.; Braun, H.P.; Hildebrandt, T.M. The role of amino acid metabolism during abiotic stress release. Plant Cell Environ. 2019, 42, 1630–1644. [Google Scholar] [CrossRef]
  45. Zhang, Y.; Chen, H.; Liang, Y.; Lu, T.; Liu, Z.; Jin, X.; Hou, L.; Xu, J.; Zhao, H.; Shi, Y.; et al. Comparative transcriptomic and metabolomic analyses reveal the protective effects of silicon against low phosphorus stress in tomato plants. Plant Physiol. Bioch. 2021, 166, 78–87. [Google Scholar] [CrossRef]
  46. Wang, Y.L.; Lysoe, E.; Armarego-Marriott, T.; Erban, A.; Paruch, L.; Van Eerde, A.; Bock, R.; Liu-Clarke, J. Transcriptome and metabolome analyses provide insights into root and root-released organic anion responses to phosphorus deficiency in oat. J. Exp. Bot. 2018, 69, 3759–3771. [Google Scholar] [CrossRef]
  47. Sebastian, A.; Prasad, M.N.V. Exogenous citrate and malate alleviate cadmium stress in Oryza sativa L.: Probing role of cadmium localization and iron nutrition. Ecotoxicol. Environ. Saf. 2018, 166, 215–222. [Google Scholar] [CrossRef]
  48. Wen, T.; Dong, L.J.; Wang, L.; Ma, F.W.; Zou, Y.J.; Li, C.Y. Changes in root architecture and endogenous hormone levels in two rootstocks under alkali stress. Sci. Hortic. 2018, 235, 198–204. [Google Scholar] [CrossRef]
  49. Nacry, P.; Canivenc, G.; Muller, B.; Azmi, A.; Van, O.H.; Rossignol, M.; Doumas, P. A role for auxin redistribution in the responses of the root system architecture to phosphate starvation in Arabidopsis. Plant Physiol. 2005, 138, 2061–2074. [Google Scholar] [CrossRef]
  50. Jiang, C.F.; Gao, X.H.; Liao, L.L.; Nicholas, P.H.; Fu, X.D. Phosphate starvation root architecture and anthocyanin accumulation responses are modulated by the gibberellin-DELLA signaling pathway in Arabidopsis. Plant Physiol. 2007, 145, 1460–1470. [Google Scholar] [CrossRef]
  51. Chen, K.; Li, G.J.; Bressan, R.A.; Song, C.P.; Zhu, J.K.; Zhao, Y. Abscisic acid dynamics, signaling, and functions in plants. J. Integr. Plant Biol. 2020, 62, 25–54. [Google Scholar] [CrossRef] [PubMed]
  52. Miao, R.; Siao, W.; Zhang, N.; Lei, Z.; Lin, D.; Bhalerao, R.P.; Lu, C.; Xu, W. Katanin-dependent microtubule ordering in association with ABA is important for root hydrotropism. Int. J. Mol. Sci. 2022, 23, 3846. [Google Scholar] [CrossRef] [PubMed]
Figure 1. Growth of different root types of alfalfa under low phosphorus stress. GN, Medicago varia Martin ‘Gongnong’ No.4; LD, M. sativa ‘Longdong’; QS, M. sativa ‘Qingshui’; NP, normal treatment; LP, stress treatment.
Agronomy 14 01697 g001
Figure 2. Root system of different root types of alfalfa under low phosphorus stress. GN, Medicago varia Martin ‘Gongnong’ No.4; LD, M. sativa ‘Longdong’; QS, M. sativa ‘Qingshui’; NP, normal treatment; LP, stress treatment.
Agronomy 14 01697 g002
Figure 3. Quality spectrum analysis system diagram of all samples. (A) Correlation diagram between samples; (B) cluster diagram of metabolites; (C) PCA diagram of all samples. QC: Take an equal volume sample from each experimental sample and mix it as a QC sample; PC1: first principal component; PC2: second principal component.
Agronomy 14 01697 g003
Figure 4. Principal component analysis (PCA) of GN (A), LD (B), and QS (C) alfalfa under low phosphorus stress.GN, Medicago varia Martin ‘Gongnong’ No.4; LD, M. sativa ‘Longdong’; QS, M. sativa ‘Qingshui’; NP, normal treatment; LP, stress treatment; PC1: first principal component; PC2: second principal component.
Agronomy 14 01697 g004
Figure 5. Screening results of differential metabolites in each group.
Agronomy 14 01697 g005
Figure 6. Volcano maps of different metabolites in GN (A), LD (B), and QS (C) alfalfa after low phosphorus stress.
Agronomy 14 01697 g006
Figure 7. Venn plot of differential metabolites.
Agronomy 14 01697 g007
Figure 8. Fold change (FC) plots of each group. The difference multiple is a logarithmic value based on 2, and the label of each column represents the metabolite coding; (AC) are the top 20 metabolites (up-regulated and down-regulated) in the difference between GN-LP vs. GN-NP, LD-LP vs. LD-NP, QS-LP vs. QS-NP experimental groups, respectively. Green represents down-regulation, red represents up-regulation.
Agronomy 14 01697 g008
Figure 9. KEGG enrichment bubble chart in GN (A), LD (B), and QS (C) alfalfa after low phosphorus stress.
Agronomy 14 01697 g009aAgronomy 14 01697 g009b
Figure 10. Effects of phosphorus stress on citric acid (A), malic acid (B), and oxalic acid (C) contents of samples from three root-type alfalfa after 34 d of treatment. Values are means (±SD) of 3 replicates. For each pair of columns in a panel, bars not labeled with the same lowercase letters indicate that the results are significantly different between treatment types (p < 0.05).
Agronomy 14 01697 g010
Figure 11. Effects of phosphorus stress on IAA (A), ZT (B), ABA (C), and GA3 (D) levels of samples from three root-type alfalfa after 34 d of treatment. Values are means (±SD) of 3 replicates. For each pair of columns in a panel, bars not labeled with the same lowercase letters indicate that the results are significantly different between treatment types (p < 0.05).
Agronomy 14 01697 g011aAgronomy 14 01697 g011b
Table 1. The effect of low phosphorus stress on the growth of different root-type alfalfa.
IndicesGNLDQS
LPNPLPNPLPNP
Plant height/cm57.40 ± 10.11 b63.87 ± 8.25 a56.23 ± 10.11 b59.28 ± 10.27 a53.10 ± 4.99 b55.48 ± 5.48 a
Leaf length/cm1.73 ± 0.10 b1.94 ± 0.16 a1.34 ± 0.13 b1.57 ± 0.12 a1.23 ± 0.23 b1.45 ± 0.11 a
Leaf width/cm0.85 ± 0.11 b0.93 ± 0.04 a0.69 ± 0.09 b0.74 ± 0.05 a0.61 ± 0.05 b0.74 ± 0.05 a
Leaf area/cm20.49 ± 0.09 b0.60 ± 0.07 a0.31 ± 0.07 b0.39 ± 0.03 a0.25 ± 0.07 b0.36 ± 0.02 a
Total length/cm3408.56 ± 6.09 a1712.10 ± 2.61 b3491.61 ± 4.23 a1569.48 ± 6.70 b2843.40 ± 3.01 a1438.60 ± 6.84 b
Total surface area/cm246.03 ± 4.24 b57.74 ± 0.98 a44.88 ± 5.80 b66.98 ± 0.94 a33.07 ± 5.72 b53.10 ± 1.14 a
Total volume/cm31.36 ± 0.53 b4.09 ± 0.32 a1.30 ± 0.34 b4.09 ± 0.65 a0.81 ± 0.23 b3.45 ± 0.56 a
Ground biomass/g·10 plant−18.56 ± 1.24 b9.57 ± 0.75 a5.47 ± 1.40 b10.39 ± 0.69 a6.48 ± 1.12 b10.09 ± 0.23 a
Root biomass/g·10 plant−113.98 ± 1.91 a6.91 ± 0.95 b8.87 ± 0.98 a3.27 ± 0.22 b6.88 ± 0.23 a3.24 ± 0.18 b
Root/shoot ratio1.67 ± 0.41 a0.73 ± 0.11 b1.72 ± 0.62 a0.31 ± 0.02 b1.08 ± 0.19 a0.33 ± 0.08 b
Note: GN, Medicago varia Martin ‘Gongnong’ No.4; LD, M. sativa ‘Longdong’; QS, M. sativa ‘Qingshui’; NP, normal treatment; LP, stress treatment. Values are means (±SD) of 3 replicates. For each pair of columns in a panel, bars not labeled with the same lowercase letters indicate that the results are significantly different between treatment types (p < 0.05). The same below.
Table 2. Major metabolites in the roots of different root-type alfalfa under low phosphorus stress.
CategoryMetabolitesFold Change (FC)
GN_LP vs. GN_NPLD_LP vs. LD_NPQS_LP vs. QS_NP
Amino acidsL-histidine-0.331-
4-oxoproline-0.675-
D-proline-0.510-
L-saccharopine--0.367
L-tryptophan--7.918
Organic acidsMethylmalonic acid0.367--
Methylmalonate0.221--
Malonic acid-2.735-
Shikimic acid--0.575
Plant growth regulating substance5-Aminopentanoate-0.621-
Gibberellic acid--0.361
Brassinolide--4.431
BiotinoidsBiotin-3.439-
Desthiobiotin-2.068-
Polyamine substancesAgmatine-0.207-
Nicotinic acidsQuinolinic acid-0.538-
Note: ”-” indicates that this metabolite is not significantly enriched in the experimental group.
Disclaimer/Publisher’s Note: The statements, opinions and data contained in all publications are solely those of the individual author(s) and contributor(s) and not of MDPI and/or the editor(s). MDPI and/or the editor(s) disclaim responsibility for any injury to people or property resulting from any ideas, methods, instructions or products referred to in the content.

