Abstract
Biogas digestate is increasingly used in organic farming to improve soil nutrient supply and sustainably increase yields. However, biogas digestate can also lead to environmentally relevant N2O emissions. The benefits, opportunities, and risks associated with the use of digestate as a fertilizer in organic farming are a subject of ongoing debate, in part due to a lack of conclusive experimental results. A field trial conducted in southern Germany examined the short-term and long-term impacts of digestate fertilization on winter wheat yield, nitrogen use efficiency, and N2O-N emissions. The four-year results from the years 2019 to 2022 are presented. Digestate was applied with a nitrogen input of up to 265 kg ha−1, with 129 kg ha−1 NH4+-N. The application of digestate resulted in a significant increase in wheat yield, with an average increase of 53% (2019) to 83% (2022) compared to the unfertilized control. It is notable that the treatment applied for the first time did not reach the yield of the long-term fertilized treatment, with a yield gap of 0.5 to 1.2 Mg ha−1 (6% to 15%). The highest N2O-N emissions (up to 3.30 kg ha−1) in the vegetation period from spring to autumn were measured in the long-term fertilized treatment. However, very high N2O-N emissions (up to 3.72 kg ha−1) also occurred in two years in winter in the unfertilized treatment. An increase in soil inorganic N stocks and N2O-N emissions was observed following the wheat harvest and subsequent tillage in all treatments. No significant differences were identified between the fertilizer treatments with regard to product-related emissions. The experimental results demonstrate that N2O-N emissions are not solely a consequence of N fertilization, but can also be attributed to tillage, post-harvest practices, and previous crops, with considerable variability depending on weather conditions. The experimental data provide comprehensive insight into the influence of cultivation, soil characteristics, and meteorological conditions on N2O-N emissions at an agricultural site in southern Germany.
1. Introduction
Biogas production from energy crops and manure has been greatly expanded over the last 20 years [1,2]. The use of biomass fermentation is primarily intended to conserve fossil fuel resources and reduce greenhouse gas emissions [3,4]. This approach is only viable if the emissions from the production and energetic use of biomass are significantly lower than those produced by fossil fuels [5]. The nitrous oxide (N2O) fluxes caused by the utilization of fermentation residues must therefore be known in order to calculate greenhouse gas balances [6,7]. With the rapid expansion of biogas plants, large amounts of biogas digestate are produced. Biogas digestates contain valuable macro- and micronutrients and organic matter, which can be used as fertilizers or soil amendments [8,9,10].
N2O is a long-lived greenhouse gas with a current atmospheric concentration of 337.7 ppb [11]. The CO2 equivalent of N2O is 298, based on a 100-year investigation period [12]. The formation of N2O is a natural process and part of the nitrogen (N) cycle. N2O is formed mostly by microorganism during the conversion of ammonium (NH4+) by nitrification and nitrate (NO3−) by denitrification [13]. The N2O emissions depend on numerous natural factors such as soil and weather conditions as well as management factors such as crop rotation, fertilizer quantity and composition, application methods and timing, and tillage intensity [14,15]. Fertilization with biogas digestate inevitably leads to N2O emissions [16], due to the supply of C and N compounds. However, the interactions between the above-mentioned factors under field conditions have not yet been sufficiently clarified [17,18]; the level of N2O fluxes after digestate application can vary greatly and is difficult to estimate [19,20,21].
Biogas digestate is increasingly being used in organic farming to improve the soil nutrient supply and sustainably increase crop yields [22,23,24,25,26]. The production methods of organic farming are defined in EU regulations [27]; these rules also form the basis of our experiment. The benefits, opportunities, and risks of the use of digestate in organic agriculture are assessed controversially [28]. So far, there are hardly any results on yields, N balances, and N losses, e.g., N2O emissions from field trials with digestates in organic farming. The results from conventional field trials show comparable or even higher yields with digestate than with unfermented slurry [23,29,30]. In organically grown winter wheat, high yield increases were found with digestate application (up to over 50% compared to non-fertilized or green manure-fertilized treatments) [22]. Of particular importance for the yield effects of biogas digestate is the increase in plant-available inorganic N due to the decomposition of organic matter during the fermentation process, which can lead to a 33% higher NH4+ content compared to unfermented slurry [28,31,32,33]. About 44–81% of the total N of biogas digestate is in the form of NH4+ [31,34].
Previous studies on yield effects and N2O emissions from digestate often only refer to short-term effects or were carried out under laboratory conditions [17,18,35]. Until now, there has been a lack of long-term field experiments in which the effects of digestate could be analyzed under organic farming conditions. Therefore, the accumulative effects of digestate on the soil C and N turnover, on nitrification and denitrification processes, and on long-term yield effects could not yet be assessed on the basis of experimental data [36].
Years of continuous fertilization with biogas digestates, as is common for farms with biogas plants, add large amounts of organic C and N to the soils, which has complex effects on soils, plants, and the environment [37]. Thus, soil organic C (SOC) and soil total N (TN) contents, C and N turnover, denitrification, and N2O emissions could increase with duration of digestate use. However, it has not been investigated if the continuous application of biogas digestate leads to higher N2O fluxes than a single application [28]. The long-term effects of digestate on crop yields are also unclear. It is possible that the yield potential will increase with the continuous application of digestate. Therefore, only a long-term experiment with a sufficiently long test duration can provide reliable information on the product-related N2O emissions.
In order to close the knowledge gap described above and to gain new insights into the short- and long-term effects of digestate, analyses of the effects on crop yield, N efficiency, and N2O-N emissions were carried out in a long-term field experiment. Four-year experimental results from 2019 to 2022 are presented for the crop winter wheat. The experimental basis is the Viehhausen energy crop rotation trial in southern Germany, where the effects of fertilization with digestate have been investigated since 2005.
The objectives of the study are to assess the dynamics of N2O emissions over an extended period and to evaluate the influence of soil properties, agronomic practices, and environmental factors on N2O emissions. Additionally, the study aimed to rate yield and product quality, N balances, and product-related emissions in organic farming systems from an agronomic perspective. It also sought to provide insights into the potential of biogas digestate in promoting sustainable agriculture.
2. Materials and Methods
2.1. Site and Weather Conditions
The field trial was conducted at the Viehhausen Experimental Station of the Technical University of Munich, which is located near Freising, 30 km north of Munich (48°39′62′54 N, 11°65′07′31 E), 490 m above sea level in the Bavarian Tertiary Hills. The soil of the experiment is a Haplic Luvisol, composed of loess, with 25% clay, 62% silt, and 13% sand (silty loam). The soil has a high water-holding capacity due to its high clay content and tends to compaction and sludging. The chemical soil properties are listed separately for long-term fertilized and unfertilized treatments in Table 1 (note that plots rotate with the crop rotation).

Table 1.
Soil properties at 0–30 cm depth, long-term trial “energy crop rotation”, experimental station Viehhausen. Investigated plots rotate with the crop rotation.
The long-term means (1991–2020) of temperature and precipitation at this site are 8.7 °C and 774 mm per year, respectively (Table 2). In all four years of the study (2019 to 2022), it was warmer than the long-term average. The years were characterized by a dry and warm spring, especially in March and April, followed by periods of heavy rainfalls in summer. May was wet in 2019 and 2021 but rather dry in 2020 and 2022. Both summer and autumn were warm compared to the long-term mean. Winters were very mild compared to the long-term average, with few frost days. The mean temperatures in 2019, 2020, and 2022 were above the long-term average, while 2021 had slightly lower temperatures. The mean precipitation in the experimental years 2019, 2020, and 2022 was found to be consistent with the long-term average. However, the precipitation in 2021 was considerably higher.
Table 2.
Average monthly temperature and precipitation for the years 2019–2022 and the long-term average (1961–1990 and 1991–2020), experimental station Weihenstephan-Dürnast (3 km from Viehhausen).
2.2. Experimental Set Up
The field trial is part of the long-term field experiment “energy crop rotation trial”. This field experiment was established in 2004 and covers an area of 3.75 ha. It consists of 384 plots and contains different energy and cash crops, crop rotations, and fertilization and tillage systems [38,39]. In this study, only the long-term fertilized and unfertilized treatments of winter wheat, grown in the crop rotation clover/grass–winter wheat–maize–triticale, was investigated. The long-term fertilized and unfertilized plots were subdivided at the time of fertilization, resulting in the following four treatments (Table 3): unfertilized control treatment (00), treatment that was fertilized with digestate in the long term (DD), treatment fertilized with digestate for the first time (0D, analysis of the direct effects of digestate), and treatment not fertilized with digestate for the first time (D0, analysis of the after-effect of biogas digestate). The experimental design is a single-factor randomized block unit [38]. Each plot has a size of 72 m2 (12 m × 6 m), after dividing 36 m2 (12 m × 3 m). For the determination of the yield parameters and N balancing, 4 treatments with 4 replicates (=16 plots) were used, and for the N2O measurements, 3 replicates (=12 plots) were used.
Table 3.
Abbreviations of the treatments and explanations.
2.3. Fertilization with Biogas Digestate
The N rates of digestate applied in the trial correspond to the digestate production derived from the biomass yield of the energy crops and was in the range of 223.2 and 264.6 kg ha−1. The N supply with digestate did not exceed the fertilization requirement according to the German Fertilizer Ordinance [40]. Digestate was applied using a slurry tanker with trailing hoses at two dates each year—at the beginning of vegetation (BBCH 20/21) and at growth stage BBCH 30/31 (Table A1) [41]. The biogas digestate was produced by a local organic farmer from a feedstock mixture corresponding to the biomass produced in the trial (clover–grass and maize silage). The chemical composition of the digestate is summarized in Table 4.
Table 4.
Chemical composition of the biogas digestate applied to winter wheat in 2019–2022.
2.4. Biomass and Soil Samples
For grain yield determination, the plots were harvested with a plot combine. Crop samples were dried at 105 °C. Dry matter yield was determined and extrapolated to one hectare. The determination of the N and C contents of the soil and the plant biomass was carried out with an Elementar vario MAX C/N analyzer [42]. The wheat grain protein content was calculated from the N content multiplied by 5.7 [43].
For the analysis of inorganic N content, soil samples were taken weekly with a soil auger at a soil depth of 0–15 cm and 15–30 cm. A soil sample consisted of a composite sample of four replicates. The soil samples were homogenized and then solved in 0.1 mol/L KCl extract to determine the parameters NO3− and NH4+ [44]. The NO3−-N and NH4+-N stocks were determined for the soil layers using the specific bulk density. The gravimetric water content was determined by drying at 105 °C in a compartment drier.
N balances were calculated to evaluate the N surplus (corresponds to the total loss potential of reactive N compounds) and the N use efficiency (NUE).
The N grain uptake corresponds to the dry matter yield multiplied by the N content of the grain. The total N uptake represents the N uptake of grain and straw.
The N surplus was calculated as the difference between fertilizer N input (total N of the digestate) and total N uptake. The NUE results from the N uptake in relation to the N input [45].
2.5. N2O Measurement
Gas samples were collected using the manual closed chamber method [46] according to the guidelines of Nitrous Oxide Chamber Methodology [47]. Chambers were a special design by the company Ps Plastic (Eching, Germany). Gas samples were taken once a week and additionally in periods where high N2O flux rates were expected (after fertilization, after heavy rainfalls, after tillage, or in frost–thaw cycles) to obtain a high resolution of trace gas fluxes and to avoid under- or overestimation of cumulative N2O emissions. In order to be able to cumulate the N2O fluxes, the measurements were carried out between 08:00 and 11:00 to cover the mean daily temperature [48] and best approximated daily mean N2O flux [49]. The chambers had an area of 0.36 m2 and were equipped with a rubber seal, a fan, and a degassing hose. For the measurements, the chamber was placed over the vegetation on a frame fixed into the soil and left there for an hour. Samples were taken with a battery-operated sampler in glass vials after 0, 20, 40, and 60 min. The vials, sealed with a septum, were analyzed by a gas chromatograph provided with an electron capture detector (ECD). The calibration range was 300 to 3000 ppb for N2O.
The actual flow rate was calculated with the statistic software RStudio (Version 1.3.1093) and the package “gasfluxes” [50] for each chamber based on the increase in the gas concentration in the chambers over time (1 h and 4 measurements) and expressed in ppm. In consideration of the specific chamber temperature, the nitrous oxide fluxes were converted into the unit µg m−2 h−1 and are presented as N2O-N emissions.
2.6. Calculation of Cumulative N2O Emissions
Linear interpolation between two measurement events was used to cumulate N2O fluxes [17,20]. In order to identify influences of seasons and vegetation periods, the cumulated emissions were recorded for different periods (whole year, winter, summer, and post-harvest). Autumn and winter emissions were only measured in the two long-term treatments in all years, as the other treatments only emerged after fertilization. To calculate the area-related and product-related emissions, fluxes of the long-term treatments were added on the first-time treatments.
For a better representation of the statistical differences in N2O-N fluxes, the data were manipulated to obtain negative fluxes out (N2O-N + 50 µg m−2 h−1). Product-related emissions were calculated by N2O-N emissions per hectare divided by wheat yield per hectare [51]. The emission factor was calculated by subtracting the cumulative emissions of the fertilized treatment (Fluxfertilized) from the emissions of the unfertilized control treatment (Fluxcontrol) in relation to the N input) [52,53,54].
In addition, the Global Nitrous Oxide Calculator (GNOC) was used, a model based on an exponential algorithm that considers site- and management-specific characteristics such as soil texture, climate, soil organic matter, pH, and vegetation [55].
2.7. Statistical Analysis
The statistics software RStudio (Version 1.3.1093) was used for the statistical evaluation. A linear mixed model and ANOVA at a significance level of α = 0.05 were performed with the packages “lme4” and “lmerTest” [56]. Treatment and year were set as fixed factors and blocks and replicates as random factors. A statistical comparison of the cumulated fluxes was carried out by logarithmic transformation to improve variance homogeneity and subsequent evaluation with a linear mixed-effects model. Furthermore, all test factors were evaluated with the post hoc test “Tukey” to detect significant differences between the treatments (significance level of α = 0.05). Significant differences are represented by superscript letters.
3. Results
3.1. Grain Yield and Protein Content
Wheat grain yields ranged from 3.8 Mg ha−1 (treatment 00, long-term unfertilized, 2020) to 8.4 Mg ha−1 (treatment DD, long-term fertilized with digestate, 2022) (Table 5). In all test years, treatment DD achieved the highest yields and treatment 00 the lowest. A significant after-effect of digestate fertilization on wheat yield was found in 2019 and 2022 (comparison of treatments D0 and 00). In 2019, treatment 0D, which was fertilized with digestate for the first time, achieved a yield of 6.9 Mg ha−1, which did not differ significantly from treatment D0 (6.2 Mg ha−1), but was significantly lower than in treatment DD (8.1 Mg ha−1). In 2020 and 2021, the two fertilized treatments (0D and DD) and the two unfertilized treatments (00 and D0) were not significantly different in grain yield. In 2022, treatment 00 had by far the lowest yield with 4.6 Mg ha−1. Treatment D0 had a significantly higher yield than treatment 00 and a significantly lower yield than the two fertilized treatments (0D and DD). The yields in all four years indicate an effect of long-term and first-time fertilization. The yields can be ranked in ascending order: 00 < D0 < 0D < DD.
Table 5.
Wheat grain yield in fresh matter, standardized to 86% dry matter, protein content, N uptake, N surplus, and N use efficiency (NUE) for the years 2019–2022. Different letters indicate significant differences (Tukey test, p < 0.05).
The protein contents, considered for all years, were between 10.0 and 12.5%, which is average for organically grown winter wheat. No significant differences between the treatments were identified.
3.2. N Uptake, N Surplus, and N Use Efficiency
The high N inputs with digestate (223.3 to 264.6 kg ha−1) resulted in a high N uptake (up to 190.2 kg ha−1) (Table 5). In the unfertilized treatment 00, the N uptake ranged from 73.5 kg ha−1 to 105.7 kg ha−1, which can be attributed to soil N mineralization and N transfer from the clover–grass.
Considering the measured NH4+-N stocks of the digestate, the supply of plant-available NH4+-N in the fertilized treatments was 97.4 to 128.8 kg ha−1. There were significant differences in N uptake between the first-time and long-term treatments in all years except 2020 (in 2020, there were only significant differences between the fertilized and unfertilized treatments). It was observed that the long-term unfertilized treatment always resulted in a lower N uptake than the first-time unfertilized treatment, while the long-term fertilized treatment always had a higher N uptake than the first-time fertilized treatment. The N balances of the unfertilized treatments were negative (−73.5 to −137.0 kg ha−1). This indicates a possible decrease in soil total N stocks. In fact, the soil N contents in the unfertilized treatment 00 were lower than those of the fertilized treatment DD (Table 1). The N balances of the long-term fertilized treatment DD ranged from 33.0 to 121.8 kg ha−1 and the N balances of the first-time fertilized treatment 0D from 58.7 to 133.0 kg ha−1.
3.3. NH4+, NO3−, and Soil Moisture Dynamics
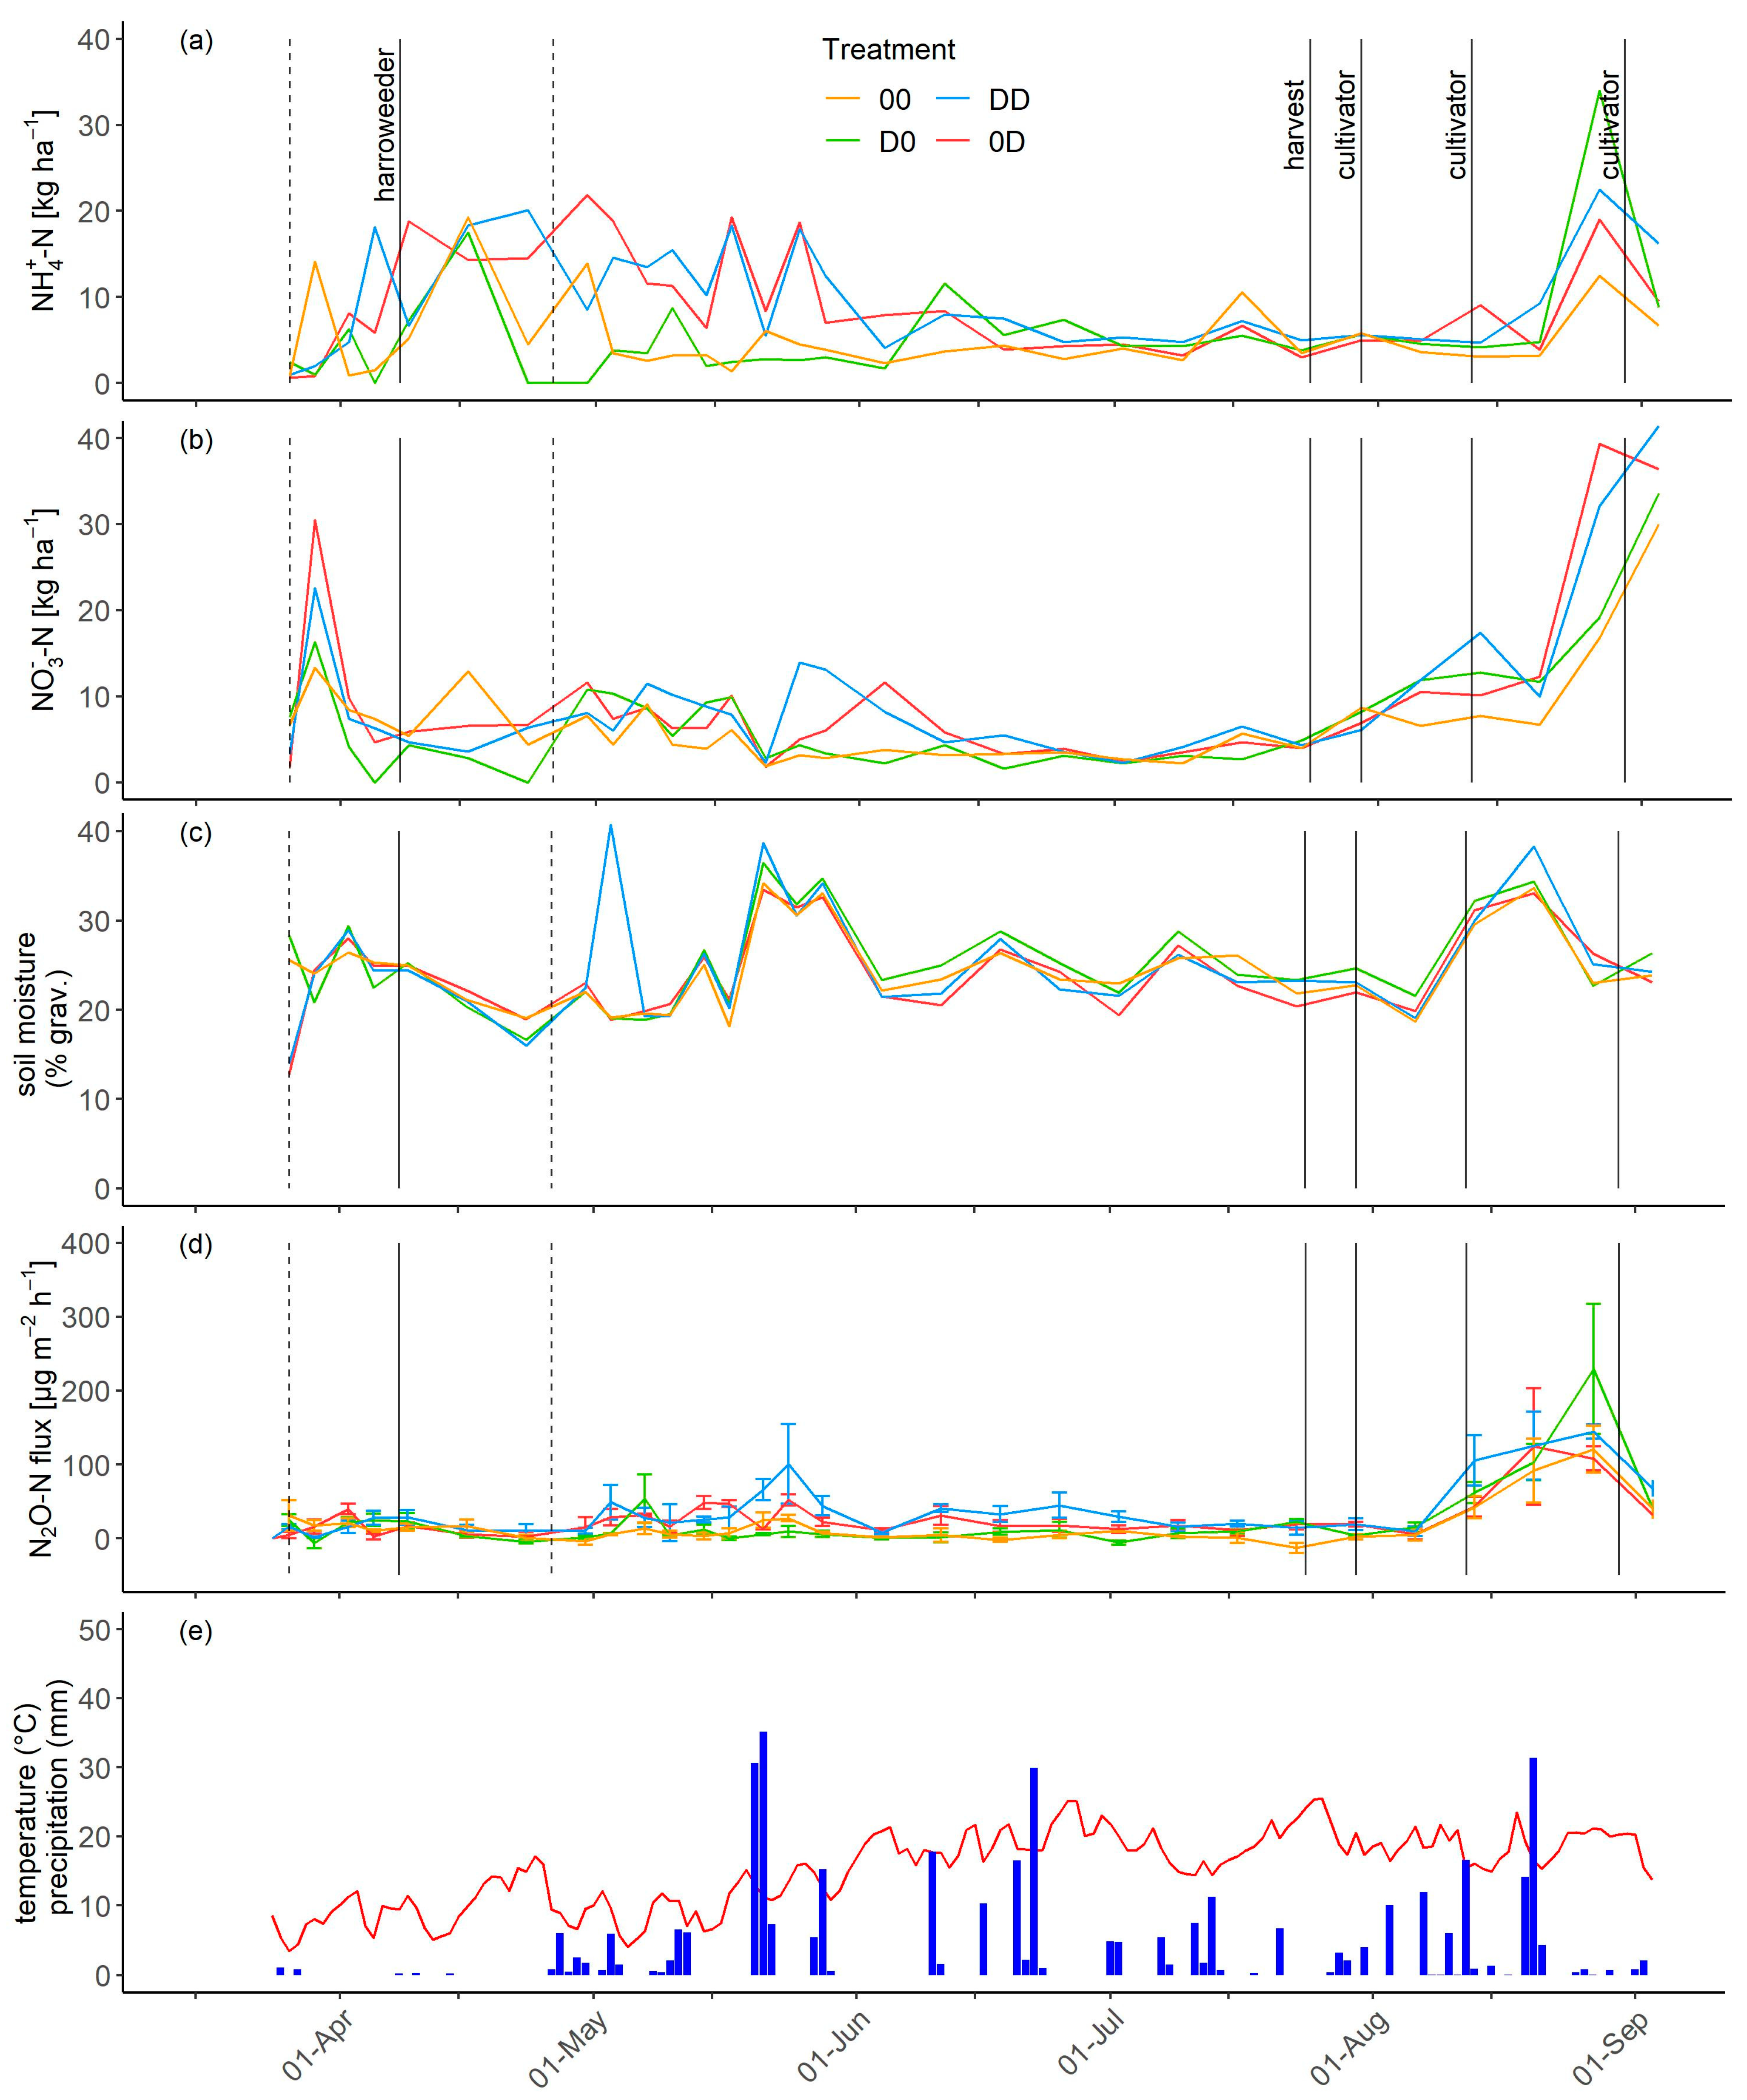
The dynamics of NH4+ and NO3− stocks in the soil, soil moisture, and N2O-N emissions are shown in Figure 1 for wheat cultivation in 2019 from the start of the measurements on 26 March 2019 to the end of the measurements on 3 September 2019. In the following years, measurements started in October, shortly after winter wheat sowing. The measurement periods vary slightly from year to year, depending on the sowing and harvest dates.
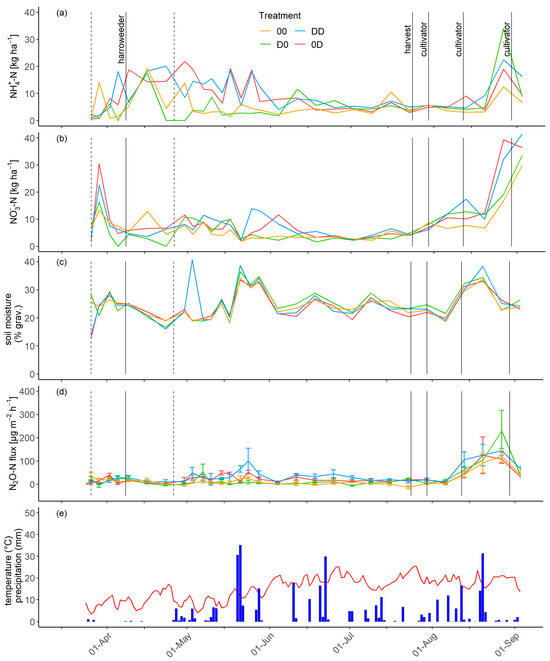
Figure 1.
Ammonium-N (a) and nitrate-N dynamics (b) and soil moisture (c) of all four treatments related to the topsoil layer (0–15 cm) from March 2019 to September 2019. Nitrous oxide emissions (d), error bars illustrate the standard deviation) and temperature (red line) and precipitation (e) from March 2019 to September 2019. Black lines mark different agronomic actions and dashed lines mark the date of fertilization and only refer to the two fertilized treatments. (Treatments: 00 long-term unfertilized, D0 first-time unfertilized, 0D first-time fertilized, and DD long-term fertilized).
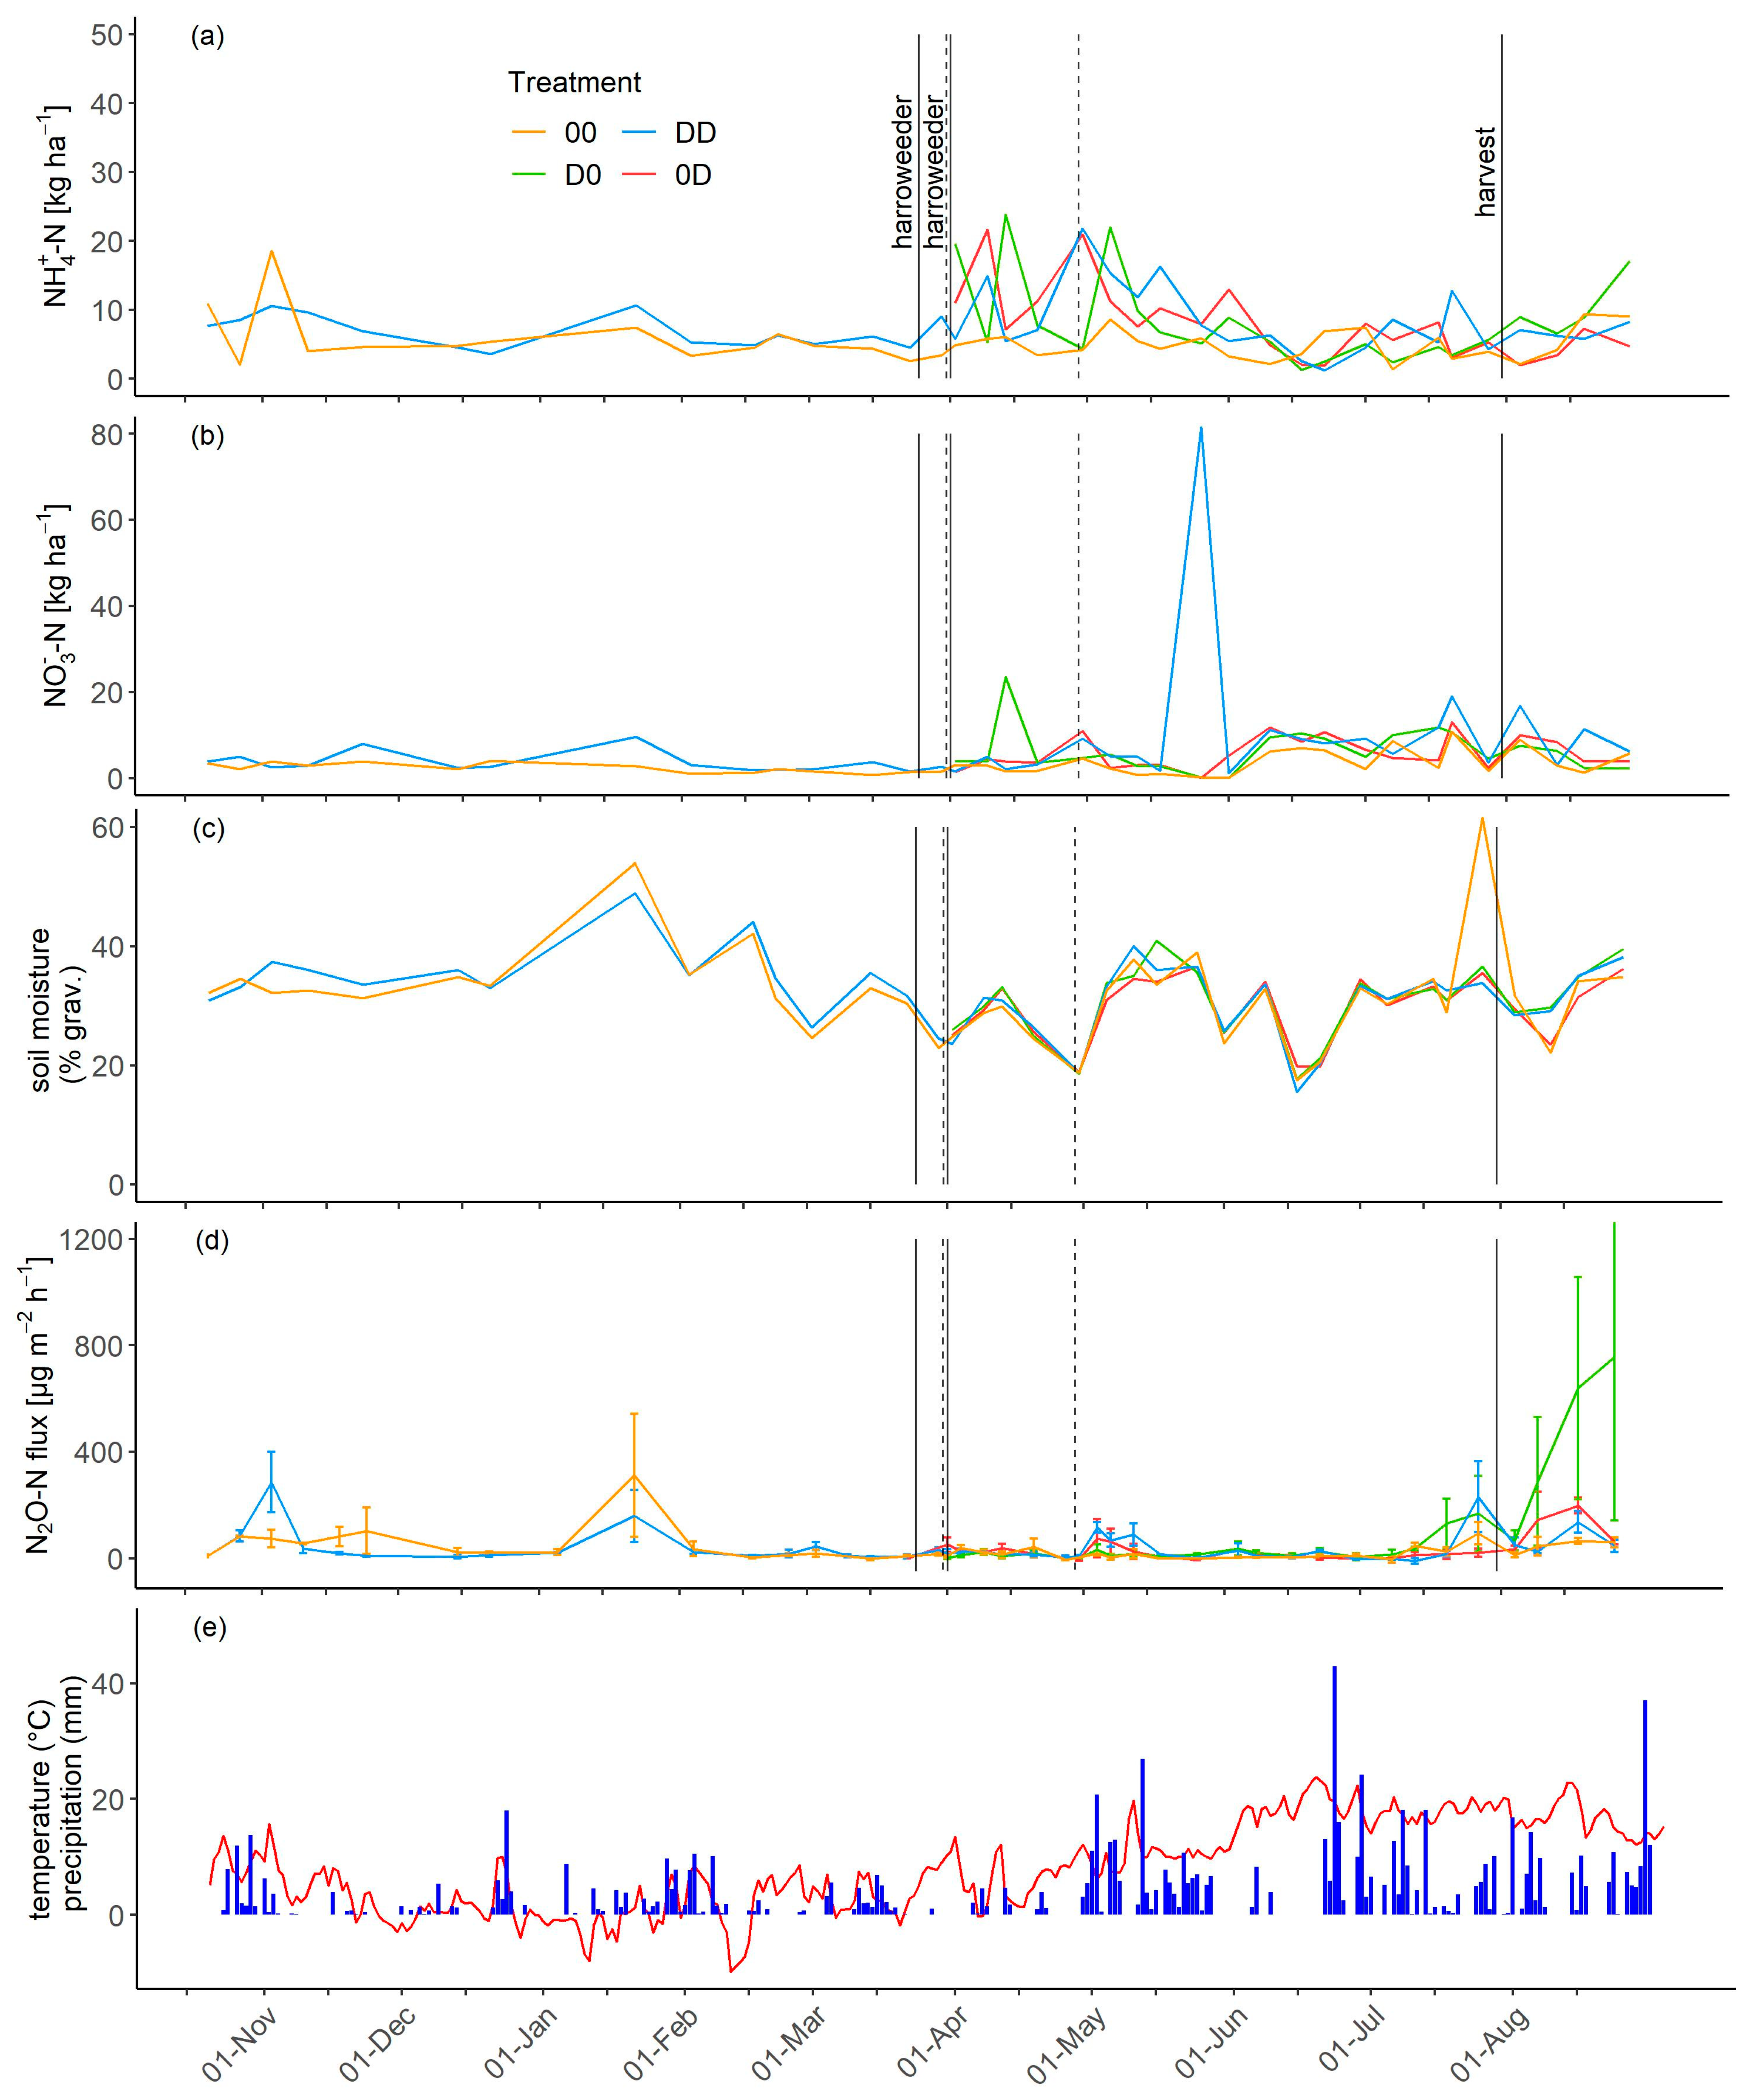
The NH4+ and NO3− stocks in the soil layer 0–15 cm were rather low throughout the trial period. Very low NH4+ and NO3−-N stocks (<10 kg ha−1) were observed over longer periods (especially in summer and winter). Increases of up to 34 kg ha−1 NH4+-N and 46 kg ha−1 NO3−-N were recorded in spring after fertilization and in late summer/autumn post-harvest. However, the NH4+ and NO3− dynamics were year- and weather-specific (Figure 1, Figure 2, Figure 3 and Figure 4).
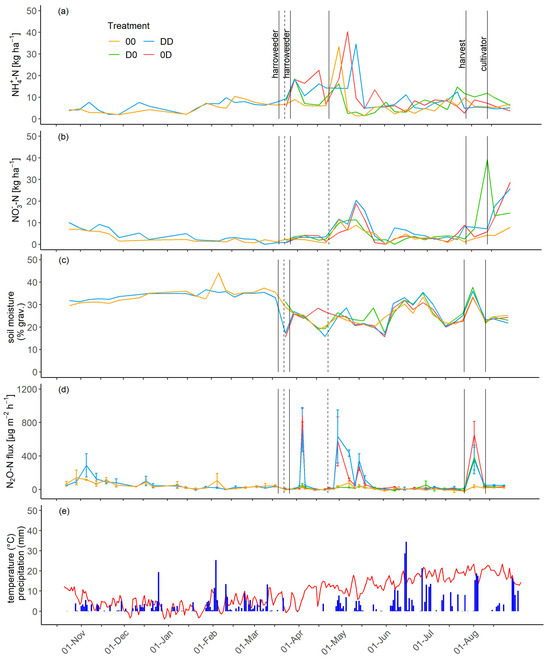
Figure 2.
Ammonium-N (a) and nitrate-N dynamics (b) and soil moisture (c) of all four treatments related to the topsoil layer (0–15 cm) from October 2019 to September 2020. Nitrous oxide emissions (d), error bars illustrate the standard deviation) and temperature (red line) and precipitation (e) from October 2019 to September 2020. Black lines mark different agronomic actions and dashed lines mark the date of fertilization and only refer to the two fertilized treatments (DD and 0D). (Treatments: 00 long-term unfertilized, D0 first-time unfertilized, 0D first-time fertilized, and DD long-term fertilized).
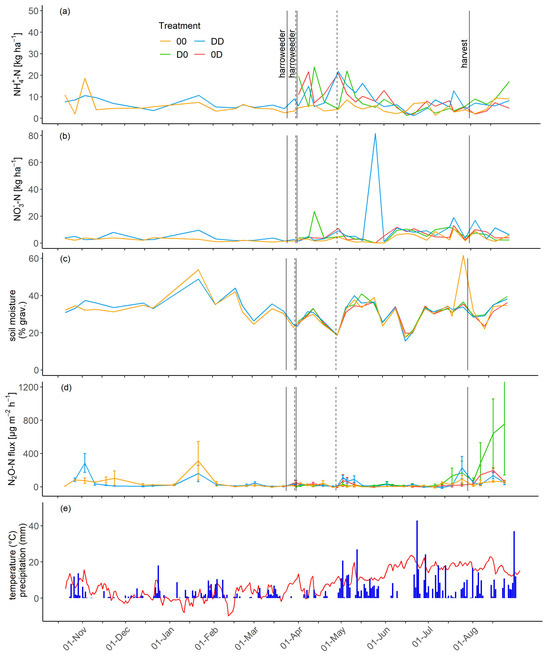
Figure 3.
Ammonium-N (a) and nitrate-N dynamics (b) and soil moisture (c) of all four treatments related to the topsoil layer (0–15 cm) from October 2020 to September 2021. Nitrous oxide emissions (d), error bars illustrate the standard deviation) and temperature (red line) and precipitation (e) from October 2020 to September 2021. Black lines mark different agronomic actions and dashed lines mark the date of fertilization and only refer to the two fertilized treatments (DD and 0D). (Treatments: 00 long-term unfertilized, D0 first-time unfertilized, 0D first-time fertilized, and DD long-term fertilized).
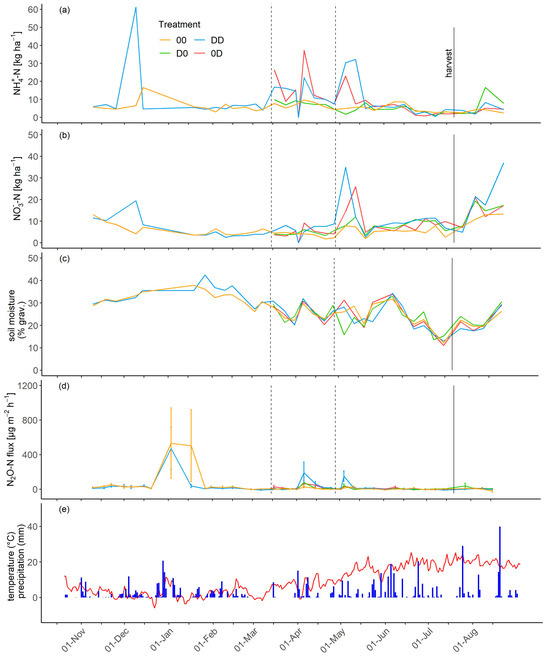
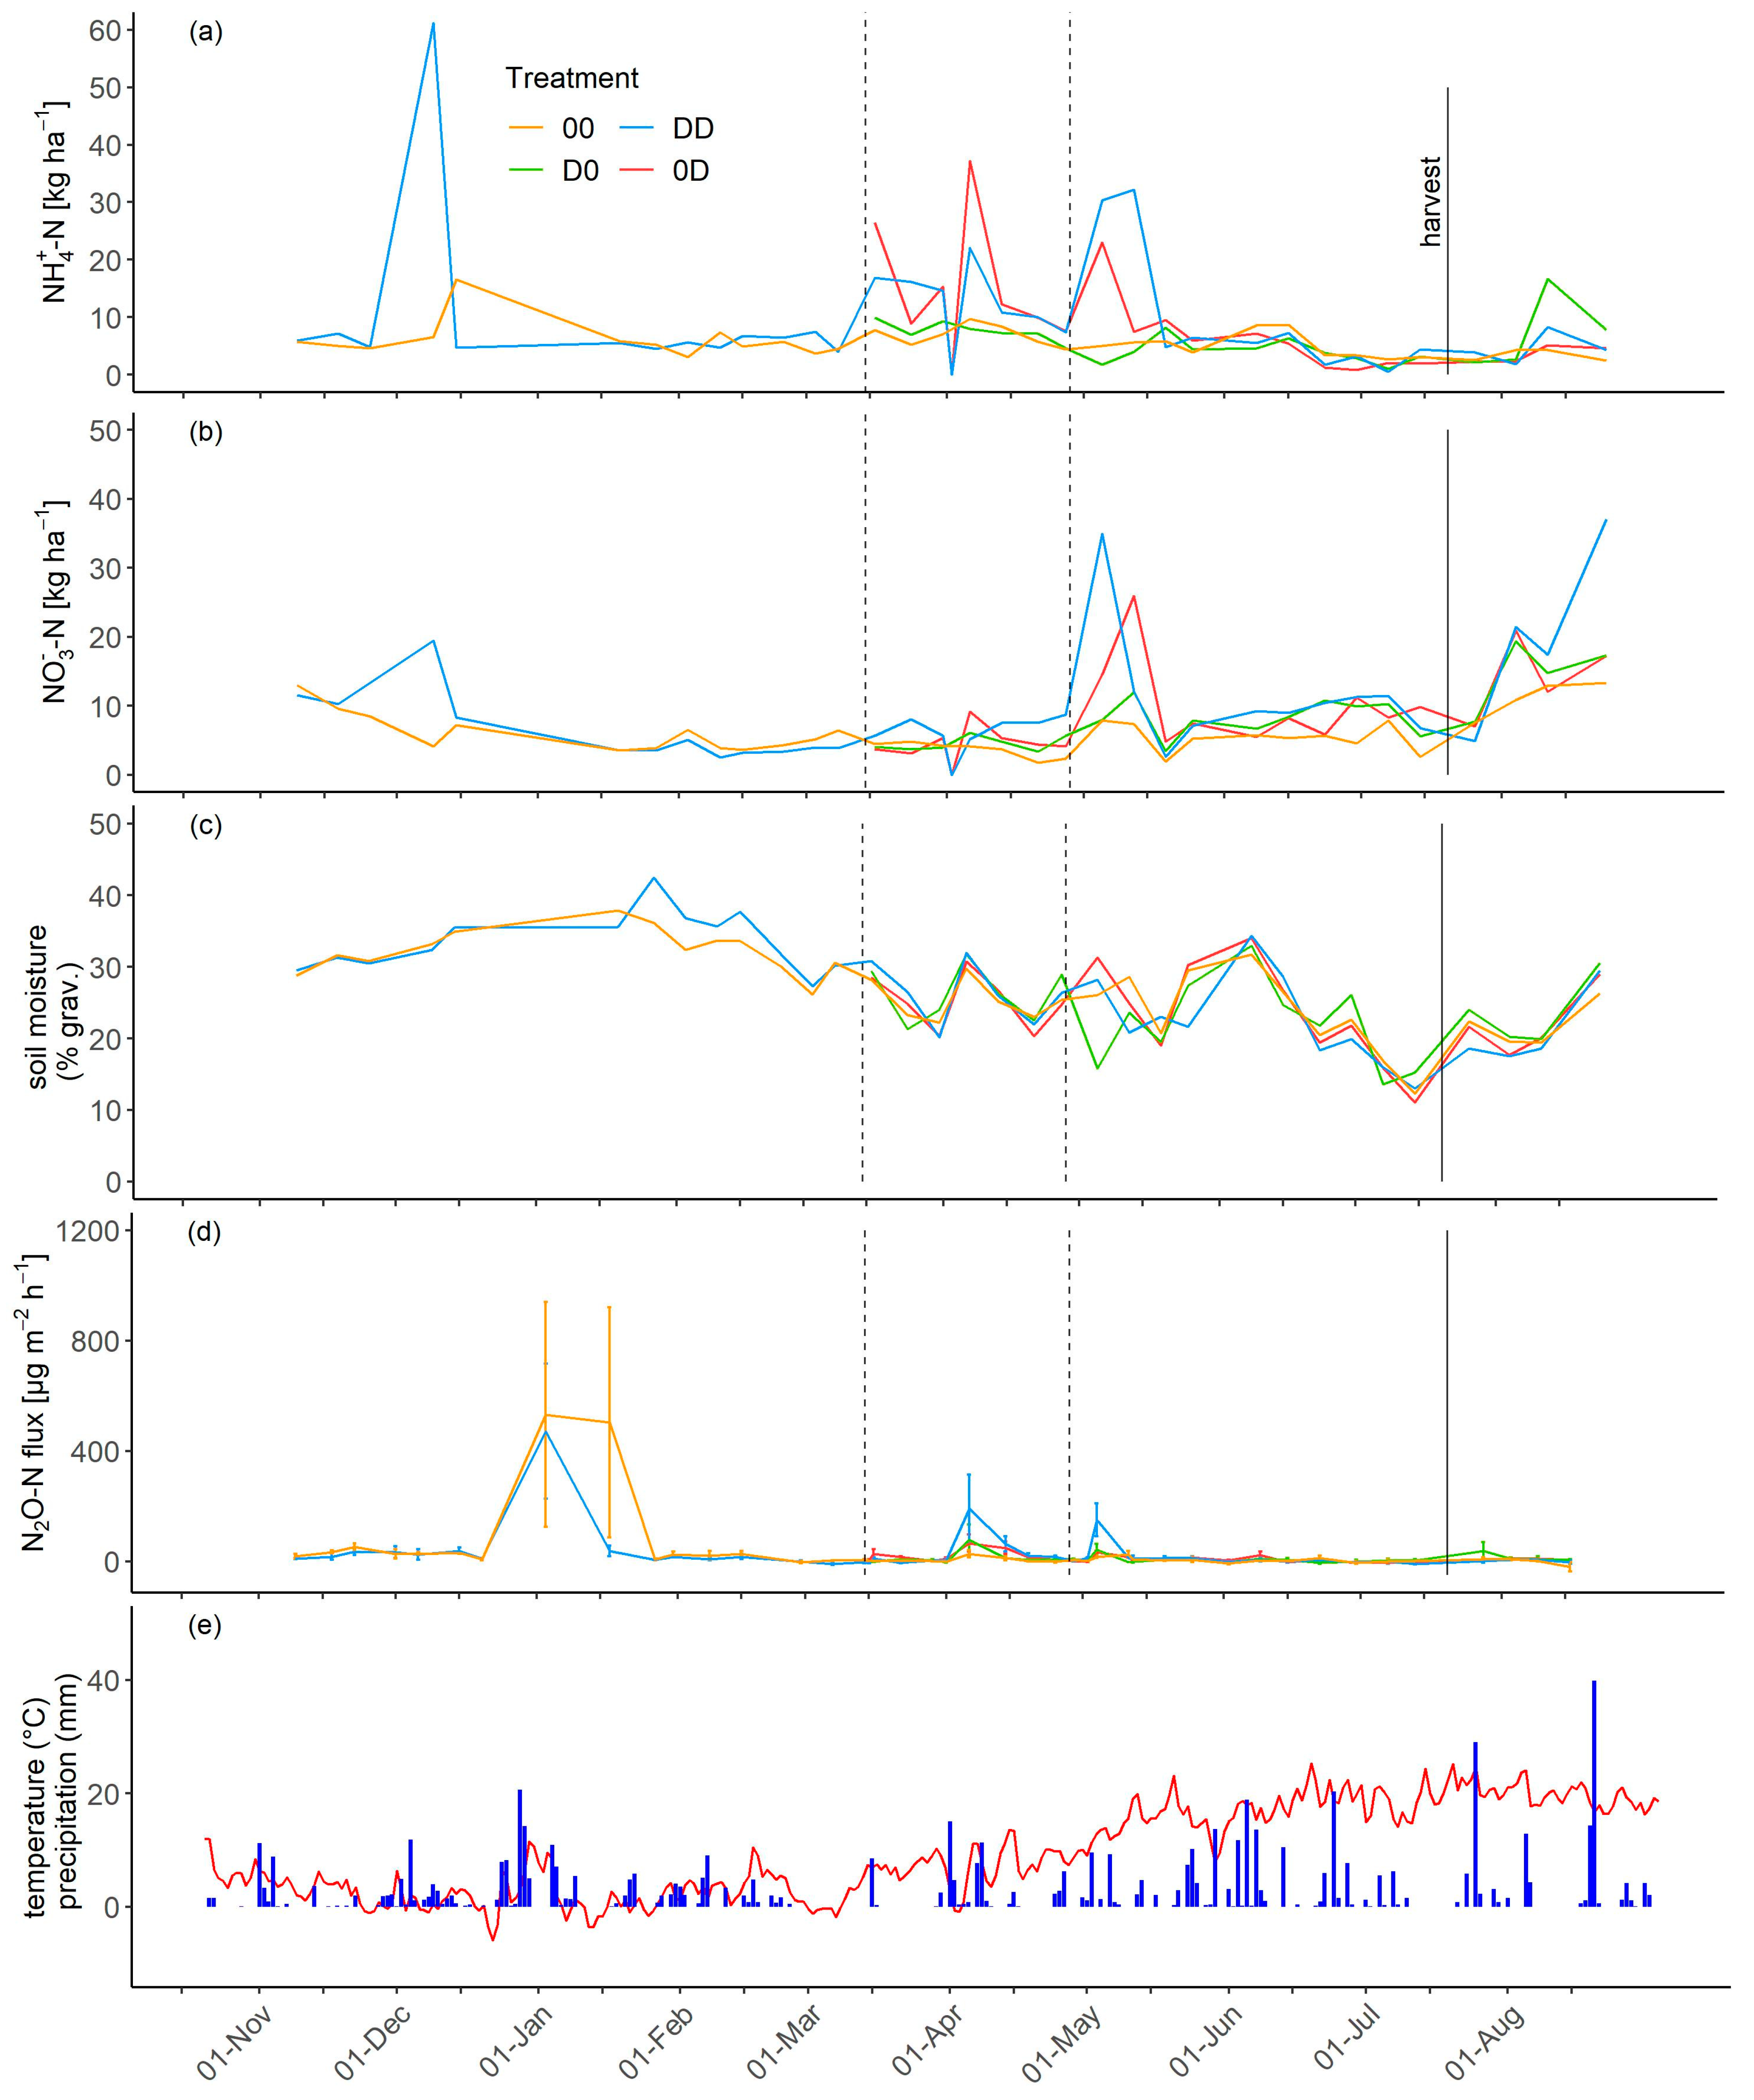
Figure 4.
Ammonium-N (a) and nitrate-N dynamics (b) and soil moisture (c) of all four treatments related to the topsoil layer (0–15 cm) from October 2021 to September 2022. Nitrous oxide emissions (d), error bars illustrate the standard deviation) and temperature (red line) and precipitation (e) from October 2021 to September 2022. Black lines mark different agronomic actions and dashed lines mark the date of fertilization and only refer to the two fertilized treatments (DD and 0D). (Treatments: 00 long-term unfertilized, D0 first-time unfertilized, 0D first-time fertilized, and DD long-term fertilized).
Due to the N supply with digestate application, soil inorganic N stocks were temporarily higher in the fertilized treatments, which could have promoted nitrification and denitrification.
The increase in soil NH4+-N and NO3−-N after the harvest can be attributed to tillage and the subsequent N mineralization of the harvest residues. An increase in soil NH4+ and NO3− stocks in spring was observed in all treatments, even in the unfertilized treatments. In addition to the N provided by the digestate, this increase is due to the soil N mineralization and the N transfer from the previous crop of clover–grass.
Soil moisture in % was very similar in all treatments throughout the period. In winter, the values leveled off at around 40 percent. The highest value was recorded on 10 February 2021 in 00 after a few rain events at the beginning of February with 43%. In spring and summer, there were greater fluctuations in water content due to plant growth and increased rainfall. The lowest value was measured on 14 July 2022 at 11% in the 0D treatment and the highest on 3 May 2019 in DD with 45% (Figure 1, Figure 2, Figure 3 and Figure 4).
3.4. N2O Fluxes
The unfertilized (00) treatment consistently showed lower N2O-N emissions compared to the fertilized treatments. In 2019, N2O-N fluxes were relatively low and unaffected by fertilization (Figure 1). In the 2019/2020 season (Figure 2), no significant N2O-N emission peaks were observed in spring, and post-harvest emissions remained minimal. In 2020/2021 (Figure 3), N2O-N emissions were very low throughout the growing season, with no notable increases following digestate application. However, in the winter of 2021/2022 (Figure 4), the 00 treatment exhibited N2O-N emissions at levels comparable to the fertilized DD treatment, likely influenced by weather conditions such as rainfall and frost–thaw cycles.
The long-term fertilized (DD) treatment demonstrated notable N2O-N dynamics throughout the study. In 2019, the DD treatment exhibited low N2O-N fluxes in spring but emissions increased following heavy rainfall events and post-harvest tillage, temporarily exceeding 432 µg m−2 h−1 N2O-N. In autumn 2019, a significant N2O-N event was recorded in November. By spring 2020, there were pronounced emission peaks up to 1366 µg m−2 h−1 N2O-N shortly after fertilizer application in the DD treatment. In winter 2021/2022, following rain and a subsequent temperature increase, N2O-N emissions in the DD treatment reached levels comparable to those observed in the 00 treatment. Despite these variations, the DD treatment consistently emitted more N2O-N due to increased soil NH4+ and NO3− stocks from fertilization.
The first-time fertilized (0D) treatment showed significant N2O-N emission peaks. In 2019, fertilization led to slight and short-term increases in N2O-N fluxes compared to unfertilized treatments. The 2019/2020 season showed pronounced emission peaks in spring, reaching up to 1366 µg m−2 h−1 N2O-N after fertilizer application. Post-harvest in 2020, the highest N2O-N fluxes were recorded in the 0D treatment, associated with elevated soil NO3− stock. In 2021, despite generally low emissions during the growing season, there was a slight increase in N2O-N emissions following the second digestate application and subsequent precipitation.
The D0 treatment, without biogas digestate fertilization for the first time since 2005, also showed distinct N2O-N emission patterns. In 2019, this treatment experienced a slight increase in N2O-N fluxes following heavy rainfall events. In 2020, post-harvest emissions were higher in the D0 treatment, potentially due to increased N mineralization from previous fertilization.
3.5. Cumulative N2O-N Emissions and Emission Factors
Table 6 presents the cumulative N2O-N emissions in winter wheat, based on measured data as well as calculated with the GNOC model. Emissions are shown separately for winter and summer (from fertilization until harvest including post-harvest). Since strong post-harvest effects were evident in three of the four measurement years, the post-harvest emissions were calculated separately.
Table 6.
Cumulated N2O-N emissions (in kg ha−1) of the investigated treatments and different phases of the vegetation of winter wheat in four years in comparison to the nitrous oxide emissions calculated with the GNOC model shown for the entire vegetation period from sowing to harvest. Different letters indicate significant differences (Tukey test, p < 0.05).
In 2019, summer emissions were 1.49 kg ha−1. In 2020, they reached to 3.30 kg ha−1, much higher than the unfertilized treatment (00) at 0.39 kg/ha. Post-harvest emissions in 2020 were 2.50 kg ha−1, again higher than the unfertilized treatments (00: 0.26 kg ha−1 and D0: 0.38 kg ha−1).
In 2021, winter emissions in the DD treatment were higher than in 00, but not significantly. During the winter of 2021/22, DD emissions were very high at 2.04 kg ha−1. The 00 treatment usually had the lowest emissions. In 2019, these were 0.64 kg ha−1. In 2020, winter emissions were slightly lower than DD but not significantly and summer emissions were 0.39 kg ha−1. In winter 2021/22, very high emissions for 00 at 3.72 kg ha−1 were observed.
The 0D treatment had intermediate emissions. In 2019, they were higher than 00 but lower than DD. In 2020, emissions from fertilization to harvest (1.92 kg ha−1) were similar to the long-term fertilized treatment. The D0 treatment emitted 0.38 kg ha−1 in 2020 from fertilization to harvest, less than DD. In 2021, D0 had high emissions due to a strong post-harvest effect, with the highest post-harvest emissions at 2.56 kg ha−1. No substantial differences were observed from fertilization to harvest.
Product-related N2O-N emissions refer to the whole year and are therefore presented for the years 2020–2022 (Table 6). Due to high wheat yields and relatively low emissions, the product-related N2O-N emissions are at a very low level (0.35–0.82 kg Mg−1), without significant differentiation between the fertilization treatments and years.
For the calculation with the GNOC model, only the current fertilization was taken into account, neither previous crops nor past fertilization. Thus, there is no difference in the N2O-N emissions between the long-term and first-time treatments. The emissions of the fertilized treatments were 3.17 to 3.70 kg ha−1 N2O-N, while those of the unfertilized treatments were 1.36 kg ha−1 N2O-N. The emission factors could only be calculated for the fertilized treatments. The GNOC emission factor was between 0.82 and 0.88%. Emission factors based on measured emissions were also very low. As emissions from 00 exceeded DD in 2021 and 2022, negative rates were calculated.
4. Discussion
The implementation of a nitrous oxide measurement campaign in an already established long-term field experiment provided the opportunity to analyze the long-term impacts of biogas digestate that have accumulated over many years [36,57]. N2O measurement results from long-term experiments with different fertilization are still rare, especially in organic farming [58,59]. As fermentation residues contain a high proportion of organically bound C and N (Table 4), it is to be expected that considerable amounts of C and N are stored in soil organic matter. In fact, SOC and TN stocks were significantly higher in the fertilized plots [39]. With the long-term SOC and TN accumulation, the C and N mineralization potential increases [60], so that even with discontinued fertilization (treatment D0), more N is mineralized from the soil, which can potentially cause N2O emissions.
One characteristic of the trial is the clover/grass–winter wheat crop sequence, which is typical for organic farming in temperate climates [61]. In the trial, the clover–grass was cut and the aboveground biomass was removed; therefore, only harvest residues and roots remained in the soil. Due to the high clover–grass yields in the trial (up to 15 Mg ha−1 dry matter yr−1) and the high biological N fixation rate (up to 450 kg ha−1) [38,39,62], significant amounts of C and N remained in the residues. The mineralization patterns were different depending on the ploughing date and the weather conditions. The N transfer from clover–grass to winter wheat [63,64] is one explanation for the sometimes high N2O-N fluxes in the unfertilized treatment in autumn/winter [65,66,67].
The measurement of N2O-N emissions using the closed-chamber method is widespread and, as in this work, is most commonly used for the measurement of N2O-N fluxes. However, the high temporal and spatial variability of nitrous oxide formation in soils represents a major methodological problem [68]. Lammirato et al. [69] state that the natural spatial variability of fluxes measured in repeated plots of the same treatment using the closed-chamber method is considerable, making it difficult to identify statistically significant differences in emissions between different fertilized treatments [69]. This problem becomes more apparent when N2O fluxes are high, since the spatial variability of fluxes appears to be positively correlated with the magnitude of the fluxes [70]. It is also necessary to consider the temporal variability of N2O fluxes. According to Reeves and Wang [49], the most efficient sampling schedule is weekly, with an increased sampling frequency after heavy rainfall events. Nevertheless, not all N2O emission peaks can be reliably detected, which may influence the results.
Above all, the large number of factors and their interactions that influence the formation of nitrous oxide in arable soils represent a major challenge when modeling N2O fluxes and deriving mitigation strategies [71]. Therefore, in addition to modeling N2O fluxes, such as with the GNOC method, measurements in the field under practical conditions are still essential [72,73]. N2O measurements from field experiments are also used to validate soil process models and to test N2O emission factors [73].
Digestate fertilization (DD treatment) significantly increased crop yields, ranging from a 53% increase in 2019 to an 83% increase in 2022 compared to the unfertilized control (00 treatment). This substantial yield improvement is attributed to the high and repeated applications of digestate, which supplied up to 265 kg N ha−1 yr−1, including 129 kg NH4+-N ha−1 yr−1 in 2020. These results are consistent with previous studies showing similar crop yield increases after digestate fertilization in long-term field experiments and conventional farms [22,23,29,30,74].
The treatment fertilized for the first time (0D) did not reach the yield level of the long-term fertilized treatment (DD). The yield difference was 0.5 to 1.2 Mg ha−1 or 6% to 15%, although it was only significant in 2019. Fouda et al. (2011) showed that biogas digestate fertilization results in increases in SOC and total N. This also assumes that the plant-available N in the digestate is at least equal to the proportion of NH4+-N and that the fertilizer effect is therefore very good even in the first year [75].
The experimental data demonstrate the after-effect of fertilization, which is related to soil N accumulation due to the organic N added with the digestate, that can lead to increased N mineralization in the long term [76]. The after-effect of long-term fertilization with biogas digestate has not yet been investigated under field conditions. Our results show higher yields of D0 treatment than 00 treatment and slightly higher N2O-N emissions, although these were not always significant. As the fertilizer has been added for years, the SOC and SON accumulate and thus results in an increased N mineralization potential [77].
The relevant weather conditions for the yield formation of winter wheat were favorable in 2019 and 2022, but unfavorable with pronounced dry periods in April and May 2020, which is a critical period for the biomass development of wheat [78]. This is reflected not only in low yields in 2020, but also in a very high N surplus of up to 133 kg ha−1, indicating a high N loss potential. The highest N2O-N emissions in the vegetation period were also measured in this year. With the increase in temperature from the beginning of April, there is also an increase in nitrous oxide emissions in 2020. At this time, maximum nitrous oxide fluxes occur when dry soils are rewetted [79,80].
The increase in N2O-N emissions post-harvest and subsequent tillage was observed in three trial years. Previous studies have also reported increasing N2O emissions post-harvest due to higher SOC availability triggered by the incorporation of crop residues during soil tillage [81,82,83]. In some studies, N2O emissions after the wheat harvest accounted for up to 50% of the total annual N2O emissions [83]. Stubble tillage and precipitation often results in good conditions for the mineralization of crop residues and soil organic N, which can lead to an increase in soil NH4+ and NO3− stocks as well as N2O emissions [84,85]. An increase in soil mineral N stocks after the wheat harvest was observed in all treatments (including the 00 treatment). Nevertheless, post-harvest N2O-N emissions were the lowest in the control treatment 00 (significant differences in 2020 and 2021).
The N balance for the fertilized treatments showed high N surpluses in some years. The significantly higher TN contents of the long-term fertilized treatments (Table 1) suggests that a significant portion of N not taken up by plants was stored in the soil rather than emitted into the environment. Particularly, this is relevant for interpreting the N balance data, where unfertilized treatments tend to underestimate emissions and fertilized treatments may overestimate them, as seen in 2021 and 2022. However, in 2020, emissions were higher due to the high N2O-N fluxes caused by digestate application, emphasizing the influence of site-specific and crop rotation factors on emission potential. Site-specific conditions such as soil properties and weather conditions are mutually dependent and influence N2O emissions. These findings are corroborated by measurements in different maize treatments within the same experiment [86].
The GNOC model underestimated the N2O emissions for the unfertilized treatments. The N2O emissions of the fertilized treatments were overestimated in 2021 and 2022. In 2020, the measured N2O emissions were higher than the modelled N2O emissions. In 2022, high winter emissions were detected for the 00 treatment resulting in high N2O-N emissions in 0D. This shows again that site and weather conditions as well as crop rotation and agronomic management have a high impact on emissions and can exceed fertilizer-induced emissions. This is also confirmed by measurements in the same experiment in different maize treatments [86].
For further investigations, it must be taken into account that biogas digestate contains organic C compounds that are recalcitrant, but also rapidly degradable compounds that contribute to humus and SOC accumulation [87,88]. Levin et al. (2021) and Simon (2021) found close relationships between digestate input and SOC and N stocks in the same field trial [38,39]. Since C and N cycles are closely linked [89], the SOC influences the N turnover in soil [90] and hence the production of nitrous oxide.
5. Conclusions
The study found that digestate fertilization significantly increased area-related N2O emissions compared to unfertilized treatments, but did not increase product-related emissions. The results indicate that the integration of a biogas plant and the application of biogas digestate are suitable measures for organic farming, despite the N2O losses from digestate fertilization. It was shown that N2O emissions are not only the result of fertilization, but also can be caused by previous crops, tillage, and post-harvest management and vary significantly depending on the weather conditions and annual effects. Further investigations should consider C sequestration by the digestate and examine whether this can offset N2O emissions.
The extensive data set can be used to calibrate and validate models for analyzing greenhouse gas fluxes. The authors intend to publish the data set and thus make it accessible to the scientific community.
Author Contributions
Conceptualization, F.W., H.S. and K.-J.H.; methodology, F.W.; validation, F.W.; formal analysis, F.W.; investigation, F.W.; resources, K.-J.H. and H.S.; data curation, F.W.; writing—original draft preparation F.W.; writing—review and editing, K.-J.H. and H.S.; visualization, F.W.; supervision, K.-J.H. and H.S.; project administration, K.-J.H. and H.S.; funding acquisition, K.-J.H. and H.S. All authors have read and agreed to the published version of the manuscript.
Funding
This research was funded by Bundesministerium für Ernährung und Landwirtschaft, FNR FKZ 22025917.
Data Availability Statement
The raw data supporting the conclusions of this article will be made available by the authors on request.
Acknowledgments
The authors would like to thank Stefan Kimmelmann and Florian Schmid for managing the long-term experiment and for all the technical help. Another thank you goes to the laboratory team and the research assistants, without whose support such an extensive study would not have been possible. Many thanks to Benedikt Winkhart for brotherly and scientific advice.
Conflicts of Interest
The authors declare that they have no known competing financial interests or personal relationships that could have appeared to influence the work reported in this paper.
Appendix A
Table A1.
Date of fertilization and N application rate.
Table A1.
Date of fertilization and N application rate.
| Date | 26 March 2019 | 26 April 2019 | 23 March 2020 | 23 April 2020 | 31 March 2021 | 29 April 2021 | 14 March 2022 | 28 April 2022 |
|---|---|---|---|---|---|---|---|---|
| Treatment * | BBCH 20/21 | BBCH 30/31 | BBCH 20/21 | BBCH 30/31 | BBCH 20/21 | BBCH 30/31 | BBCH 20/21 | BBCH 30/31 |
| 00 | - | - | - | - | - | - | - | - |
| D0 | - | - | - | - | - | - | - | - |
| 0D [kg ha−1] | 116.7 | 116.7 | 132.3 | 132.3 | 114.4 | 114.4 | 111.6 | 111.6 |
| DD [kg ha−1] | 116.7 | 116.7 | 132.3 | 132.3 | 114.4 | 114.4 | 111.6 | 111.6 |
* 00 long-term unfertilized, D0 first-time unfertilized, 0D first-time fertilized, and DD long-term fertilized.
Table A2.
Different phases of the vegetation of winter wheat in four years with exact dates.
Table A2.
Different phases of the vegetation of winter wheat in four years with exact dates.
| Autumn and Winter | Spring and Summer | Fertilization until Harvest | Post-Harvest | Whole Year | |
|---|---|---|---|---|---|
| 2019 | 26 March 2019–03 September 2019 (161 days) | 26 March 2019–24 July 2019 (120 days) | 24 July 2019–03 September 2019 (41 days) | ||
| 2020 | 14 October 2019–24 March 2020 (162 days) | 24 March 2020–25 August 2020 (154 days) | 24 March 2020–28 July 2020 (126 days) | 28 July 2020– 25 August 2020 (28 days) | 14 October 2019–28 July 2020 (288 days) |
| 2021 | 20 October 2020–30 March 2021 (161 days) | 01 April 2021–26 August 2021 (147 days) | 01 April 2021–27 July 2021 (117 days) | 27 July 2021–26 August 2021 (30 days) | 20 October 2020–27 July 2021 (280 days) |
| 2022 | 09 November 2021–14 March 2022 (125 days) | 14 March 2022–16 August 2022 (155 days) | 14 March 2022–20 July 2022 (128 days) | 21 July 2022–16 August 2022 (26 days) | 09 November 2021–20 July 2022 (253 day) |
References
- Meyer, A.K.P.; Ehimen, E.A.; Holm-Nielsen, J.B. Future European biogas: Animal manure, straw and grass potentials for a sustainable European biogas production. Biomass Bioenergy 2018, 111, 154–164. [Google Scholar] [CrossRef]
- Theuerl, S.; Herrmann, C.; Heiermann, M.; Grundmann, P.; Landwehr, N.; Kreidenweis, U.; Prochnow, A. The Future Agricultural Biogas Plant in Germany: A Vision. Energies 2019, 12, 396. [Google Scholar] [CrossRef]
- Paolini, V.; Petracchini, F.; Segreto, M.; Tomassetti, L.; Naja, N.; Cecinato, A. Environmental impact of biogas: A short review of current knowledge. J. Environ. Sci. Health Part A 2018, 53, 899–906. [Google Scholar] [CrossRef] [PubMed]
- Carter, M.S.; Hauggaard-Nielsen, H.; Heiske, S.; Jensen, M.; Thomsen, S.T.; Schmidt, J.E.; Johansen, A.; Ambus, P. Consequences of field N2O emissions for the environmental sustainability of plant-based biofuels produced within an organic farming system. GCB Bioenergy 2012, 4, 435–452. [Google Scholar] [CrossRef]
- Tilche, A.; Galatola, M. The potential of bio-methane as bio-fuel/bio-energy for reducing greenhouse gas emissions: A qualitative assessment for Europe in a life cycle perspective. Water Sci. Technol. 2008, 57, 1683–1692. [Google Scholar] [CrossRef] [PubMed]
- Cayuela, M.L.; Kuikman, P.J.; Oenema, O.; Bakker, R.R.; Groeningen, J.W. Bioenergy residues as soil amendments: Climate-relevant C and N dynamics during decomposition. In Proceedings of the 2010 19th World Congress of Soil Science, Soil Solutions for a Changing World, Brisbane, Australia, 1–6 August 2010. [Google Scholar]
- Dittert, K.; Senbayram, M.; Wienforth, B.; Kage, H.; Muehling, K.H. Greenhouse gas emissions in biogas production systems. In Proceedings of the International Plant Nutrition Colloquium XVI, Sacramento, CA, USA, 26–30 August 2009. [Google Scholar]
- Cayuela, M.L.; Oenema, O.; Kuikman, P.J.; Bakker, R.R.; van Groenigen, J.W. Bioenergy by-products as soil amendments? Implications for carbon sequestration and greenhouse gas emissions. GCB Bioenergy 2010, 84, 201–213. [Google Scholar] [CrossRef]
- Panuccio, M.R.; Papalia, T.; Attinà, E.; Giuffrè, A.; Muscolo, A. Use of digestate as an alternative to mineral fertilizer: Effects on growth and crop quality. Arch. Agron. Soil Sci. 2019, 65, 700–711. [Google Scholar] [CrossRef]
- Baral, K.R.; Labouriau, R.; Olesen, J.E.; Petersen, S.O. Nitrous oxide emissions and nitrogen use efficiency of manure and digestates applied to spring barley. Agric. Ecosyst. Environ. 2017, 239, 188–198. [Google Scholar] [CrossRef]
- NOAA. Trends in Atmospheric Nitrous Oxide (N2O): Global Monitoring Laboratory. Available online: https://gml.noaa.gov/ccgg/trends_n2o/ (accessed on 29 July 2024).
- Tian, H.; Xu, R.; Canadell, J.G.; Thompson, R.L.; Winiwarter, W.; Suntharalingam, P.; Davidson, E.A.; Ciais, P.; Jackson, R.B.; Janssens-Maenhout, G.; et al. A comprehensive quantification of global nitrous oxide sources and sinks. Nature 2020, 586, 248–256. [Google Scholar] [CrossRef]
- Butterbach-Bahl, K.; Baggs, E.M.; Dannenmann, M.; Kiese, R.; Zechmeister-Boltenstern, S. Nitrous oxide emissions from soils: How well do we understand the processes and their controls? Philos. Trans. R. Soc. Lond. Ser. B Biol. Sci. 2013, 368, 20130122. [Google Scholar] [CrossRef]
- Hassan, M.U.; Aamer, M.; Mahmood, A.; Awan, M.I.; Barbanti, L.; Seleiman, M.F.; Bakhsh, G.; Alkharabsheh, H.M.; Babur, E.; Shao, J.; et al. Management Strategies to Mitigate N2O Emissions in Agriculture. Life 2022, 12, 439. [Google Scholar] [CrossRef] [PubMed]
- Wang, C.; Amon, B.; Schulz, K.; Mehdi, B. Factors That Influence Nitrous Oxide Emissions from Agricultural Soils as Well as Their Representation in Simulation Mod Different letters indicate significant differences (Tukey test, p < 0.05).els: A Review. Agronomy 2021, 11, 770. [Google Scholar] [CrossRef]
- Dietrich, M.; Fongen, M.; Foereid, B. Greenhouse gas emissions from digestate in soil. Int. J. Recycl. Org. Waste Agric. 2020, 9, 1–19. [Google Scholar] [CrossRef]
- Eickenscheidt, T.; Freibauer, A.; Heinichen, J.; Augustin, J.; Drösler, M. Short-term effects of biogas digestate and cattle slurry application on greenhouse gas emissions affected by N availability from grasslands on drained fen peatlands and associated organic soils. Biogeosciences 2014, 11, 6187–6207. [Google Scholar] [CrossRef]
- Häfner, F.; Ruser, R.; Claß-Mahler, I.; Möller, K. Field Application of Organic Fertilizers Triggers N2O Emissions from the Soil N Pool as Indicated by 15N-Labeled Digestates. Front. Sustain. Food Syst. 2021, 4, 614349. [Google Scholar] [CrossRef]
- Fiedler, S.R.; Augustin, J.; Wrage-Mönnig, N.; Jurasinski, G.; Gusovius, B.; Glatzel, S. Potential short-term losses of N2O and N2 from high concentrations of biogas digestate in arable soils. SOIL 2017, 3, 161–176. [Google Scholar] [CrossRef]
- Heintze, G. N2O and CH4-emissions from energy crops—Can the use of organic fertilizers in form of biogas digestate be considered as a real alternative? Results from a three and a half year multi-site field study of energy crops fertilized with biogas digestate in so. In Proceedings of the EGU General Assembly 2016, Vienna, Austria, 17–22 April 2016. EPSC2016-16852. [Google Scholar]
- Köster, J.R.; Cárdenas, L.M.; Bol, R.; Lewicka-Szczebak, D.; Senbayram, M.; Well, R.; Giesemann, A.; Dittert, K. Anaerobic digestates lower N2O emissions compared to cattle slurry by affecting rate and product stoichiometry of denitrification—An N2O isotopomer case study. Soil Biol. Biochem. 2015, 84, 65–74. [Google Scholar] [CrossRef]
- Serdjuk, M.; Bodmer, U.; Hülsbergen, K.-J. Integration of biogas production into organic arable farming systems: Crop yield response and economic effects. Org. Agric. 2018, 8, 301–314. [Google Scholar] [CrossRef]
- Gissén, C.; Prade, T.; Kreuger, E.; Nges, I.A.; Rosenqvist, H.; Svensson, S.-E.; Lantz, M.; Mattsson, J.E.; Börjesson, P.; Björnsson, L. Comparing energy crops for biogas production—Yields, energy input and costs in cultivation using digestate and mineral fertilisation. Biomass Bioenergy 2014, 64, 199–210. [Google Scholar] [CrossRef]
- Stinner, W.; Möller, K.; Leithold, G.; Heß, J.; Rahmann, G. Biogaserzeugung im viehlosen Betrieb: Effekte auf Stickstoffmanagement, Erträge und Qualität. In Ende der Nische, Beiträge zur 8. Wissenschaftstagung Ökologischer LandbauI; Kassel University Press GmbH: Kassel, Germany, 2005. [Google Scholar]
- Stinner, W.; Möller, K.; Leithold, G. Effects of biogas digestion of clover/grass-leys, cover crops and crop residues on nitrogen cycle and crop yield in organic stockless farming systems. Eur. J. Agron. 2008, 29, 125–134. [Google Scholar] [CrossRef]
- Siegmeier, T.; Blumenstein, B.; Möller, D. Farm biogas production in organic agriculture: System implications. Agric. Syst. 2015, 139, 196–209. [Google Scholar] [CrossRef]
- The European Parliament and the Council of the European Council. Regulation (EU) 2018/848 of the European Parliament and of the Council of 30 May 2018 on Organic. Available online: https://eur-lex.europa.eu/eli/reg/2018/848/oj (accessed on 2 August 2024).
- Nkoa, R. Agricultural benefits and environmental risks of soil fertilization with anaerobic digestates: A review. Agron. Sustain. Dev. 2014, 34, 473–492. [Google Scholar] [CrossRef]
- Pampillón-González, L.; Luna-Guido, M.; Ruíz-Valdiviezo, V.M.; Franco-Hernández, O.; Fernández-Luqueño, F.; Pareds-López, O.; Hernández, G.; Dendooven, L. Greenhouse Gas Emissions and Growth of Wheat Cultivated in Soil Amended with Digestate from Biogas Production. Pedosphere 2017, 27, 318–327. [Google Scholar] [CrossRef]
- Barłóg, P.; Hlisnikovský, L.; Kunzová, E. Yield, content and nutrient uptake by winter wheat and spring barley in response to applications of digestate, cattle slurry and NPK mineral fertilizers. Arch. Agron. Soil Sci. 2019, 66, 1481–1496. [Google Scholar] [CrossRef]
- Möller, K.; Müller, T. Effects of anaerobic digestion on digestate nutrient availability and crop growth: A review. Eng. Life Sci. 2012, 12, 242–257. [Google Scholar] [CrossRef]
- Möller, K.; Stinner, W.; Deuker, A.; Leithold, G. Effects of different manuring systems with and without biogas digestion on nitrogen cycle and crop yield in mixed organic dairy farming systems. Nutr. Cycl. Agroecosyst. 2008, 82, 209–232. [Google Scholar] [CrossRef]
- Alburquerque, J.A.; de La Fuente, C.; Bernal, M.P. Chemical properties of anaerobic digestates affecting C and N dynamics in amended soils. Agric. Ecosyst. Environ. 2012, 160, 15–22. [Google Scholar] [CrossRef]
- Shi, L.; Simplicio, W.S.; Wu, G.; Hu, Z.; Hu, H.; Zhan, X. Nutrient Recovery from Digestate of Anaerobic Digestion of Livestock Manure: A Review. Curr. Pollut. Rep. 2018, 4, 74–83. [Google Scholar] [CrossRef]
- Buchen-Tschiskale, C.; Hagemann, U.; Augustin, J. Soil incubation study showed biogas digestate to cause higher and more variable short-term N2O and N2 fluxes than mineral-N. J. Plant Nutr. Soil Sci. 2020, 183, 208–219. [Google Scholar] [CrossRef]
- van Midden, C.; Harris, J.; Shaw, L.; Sizmur, T.; Pawlett, M. The impact of anaerobic digestate on soil life: A review. Appl. Soil Ecol. 2023, 191, 105066. [Google Scholar] [CrossRef]
- Möller, K. Effects of anaerobic digestion on soil carbon and nitrogen turnover, N emissions, and soil biological activity. A review. Agron. Sustain. Dev. 2015, 35, 1021–1041. [Google Scholar] [CrossRef]
- Simon, A. Langzeitwirkungen von Gärresten in Energiepflanzenfruchtfolgen auf Bodeneigenschaften und Bodenprozesse unter den Bedingungen des Ökologischen Landbaus. Ph.D. Thesis, Verlag Dr. Köster, Berlin, Germany, 2021. [Google Scholar]
- Levin, K.S.; Auerswald, K.; Reents, H.J.; Hülsbergen, K.-J. Effects of Organic Energy Crop Rotations and Fertilisation with the Liquid Digestate Phase on Organic Carbon in the Topsoil. Agronomy 2021, 11, 1393. [Google Scholar] [CrossRef]
- DüV. Düngeverordnung: Verordnung über die Anwendung von Düngemitteln, Bodenhilfsstoffen, Kultursubstraten und Pflanzenhilfsmitteln nach den Grundsätzen der Guten Fachlichen Praxis beim Düngen; DüV: Berlin, Germany, 2017. [Google Scholar]
- AHDB Cereals & Oilseeds. The Growth Stages of Cereals. Available online: https://ahdb.org.uk/knowledge-library/the-growth-stages-of-cereals (accessed on 13 April 2024).
- Vdlufa. Die Chemische Untersuchung von Futtermitteln: Eine Dokumentation; VDLUFA-Verl.: Darmstadt, Germany, 2013; ISBN 9783941273146. [Google Scholar]
- Kays, S.E.; Barton, F.E.; Windham, W.R. Predicting Protein Content by near Infrared Reflectance Spectroscopy in Diverse Cereal Food Products. J. Near Infrared Spectrosc. 2000, 8, 35–43. [Google Scholar] [CrossRef]
- Schmidt, C.; Timmermann, F. Bestimmung löslicher N-Fraktionen des Bodens in Abhängigkeit von Probenvorbereitung und Extraktionsverfahren. VDLUFA-Kongr.b. 1988, 28, 517–526. [Google Scholar]
- Prücklmaier, J.X. Feldexperimentelle Analysen zur Ertragsbildung und Stickstoffeffizienz bei Organisch-Mineralischer Düngung auf Heterogenen Standorten und Möglichkeiten zur Effizienzsteigerung durch Computer- und Sensorgestützte Düngesysteme. Ph.D. Thesis, Technische Universität München, Munich, Germany, 2020. [Google Scholar]
- Hutchinson, G.L.; Mosier, A.R. Improved Soil Cover Method for Field Measurement of Nitrous Oxide Fluxes. Soil Sci. Soc. Am. J. 1981, 45, 311–316. [Google Scholar] [CrossRef]
- De Klein, C.; Harvey, M. Nitrous Oxide Chamber Methodology Guidelines; Version 1.1 Global Research Alliance on Agricultural Greenhous Gas Emissions; Ministry for Primary Industries: Wellington, New Zealand, 2015. [Google Scholar]
- Cosentino, V.; Fernandez, P.; Aureggi, S.; Taboada, M. N2O emissions from a cultivated mollisol: Optimal time of day for sampling and the role of soil temperature. Rev. Bras. Ciência Solo 2012, 36, 1814–1819. [Google Scholar] [CrossRef]
- Reeves, S.; Wang, W. Optimum sampling time and frequency for measuring N2O emissions from a rain-fed cereal cropping system. Sci. Total Environ. 2015, 530–531, 219–226. [Google Scholar] [CrossRef] [PubMed]
- Fuß, R. Greenhouse Gas Flux Calculation from Chamber Measurements, Package for R, Version 0.4-2; 2019. Available online: https://cran.r-project.org/web/packages/gasfluxes/gasfluxes.pdf (accessed on 15 June 2024).
- van Groenigen, J.W.; Velthof, G.L.; Oenema, O.; van Groenigen, K.J.; van Kessel, C. Towards an agronomic assessment of N2O emissions: A case study for arable crops. Eur. J. Soil Sci. 2010, 61, 903–913. [Google Scholar] [CrossRef]
- Dobbie, K.E.; McTaggart, I.P.; Smith, K.A. Nitrous oxide emissions from intensive agricultural systems: Variations between crops and seasons, key driving variables, and mean emission factors. J. Geophys. Res. Atmos. 1999, 104, 26891–26899. [Google Scholar] [CrossRef]
- Shen, J.; Treu, R.; Wang, J.; Nicholson, F.; Bhogal, A.; Thorman, R. Modeling nitrous oxide emissions from digestate and slurry applied to three agricultural soils in the United Kingdom: Fluxes and emission factors. Environ. Pollut. 2018, 243, 1952–1965. [Google Scholar] [CrossRef]
- Thomas, B.W.; Hao, X. Nitrous Oxide Emitted from Soil Receiving Anaerobically Digested Solid Cattle Manure. J. Environ. Qual. 2017, 46, 741–750. [Google Scholar] [CrossRef] [PubMed]
- Stehfest, E.; Bouwman, L. N2O and NO emission from agricultural fields and soils under natural vegetation: Summarizing available measurement data and modeling of global annual emissions. Nutr. Cycl. Agroecosystems 2006, 74, 207–228. [Google Scholar] [CrossRef]
- Kuznetsova, A.; Brockhoff, P.B.; Christensen, R.H.B. lmerTest Package: Tests in Linear Mixed Effects Models. J. Stat. Soft. 2017, 82, 1–26. [Google Scholar] [CrossRef]
- Mayerová, M.; Šimon, T.; Stehlík, M.; Madaras, M.; Koubová, M.; Smatanová, M. Long-term application of biogas digestate improves soil physical properties. Soil Tillage Res. 2023, 231, 105715. [Google Scholar] [CrossRef]
- Skinner, C.; Gattinger, A.; Krauss, M.; Krause, H.M.; Mayer, J.; Van Der Heijden, M.G.; Mäder, P. The impact of long-term organic farming on soil-derived greenhouse gas emissions. Sci. Rep. 2019, 9, 1702. [Google Scholar] [CrossRef]
- Zhou, M.; Zhu, B.; Wang, X.; Wang, Y. Long-term field measurements of annual methane and nitrous oxide emissions from a Chinese subtropical wheat-rice rotation system. Soil Biol. Biochem. 2017, 115, 21–34. [Google Scholar] [CrossRef]
- Odlare, M.; Arthurson, V.; Pell, M.; Svensson, K.; Nehrenheim, E.; Abubaker, J. Land application of organic waste—Effects on the soil ecosystem. Appl. Energy 2011, 88, 2210–2218. [Google Scholar] [CrossRef]
- Niggli, U.; Fließbach, A.; Hepperly, P.; Scialabba, N. Low Greenhouse Gas Agriculture: Mitigation and Adaptation Potential of Sustainable Farming Systems; FAO: Rome, Italy, 2009; Volume 141. [Google Scholar]
- Braun, M.; Schmid, H.; Grundler, T.; Hülsbergen, K.-J. Root-and-shoot growth and yield of different grass–clover mixtures. Plant Biosyst. Int. J. Deal. All Asp. Plant Biol. 2010, 144, 414–419. [Google Scholar] [CrossRef]
- Pappa, V.A.; Rees, R.M.; Watson, C.A.; Atkinson, C.; Ball, B.; Davies, D.H.K.; Rees, R.; Russell, G.; Stockdale, E.A.; Walker, R.; et al. Nitrogen transfer between clover and wheat in an intercropping experiment. In Aspects of Applied Biology 79, What Will Organic Farming Deliver? COR 2006; Association of Applied Biologists: Wellesbourne, UK, 2006. [Google Scholar]
- Oberson, A.; Frossard, E.; Bühlmann, C.; Mayer, J.; Mäder, P.; Lüscher, A. Nitrogen fixation and transfer in grass-clover leys under organic and conventional cropping systems. Plant Soil 2013, 371, 237–255. [Google Scholar] [CrossRef]
- Bleken, M.A.; Rittl, T.F.; Nadeem, S.; Hansen, S. Roots and other residues from leys with or without red clover: Quality and effects on N2O emission factors in a partly frozen soil following autumn ploughing. Sci. Total Environ. 2022, 831, 154582. [Google Scholar] [CrossRef] [PubMed]
- Niether, W.; Macholdt, J.; Schulz, F.; Gattinger, A. Yield dynamics of crop rotations respond to farming type and tillage intensity in an organic agricultural long-term experiment over 24 years. Field Crops Res. 2023, 303, 109131. [Google Scholar] [CrossRef]
- Brozyna, M.A.; Petersen, S.O.; Chirinda, N.; Olesen, J.E. Effects of grass-clover management and cover crops on nitrogen cycling and nitrous oxide emissions in a stockless organic crop rotation. Agric. Ecosyst. Environ. 2013, 181, 115–126. [Google Scholar] [CrossRef]
- Jungkunst, H.F.; Freibauer, A.; Neufeldt, H.; Bareth, G. Nitrous oxide emissions from agricultural land use in Germany—A synthesis of available annual field data. J. Plant Nutr. Soil Sci. 2006, 169, 341–351. [Google Scholar] [CrossRef]
- Lammirato, C.; Lebender, U.; Tierling, J.; Lammel, J. Analysis of uncertainty for N2O fluxes measured with the closed-chamber method under field conditions: Calculation method, detection limit, and spatial variability. J. Plant Nutr. Soil Sci. 2018, 181, 78–89. [Google Scholar] [CrossRef]
- Morris, S.G.; Kimber, S.W.L.; Grace, P.; van Zwieten, L. Improving the statistical preparation for measuring soil N2O flux by closed chamber. Sci. Total Environ. 2013, 465, 166–172. [Google Scholar] [CrossRef] [PubMed]
- Signor, D.; Cerri, C.E.P. Nitrous oxide emissions in agricultural soils: A review. Pesqui. Agropecu. Trop. 2013, 43, 322–338. [Google Scholar] [CrossRef]
- Brown, S.E.; Wagner-Riddle, C. Assessment of random errors in multi-plot nitrous oxide flux gradient measurements. Agric. For. Meteorol. 2017, 242, 10–20. [Google Scholar] [CrossRef]
- Rees, R.M.; Augustin, J.; Alberti, G.; Ball, B.C.; Boeckx, P.; Cantarel, A.; Castaldi, S.; Chirinda, N.; Chojnicki, B.; Giebels, M.; et al. Nitrous oxide emissions from European agriculture; an analysis of variability and drivers of emissions from field experiments. Biogeosciences 2013, 10, 2671–2682. [Google Scholar] [CrossRef]
- Simon, R.O.; Hülsbergen, K.-J. Energy Balance and Energy Use Efficiency of Annual Bioenergy Crops in Field Experiments in Southern Germany. Agronomy 2021, 11, 1835. [Google Scholar] [CrossRef]
- Fouda, S. Nitrogen Availability of Biogas Residues. Ph.D. Thesis, Technische Universität München, München, Germany, 2011. [Google Scholar]
- Zilio, M.; Pigoli, A.; Rizzi, B.; Goglio, A.; Tambone, F.; Giordano, A.; Maretto, L.; Squartini, A.; Stevanato, P.; Meers, E.; et al. Nitrogen dynamics in soils fertilized with digestate and mineral fertilizers: A full field approach. Sci. Total Environ. 2023, 868, 161500. [Google Scholar] [CrossRef]
- Fouda, S.; von Tucher, S.; Lichti, F.; Schmidhalter, U. Nitrogen availability of various biogas residues applied to ryegrass. J. Plant Nutr. Soil Sci. 2013, 176, 572–584. [Google Scholar] [CrossRef]
- Li, J.; Dong, W.; Oenema, O.; Chen, T.; Hu, C.; Yuan, H.; Zhao, L. Irrigation reduces the negative effect of global warming on winter wheat yield and greenhouse gas intensity. Sci. Total Environ. 2019, 646, 290–299. [Google Scholar] [CrossRef] [PubMed]
- Ruser, R.; Flessa, H.; Russow, R.; Schmidt, G.; Buegger, F.; Munch, J.C. Emission of N2O, N2 and CO2 from soil fertilized with nitrate: Effect of compaction, soil moisture and rewetting. Soil Biol. Biochem. 2006, 38, 263–274. [Google Scholar] [CrossRef]
- Xiong, Z.-Q.; Xing, G.-X.; Zhu, Z.-L. Nitrous Oxide and Methane Emissions as Affected by Water, Soil and Nitrogen. Pedosphere 2007, 17, 146–155. [Google Scholar] [CrossRef]
- Baggs, E.M.; Rees, R.M.; Smith, K.A.; Vinten, A.J.A. Nitrous oxide emission from soils after incorporating crop residues. Soil Use Manag. 2000, 16, 82–87. [Google Scholar] [CrossRef]
- Flessa, H.; Potthoff, M.; Loftfield, N. Greenhouse estimates of CO2 and N2O emissions following surface application of grass mulch: Importance of indigenous microflora of mulch. Soil Biol. Biochem. 2002, 34, 875–879. [Google Scholar] [CrossRef]
- Lebender, U.; Senbayram, M.; Lammel, J.; Kuhlmann, H. Impact of mineral N fertilizer application rates on N2O emissions from arable soils under winter wheat. Nutr. Cycl. Agroecosystems 2014, 100, 111–120. [Google Scholar] [CrossRef]
- Lebender, U.; Senbayram, M.; Lammel, J.; Kuhlmann, H. Effect of mineral nitrogen fertilizer forms on N2O emissions from arable soils in winter wheat production. J. Plant Nutr. Soil Sci. 2014, 177, 722–732. [Google Scholar] [CrossRef]
- Guardia, G.; Aguilera, E.; Vallejo, A.; Álvaro-Fuentes, J.; Cantero-Martínez, C.; Sanz-Cobena, A.; Barton, L.; Volpi, I.; Ibáñez, M.Á. Contribution of the postharvest period to soil N2O emissions from arable Mediterranean crops. J. Clean. Prod. 2024, 469, 143186. [Google Scholar] [CrossRef]
- Winkhart, F.; Mösl, T.; Schmid, H.; Hülsbergen, K.-J. Effects of Organic Maize Cropping Systems on Nitrogen Balances and Nitrous Oxide Emissions. Agriculture 2022, 12, 907. [Google Scholar] [CrossRef]
- Wiesmeier, M.; Poeplau, C.; Sierra, C.A.; Maier, H.; Frühauf, C.; Hübner, R.; Kühnel, A.; Spörlein, P.; Geuß, U.; Hangen, E.; et al. Projected loss of soil organic carbon in temperate agricultural soils in the 21st century: Effects of climate change and carbon input trends. Sci. Rep. 2016, 6, 32525. [Google Scholar] [CrossRef] [PubMed]
- Wiesmeier, M.; Mayer, S.; Burmeister, J.; Hübner, R.; Kögel-Knabner, I. Feasibility of the 4 per 1000 initiative in Bavaria: A reality check of agricultural soil management and carbon sequestration scenarios. Geoderma 2020, 369, 114333. [Google Scholar] [CrossRef]
- Thornton, P.E.; Lamarque, J.-F.; Rosenbloom, N.A.; Mahowald, N.M. Influence of carbon-nitrogen cycle coupling on land model response to CO2 fertilization and climate variability. Glob. Biogeochem. Cycles 2007, 21, GB4018. [Google Scholar] [CrossRef]
- Barrett, J.E.; Burke, I.C. Potential nitrogen immobilization in grassland soils across a soil organic matter gradient. Soil Biol. Biochem. 2000, 32, 1707–1716. [Google Scholar] [CrossRef]

Disclaimer/Publisher’s Note: The statements, opinions and data contained in all publications are solely those of the individual author(s) and contributor(s) and not of MDPI and/or the editor(s). MDPI and/or the editor(s) disclaim responsibility for any injury to people or property resulting from any ideas, methods, instructions or products referred to in the content. |
© 2024 by the authors. Licensee MDPI, Basel, Switzerland. This article is an open access article distributed under the terms and conditions of the Creative Commons Attribution (CC BY) license (https://creativecommons.org/licenses/by/4.0/).