Abstract
Plants have evolved various photosynthetic adaptations and photoprotective mechanisms to survive in fluctuating and extreme light environments. Many light-activated photosynthetic proteins and enzymes adjust to plant leaf anatomy and leaf pigments to facilitate these processes. Under excessive amounts of light, plants use non-photochemical quenching (NPQ) mechanisms to dissipate excess absorbed light energy as heat to prevent photoinhibition and, therefore, mitigate damage to the plant’s photosystems. In this study, we examined photosynthetic adaptations to the light environment in common beans using representative genotypes of the Andean (Calima) and the Mesoamerican (Jamapa) gene pools. We estimated their leaf chlorophyll fluorescence characteristics using dark- and light-adapted mature leaves from three-week-old plants. Our results indicated a higher chlorophyll fluorescence of the light-adapted leaves in the Mesoamerican genotype. NPQ induction was early and extended in the Andean genotype. A similar response in the Mesoamerican counterpart required high light intensity (≥1500 PAR). The NPQ relaxation was rapid in the Mesoamerican genotype (t1/2: 6.76 min) but sluggish in the Andean genotype (t1/2: 9.17 min). These results indicated variable adaptation to light environments between the two common bean genotypes and suggested different strategies for surviving fluctuating light environments that can be exploited for developing plants with environmentally efficient photosynthesis under light limitations.
1. Introduction
Photosynthesis converts light energy into chemical energy, enabling plants to grow and develop [1,2,3]. Plants have evolved adaptation strategies that enable them to grow under a range of light intensities, from forest understories to full-sunlight environments. However, even within the different light-intensity niches, plants experience fluctuating light conditions over short periods of time. Thus, plants have also evolved complex dynamic mechanisms to cope with dynamic light environments, such as sunflecks in the forest understory or passing clouds in open vegetation. The main photoprotective mechanism to deal with an excess of light energy is called non-photochemical quenching (NPQ). This mechanism dissipates absorbed light energy as heat, preventing the destruction of the photosynthetic apparatus by unutilized light energy [2,3,4,5,6].
In organisms that carry out oxygenic photosynthesis, light-harvesting complexes transfer electronic excitation to the reaction centers of photosystem II (PSII) and photosystem I (PSI). At PSII, water is oxidized on the lumen side of the thylakoid, yielding molecular oxygen and protons which create a pH gradient across the thylakoid membrane. The electrons from this reaction feed the photosynthetic electron transport chain (PETC), reducing the acceptor Q and subsequently the Cyt b6f complex. This complex is oxidized by the reaction center of photosystem I (RCI), resulting in additional accumulation of protons in the lumen and driving ATP synthesis [7]. If the supply of light energy exceeds the ability of the photosynthetic apparatus to use it, the excess of energy can cause damage to the photosynthetic infrastructure, leading to photoinhibition [1,3].
Photoinhibition of PSI and PSII occurs, though their mechanisms and frequency differ [1]. Photoinhibition of PSI occurs when the supply of electrons from PSII exceeds the accepting capacity of PSI [1,8]. Unlike photoinhibition of PSII, this happens much less frequently, as damage or successful photoprotection of PSII reduces the amount of electrons transferred to PSI [1,9]. While plants possess effective repair mechanisms for PSII damage, PSI repair takes hours or days and the generation of reactive oxygen species (ROS) inhibits these mechanisms as ROS deter protein synthesis [1,10]. Thus, photoprotection pathways are necessary to stop excited chlorophyll accumulation.
NPQ mechanisms generally consist of three types: energy-dependent (qE), state transitions (qT), and photoinhibition (qI) [1,3,4,6,11,12,13,14]. Energy-dependent quenching (qE) contributes up to 70–80% of NPQ [1] and can be activated or deactivated in seconds or in up to a few minutes [3,13]. Photosystem II Subunit S (PsbS) is a transmembrane thylakoid protein that senses the critical ∆pH across the thylakoid membrane and activates the VAZ cycle with the production of zeaxanthin, which has the ability to quench singlet-state chlorophyll in the peripheral light-harvesting complex II (LHCII) with the release of heat. A proton gradient across the thylakoid membrane is produced when light energy is captured. In excess light conditions, this leads to the acidification of the lumen, causing the activation of the PsbS [3,15]. The activated PsbS changes the conformation of PSII LHCII proteins, causing the LHCII to dissipate captured energy as heat instead of funneling it through the electron transport chain [1,2,3,13,16].
The state transitions qT is a slower component of the NPQ process, taking 10 to 20 min to induce or relax. It functions to equalize the energy captured by PSI and PSII [4,17]. In qT activation, the LHCII proteins are phosphorylated and migrate from PSII to PSI. The migration of the phosphorated LHCII proteins from PSII to PSI slows the electron transport from PSII to PSI [3,13,18]. Finally, photoinhibitory quenching (qI) is the slowest responding NPQ mechanism, taking up to a few hours. It comprises the photoinhibition of PSII, which is based on the photodamage of the D1 protein [3,16]. Although most effective in protecting PSI, targeted destruction of D1 proteins is a last-resort mechanism since the relaxation of qI—the repair of D1 proteins—is relatively slow and consumes large amounts of energy [3,10]. Hence, plants rely on other, much more efficient NPQ mechanisms instead of qI [3]. Nonetheless, qI is a necessary mechanism because the protection of PSI is vital, as PSI repair is even more energy-consuming and costly than PSII repair [1,8,10].
Pulsed amplitude modulation (PAM) chlorophyll-a fluorescence is a technique for measuring photosynthetic energy transduction in photosynthetic leaves that allows the estimation of photochemical and non-photochemical energy use [7,19,20,21]. The technique has been adopted in leaf fluorescence measurement instruments such as the Li-6800. The instruments used for PAM chlorophyll-a fluorescence use sets of lights, modulation light (ML), actinic light (AL), saturation light flash (SF), and a far-red light (FR) source. In these instruments, the AL, SF, and FR illumination sources are continuous, but the ML is modulated (Pulsed) [21,22]. The PAM chlorophyll-a fluorescence technique estimates the minimum and maximum chlorophyll fluorescence using select illuminations [21,22]. Modulated fluorescence (MF) is obtained in the absence of AL. The minimum fluorescence (Fo) is obtained without AL, SF, and FR [21,22]. When measured on dark-adapted leaves, Fo values obtained are absent of NPQ mechanisms because of the disengaged NPQ processes in the dark conditions [21]. ML produces very low illumination that does not activate photosynthesis, while AL activates photosynthesis and NPQ mechanisms. Hence application of SF to a leaf that is adapted to steady-state AL results in the measurement of the maximum fluorescence (Fm′) [21,22].
In dynamic light environments, the ability of crops and other plants to rapidly induce and relax NPQ is advantageous, as it minimizes damage in high-light conditions and maximizes photosynthetic capacity when light is scarce [2,5,18,23]. Meanwhile, a sluggish NPQ induction leaves the plant vulnerable to photodamage. Still, on the other hand, slow NPQ relaxation leads to dissipation of captured light energy, which persists beyond the high-light episodes. Therefore, an instance of a poorly coordinated NPQ system in crop plants limits photosynthesis efficiency, and consequently, crop yields are significantly reduced [5,24,25].
Previous studies have shown diverse photoperiod sensitivities among the Andean and the Mesoamerican common bean gene pools [26,27]. However, there is still a lack of knowledge of how the genotypes from these gene pools use light energy and tolerate extreme light fluctuations. In this study, we characterized the adaptation to fluctuating light environments and NPQ mechanisms between two contrasting common bean genotypes from the Andean (Calima) and the Mesoamerican (Jamapa) gene pools. Knowledge of such light adaptation is necessary for breeding common beans with adaptation to different light environments. Therefore, it is imperative to identify any pre-existing variabilities in adaptation to light and NPQ mechanisms in the common beans from these gene pools.
2. Materials and Methods
2.1. Plant Material
Seeds from two common bean genotypes, Calima from the Andean gene pool and Jamapa from the Mesoamerican gene pool, were germinated in 72-well nursery trays with PRO-MIX HP Mycorrhizae planting media (Premier Horticulture Ltd-Quebec-Canada). Five days following germination, seedlings were transplanted into 1-gallon pots filled with PRO-MIX HP Mycorrhizae planting media and 17 g of Osmocote (N.P.K; 18:6:12) each. Throughout the experiment, we used a sample size of fourteen plants for each of the genotypes, which were maintained in a completely randomized design (CRD) and grown at standard greenhouse conditions: 25 ± 3 °C, 60 ± 5% relative humidity (RH), and 12 h day/night periods. The rationale for selecting these genotypes was based on the fact that their contrasting morphological and photosynthetic characteristics have been documented previously [28,29,30,31]. In addition, they are the parents of a recombinant inbred family that has been extensively genotyped [32], which will facilitate the genetic dissection of photosynthetic traits that are polymorphic between these genotypes.
2.2. Dark and Light Adaptation of Leaves
Mature trifoliate leaves from 3-week-old plants were used to measure chlorophyll fluorescence. The age of the plants was selected to avoid other potential confounding effects, for instance differences in the timing of juvenility-to-maturity transitions as well as the rapid sink–source tissue relocation of photo-assimilates normally happening during reproduction. Leaves were dark-adapted by wrapping them in aluminum foil for at least 25 min before use. Light adaptation was achieved by keeping plants in light conditions of ~700 ± 100 µmol m−2s−1 PAR for ~2 h. During the light- and dark-adaptation periods, plants were maintained at ambient temperature of 25 ± 3 °C, 50 ± 2% RH, and 400 µmol mol−1 of CO2.
2.3. Chlorophyll Fluorescence on Dark-Adapted and Light-Adapted Leaves
Chlorophyll fluorescence of dark-adapted uppermost mature trifoliate leaves of three-week-old plants was measured using a Li-6800 portable photosynthetic system using the dark pulse protocol [22]. The minimum fluorescence of dark-adapted leaves was immediately measured after 25 min of dark adaptation. Then, leaves were exposed to 1000 µmol m−2s−1 PAR for 25 min before obtaining their light-adapted measurements. In addition, chlorophyll fluorescence measurements were taken on fully light-adapted leaves with at least 2 h exposure to light. In the dark-adapted measurements, the rectangular flash was configured to a red target of 8000 μmol m−2 s−1 for a duration of 1000 ms. In the light-adapted measurements, the Q_modavg, equal to the average mid-day photosynthetic active radiation (PAR) value, was set at 1000 µmol m−2s−1; while the Q_target, equal to the ambient level, was set at 1500 µmol m−2s−1.
The estimated parameters comprised Minimum fluorescence before light (Fo), Maximum fluorescence before light (Fm), Maximum quantum efficiency of PSII reaction centers of after-dark adaptation 1 − (Fo/Fm), Minimum fluorescence after light adaptation (Fo′); Maximum fluorescence after light adaptation (Fm′), Effective quantum efficiency of PSII reaction centers after light adaptation Fv′/Fm′: 1 − (Fo′/Fm′), Steady-state fluorescence (after light exposure) (Fs), Quantum efficiency of photosynthetic electron transport through PSII (PhiPS2), Quantum efficiencies of photosynthetic electron transport through CO2 assimilation (phiCO2/ΦCO2), Photochemical (qP) quenching coefficient, Non-photochemical (qN) quenching coefficient, The proportion of open reaction centers (qL) under varying light, non-photochemical quenching (NPQ), and CO2 assimilation under varying light conditions [22,33,34].
Formulas:
Photochemical quenching coefficient (qP)
qP = (Fm′ − Fs)/(Fm′ − Fo′)
Non-photochemical quenching coefficient (qN)
qP = (Fm − Fm′)/(Fm − Fo′)
The proportion of open reaction centers (qL)
2.4. Non-Photochemical Quenching (NPQ) in Fluctuating Light
Simulation of fluctuating light environments was performed to capture the NPQ induction and relaxation in the Andean and the Mesoamerican genotypes using a Li-6800. In this procedure, we adopted the nested response program of the Li-6800, which involved three light (PAR) levels. First, the dark-adapted leaves were exposed to actinic light (AL) of 1000 µmol m−2s−1 PAR for 20 min. Then, light was increased to 1500 µmol m−2s−1 PAR for 10 min, and further, 2000 µmol m−2s−1 PAR for another 10 min. Each log was allowed 60 to 120 s for stability. During these light periods, chlorophyll fluorescent data were logged concurrently using a routine “dark pulse” capturing the light-adapted fluorescence measurements.
NPQ relaxation was tested by exposing the dark-adapted leaves to 1500 µmol m−2s−1 PAR for 30 min followed by a drop in light levels to 100 µmol m−2s−1 PAR for 30 min. Changes in the maximum chlorophyll fluorescence were captured using the background routine “dark pulse” protocol. Furthermore, another set of plants was dark adapted for 40 min before exposure to an increase in the amount of light to 1000 µmol m−2s−1 PAR for 30 min, and then the NPQ stabilization was examined in the two common bean genotypes.
NPQ values were obtained using the minimum and maximum chlorophyll fluorescence values. The minimum fluorescence values were obtained by measuring dark-adapted plants from the Andean and the Mesoamerican genotypes. In contrast, maximum fluorescence values were obtained under fluctuating light using the routine background “dark pulse” protocol. Therefore, the NPQ pattern under changing light was estimated using the formula:
where:
NPQcal = (Fmd − Fmℓ′)/Fm′
Fmd = average maximum fluorescence from dark-adapted leaf before exposure to the light.
Fmℓ′ = average maximum fluorescence of light-adapted leaf exposed to light.
Fm′ = maximum fluorescence of the light-adapted leaf in a fluctuating light environment.
3. Data Analysis
Differences in leaf fluorescence were analyzed using Welch’s t-test with a 95% significance level. From the obtained t-statistic, we considered p < 0.05 as evidence for statistically significant differences between the Andean and the Mesoamerican genotypes (Calima and Jamapa) [31]. Additionally, we undertook regression analyses of the patterns for NPQ induction and relaxation. To estimate NPQ relaxation parameters, we fitted nonlinear exponential decay curves (the exponential NPQ decay model), and then subjected the model to the type-II Wald chi-square test. All statistical analyses were carried out in R software version 4.1.1 [35].
4. Results
4.1. Variation in Chlorophyll Fluorescence of Dark- and Light-Adapted Leaves between an Andean and a Mesoamerican Common Bean Genotype
The minimum fluorescence (Fod) of dark-adapted leaves represents the leaf fluorescence when all the reaction centers of photosystem II are open. No statistical differences were detected between the Mesoamerican genotype (Jamapa—244.2 ± 7.51) and the Andean genotype (Calima—240.52 ± 9.87) (Figure 1A). Similarly, the maximum fluorescence values of dark-adapted leaves (Fmd), which were obtained when all the reaction centers were closed, were not significantly different between Jamapa (1350.53 ± 27.49) and Calima (1370.43 ± 42.02) (Figure 1B). Not surprisingly, the proportion of fluorescence that was photochemically quenched, referred to as the maximum quantum efficiency (ΦPSII = (Fmd− Fod)/Fmd) of PSII reaction centers, was basically the same for both genotypes (0.82) (Figure 1C). Under exposure of the dark-adapted leaves to moderate light, many other parameters including the minimum fluorescence (Fo′d) (Figure 1D), maximum fluorescence (Fm′) (Figure 1E), maximum quantum efficiency of PSII reaction centers (Fv′/Fm′d) (Figure 1F), and the steady-state fluorescence (Fs) (Figure 1G) were also not statistically different. In other words, both genotypes appeared to have very similar light-harvesting infrastructures.
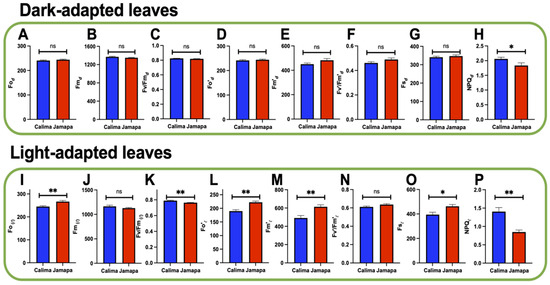
Figure 1.
Contrasting leaf fluorescence in light-adapted leaves between an Andean and a Mesoamerican common bean genotype. Chlorophyll fluorescence characteristics of dark (A–H) and light-adapted (I–P) leaves. (A,I) Minimum fluorescence in the absence of illumination (Fo). (B,J) Maximum fluorescence (Fm). (C,K) Maximum quantum efficiency of PSII reaction centers (Fv/Fm). (D,L) Minimum fluorescence under illumination (Fo). (E,M) Maximum fluorescence (Fm and Fm′). (F,N) Maximum quantum efficiency of PSII reaction centers (Fv′/Fm′). (G,O) Steady-state fluorescence (Fs). (H,P) Non-photochemical quenching (NPQ). Dark adaptation was achieved by covering the leaf with aluminum foil for 25 min. The maximum chlorophyll fluorescence traits of the dark-adapted leaves were measured following 25 min of moderate light (1000 µmol m−2s−1 PAR). The maximum chlorophyll fluorescence traits of the light-adapted leaves were measured under high light (1500 µmol m−2s−1 PAR). Light adaptation was achieved by exposing plants to 700 ± 100 µmol m−2s−1 PAR for 2 h. t-test results: ns p > 0.05 and * p ≤ 0.05 ** p ≤ 0.01.
To determine whether these Andean and the Mesoamerican genotypes had the same ability to deal with excess light energy, we measured their non-photochemical quenching (NPQ = (Fm − Fm′)/Fm′) ability, where Fm′ is the maximum fluorescence under actinic light illumination [36]. NPQ differences in dark-adapted leaves following brief exposure (25 min) to moderate illumination (1000 µmol m−2s−1 PAR) (Figure 1H) were expected given that their maximum fluorescence (Fm) values in the absence of illumination were almost the same (Figure 1E), but their light-adapted maxima were significantly different: Jamapa (613.84 ± 55.06) and Calima (491.28 ± 69.28) (Figure 1M). Thus, while the NPQ of Jamapa was 1.2, Calima’s was 1.79. These values suggested that Calima had a greater ability to dissipate excess light energy as heat and that the xanthophyll pool might be bigger in Calima than in Jamapa.
Contrary to dark-adapted conditions, the minimum fluorescence of the light-adapted leaves in the absence of actinic light (Foℓ) was significantly higher in Jamapa (266.56 ± 13.33) than in Calima (244.88 ± 9.54) (Figure 1I). However, the maximum fluorescence of the light-adapted leaves in the absence of light (Fmℓ) was not significantly different between these Andean and the Mesoamerican genotypes. Nonetheless, the maximum quantum efficiency of PSII reaction centers (Fv/Fmℓ) estimated from the light-adapted leaves was significantly higher (0.79 ± 0.01) in the Andean (Calima) compared to the Mesoamerican (Jamapa) genotype (0.76 ± 0.01) (Figure 1K). Furthermore, under higher illumination, light-adapted leaves’ minimum fluorescence (Fo′ℓ), was significantly higher (222.11 ± 11.68) in the Mesoamerican (Jamapa) genotype compared to the Andean (Calima) genotype (189.72 ± 13.98) (Figure 1L). However, the maximum quantum efficiency of PSII reaction centers (Fv′/Fm′ℓ) was not statistically different between these two genotypes (Figure 1N).
We also estimated the ability of these Andean and the Mesoamerican genotypes to dissipate excess light energy as heat by calculating the quantum yield of thermal energy dissipation using the formula of Hendrikson et al. [37], ΦNPQ = (Fs/Fm′) − (Fs/Fmd), where Fs is the steady-state fluorescence during illumination. The first term represents the total thermal energy that is dissipated, and the second term represents the constitutive thermal non-radiative emission. ΦNPQ is the fraction of the thermal dissipation that is regulated. The steady-state fluorescence of the light-adapted leaves (Fsℓ) of Jamapa (462.52 ± 38.64) was significantly higher than Calima (394.64 ± 50.63) (Figure 1O). Accordingly, the ΦNPQ of Jamapa was 0.41 and that of Calima was 0.52. These calculations also indicated that Calima has a greater ability to dissipate excess light energy as heat. Collectively, these results indicated that the two plants exhibited variability in the capture and the energy conversion efficiency at their light reaction centers.
To understand the nature of the differences in the energy conversion efficiency of dark- and light-adapted leaves in both genotypes, we further explored their photochemical (qP) quenching coefficients. In dark-adapted leaves, the qP was comparable between the Andean and the Mesoamerican genotypes (Figure 2A). In contrast, the non-photochemical (qN) quenching coefficients were significantly higher in the Andean than the Mesoamerican genotype (Figure 2B). Despite these patterns of qP and qN, the proportion of open reaction centers (qL) remained similar between the two common bean genotypes (Figure 2C). Following exposure (25 min) to moderate light, we quantified the CO2 assimilation (A), quantum efficiency of photosynthetic electron transport through PSII (PhiPS2), and the quantum efficiencies of photosynthetic electron transport through CO2 assimilation (ΦCO2). We did not detect differences in any of these parameters (Figure 2D–F).
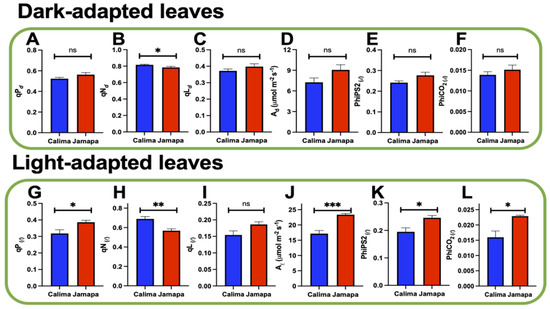
Figure 2.
Quantum efficiencies of photosynthetic electron transport: photochemical, and non-photochemical potentials are variable between a Mesoamerican and an Andean genotype of common beans. (A,G) Photochemical quenching coefficients (qPd/qPℓ). (B,H) Non-photochemical quenching coefficients (qNd/qNℓ). (C,I) Proportion of open reaction centers (qLd/qNℓ). (D and J) CO2 assimilation (Ad/Aℓ). (E,K) Quantum efficiency of photosynthetic electron transport through PSII (PhiPS2d/PhiPS2ℓ). (F,L) Quantum efficiencies of photosynthetic electron transport through CO2 assimilation (PhiCO2d/PhiCO2ℓ). (A–F) Dark-adapted and (G–L) light-adapted leaves. Dark adaptation was achieved by covering leaves with aluminum foil for 25 min. Light adaptation was achieved by exposing plants to 700 ± 100 µmol m−2s−1 PAR for 2 h. t-test results: ns p > 0.05 and * p ≤ 0.05 ** p ≤ 0.01 *** p ≤ 0.001.
In the light-adapted leaves, qP quenching coefficients of the leaves were significantly higher in the Mesoamerican compared to the Andean common bean genotype (Figure 2G). In contrast, the qN quenching coefficients were the opposite, being higher in the Andean than in the Mesoamerican genotype (Figure 2H). However, the proportion of open reaction centers (qL) did not differ between the genotypes (Figure 2I). The estimated CO2 assimilation (A), quantum efficiency of photosynthetic electron transport through PSII (PhiPS2), and the quantum efficiencies of photosynthetic electron transport through CO2 assimilation (ΦCO2) were significantly higher in the Mesoamerican genotype compared to the Andean genotype (Figure 2J–L). These results indicated that the Mesoamerican genotype used most of the absorbed light energy in photosynthesis. Although Calima appeared to have the same capacity as Jamapa to harvest light energy, it also appeared that it did not have the capacity to utilize all the absorbed energy for photochemistry, but could dissipate that excess energy as heat.
4.2. NPQ Induction Patterns in Andean (Calima) and Mesoamerican (Jamapa) Common Bean Genotypes
To characterize the dynamic response of both genotypes to increasing light levels (1000, 1500 to 2000 µmol m−2s−1 PAR), we measured NPQ as a function of time and PAR levels. NPQ steadily increased significantly in Calima during the first 20 min of illumination at 1000 µmol m−2s−1 PAR, whereas Jamapa’s NPQ remained constant during the same period (Figure 3A,B).
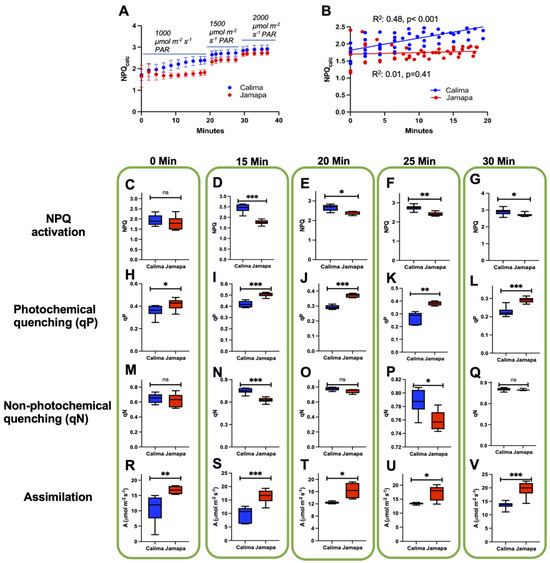
Figure 3.
Induction of photochemical and non-photochemical quenching varies with changes in light. (A) NPQ induction patterns at three light levels (1000, 1500, and 2000 µmol m−2s−1 PAR). (B) The trend of NPQ induction in the first 20 min at 1000 µmol m−2s−1 PAR. (C,G) NPQ activation. (H,L) Photochemical quenching (qP) coefficients. (M,Q) Non-photochemical quenching (qP) coefficient. (R,V) CO2 Assimilation. All parameters were measured at (C,H,M,R) 0 min, (D,I,N,S) 15 min, (E,J,O,T) 20 min, (F,K,P,U) 25 min, and (G,L,Q,V) 30 min. The Nested_response program of the Li-6800 photosynthetic system was used to simulate fluctuating light levels. Dark adaptation was achieved by covering leaves with aluminum foil for 25 min. Light adaptation was achieved by exposing plants to 700 ± 100 µmol m−2s−1 PAR for 2 h. t-test results: ns p > 0.05 and * p ≤ 0.05, ** p ≤ 0.01 *** p ≤ 0.001.
The NPQ of both genotypes increased upon exposure to 1500 and 2000 µmol m−2s−1 PAR, and Calima’s capacity to dissipate extra light energy was always greater than Jamapa’s. These results suggested that Jamapa was able to utilize light energy steadily at 1000 µmol m−2s−1 PAR, and, in contrast, steadily increased its capacity to dissipate excess light energy. These results agree with our previous finding that Jamapa has a greater capacity for photosynthetic electron transport than Calima [31]. These results also meant that Calima has a greater sensitivity to excess light energy than Jamapa, and that it could dynamically increase its NPQ capacity.
Comparing the quantum efficiency responses over time under the changing light levels, we did not see significant differences at the start of exposure in the level of activation of the NPQ system between both genotypes (Figure 3C). However, as the exposure time increased, the NPQ activation became significantly higher in Calima than in Jamapa (Figure 3D–G). Interestingly, the photochemical (qP) quenching coefficient was higher in Jamapa at all the time points measured (Figure 3H–L). At the start of the exposure to light, the non-photochemical (qN) quenching coefficient was not statistically different between the two genotypes (Figure 3M). However, over time of exposure, the non-photochemical (qN) quenching coefficient became significantly higher in the Andean genotype (Figure 3N,P), with the exception of the extended time at moderate light (Figure 3O) and a short period of higher illumination (Figure 3Q). In terms of CO2 assimilation, the values remained significantly higher in Jamapa, from the beginning of exposure to changing light levels from moderate to high, in comparison to Calima (Figure 3R–V).
In terms of the response speed, the results indicated that the rate of NPQ induction under 1000 µmol m−2s−1 PAR was rapid in the Andean genotype (0.039 NPQ/min, R2: 0.56) compared to the Mesoamerican genotype (−0.0029 NPQ/min, R2: 0.01) and the latter appeared not to elucidate an NPQ response to this level of light (Table 1). However, at a higher light level (1500 µmol m−2s−1 PAR), NPQ induction became more rapid in the Mesoamerican genotype (0.018 NPQ/min, R2: 0.12) compared to the Andean genotype (0.012 NPQ/min, R2: 0.04), indicating that the NPQ response in the two common bean genotypes was light dependent, with the Andean genotype requiring a lower level of light for a response compared to the Mesoamerican genotype (Table 1). Furthermore, an additional increase in light levels to 2000 µmol m−2s−1, slightly increased the already-activated NPQ (especially in the Andean (0.028 NPQ/min, R2: 0.10), compared to the Mesoamerican common bean genotype (0.013 NPQ/min, R2: 0.07) (Table 1)).

Table 1.
Variation in the speed of induced non-photochemical quenching under changing light levels between an Andean and a Mesoamerican common bean genotype.
4.3. NPQ Relaxation in Andean (Calima) and Mesoamerican (Jamapa) Common Bean Genotypes
The relaxation of the NPQ system following 30 min of high light (1500 µmol m−2s−1 PAR) was rapid in the Mesoamerican compared to the Andean genotype (Figure 4). Our results showed a significant drop (−1400 µmol m−2s−1 PAR) in the amount of light to 100 µmol m−2s−1 PAR led to an immediate, drastic drop in NPQ levels in both genotypes (Figure 4A). However, the decay of the NPQ at the lower light level was much faster in the Mesoamerican (t1/2: 6.76 min, and an exponential time constant τ: 9.76 min) than the Andean genotype (t1/2: 9.17 min, and an exponential time constant τ: 13.22 min). The change in NPQ during this relaxation was steeper in the Mesoamerican (6.97) compared to the Andean genotype (3.91). Furthermore, after the relaxation, the NPQ plateau was considerably higher in the Andean (NPQ: 1.30) compared to the Mesoamerican genotype (NPQ: 1.18) (Figure 4B, Supplementary Table S1).
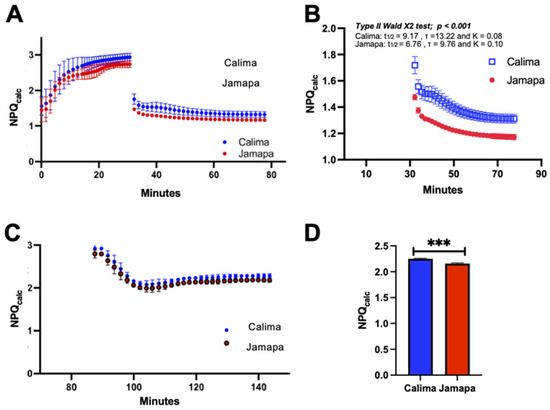
Figure 4.
Faster relaxation of the non-photochemical quenching in the Mesoamerican common bean genotype. (A) NPQ induction and relaxation patterns (1500 and 100 µmol m−2s−1 PAR). (B) The trend of NPQ relaxation in over 50 min at 100 µmol m−2s−1 PAR. (C) Extended NPQ induction and stabilization at 1000 µmol m−2s−1 PAR. (D) NPQ comparison after 25 min of stabilization at 1000 µmol m−2s−1 PAR. The Nested_response program of the Li-6800 photosynthetic system was used to simulate fluctuating light levels. Dark adaptation was achieved by covering leaves with aluminum foil for 25 min. Light adaptation was achieved by exposing plants to 700 ± 100 µmol m−2s−1 PAR for 2 h. t-test results: p ≤ 0.01 *** p ≤ 0.001.
Furthermore, we also exposed the plants to extended contrasting changes in light (darkness and light) and measured the NPQ behaviors in the Andean and Mesoamerican genotypes. A short (5 min) activation of the NPQ (exposure to 1000 µmol m−2s−1 PAR) followed by a 40 min withdrawal of light (exposure to 0 µmol m−2s−1 PAR), followed by exposure to moderate illumination (1000 µmol m−2s−1 PAR) resulted consistently in higher NPQ values in the Andean compared to the Mesoamerican genotype (Figure 4C,D). The behavior was also observed over extended periods (25 to 45 min) of moderate light (1000 µmol m−2s−1 PAR).
5. Discussion
Our results indicated a higher chlorophyll fluorescence of the light-adapted leaves in the Mesoamerican genotype (Jamapa) compared to the Andean genotype (Calima), indicating that the Mesoamerican genotype could absorb more light energy (Figure 1 and Figure 2). This could be attributed of the higher chlorophyll levels present in the Mesoamerican genotype. Previously, we detected that Jamapa has a significantly higher amount of chlorophyll than Calima as well as different palisade cell shapes, with Jamapa having cells that could help absorb light energy [31]. Higher values of chlorophyll fluorescence have also been attributed to better photosynthetic efficiency [38].
Our results also indicated extended NPQ induction in the Andean genotype of common beans compared to the Mesoamerican genotype. Our data suggested a longer NPQ induction time in Calima, which may be disadvantageous in high and rapidly changing light environments. We also confirmed that the higher NPQ values were consistent with the lower photosynthesis values in Calima, the Andean genotype, indicating an apparent variation in the conversion of the light energy to both photosynthetic and non-photosynthetic pathways in this genotype (Figure 3). Inability to utilize high amounts of light efficiently may cause the higher NPQ in Calima, while the ability in Jamapa to use the high amounts of light efficiently could have contributed to the lower NPQ in this genotype. Our results confirmed several reports suggesting that NPQ induction and relaxation speed can be crucial in photosynthesis under fluctuating light environments [2,11,13,25,39]. Therefore, this suggests that the Mesoamerican genotype has better photoprotective mechanisms. Other studies have documented that damage to PSII is exhibited by a reduction in Fv/Fm, and plants exhibiting higher Fv/Fm ratios under stress indicate less damage and are better suited to such conditions [40].
NPQ in Calima steadily increased at light levels as low as 1000 PAR (Figure 3, Table 1), which meant that only moderate light was needed to activate Calima’s NPQ system. These results indicated that Calima required a more robust photoprotective mechanism than Jamapa under lower light conditions and may be adapted to lower light conditions. These results could also suggest that Calima could not efficiently use captured light energy in the process of photosynthesis, forcing it to be dissipated as heat instead (Figure 3). On the other hand, NPQ in Jamapa stabilized at this light level and only began to increase when 1500 µmol m−2s−1 PAR was given, showing a much higher light intensity was needed for its NPQ mechanisms to be activated consistently. Likewise, Calima reached maximum NPQ levels at 1500 m−2s−1 PAR. At 2000 µmol m−2s−1 PAR, Calima did not yield a significant change in NPQ levels. On the contrary, the NPQ system of Jamapa was not fully induced at high light intensity (1500 µmol m−2s−1 PAR). However, at 2000 PAR, it did register a statistically significant increase (Figure 3). These results suggested that Jamapa could utilize absorbed light much faster than Calima, indicating a higher photosynthetic rate and capacity. A robust NPQ system is described as necessary when the plant cannot fully utilize the light energy and is required by plants growing in high-light environments [1,3,11,18]. Therefore, from our study, the lack of a robust NPQ system in Jamapa at lower light levels (<1500 PAR) indicates adaptation of this genotype to high-light environments.
Under high-light conditions when NPQ is activated, stability is achieved in both Jamapa and Calima after a comparable period of steadily increasing NPQ levels. However, Calima takes significantly longer than Jamapa to achieve stability in NPQ when light intensity is reduced (Figure 4), suggesting a much slower NPQ relaxation process. Jamapa could take less than 7 min to relax from maximum NPQ, pointing to high suitability for fluctuating light environments. Calima takes over 20 min to adjust to lower light conditions. It could be possible that the phosphorylation of the thylakoid proteins in the Calima, the Andean genotype, differs from the Mesoamerican genotype in helping with energy dissipation in the form of heat. Furthermore, both the Mesoamerican and Andean genotypes could have variations in the Photosystem II Subunit S (PsbS) protein, Vx-Zx xanthophyll cycle, NAD kinases, and several redox proteins. This is because PsbS is a critical sensor for ∆pH across the thylakoid membrane and activates the VAZ cycle involved in heat dissipation [3]. While the NPQ kinetics are linked to Zeaxanthin formation and epoxidation [3] as well as the cyclic electron transport chain [41], the cyclic electron flow affects photoinhibition [15]. Furthermore, the chloroplast NAD kinase is also linked to the xanthophyll cycle of the NPQ [42]. Therefore, the differences in the NQP induction in the two genotypes could have been caused by variations in several chloroplast-associated proteins, especially the redox proteins whose activation varies with illumination. However, these need to be further verified experimentally.
NPQ relaxations are facilitated by the ZEP enzyme in the xanthophyll cycle, a carotenoids component [3,6], Nicotinamide adenine dinucleotide (NAD+) kinase [42], and the ion antiporters’ function in balancing the lumen pH [23,43]. Therefore, other variations between the two genotypes could be caused by the variabilities in the xanthophyll cycle, NAD kinases, and ion antiporters.
Given its extended and strong NPQ in the Andean genotype (Calima), there is more loss of a significant amount of captured light as heat, especially in high and fluctuating light conditions, rendering this genotype much less photosynthetically efficient than the Mesoamerican genotype (Jamapa). Our results indicate consistently higher photochemical quenching coefficients and associated CO2 assimilation in the Mesoamerican compared to the Andean genotype (Figure 3). These results confirm the previous descriptions of the impact of NPQ on photosynthesis [2,25]. Our results also support the reports that rapid relaxation of the NPQ system could be pivotal to enhanced light-use efficiency in C3 plants. Our data also show that such traits of variable NPQ patterns are already naturally existing in the Mesoamerican common bean gene pool and could be present in other C3 plants adapted to different environments; this requires further exploration.
6. Conclusions
The results of this study indicate that the Andean (Calima) and the Mesoamerican (Jamapa) common bean genotypes exhibited comparable PSII light reaction centers but had differences in chlorophyll fluorescence and NPQ systems. Calima possesses a much stronger NPQ system, with prolonged induction and relaxation phases. On the other hand, Jamapa could induce and relax its NPQ systems more quickly despite having lower overall NPQ levels. The variability in the NPQ patterns could be controlled by variable mechanisms involving multiple players, including the Vx–Zx xanthophyll cycle, NAD kinases, and several redox proteins, among other factors. The results of the present study lay the foundation for future work on photosynthesis in dynamic light and the characteristics of photoprotective mechanisms in common bean plants.
Supplementary Materials
The following supporting information can be downloaded at https://www.mdpi.com/article/10.3390/agronomy14091907/s1, Table S1: Supplementary Table S1. Relaxation of non-photochemical quenching varies significantly with time and between an Andean and a Mesoamerican common bean genotype. The type-II Wald chi-square test for the exponential NPQ decay model. NPQ relaxation/decay was monitored for 50 min following a drop in light levels (1500 to 100 µmol m−2s−1 PAR). The model comprised a one-phase decay, consisting of the genotype as a random variable and time as a fixed variable.
Author Contributions
A.O.E.: methodology, investigation, data curation, formal analysis, visualization, writing—original draft preparation, and writing—review and editing. V.P.: investigation, data curation, and writing. C.E.V.: conceptualization and writing—review and editing. K.B.: conceptualization, funding acquisition, supervision, and writing—review and editing. All authors have read and agreed to the published version of the manuscript.
Funding
This research was funded by the USDA National Institute of Food and Agriculture, Hatch Project FLA-ENH-005853 to K.B.
Institutional Review Board Statement
Not applicable.
Data Availability Statement
The authors will make the raw data supporting this article’s conclusions available upon request.
Conflicts of Interest
The authors declare that this research was conducted without any commercial or financial relationships that could be construed as potential conflicts of interest.
Abbreviations
| Fo | Minimum fluorescence after dark adaptation |
| Fm | Maximum fluorescence after dark adaptation |
| Fv/Fm | Maximum quantum efficiency of PSII reaction centers after dark adaptation (1 − (Fo/Fm)) |
| Fo′ | Minimum fluorescence after light adaptation |
| Fm′ | Maximum fluorescence after light adaptation |
| Fv′/Fm′ | Effective quantum efficiency of PSII reaction centers of after light adaptation (1 − (Fo′/Fm′)) |
| Fs | Steady-state fluorescence (after light adaptation) |
| ΦPS2 | Quantum efficiency of photosynthetic electron transport through PSII |
| ΦCO2 | Quantum efficiencies of photosynthetic electron transport through CO2 assimilation (ΦCO2/ΦCO2) |
| qP | Photochemical (qP) quenching coefficient |
| qN | Non-photochemical (qN) quenching coefficient |
| qL | Open reaction centers estimated from qP |
| NPQ | Non-photochemical quenching |
| A | CO2 assimilation |
References
- Guidi, L.; Lo Piccolo, E.; Landi, M. Chlorophyll Fluorescence, Photoinhibition and Abiotic Stress: Does It Make Any Difference the Fact to Be a C3 or C4 Species? Front. Plant Sci. 2019, 10, 174. [Google Scholar] [CrossRef] [PubMed]
- Kaiser, E.; Correa Galvis, V.; Armbruster, U. Efficient Photosynthesis in Dynamic Light Environments: A Chloroplast’s Perspective. Biochem. J. 2019, 476, 2725–2741. [Google Scholar] [CrossRef] [PubMed]
- Kress, E.; Jahns, P. The Dynamics of Energy Dissipation and Xanthophyll Conversion in Arabidopsis Indicate an Indirect Photoprotective Role of Zeaxanthin in Slowly Inducible and Relaxing Components of Non-Photochemical Quenching of Excitation Energy. Front. Plant Sci. 2017, 8, 2094. [Google Scholar] [CrossRef] [PubMed]
- Ware, M.A.; Belgio, E.; Ruban, A.V. Photoprotective Capacity of Non-Photochemical Quenching in Plants Acclimated to Different Light Intensities. Photosynth. Res. 2015, 126, 261–274. [Google Scholar] [CrossRef]
- Kromdijk, J.; Głowacka, K.; Leonelli, L.; Gabilly, S.T.; Iwai, M.; Niyogi, K.K.; Long, S.P. Improving Photosynthesis and Crop Productivity by Accelerating Recovery from Photoprotection. Science 2016, 354, 857–861. [Google Scholar] [CrossRef] [PubMed]
- Ruban, A.V. Nonphotochemical Chlorophyll Fluorescence Quenching: Mechanism and Effectiveness in Protecting Plants from Photodamage. Plant Physiol. 2016, 170, 1903–1916. [Google Scholar] [CrossRef]
- Papageorgiou, G.C.; Govindjee (Eds.) Chlorophyll a Fluorescence: A Signature of Photosynthesis; Advances in Photosynthesis and Respiration; Springer: Dordrecht, The Netherlands, 2004; Volume 19, ISBN 978-1-4020-3217-2. [Google Scholar]
- Tikkanen, M.; Mekala, N.R.; Aro, E.-M. Photosystem II Photoinhibition-Repair Cycle Protects Photosystem I from Irreversible Damage. Biochim. Biophys. Acta BBA Bioenerg. 2014, 1837, 210–215. [Google Scholar] [CrossRef]
- Goh, C.-H.; Ko, S.-M.; Koh, S.; Kim, Y.-J.; Bae, H.-J. Photosynthesis and Environments: Photoinhibition and Repair Mechanisms in Plants. J. Plant Biol. 2012, 55, 93–101. [Google Scholar] [CrossRef]
- Huang, W.; Yang, Y.-J.; Hu, H.; Zhang, S.-B. Different Roles of Cyclic Electron Flow around Photosystem I under Sub-Saturating and Saturating Light Intensities in Tobacco Leaves. Front. Plant Sci. 2015, 6, 923. [Google Scholar] [CrossRef]
- Zaks, J.; Amarnath, K.; Kramer, D.M.; Niyogi, K.K.; Fleming, G.R. A Kinetic Model of Rapidly Reversible Nonphotochemical Quenching. Proc. Natl. Acad. Sci. USA 2012, 109, 15757–15762. [Google Scholar] [CrossRef]
- Nilkens, M.; Kress, E.; Lambrev, P.; Miloslavina, Y.; Müller, M.; Holzwarth, A.R.; Jahns, P. Identification of a Slowly Inducible Zeaxanthin-Dependent Component of Non-Photochemical Quenching of Chlorophyll Fluorescence Generated under Steady-State Conditions in Arabidopsis. Biochim. Biophys. Acta BBA Bioenerg. 2010, 1797, 466–475. [Google Scholar] [CrossRef] [PubMed]
- Lu, D.; Zhang, Y.; Zhang, A.; Lu, C. Non-Photochemical Quenching: From Light Perception to Photoprotective Gene Expression. Int. J. Mol. Sci. 2022, 23, 687. [Google Scholar] [CrossRef] [PubMed]
- Jahns, P.; Holzwarth, A.R. The Role of the Xanthophyll Cycle and of Lutein in Photoprotection of Photosystem II. Biochim. Biophys. Acta BBA Bioenerg. 2012, 1817, 182–193. [Google Scholar] [CrossRef] [PubMed]
- Takahashi, S.; Milward, S.E.; Fan, D.-Y.; Chow, W.S.; Badger, M.R. How Does Cyclic Electron Flow Alleviate Photoinhibition in Arabidopsis? Plant Physiol. 2009, 149, 1560–1567. [Google Scholar] [CrossRef] [PubMed]
- Murchie, E.H.; Ruban, A.V. Dynamic Non-photochemical Quenching in Plants: From Molecular Mechanism to Productivity. Plant J. 2020, 101, 885–896. [Google Scholar] [CrossRef]
- Ruban, A.V.; Johnson, M.P. Dynamics of Higher Plant Photosystem Cross-Section Associated with State Transitions. Photosynth. Res. 2009, 99, 173–183. [Google Scholar] [CrossRef]
- Roach, T.; Na, C.S. LHCSR3 Affects De-Coupling and Re-Coupling of LHCII to PSII during State Transitions in Chlamydomonas Reinhardtii. Sci. Rep. 2017, 7, 43145. [Google Scholar] [CrossRef] [PubMed]
- Avenson, T.J.; Cruz, J.A.; Kramer, D.M. Modulation of Energy-Dependent Quenching of Excitons in Antennae of Higher Plants. Proc. Natl. Acad. Sci. USA 2004, 101, 5530–5535. [Google Scholar] [CrossRef]
- Juneau, P.; Green, B.R.; Harrison, P.J. Simulation of Pulse-Amplitude-Modulated (PAM) Fluorescence: Limitations of Some PAM-Parameters in Studying Environmental Stress Effects. Photosynthetica 2005, 43, 75–83. [Google Scholar] [CrossRef]
- Zuo, G.; Aiken, R.M.; Feng, N.; Zheng, D.; Zhao, H.; Avenson, T.J.; Lin, X. Fresh Perspectives on an Established Technique: Pulsed Amplitude Modulation Chlorophyll a Fluorescence. Plant-Environ. Interact. 2022, 3, 41–59. [Google Scholar] [CrossRef]
- LI-COR, Biosciences. Using the Li-6800 Portable Photosynthesis System; LI-COR, Biosciences: Lincoln, NE, USA, 2023; Available online: https://www.licor.com/env/support/MicroContent/Resources/MicroContent/manuals/li-6800-instruction-manual.html (accessed on 28 July 2024).
- Armbruster, U.; Carrillo, L.R.; Venema, K.; Pavlovic, L.; Schmidtmann, E.; Kornfeld, A.; Jahns, P.; Berry, J.A.; Kramer, D.M.; Jonikas, M.C. Ion Antiport Accelerates Photosynthetic Acclimation in Fluctuating Light Environments. Nat. Commun. 2014, 5, 5439. [Google Scholar] [CrossRef] [PubMed]
- Zhu, X.; Ort, D.R.; Whitmarsh, J.; Long, S.P. The Slow Reversibility of Photosystem II Thermal Energy Dissipation on Transfer from High to Low Light May Cause Large Losses in Carbon Gain by Crop Canopies: A Theoretical Analysis. J. Exp. Bot. 2004, 55, 1167–1175. [Google Scholar] [CrossRef]
- Kaiser, E.; Morales, A.; Harbinson, J. Fluctuating Light Takes Crop Photosynthesis on a Rollercoaster Ride. Plant Physiol. 2018, 176, 977–989. [Google Scholar] [CrossRef]
- White, J.W.; Kornegay, J.; Castillo, J.; Molano, C.H.; Cajiao, C.; Tejada, G. Effect of Growth Habit on Yield of Large-Seeded Bush Cultivars of Common Bean. Field Crops Res. 1992, 29, 151–161. [Google Scholar] [CrossRef]
- Weller, J.L.; Vander Schoor, J.K.; Perez-Wright, E.C.; Hecht, V.; González, A.M.; Capel, C.; Yuste-Lisbona, F.J.; Lozano, R.; Santalla, M. Parallel Origins of Photoperiod Adaptation Following Dual Domestications of Common Bean. J. Exp. Bot. 2019, 70, 1209–1219. [Google Scholar] [CrossRef]
- Clavijo Michelangeli, J.A.; Bhakta, M.; Gezan, S.A.; Boote, K.J.; Vallejos, C.E. From Flower to Seed: Identifying Phenological Markers and Reliable Growth Functions to Model Reproductive Development in the Common Bean (Phaseolus Vulgaris L.). Plant Cell Environ. 2013, 36, 2046–2058. [Google Scholar] [CrossRef]
- Bhakta, M.S.; Gezan, S.A.; Clavijo Michelangeli, J.A.; Carvalho, M.; Zhang, L.; Jones, J.W.; Boote, K.J.; Correll, M.J.; Beaver, J.; Osorno, J.M.; et al. A Predictive Model for Time-to-Flowering in the Common Bean Based on QTL and Environmental Variables. G3 GenesGenomesGenetics 2017, 7, 3901–3912. [Google Scholar] [CrossRef] [PubMed]
- Zhang, L.; Gezan, S.A.; Eduardo Vallejos, C.; Jones, J.W.; Boote, K.J.; Clavijo-Michelangeli, J.A.; Bhakta, M.; Osorno, J.M.; Rao, I.; Beebe, S.; et al. Development of a QTL-Environment-Based Predictive Model for Node Addition Rate in Common Bean. Theor. Appl. Genet. 2017, 130, 1065–1079. [Google Scholar] [CrossRef]
- Egesa, A.O.; Vallejos, C.E.; Begcy, K. Cell Size Differences Affect Photosynthetic Capacity in a Mesoamerican and an Andean Genotype of Phaseolus vulgaris L. Front. Plant Sci. 2024, 15, 1422814. [Google Scholar] [CrossRef]
- Bhakta, M.S.; Jones, V.A.; Vallejos, C.E. Punctuated Distribution of Recombination Hotspots and Demarcation of Pericentromeric Regions in Phaseolus vulgaris L. PLoS ONE 2015, 10, e0116822. [Google Scholar] [CrossRef]
- Laĭsk, A.K.; Nedbal, L.; Govindjee (Eds.) Photosynthesis in Silico: Understanding Complexity from Molecules to Ecosystems; Advances in photosynthesis and respiration; Springer: Dordrecht, The Netherlands, 2009; ISBN 978-1-4020-9236-7. [Google Scholar]
- Kramer, D.M.; Johnson, G.; Kiirats, O.; Edwards, G.E. New Fluorescence Parameters for the Determination of QA Redox State and Excitation Energy Fluxes. Photosynth. Res. 2004, 79, 209–218. [Google Scholar] [CrossRef]
- R Core Team R: A Language and Environment for Statistical Computing 2021. Available online: https://www.r-project.org/ (accessed on 20 January 2024).
- Bilger, W.; Björkman, O. Role of the Xanthophyll Cycle in Photoprotection Elucidated by Measurements of Light-Induced Absorbance Changes, Fluorescence and Photosynthesis in Leaves of Hedera Canariensis. Photosynth. Res. 1990, 25, 173–185. [Google Scholar] [CrossRef] [PubMed]
- Hendrickson, L.; Furbank, R.T.; Chow, W.S. A Simple Alternative Approach to Assessing the Fate of Absorbed Light Energy Using Chlorophyll Fluorescence. Photosynth. Res. 2004, 82, 73–81. [Google Scholar] [CrossRef]
- Knopf, O.; Castro, A.; Bendig, J.; Pude, R.; Kleist, E.; Poorter, H.; Rascher, U.; Muller, O. Field Phenotyping of Ten Wheat Cultivars under Elevated CO2 Shows Seasonal Differences in Chlorophyll Fluorescence, Plant Height and Vegetation Indices. Front. Plant Sci. 2024, 14, 1304751. [Google Scholar] [CrossRef] [PubMed]
- Cardona, T.; Shao, S.; Nixon, P.J. Enhancing Photosynthesis in Plants: The Light Reactions. Essays Biochem. 2018, 62, 85–94. [Google Scholar] [CrossRef]
- Nicol, L.; Nawrocki, W.J.; Croce, R. Disentangling the Sites of Non-Photochemical Quenching in Vascular Plants. Nat. Plants 2019, 5, 1177–1183. [Google Scholar] [CrossRef] [PubMed]
- Cejudo, F.J.; Ojeda, V.; Delgado-Requerey, V.; González, M.; Pérez-Ruiz, J.M. Chloroplast Redox Regulatory Mechanisms in Plant Adaptation to Light and Darkness. Front. Plant Sci. 2019, 10, 380. [Google Scholar] [CrossRef]
- Takahashi, H.; Watanabe, A.; Tanaka, A.; Hashida, S.; Kawai-Yamada, M.; Sonoike, K.; Uchimiya, H. Chloroplast NAD Kinase Is Essential for Energy Transduction Through the Xanthophyll Cycle in Photosynthesis. Plant Cell Physiol. 2006, 47, 1678–1682. [Google Scholar] [CrossRef][Green Version]
- Armbruster, U.; Leonelli, L.; Correa Galvis, V.; Strand, D.; Quinn, E.H.; Jonikas, M.C.; Niyogi, K.K. Regulation and Levels of the Thylakoid K+/H+ Antiporter KEA3 Shape the Dynamic Response of Photosynthesis in Fluctuating Light. Plant Cell Physiol. 2016, 57, 1557–1567. [Google Scholar] [CrossRef]


Disclaimer/Publisher’s Note: The statements, opinions and data contained in all publications are solely those of the individual author(s) and contributor(s) and not of MDPI and/or the editor(s). MDPI and/or the editor(s) disclaim responsibility for any injury to people or property resulting from any ideas, methods, instructions or products referred to in the content. |
© 2024 by the authors. Licensee MDPI, Basel, Switzerland. This article is an open access article distributed under the terms and conditions of the Creative Commons Attribution (CC BY) license (https://creativecommons.org/licenses/by/4.0/).