Abstract
Enhancing plants’ resistance against FW is crucial for ensuring a sustainable global chickpea production. The present study focuses on the identification of fungal pathogens and the assessment of ninety-six chickpea samples for Fusarium wilt from the International Center for Agricultural Research in the Dry Areas (ICARDA)’s collection. Eight fungal isolates were recovered from the symptomatic chickpeas. Polyphasic identification was conducted by comparing the internal transcribed spacer region (ITS), the elongation factor 1-α (tef1-α), and beta-tubulin (tub2). Among them, Neocosmospora solani, N. nelsonii, N. falciformis, N. brevis, Fusarium brachygibbosum, and F. gossypinum were identified. An analysis of the genetic diversity of chickpeas, using 69 polymorphic simple sequence repeat (SSR) markers, revealed a total of 191 alleles across all markers, with, on average, each SSR marker detecting approximately 2.8 alleles. A STRUCTURE analysis delineated lines into two distinct sub-groups (K = 2). Association mapping, using the generalized linear model (GLM) and mixed linear model (MLM) approaches, identified six and five marker–trait associations (MTAs) for FW resistance, respectively. Notably, these TA42, TA125 (A) and TA125 (B), TA37, and TAASH MTAs, commonly found in both models, emerge as potential candidates for the targeted enhancement of FW resistance in chickpeas. To our knowledge, this study represents an inaugural report on the association mapping of genomic loci governing FW resistance in chickpeas from the ICARDA’s accessions.
1. Introduction
The chickpea (Cicer arietinum L.), of the Fabaceae family, holds significant agricultural importance globally, and ranks as the second most important legume crop, following the common bean (Phaseolus vulgaris L.) and the dry pea (Pisum sativum L.) [1]. It is an important source of dietary protein for humans and provides crucial feed for livestock. Its contribution is vital to the sustainable cultivation of cereals, particularly within wheat-based cropping systems, as it enhances the soil’s fertility through nitrogen fixation. Globally, chickpea production has reached 14.2 million metric tons, and is mostly concentrated in Asian regions (83% of total production) (FAO, 2019) [2].
The chickpea possesses a relatively compact genome size of 750 Mbp and exhibits minimal genetic polymorphisms [3]. To study its diversity or perform a linkage analysis for this crop, a substantial quantity of polymorphic markers is necessary [4]. Previous investigations of chickpeas, employing RAPD and RFLP markers, uncovered minimal polymorphic variations. Simple sequence repeat (SSR) markers have become extensively employed in the genetic characterization and diversity analyses of crop plants [5].
Numerous diseases pose substantial challenges to global chickpea production, where Fusarium wilt and root rot are caused by different Fusarium spp. [6]. Fusarium oxysporum f. sp. ciceris (Foc) is recognized as one of the most critical. Managing Fusarium wilt has predominantly involved the breeding of resistant cultivars as a component of integrated management strategies. However, the extensive pathogenic variability within populations of F. oxysporum f. sp. ciceris poses challenges to the long-term sustainability of resistant cultivars [7]. Ascochyta blight (Didymella rabiei), Fusarium wilt, cyst nematodes (Heterodera spp.), and insect pests are the primary biotic factors contributing to significant yield gaps and reduced planted areas. Fusarium wilt, in particular, stands out as a crucial soil-borne disease, affecting chickpea production in the Mediterranean region, in South Asia, and in East Africa [8,9,10]. The efficient identification of pathogenic races of F. oxysporum f. sp. ciceris is essential, given a reliance on resistant cultivars for managing Fusarium wilt disease. The traditional non-molecular methods for determining an organism’s taxonomic level of ‘formae speciales’ (special forms) of organisms are resource-intensive, in terms of both time and materials. To overcome these obstacles, a PCR-based molecular assay has been devised [11].
Many countries report annual yield losses ranging from 10 to 15%; under optimal environmental conditions favourable for pathogens, this can potentially result in total crop failure [12,13,14]. Nevertheless, significant attention has been directed towards developing chickpea genotypes with increased levels of resistance against Fusarium wilt, in both national and international chickpea breeding programs [15]. In chickpea breeding, there is a strong emphasis on identifying and developing genotypes that exhibit a broad resistance to multiple races and populations of Foc. Recognizing the diversity of races within Foc is crucial for developing effective breeding programs aimed at enhancing resistance in chickpeas. It should be noted that the plant’s resistance may diminish when exposed to a combination of Fusarium and other soil-borne pathogens [16]. Various races and genetically diverse populations of Foc have been documented across India, Turkey, Tunisia, Spain, Sudan, Iran, and Ethiopia [17]. The use of chickpea differential lines and molecular markers has enabled researchers to identify eight distinct races (0, 1A, 1B/C, 2, 3, 4, 5, and 6) of Foc. Furthermore, based on their above-ground symptoms, the following two distinct pathotypes were identified: yellowing and wilting [5,9]. The wilting symptom is mainly characterized by severe chlorosis and flaccidity, accompanied by vascular discoloration leading to plant death, and is induced by the races 1A, 2, 3, 4, 5, and 6. Conversely, the races 0 and 1B/C induce the yellowing symptom [5,15]. Races 0 and 1B/C demonstrate lower levels of virulence compared to other known races responsible for wilting [8,11]. California (USA) and Spain have documented the races 0, 1A, 1B/C, 5, and 6, while Syria, Tunisia, and Turkey have reported the races 0 and 1B/C, and Israel has observed the races 0, 1A, and 6. Morocco has recorded the races 1A and 6, and Lebanon has confirmed the presence of the race 0 [18,19].
Molecular-marker technology is essential for examining the genetic diversity of crops [20]. Various markers, including restriction fragment length polymorphisms (RFLPs), random amplified polymorphic DNA (RAPD), amplified fragment length polymorphisms (AFLPs), simple sequence repeats (SSRs), and single nucleotide polymorphisms (SNPs) are employed in genetic diversity studies [21]. SSRs, in particular, are favoured for their high polymorphism, reliable reproducibility, co-dominance, and straightforward application [22]. Numerous studies have highlighted the extensive use of SSRs in chickpea genetics, genomics, and breeding [21]. SSRs are applied in areas such as cultivar identification, allele mining, genetic mapping, association studies, genetic diversity analyses, population structure investigations, and phylogenetic relationship establishment [23]. In this research, we conducted experiments on 96 chickpea samples with Fusarium wilt from the International Center for Agricultural Research in the Dry Areas (ICARDA)’s chickpea collections, including one local variety, which were analysed using SSR markers to determine the marker–trait associations (MTAs) for Fusarium wilt resistance. The results of our study will also provide genetic resources for breeding new chickpea varieties and help categorize accessions based on their resistance capabilities.
2. Materials and Methods
2.1. Plant Materials and Fungal Pathogens
In this study, we conducted experiments on 96 chickpea samples from the ICARDA’s CIFWN (Chickpea International Fusarium Wilt Nursery 2020) and CIENMED (Chickpea International Elite Nursery for Mediterranean Environments 2021) collections, including one local variety (Supplementary Table S1). The traits were studied over a period of two years (2022–2023) in their respective field conditions.
Fungi pathogens were isolated from the infected chickpea samples. Briefly, the infected plant stems were ground using a home blender in sterile conditions. The ground tissues were placed on a potato dextrose agar (potato starch 4 gm L−1, dextrose 20 gm L−1, and agar 15 gm L−1, pH 5.6) (Cat#P8931-250G, Solarbio, Beijing, China) and put in a thermostatic incubator at 25 °C, until the appearance of fungal colonies were observed. The DNA of the fungus isolates was extracted following the method described by Liu et al. [24]; the internal transcribed spacer region (ITS) of 18S RNA, elongation factor 1-α (tef1-α), and beta-tubulin (tub2) gene fragments were sequenced, analysed, and molecularly identified, as described by Liu et al. [25].
2.2. Fusarium Infection
The twenty-days-old chickpea samples were artificially infected and their disease severity levels were studied. Each plant sample was studied with 10 plants in two replicates. The fungal inoculation was performed following the method described by Armstrong-Cho et al. [26]. Briefly, 30 mL of a freshly prepared conidia suspension (1 × 100 conidia mL−1) was applied to the base of each seedling growing in a 2 L pot, a method known as drenching. In the non-inoculated control group, water was applied to the base of the seedlings, instead. This inoculation was repeated three times. The plants were cultivated in a glasshouse environment at a temperature of 25 ± 1 °C, a 16 h light and 8 h dark photoperiod, and a relative humidity ranging between 50% and 55%. The disease severity in the infected plants was assessed under laboratory conditions, according to the method described by Chumakov et al. [27], and the FW resistance was assessed in a manner similar to the methodology described by Jha et al. (2018) [28]. The genotypes were categorized based on their disease–incidence percentages; those with less than 10.0% were deemed resistant, while those ranging between 10.1% and 20.0% were classified as moderately tolerant. The genotypes exhibiting incidences between 20.1% and 50.0% were labelled as moderately susceptible, and those exceeding 50.0% were categorized as susceptible.
2.3. Polymerase Chain Reaction (PCR) Analysis
The CTAB method described by Saghai-Maroof et al. [29] was employed to extract the genomic DNA from the 3-weeks-old chickpea seedlings. The PCR protocol, a reaction mixture of 10 μL volume, comprised 6.6 μL distilled water, 1.00 μL template DNA (25 ng), 0.2 μL forward and 0.2 μL reverse primers (5 μM each), 1.00 μL 10 × PCR buffer (10 mM Tris-HCl, 50 mM KCl, pH 8.3), 0.2 μL dNTP mix (0.04 mM each of dATP, dGTP, dCTP, and dTTP), and 0.2 μL Taq polymerase, was prepared. The polymerization of this reaction mixture was conducted using a TC1000-G Thermocycler (DLAB, Beijing, China) employing a touchdown PCR profile for amplification, which included an initial denaturation at 94 °C for 10 min, followed by 35 cycles at 94 °C for 15 s (denaturation), an appropriate temperature of primers for 30 s (annealing), and 72 °C for 1 min (elongation), with a final extension at 72 °C for 10 min. The amplified fragments were separated on a 2% agarose gel using a 1 × TBE running buffer, and the images were analysed using gel analyser software (23.1.1 version).
2.4. Genetic Diversity and Population Structure Analysis
The genetic diversity parameters, including the number of alleles per locus (Na), gene diversity (He), and polymorphism information content (PIC), were calculated using an online marker efficiency calculator (https://irscope.shinyapps.io/iMEC/, accessed on 1 April 2024). A neighbour-joining tree with 1000 bootstrap values was conducted using the software TASSEL v. 5.0 to visualize the genetic relationships among the genotypes. A population structure (Q) and subpopulation (K) determination was performed using a model-based analysis with the software STRUCTURE v. 2.3.4 [30]. Ten independent runs employing the admixture model were conducted with 100,000 Markov Chain Monte Carlo iterations for each K value ranging from 2 to 10, with a burn-in length of 280. Additionally, the best K value was determined using the ΔK method, proposed by Evanno et al. [31], through the processing of STRUCTURE results with STRUCTURE HARVESTER (available at https://github.com/dentearl/structureHarvester, accessed on 1 April 2024).
2.5. Association Mapping for the Determination of Marker–Trait Associations (MTA)
The wilt disease scores and genotypic data were analysed to identify the significant MTAs using both the generalized linear model (GLM) and mixed linear model (MLM) approaches in TASSEL v. 5.0 [32,33]. To detect the MTAs, thresholds of p < 0.05 < 0.01 were applied.
3. Results
3.1. The Identification of Pathogenic Fungi Isolates
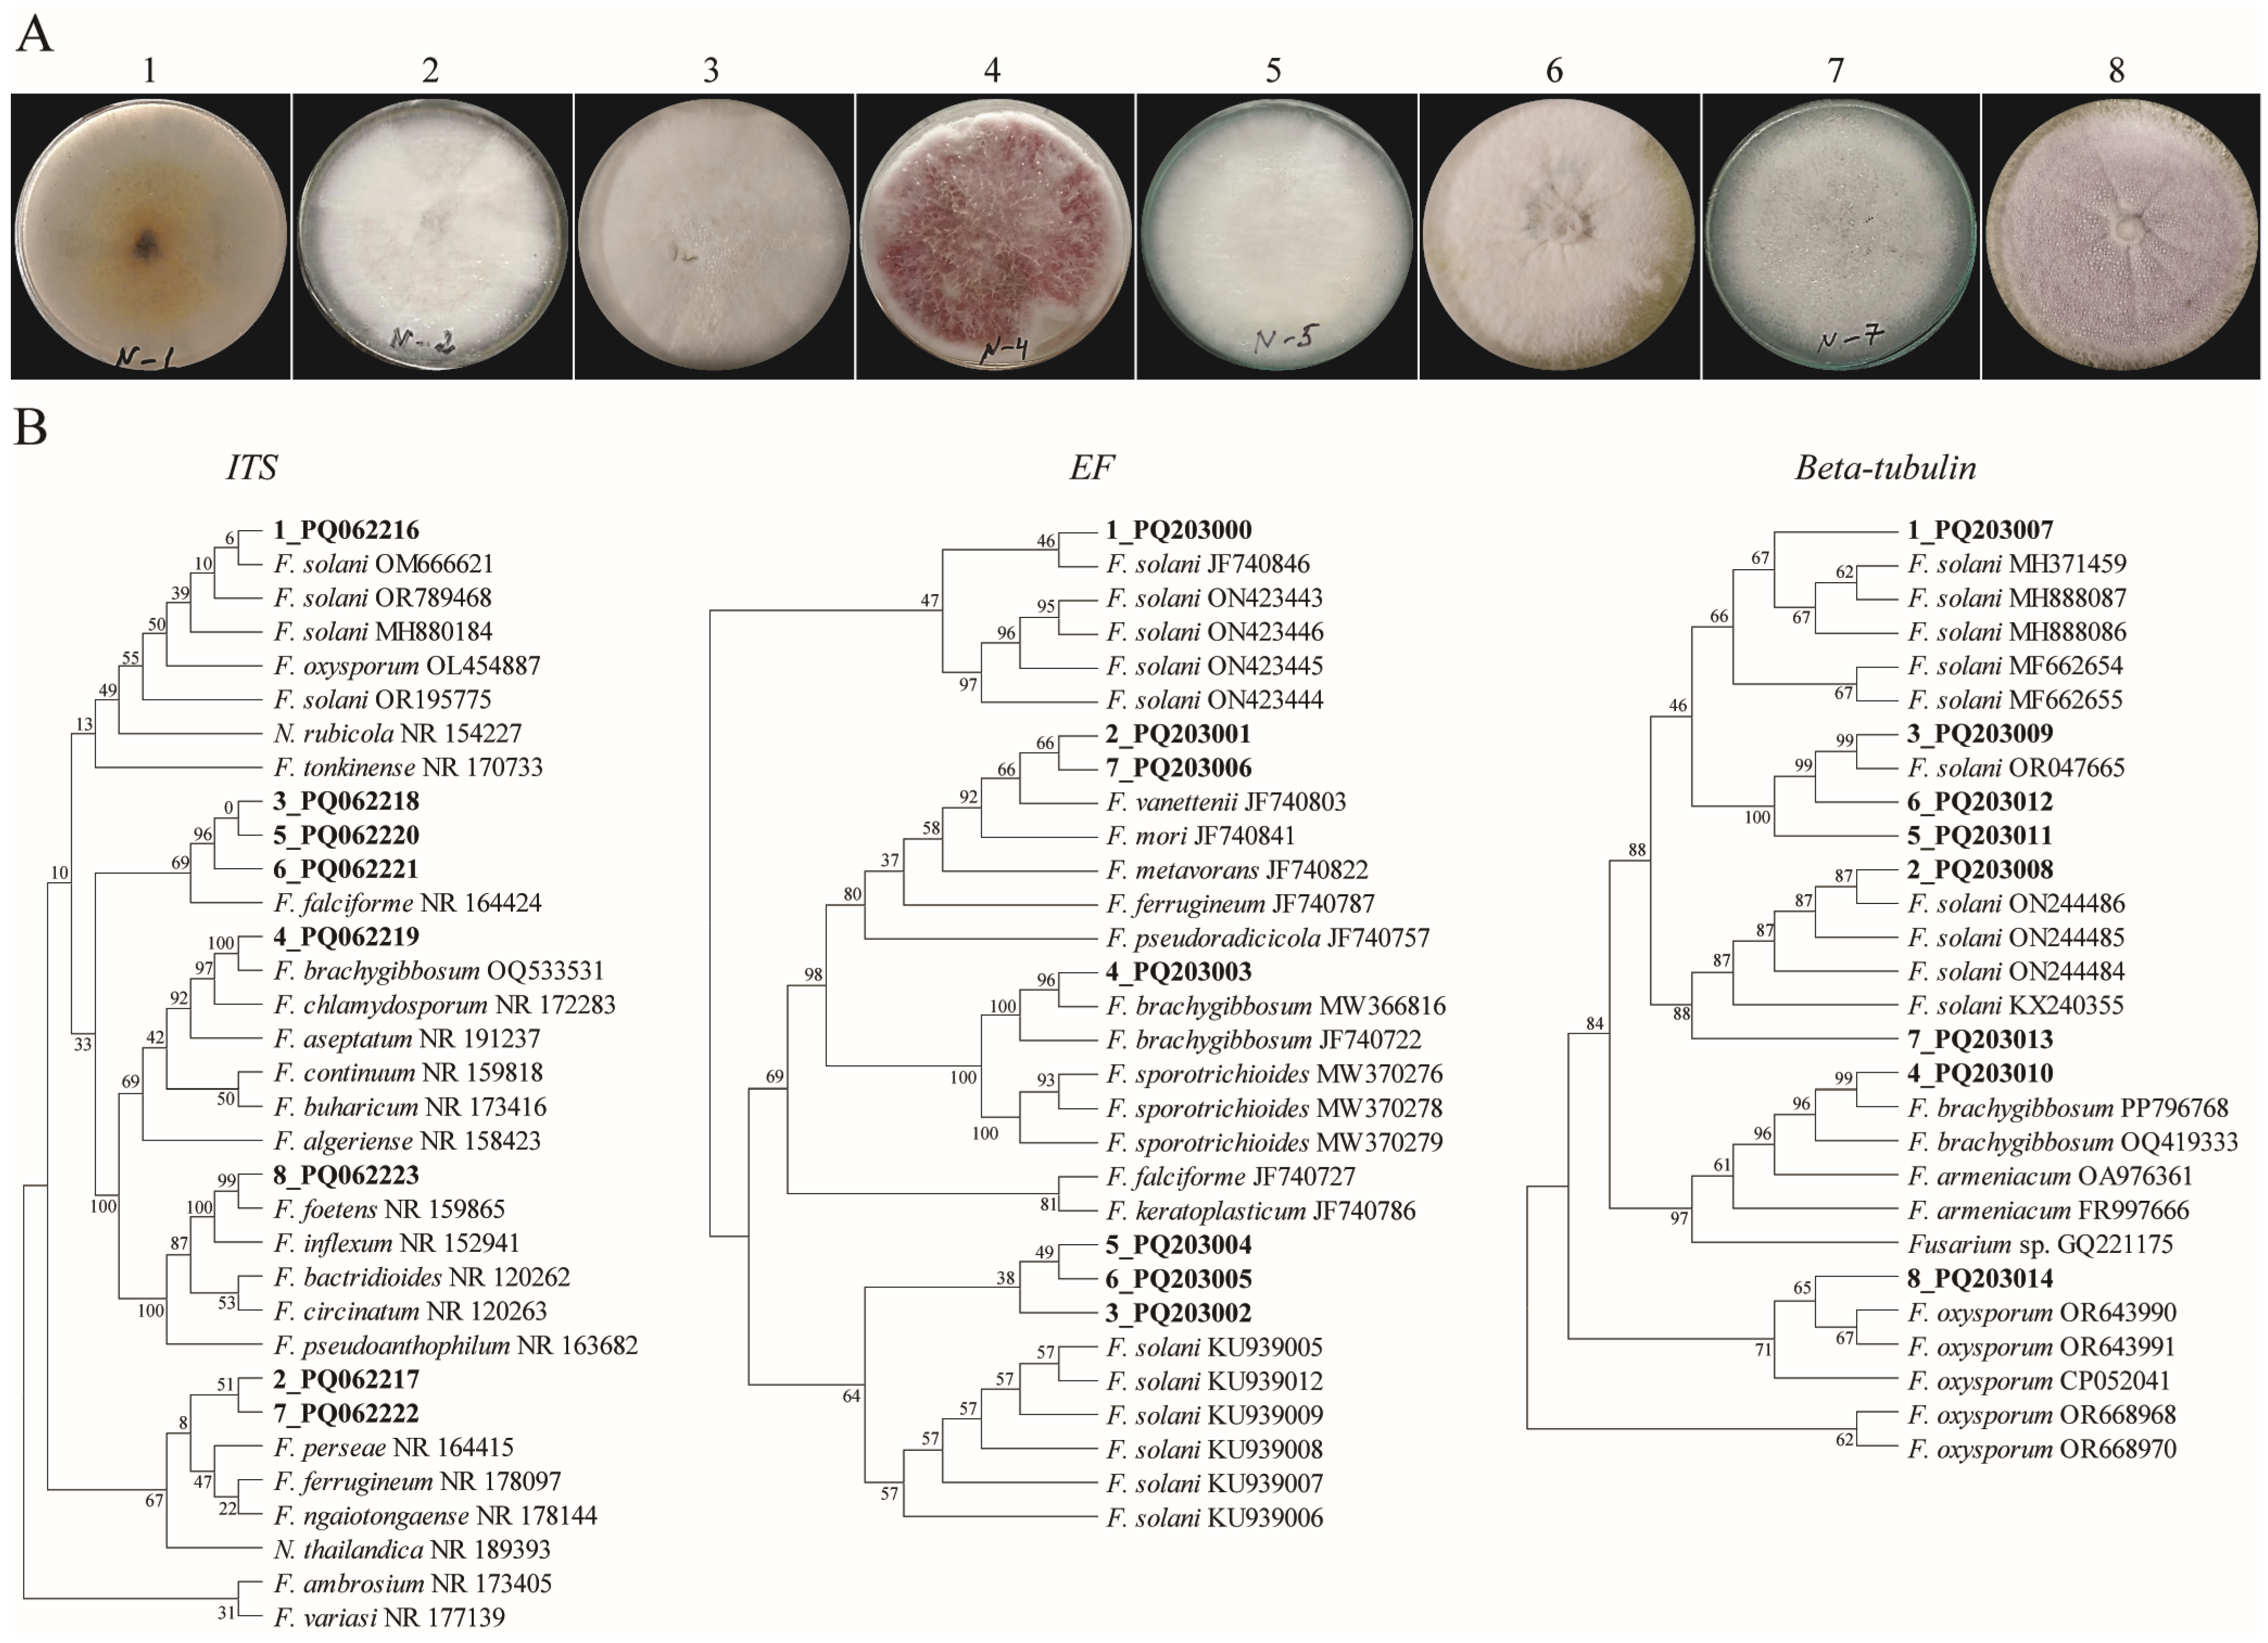
The fungi isolates from the diseased chickpeas were collected. Based on the colonial morphologies of these isolates, we selected those that closely resembled Fusarium patterns for molecular identification. The identification of the selected fungal isolates using a sequence of internal transcribed spacer (ITS) regions demonstrated that all selected isolates belonged to the Fusarium species. Among them, eight Fusarium isolates were chosen to further identify their species level (Figure 1).
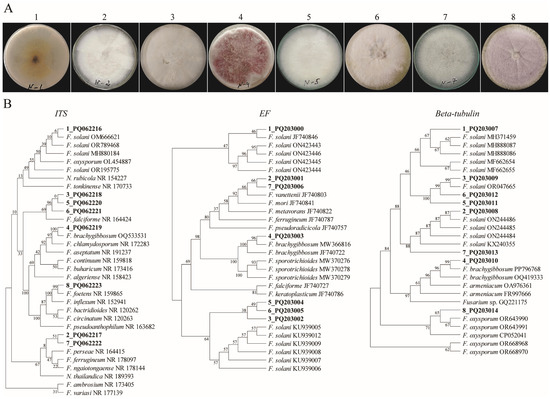
Figure 1.
The morphological and molecular data of the Fusarium isolates. (A) A colonial morphology of Fusarium species. The numbers indicate the number of isolates. (B) The phylograms of the fungal isolates were constructed using a MP analysis based on ITS, tef1-α, and beta-tubulin barcodes. The evolutionary history was inferred using the Maximum Parsimony method. The percentages of replicate trees in which the associated taxa are clustered together in the bootstrap test (500 replicates) are shown next to the branches. The MP tree was obtained using the Subtree-Pruning-Regrafting (SPR) algorithm with the search level 1, in which the initial trees were obtained by the random addition of sequences (10 replicates). The evolutionary analyses were conducted in MEGA11.
The DNA from the eight selected Fusarium species was extracted, and the ITS, tef1-α, and tub2 regions were used as DNA barcodes. For each barcode, a parsimonious tree (MP) was built. The results indicated that isolates 1 and 4, based on three barcodes, were identified as F. solani and F. brachygibbosum, respectively, in all three DNA barcodes. The other isolates represented different species of Fusarium (Figure 1B). However, the polyphasic identification (https://www.fusarium.org/, accessed on 1 April 2024) of isolates using the three barcodes revealed that six of the isolates were distinct Fusarium species, while isolates 3, 5, and 6 were identified as F. falciformis (Table 1).

Table 1.
The polyphasic identification of fungal isolates using three DNA barcodes.
Further, to select the highly virulent fungal species, we examined their virulency with respect to the plants showing the greatest wilting symptoms in order to inoculate the chickpea samples. The results showed that isolate number 4 was identified as F. brachygibbosum (which demonstrated a strong wilting symptom in the three independently repeated experiments (Supplementary Figure S1)).
3.2. Genetic Diversity for FW Resistance
An analysis of the FW response in 96 chickpea genotypes revealed a wide range of genetic variability. Figure 1 illustrates the frequency distribution of disease incidence among the tested chickpea genotypes throughout the year. In combining the disease scoring data from the year, a total of 68 genotypes, or 70.8%, were classified as resistant (R); 15, or 15.6%, as moderately resistant (MR); 8, or 8.3%, as moderately susceptible, and 5, or 5.2%, as susceptible (S) (Figure 2; Table 2).
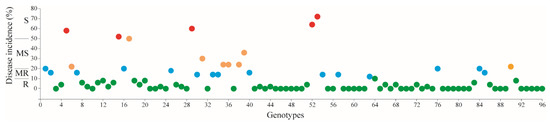
Figure 2.
The distribution of the Fusarium response of the 96 (CIFWN and CIENMED) chickpea genotypes. R: resistant (green), MR: moderately resistant (blue), MS: moderately susceptible (orange), S: susceptible (red).
Table 2.
Details of the 96 chickpea genotypes used for the study.
3.3. A SSR-Based Molecular Diversity Analysis
A total of 180 SSR markers were screened from the genotypes used in this study (Supplementary Table S2). Among them, 69 markers demonstrated a varied degree of polymorphism, 60 markers showed monomorphic fragments, and the rest of the markers did not produce any fragments, as observed from PCR products on 2.5% agarose gel. These SSRs, previously reported by various research groups [34,35], cover all eight linkage groups (LGs) of chickpeas. An assessment of 96 chickpea genotypes using 69 polymorphic SSRs resulted in the detection of 191 alleles with an average of 2.8 alleles per marker (Supplementary Table S3). The number of observed alleles ranged from two to five, while the PIC values varied between 0.1 and 0.37. Additionally, the gene diversity spanned from 0.1 to 0.5, with an average value of 0.4.
3.4. A Structure Analysis and Cluster Analysis
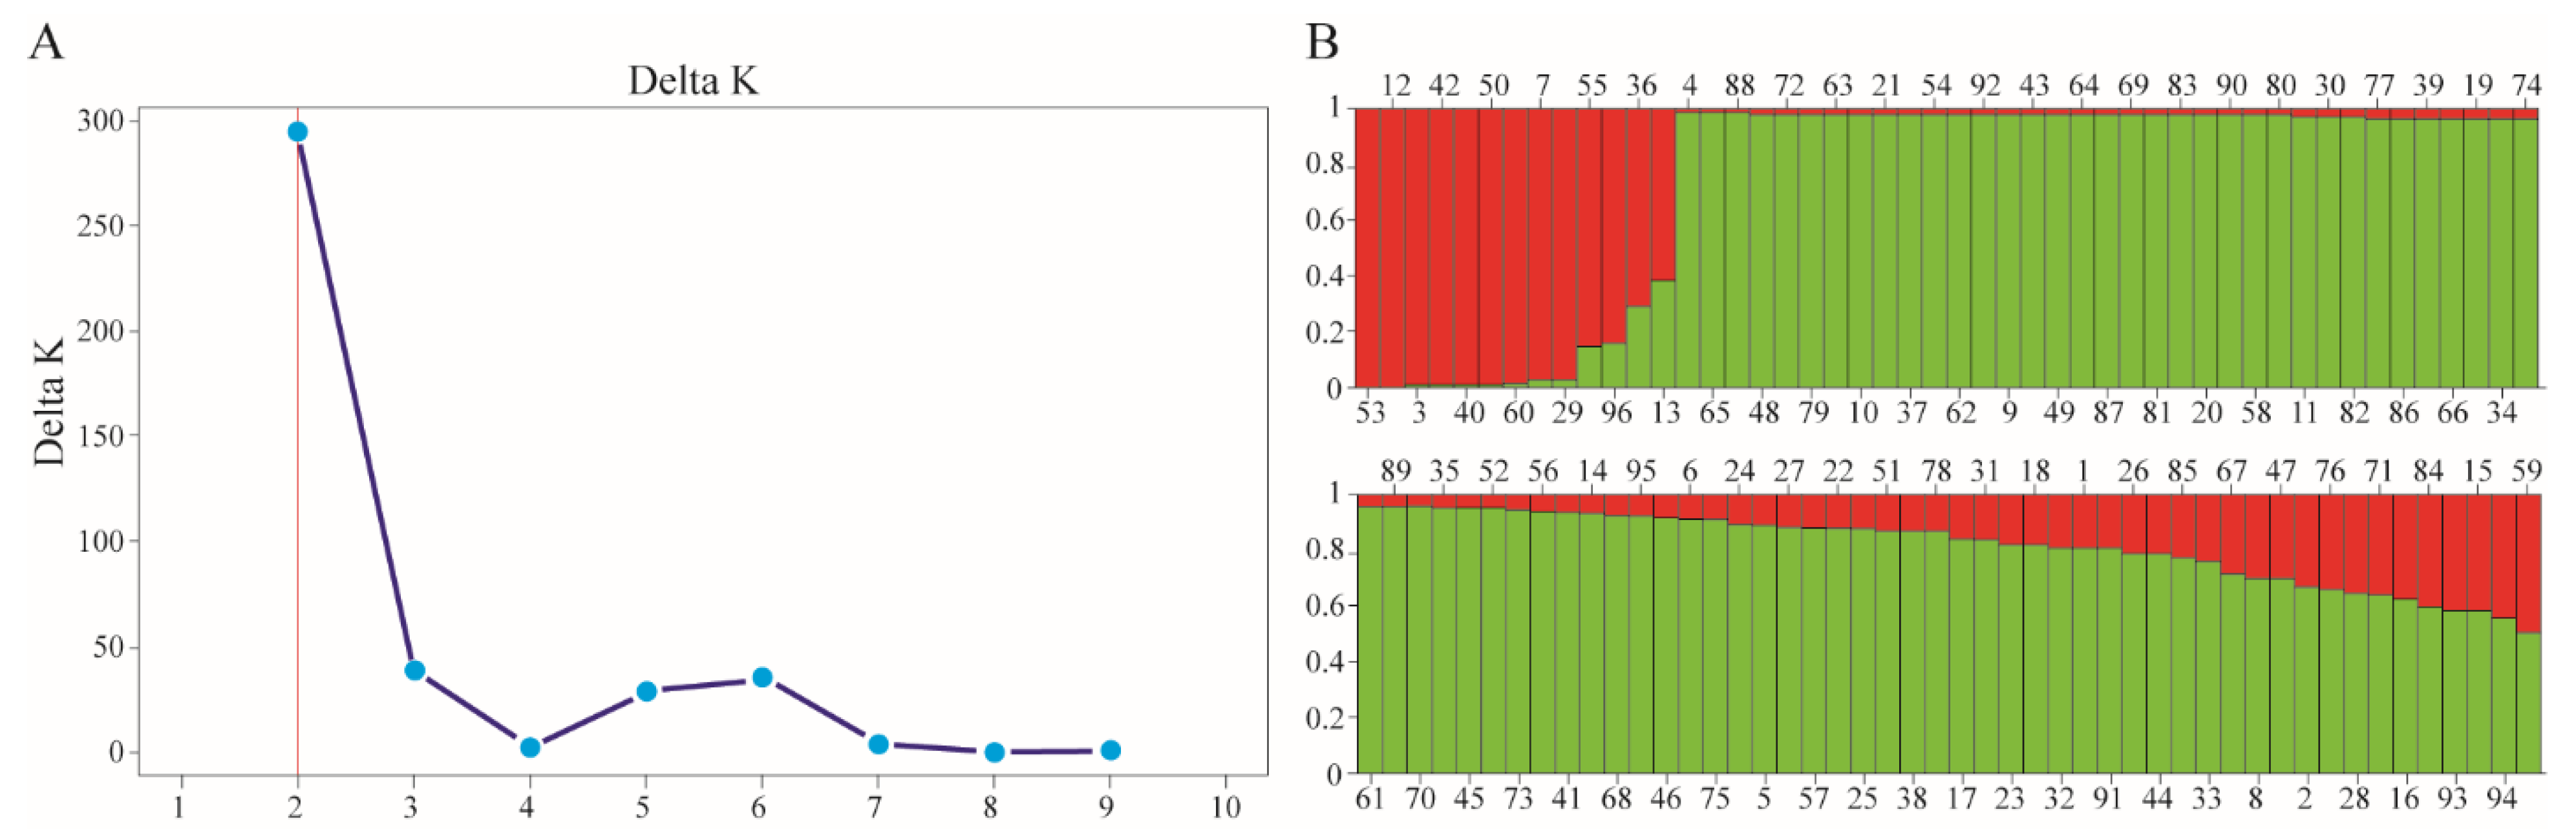
Using the Bayesian approach with the STRUCTURE software, the population structure of the 96 chickpea genotypes was examined. The population structure study was conducted using a pre-determined number of clusters (K) from 1 to 10 with the optimal number of clusters determined based on the maximum value of delta K (an ad hoc quantity). The highest measure of delta K was attained at K = 2 [31], indicating the existence of two subpopulations in the entire collection (Figure 3A). Based on their Q-values, genotypes with a shared ancestry ≥80% diverged into two major clusters, cluster QI (11 genotypes), and cluster QII (68 genotypes). The remaining 17 genotypes (17.7%) were admixtures with a shared ancestry of <80% (Figure 3B).

Figure 3.
An analysis of the population structure of the chickpea genotypes. (A) An estimation of the hypothetical subpopulations based on the ΔK values. (B) A population structure analysis based on the Q-values. The maximum measure of Evanno’s delta K, determined by the STRUCTURE HARVESTER, was K = 2, which indicates that the entire population can be grouped into 2 subpopulations (red and green).
A Neighbour-joining clustering analysis was performed with a Bayesian-based population structure. The pairwise, the genetic distances among the 96 genotypes ranged from 0.087912 to 0.478022. The entire set of 96 genotypes was grouped into two clusters, based on unweighted neighbour-joining clustering. Cluster 1 contained 62 genotypes, while cluster 2 had 34 genotypes (Figure 3). The delta K-based clusters corresponded to the NJ tree clusters that were assigned according to the population structures QI (red) and QII (green) (Figure 4).
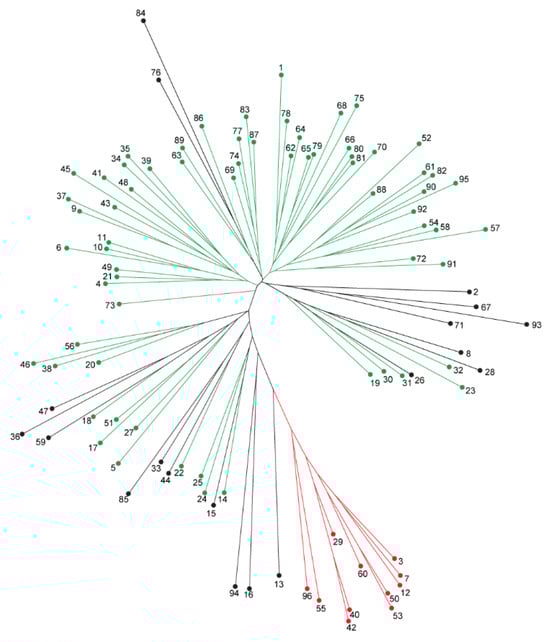
Figure 4.
The cluster and population structure analyses. A neighbour-joining tree of the 96 chickpea genotypes for FW resistance phenotyping. Green and red colors indicate Cluster I and II, respectively, while the black color indicates the admixtures identified by STRUCTU RE analysis.
3.5. Identifying the Associations Related to FW Resistance
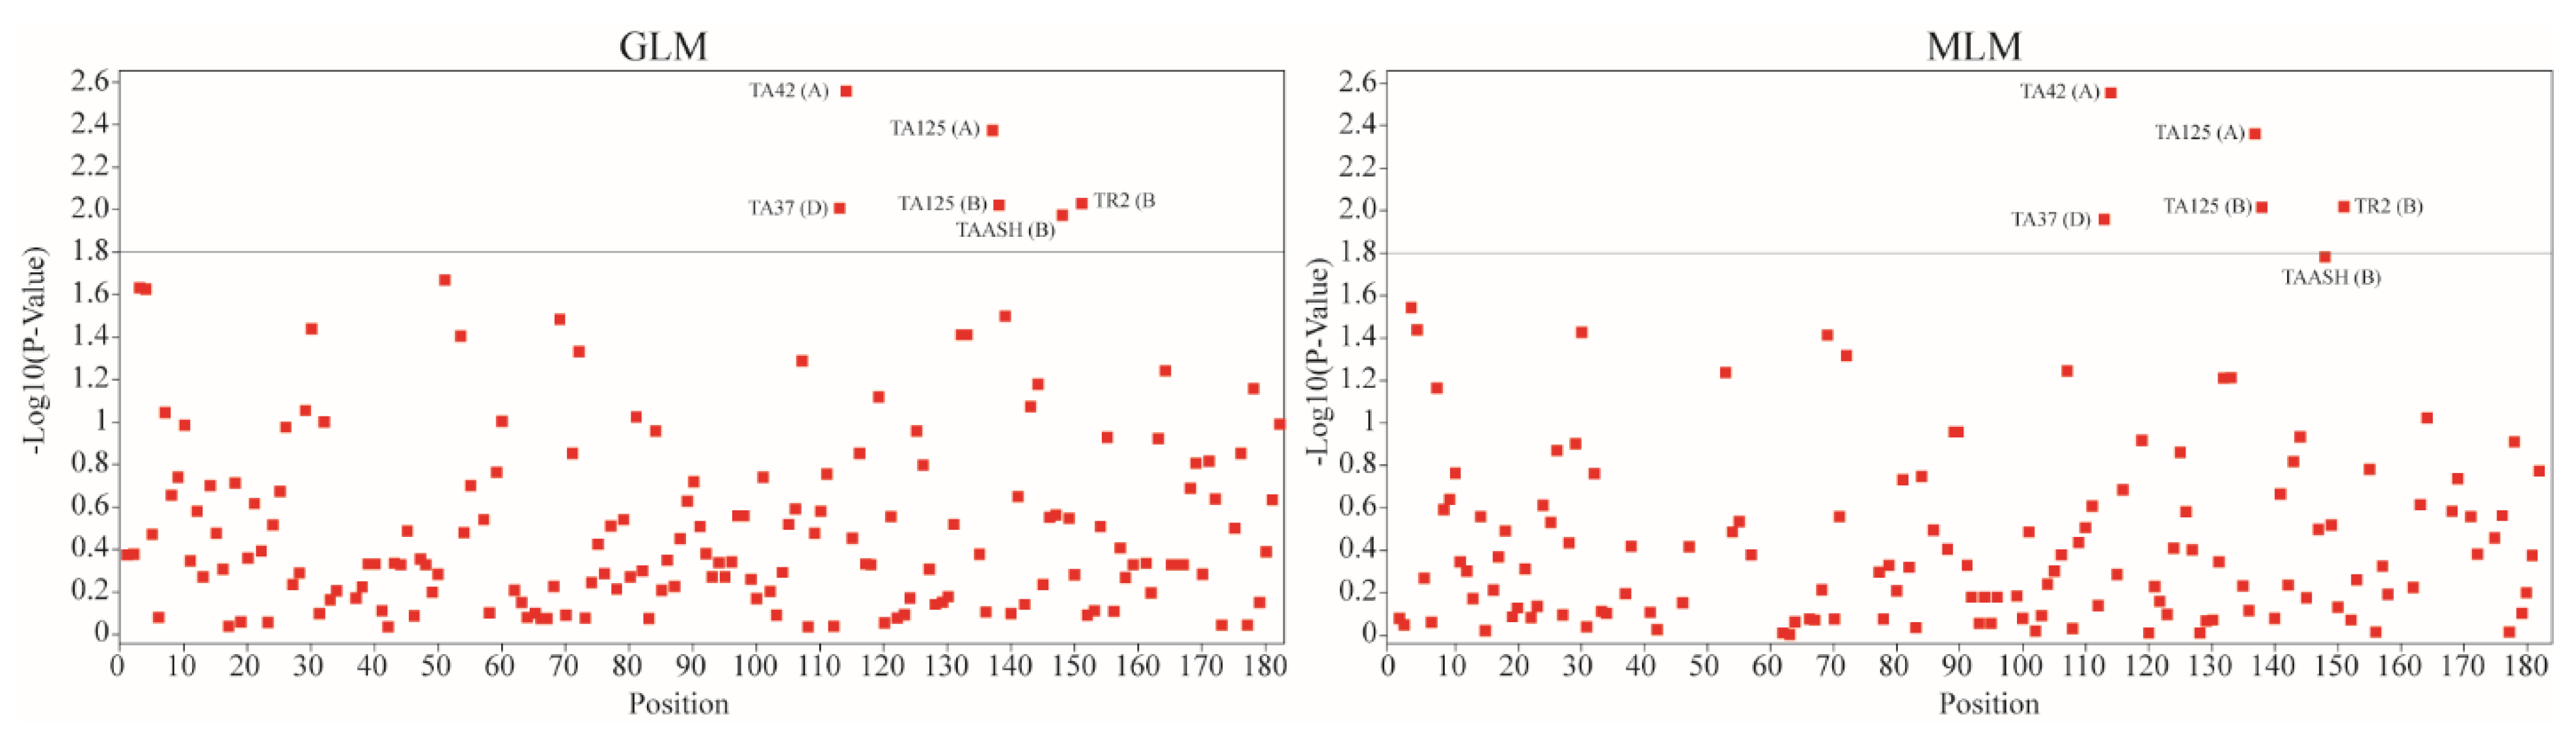
We utilized both the general linear model (GLM) and mixed linear model (MLM) approaches to identify significances in the association mappings for the Fusarium wilt (FW) incidence data and the simple sequence repeat (SSR) dataset. The GLM analysis identified an associative group showing a significance level higher than p < 0.05 for FW-resistant traits. Figure 5 presents the Manhattan plots depicting the FW resistance based on both the GLM and MLM analyses, with a threshold p-value set at 1.8.
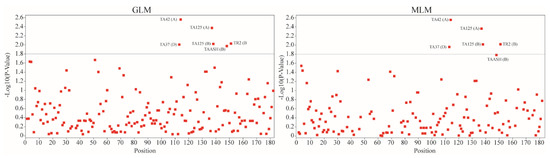
Figure 5.
A mapping of the genomic loci linked with Fusarium wilt resistance in chickpeas (GLM and MLM analyses for association mapping).
Both approaches identified the following five common marker–trait associations (MTAs) for FW resistance: TA42, TA125 (A), TA125 (B), TA37, and TAASH. TR2, however, was detected as significant only in the GLM analysis. Table 3 provides detailed data on these findings. The GLM analysis revealed significant associations with the R2 values ranging from 0.06927 to 0.091, while the MLM analysis demonstrated significant associations with the R2 values ranging from 0.0596 to 0.0912 for two MTAs. Interestingly, both the GLM and MLM analyses detected additional significant MTAs for the TA125 SSR marker. These SSR markers displayed the highest associations, and a p-value of 0.05 was particularly noteworthy for its significance. This indicates the robustness of the associations detected across different analytical approaches.
Table 3.
The significant MTAs for FW resistance in the chickpeas obtained in the year 2023 from the GLM and MLM approaches to association mapping.
4. Discussion
The purpose of this study was to identify the SSR (simple sequence repeat) markers that are linked to Fusarium wilt (FW) traits in chickpeas. SSR markers are abundant throughout the genome, valued for their high reproducibility and cost-effectiveness, and are applicable to a broad range of species. Their widespread occurrence allows researchers to pinpoint markers that are closely associated with specific traits, which is beneficial in marker-assisted breeding. In our research, we examined 96 chickpea genotypes using 69 SSR markers exhibiting polymorphism. This analysis revealed a total of 191 alleles, with an average of 2.8 alleles per marker. These results are in line with previous studies of chickpeas [28,38].
Diseases caused by Fusarium species, causing root rot and Fusarium wilt, have a considerable impact on chickpea yields worldwide. These Fusarium species are notable pathogens that can cause damping-off in chickpea seedlings and affect mature plants, as well. [39]. Among these, Fusarium oxysporum f. sp. ciceri is particularly significant, and is the primary cause of Fusarium wilt in chickpeas across various production regions globally [40,41]. However, there remains a notable gap in the accurate identification of the Fusarium pathogens responsible for root rot in chickpeas. This study addresses this issue by focusing on both morphological and molecular methods for identifying Fusarium species. Previous research highlights the challenges involved in accurately identifying these pathogens and emphasizes the necessity of employing a thorough approach that combines both morphological observation and genetic analysis [42].
Extensive research has been conducted on various genetic markers in the identification of Fusarium species, including the EF-1α gene, the ribosomal DNA internal transcribed spacer (ITS) region, and the β-tubulin gene. Among these markers, the partial sequencing of the EF-1α gene has been particularly recognized for its precision and effectiveness in identifying Fusarium species, compared to the other markers [43]. The current study utilized ITS, tef1-α, and tub2 as DNA barcodes to identify Fusarium species. Notably, a BLAST analysis of these individual markers identified Fusarium species that were similar but distinct (Figure 1B). However, employing a polyphasic approach, which is well-suited for developing taxonomic hypotheses [44], revealed six distinct Fusarium species in the Fusarioid-ID database. Our findings align with those of Moparthi et al. [6], who identified several Fusarium species from wilted chickpea plants. Among the identified species, F. brachygibbosum is known to be a fungal pathogen responsible for causing wilting in a variety of plants [45,46]. In the current study, F. brachygibbosum was selected to infect the chickpea samples for the association mapping study due to its ability to induce severe wilting symptoms.
The use of association mapping to identify breeding-relevant traits has gained significant attention for speeding up crop improvement. Notable examples of MTA identification in chickpeas include the mapping of traits such as drought tolerance [47], heat stress resistance [28], seed weight and seed protein content [48], and grain zinc content [49]. Previous studies have elucidated the genetic basis of FW resistance in chickpeas [17,50,51], identifying MTAs through biparental quantitative trait locus (QTL) mapping.
Overall, the potential of association genetics to identify the genomic regions responsible for FW resistance has been partially explored. Subsequent scientific research on chickpeas, focused on their resistance to FW, particularly in the Foc-2 race, was conducted. This involved initial efforts in constructing an association map [38]. In the present study, five markers showed a significant association with the FW response, using both the GLM and MLM methods. Both analyses identified common markers associated with wilt resistance. Earlier studies of chickpeas have reported the presence of QTLs associated with FW resistance in LG01 [52]. Notably, over the course of year, four SSR markers, TA37, TA42, TA125, and TAASH, exhibited consistent significance in the association mappings for FW resistance in both the GLM and MLM analyses. Several studies reported that chickpea resistance to three Foc races (1, 2 and 3) in pot culture experiments was identified as flanking and tightly linked with DNA markers associated with resistance genes. According to molecular analyses, the TA125 marker is the most prominent for FW resistance, producing the highest number of alleles (9) [53]. Moreover, the TA125 SSR marker is associated with drought tolerance in chickpeas [54], indicating that the associated locus may respond to both abiotic and biotic stresses. The closest marker, TA37, was identified at a distance of 0.2 centimorgan (cM) from Foc-1 in LG2. Additionally, TR2 was identified 3.0 cM from the Foc-1 locus, flanking it. These markers, TA37 and TR2, can be utilized in marker-assisted selection, the introgression of resistance genes (R-genes) into economically important cultivars, and, ultimately, to clone the candidate gene for FW resistance [55]. The genomic regions associated with a resistance to FW have been identified and are flanked by the markers TA37 and CaM1402-CaM1101 on the chromosome Ca6 [56]. TA37 is reported to be in the cluster containing genes conferring FW resistance in the linkage group 2 [57]. Moreover, it has successfully amplified an allele of 290 bp in resistant genotypes and shows great potential in the distinction between resistant and susceptible genotypes. It can be reliably used in marker-assisted selection for enhancing wilt resistance in chickpeas. The marker TR2 was significantly associated with a FW response in the GLM analysis. Interestingly, this marker also linked to botrytis grey mould (BGM) resistance, making it useful for developing chickpea genotypes that are tolerant to BGM [58]. A QTL analysis in a similar study revealed the presence of QTLs for both early and late wilting in LG2 [59]. The QTL mapping of FW resistance placed the TAASH marker in LG5 and the TA125 marker in LG1 [50,60]. LG2 in chickpeas notably contains genes/QTLs resistant to the FW races 1 (Foc1), 3 (Foc3), 4 (Foc4), and 5 (Foc5), as reported by various studies [17,50,51,61,62]. Through composite interval mapping, it was determined that there are two main loci in LG1 and LG2. These two loci are considered the primary loci of FW resistance, explaining up to 76.66% of the phenotypic variations in FW resistance [63]. The QTLs in LG4 and LG6 were reported to be associated with Ascochyta blight resistance [64].
Therefore, SSR markers hold promise as indicators to select the desired level of resistance against FW in chickpeas. To enhance the efficiency of identifying chickpea lines resistant to Fusarium wilt disease within the existing germplasm, molecular markers can be employed for screening. This approach will aid in gene pyramiding and molecular breeding [65]. Previous researchers have identified the genetic linkage of resistance genes by utilizing various RAPD and SSR markers for the different races of Foc (Foc 1, 2, 3, 4, and 5) in inbred chickpea lines derived from both resistant and susceptible parent combinations [66]. In our study, we used SSR markers to identify the markers linked to resistance against the F. brachygibbosum pathogen in chickpeas. However, further investigation is needed to uncover the races of this pathogen. This will aid in the selection of chickpea lines resistant to specific races. It is worth mentioning that the SSR markers associated with FW resistance in chickpeas might also be linked to other quantitative and qualitative traits. This enhances the reliability of these marker associations. Therefore, in our future research, we will also conduct association mapping studies on other traits in chickpeas.
5. Conclusions
We conducted an identification of Fusarium isolates and an investigation into the disease response of 96 chickpea genotypes for Fusarium wilt (FW), using an association mapping approach. This study represents the first MTA analysis for FW in chickpeas, utilizing an FW-responsive chickpea collection and genome-wide SSRs. Significant associations with FW resistance were consistently identified by both the GLM and MLM analyses for the following four SSR markers: TA37, TA42, TA125, and TAASH. Nevertheless, a more detailed mapping is required to accurately pinpoint the responsible gene(s) within the candidate genomic regions for future studies and breeding initiatives aimed at improving FW resistance in chickpeas.
Supplementary Materials
The following supporting information can be downloaded at: https://www.mdpi.com/article/10.3390/agronomy14091943/s1, Figure S1: Infection chickpea with isolate 4 (Fusarium brachygibbosum); Table S1: Information of lines used for this study; Table S2: SSR markers used in this study; Table S3: Number of alleles, gene diversity, and polymorphism recorded in 96 chickpea genotypes.
Author Contributions
S.M.M. and T.A.B. wrote the manuscript and prepared all the tables and figures. D.E.Q. provided the chickpea seeds. S.M.M., I.S.A., L.A.A. and B.O.O. isolated and purified. DNA., S.M.M., G.O.K. and M.Z.I. contributed to fungal isolation. S.M.M., I.S.A. and T.A.B. performed fungal identification. S.M.M., S.K.M. and G.O.K. conducted the field work. I.B.S. was responsible for data analysis. T.A.B. supervised the experiment. T.A.B. and D.E.Q. were responsible for funding acquisition. All authors have read and agreed to the published version of the manuscript.
Funding
This research was funded by Ministry of Innovative Development of Uzbekistan (Grant № IL-402104268 and Crant № PZ-20200929166).
Data Availability Statement
The authors declare that the experimental data published in this paper are made accessible upon request for interested readers. All gene sequences of the genes can be found under the following accession numbers: PQ203000, PQ203001, PQ203002, PQ203003, PQ203004, PQ203005, PQ203006, PQ203007, PQ203008, PQ203009, PQ203010, PQ203011, PQ203012, PQ203013, PQ203014, PQ062216, PQ062218, PQ062220, PQ062221, PQ062219, PQ062223, PQ062217, and PQ062222.
Acknowledgments
We appreciate the support provided by Sirojbek Isokulov, from the Institute of Genetics and Experimental Biology of Plants, Uzbek Academy of Sciences, for his assistance with timely chemical ordering.
Conflicts of Interest
The authors declare that they have no conflicts of interest.
References
- Merga, B.; Haji, J.; Yildiz, F. Economic importance of chickpea: Production, value, and world trade. Cogent Food Agric. 2019, 5, 1615718. [Google Scholar] [CrossRef]
- FAOSTAT. Available online: https://www.fao.org/faostat/en/#home (accessed on 2 June 2024).
- Varshney, R.K.; Mir, R.R.; Bhatia, S.; Thudi, M.; Hu, Y.; Azam, S.; Zhang, Y.; Jaganathan, D.; You, F.M.; Gao, J.; et al. Integrated physical, genetic and genome map of chickpea (Cicer arietinum L.). Funct. Integr. Genom. 2014, 14, 59–73. [Google Scholar] [CrossRef]
- Varshney, R.K.; Graner, A.; Sorrells, M.E. Genic microsatellite markers in plants: Features and applications. Trends Biotechnol. 2005, 23, 48–55. [Google Scholar] [CrossRef]
- Udupa, S.M.; Robertson, L.D.; Weigand, F.; Baum, M.; Hahl, G. Allelic variation at (TAA)n microsatellite loci in a world collection of chickpea (Gicer arietinum L.) germplasm. Mol. Gen. Genet. 1999, 261, 354–363. [Google Scholar] [CrossRef]
- Moparthi, S.; Perez-Hernandez, O.; Burrows, M.E.; Bradshaw, M.J.; Bugingo, C.; Brelsford, M.; McPhee, K. Identification of Fusarium spp. associated with chickpea root rot in Montana. Agriculture 2024, 14, 974. [Google Scholar] [CrossRef]
- Cunnington, J.; Lindbeck, K.; Jones, R.H. National diagnostic protocol for the detection of Fusarium wilt of Chickpea (Fusarium oxysporum f. sp. ciceris). In Plant Health Australia; SPHD: Canberra, Australia, 2007. [Google Scholar]
- Trapero-Casas, A.; Jimenez-Díaz, R.M. Fungal wilt and root rot diseases of chickpea in southern Spain. Phytopathol. Mediterr. 1985, 75, 1146–1151. [Google Scholar] [CrossRef]
- Jalali, B.L.; Chand, H. Diseases of International Importance, Diseases of Cereals and Pulses; Singh, U.S., Chaube, H.S., Kumar, J., Mukhopadhyay, A.N., Eds.; Prentice Hall: Englewood Cliff, NJ, USA, 1992; Volume 1, pp. 429–444. [Google Scholar]
- Jiménez-Díaz, R.M.; Castillo, P.; Jiménez-Gasco, M.; Landa, B.B.; Navas-Cortés, J.A. Fusarium wilt of chickpeas: Biology, ecology and management. Crop Prot. 2015, 73, 16–27. [Google Scholar] [CrossRef]
- Del Mar Jimenez-Gasco, M.; Jimenez-Diaz, R.M. Development of a specific polymerase chain reaction-based assay for the identification of Fusarium oxysporum f. sp. ciceris and its pathogenic races 0, 1A, 5, and 6. Phytopathology 2003, 93, 200–209. [Google Scholar] [CrossRef]
- Halila, M.H.; Strange, R.N. Identification of thecausal agent of wilt of chickpea in Tunisia as Fusarium oxysporum f. sp. ciceris race 0. Phytopathol. Mediterr. 1996, 35, 67–74. [Google Scholar]
- Navas-Cortes, J.A.; Hau, B.; Jimenez-Diaz, R.M. Yield loss in chickpeas in relation to development of fusarium wilt epidemics. Phytopathology 2000, 90, 1269–1278. [Google Scholar] [CrossRef]
- Arvayo-Ortiz, R.M.; Esqueda, M.; Acedo-Felix, E.; Sanchez, A.; Gutierrez, A. Morphological variability and races of Fusarium oxysporum f.sp. ciceris associated with chickpea (Cicer arietinum) crops. Am. J. Agric. Biol. Sci. 2011, 6, 114–121. [Google Scholar] [CrossRef]
- Infantino, A.; Kharrat, M.; Riccioni, L.; Coyne, C.J.; McPhee, K.E.; Grünwald, N.J. Screening techniques and sources of resistance to root diseases in cool season food legumes. Euphytica 2006, 147, 201–221. [Google Scholar] [CrossRef]
- Tesso, T.T.; Ochanda, N.; Little, C.R.; Claflin, L.T.; Tuinstra, M.R. Analysis of host plant resistance to multiple Fusarium species associated with stalk rot disease in sorghum [Sorghum bicolor (L.) Moench]. Field Crops Res. 2010, 118, 177–182. [Google Scholar] [CrossRef]
- Caballo, C.; Castro, P.; Gil, J.; Millan, T.; Rubio, J.; Die, J.V. Candidate genes expression profiling during wilting in chickpea caused by Fusarium oxysporum f. sp. ciceris race 5. PLoS ONE 2019, 14, e0224212. [Google Scholar] [CrossRef]
- Jimenez-Diaz, R.M.; Trapero-Casas, A.; de La Colina, J.C. Races of Fusarium oxysporum f. sp. ciceri infecting chickpeas in southern Spain. In Vascular Wilt Diseases of Plants: Basic Studies and Control; Springer: Berlin/Heidelberg, Germany, 1989; pp. 515–520. [Google Scholar]
- Gurjar, G.; Barve, M.; Giri, A.; Gupta, V. Identification of Indian pathogenic races of Fusarium oxysporum f. sp. ciceris with gene specific, ITS and random markers. Mycologia 2009, 101, 484–495. [Google Scholar] [CrossRef]
- Kesawat, M.S.; Das Kumar, B. Molecular markers: It’s application in crop improvement. J. Crop Sci. Biotechnol. 2009, 12, 169–181. [Google Scholar] [CrossRef]
- Kumar, R.; Sharma, V.K.; Rangari, S.K.; Jha, U.C.; Sahu, A.; Paul, P.J.; Gupta, S.; Gangurde, S.S.; Kudapa, H.; Mir, R.R.; et al. High confidence QTLs and key genes identified using Meta-QTL analysis for enhancing heat tolerance in chickpea (Cicer arietinum L.). Front. Plant Sci. 2023, 14, 1274759. [Google Scholar] [CrossRef]
- Zane, L.; Bargelloni, L.; Patarnello, T. Strategies for microsatellite isolation: A review. Mol. Ecol. 2002, 11, 1–16. [Google Scholar] [CrossRef] [PubMed]
- Morgante, M.; Salamini, F. SSR (Simple Sequence Repeat) markers in crop improvement. In Genetic Diversity in Plants; Springer: Berlin/Heidelberg, Germany, 2003. [Google Scholar]
- Liu, D.; Coloe, S.; Baird, R.; Pederson, J. Rapid mini-preparation of fungal DNA for PCR. J. Clin. Microbiol. 2000, 38, 471. [Google Scholar] [CrossRef]
- Liu, X.; Li, X.; Bozorov, T.A.; Ma, R.; Ma, J.; Zhang, Y.; Yang, H.; Li, L.; Zhang, D. Characterization and pathogenicity of six Cytospora strains causing stem canker of wild apple in the Tianshan Forest, China. For. Pathol. 2020, 50, e12587. [Google Scholar] [CrossRef]
- Armstrong-Cho, C.; Sivachandra Kumar, N.T.; Kaur, R.; Banniza, S. The chickpea root rot complex in Saskatchewan, Canada- detection of emerging pathogens and their relative pathogenicity. Front. Plant Sci. 2023, 14, 1117788. [Google Scholar] [CrossRef] [PubMed]
- Chumakov, A.E.; Minkevich, I.I.; Vlasov, Y.; Gavrilova, E.A. The Main Methods of Phytopathological Research; Kolos: Moscow, Russia, 1974. [Google Scholar]
- Jha, U.C.; Jha, R.; Bohra, A.; Parida, S.K.; Kole, P.C.; Thakro, V.; Singh, D.; Singh, N.P. Population structure and association analysis of heat stress relevant traits in chickpea (Cicer arietinum L.). 3 Biotech 2018, 8, 43. [Google Scholar] [CrossRef]
- Saghai-Maroof, M.A.; Soliman, K.M.; Jorgensen, R.A.; Allard, R.W. Ribosomal DNA spacer-length polymorphisms in barley: Mendelian inheritance, chromosomal location, and population dynamics. Proc. Natl. Acad. Sci. USA 1984, 81, 8014–8018. [Google Scholar] [CrossRef]
- Pritchard, J.K.; Stephens, M.; Donnelly, P. Inference of population structure using multilocus genotype data. Genetics 2000, 155, 945–959. [Google Scholar] [CrossRef]
- Evanno, G.; Regnaut, S.; Goudet, J. Detecting the number of clusters of individuals using the software STRUCTURE: A simulation study. Mol. Ecol. 2005, 14, 2611–2620. [Google Scholar] [CrossRef] [PubMed]
- Bradbury, P.J.; Zhang, Z.; Kroon, D.E.; Casstevens, T.M.; Ramdoss, Y.; Buckler, E.S. TASSEL: Software for association mapping of complex traits in diverse samples. Bioinformatics 2007, 23, 2633–2635. [Google Scholar] [CrossRef]
- Zhang, Z.; Ersoz, E.; Lai, C.Q.; Todhunter, R.J.; Tiwari, H.K.; Gore, M.A.; Bradbury, P.J.; Yu, J.; Arnett, D.K.; Ordovas, J.M.; et al. Mixed linear model approach adapted for genome-wide association studies. Nat. Genet. 2010, 42, 355–360. [Google Scholar] [CrossRef]
- Gujaria, N.; Kumar, A.; Dauthal, P.; Dubey, A.; Hiremath, P.; Bhanu Prakash, A.; Farmer, A.; Bhide, M.; Shah, T.; Gaur, P.M.; et al. Development and use of genic molecular markers (GMMs) for construction of a transcript map of chickpea (Cicer arietinum L.). Theor. Appl. Genet. 2011, 122, 1577–1589. [Google Scholar] [CrossRef] [PubMed]
- Choudhary, S.; Gaur, R.; Gupta, S. EST-derived genic molecular markers: Development and utilization for generating an advanced transcript map of chickpea. Theor. Appl. Genet. 2012, 124, 1449–1462. [Google Scholar] [CrossRef]
- Gaur, R.; Sethy, N.K.; Choudhary, S.; Shokeen, B.; Gupta, V.; Bhatia, S. Advancing the STMS genomic resources for defining new locations on the intraspecific genetic linkage map of chickpea (Cicer arietinum L.). BMC Genom. 2011, 12, 117. [Google Scholar] [CrossRef]
- Winter, P.; Pfaff, T.; Udupa, S.M.; Huttel, B.; Sharma, P.C.; Sahi, S.; Arreguin-Espinoza, R.; Weigand, F.; Muehlbauer, F.J.; Kahl, G. Characterization and mapping of sequence-tagged microsatellite sites in the chickpea (Cicer arietinum L.) genome. Mol. Gen. Genet. 1999, 262, 90–101. [Google Scholar] [CrossRef] [PubMed]
- Jha, U.C.; Jha, R.; Bohra, A.; Manjunatha, L.; Saabale, P.R.; Parida, S.K.; Singh, N.P. Association mapping of genomic loci linked with Fusarium wilt resistance (Foc2) in chickpea. Plant Genet. Resour. Charact. Util. 2021, 19, 195–202. [Google Scholar] [CrossRef]
- Jendoubi, W.; Bouhadida, M.; Boukteb, A.; Béji, M.; Kharrat, M. Fusarium Wilt Affecting Chickpea Crop. Agriculture 2017, 7, 23. [Google Scholar] [CrossRef]
- Choudhary, A.K.; Kumar, S.; Patil, B.S.; Sharma, M.; Kemal, S.; Ontagodi, T.P.; Datta, S.; Patil, P.; Chaturvedi, S.K.; Sultana, R.; et al. Narrowing yield gaps through genetic improvement for Fusarium wilt resistance in three pulse crops of the semi-arid tropics. SABRAO J. Breed. Genet. 2013, 45, 341–370. [Google Scholar]
- Lakmes, A.; Jhar, A.; Sadanandom, A.; Brennan, A.C.; Kahriman, A. Inheritance of resistance to chickpea Fusarium wilt disease (Fusarium oxysporum f. sp. ciceris Race 2) in a wide-cross Cicer arietinum x Cicer reticulatum mapping family. Genes 2024, 15, 819. [Google Scholar] [CrossRef] [PubMed]
- O’Donnell, K.; Whitaker, B.K.; Laraba, I.; Proctor, R.H.; Brown, D.W.; Broders, K.; Kim, H.S.; McCormick, S.P.; Busman, M.; Aoki, T.; et al. DNA sequence-based identification of Fusarium: A Work in Progress. Plant Dis. 2022, 106, 1597–1609. [Google Scholar] [CrossRef] [PubMed]
- Knutsen, A.K.; Torp, M.; Holst-Jensen, A. Phylogenetic analyses of the Fusarium poae, Fusarium sporotrichioides and Fusarium langsethiae species complex based on partial sequences of the translation elongation factor-1 alpha gene. Int. J. Food Microbiol. 2004, 95, 287–295. [Google Scholar] [CrossRef]
- Gannibal, P.B. Polyphasic Approach to Fungal Taxonomy. Biol. Bull. Rev. 2022, 12, 18–28. [Google Scholar] [CrossRef]
- Namsi, A.; Rabaoui, A.; Masiello, M.; Moretti, A.; Othmani, A.; Gargouri, S.; Gdoura, R.; Werbrouck, S.P.O. First report of leaf wilt caused by Fusarium proliferatum and F. brachygibbosum on aate palm (Phoenix dactylifera) in Tunisia. Plant Dis. 2020, 105, 1217. [Google Scholar] [CrossRef]
- Qiu, R.; Li, J.; Zheng, W.; Su, X.; Xing, G.; Li, S.; Zhang, Z.; Li, C.; Wang, J.; Chen, Y.; et al. First report of root rot of tobacco caused by Fusarium brachygibbosum in China. Plant Dis. 2021, 105, 4170. [Google Scholar] [CrossRef]
- Thudi, M.; Upadhyaya, H.D.; Rathore, A.; Gaur, P.M.; Krishnamurthy, L.; Roorkiwal, M.; Nayak, S.N.; Chaturvedi, S.K.; Basu, P.S.; Gangarao, N.V.; et al. Genetic dissection of drought and heat tolerance in chickpea through genome-wide and candidate gene-based association mapping approaches. PLoS ONE 2014, 9, e96758. [Google Scholar] [CrossRef]
- Upadhyaya, H.D.; Bajaj, D.; Das, S.; Kumar, V.; Gowda, C.L.; Sharma, S.; Tyagi, A.K.; Parida, S.K. Genetic dissection of seed-iron and zinc concentrations in chickpea. Sci. Rep. 2016, 6, 24050. [Google Scholar] [CrossRef] [PubMed]
- Upadhyaya, H.D.; Bajaj, D.; Narnoliya, L.; Das, S.; Kumar, V.; Gowda, C.L.; Sharma, S.; Tyagi, A.K.; Parida, S.K. Genome-Wide Scans for Delineation of Candidate Genes Regulating Seed-Protein Content in Chickpea. Front. Plant Sci. 2016, 7, 302. [Google Scholar] [CrossRef]
- Winter, P.; Benko-Iseppon, A.M.; Hüttel, B.; Ratnaparkhe, M.; Tullu, A.; Sonnante, G.; Pfaff, T.; Tekeoglu, M.; Santra, D.; Sant, V.J.; et al. A linkage map of the chickpea (Cicer arietinum L.) genome based on recombinant inbred lines from a C. arietinum×C. reticulatum cross: Localization of resistance genes for fusarium wilt races 4 and 5. Theor. Appl. Genet. 2000, 101, 1155–1163. [Google Scholar] [CrossRef]
- Sharma, K.D.; Winter, P.; Kahl, G.; Muehlbauer, F.J. Molecular mapping of Fusarium oxysporum f. sp. ciceris race 3 resistance gene in chickpea. Theor. Appl. Genet. 2004, 108, 1243–1248. [Google Scholar] [CrossRef] [PubMed]
- Jingade, P.; Ravikumar, R.L. Development of molecular map and identification of QTLs linked to Fusarium wilt resistance in chickpea. J. Genet. 2015, 94, 723–729. [Google Scholar] [CrossRef]
- Soi, S.; Chauhan, U.S.; Yadav, R.; Kumar, J.; Yadav, S.S.; Yadav, H.; Kumar, R. STMS based diversity analysis in chickpea (Cicer arietinum L.) for Fusarium wilt. New Agric. 2014, 25, 243–250. [Google Scholar]
- Maqbool, M.A.; Aslam, M.; Ali, H.; Shah, T.M. Evaluation of advanced chickpea (Cicer arietinum L.) accessions based on drought tolerance indices and SSR markers against different water treatments. Pak. J. Bot. 2016, 48, 1421–1429. [Google Scholar]
- Barman, P.; Handique, A.K.; Tanti, B. Tagging STMS markers to Fusarium wilt race-1 resistance in chickpea (Cicer arietinum L.). Indian J. Biotechnol. 2014, 13, 370–375. [Google Scholar]
- Raghu, R.; Ravikumar, R.L. Development of novel microsatellite markers using genome sequence information in chickpea (Cicer arietinum L.). Mysore J. Agric. Sci. 2016, 50, 395–399. [Google Scholar]
- Millan, T.; Clarke, H.J.; Siddique, K.H.M.; Buhariwalla, H.K.; Gaur, P.M.; Kumar, J.; Juan, G.; Kahl, G.; Winter, P. Chickpea molecular breeding: New tools and concepts. Euphytica 2006, 147, 81–103. [Google Scholar] [CrossRef]
- Sachdeva, S.; Dawar, S.; Rani, U.; Patil, B.S.; Soren, K.R.; Singh, S.; Sanwal, S.K.; Chauhan, S.K.; Bharadwaj, C. Identification of SSR markers linked to Botrytis grey mould resistance in chickpea (Cicer arietinum). Phytopathol. Mediterr. 2019, 58, 283–292. [Google Scholar]
- Patil, B.S.; Ravikumar, R.L.; Bhat, J.S.; Soregaon, C.D. Molecular mapping of qtls for resistance to early and late Fusarium wilt in chickpea. Czech J. Genet. Plant Breed. 2014, 50, 171–176. [Google Scholar] [CrossRef]
- Sabbavarapu, M.M.; Sharma, M.; Chamarthi, S.K.; Swapna, N.; Rathore, A.; Thudi, M.; Gaur, P.M.; Pande, S.; Singh, S.; Kaur, L.; et al. Molecular mapping of QTLs for resistance to Fusarium wilt (race 1) and Ascochyta blight in chickpea (Cicer arietinum L.). Euphytica 2013, 193, 121–133. [Google Scholar] [CrossRef]
- Ratnaparkhe, M.B.; Santra, D.K.; Tullu, A.; Muehlbauer, F.J. Inheritance of inter-simple-sequence-repeat polymorphisms and linkage with a fusarium wilt resistance gene in chickpea. Theor. Appl. Genet. 1998, 96, 348–353. [Google Scholar] [CrossRef]
- Tullu, A.; Muehlbauer, F.J.; Simon, C.J.; Mayer, M.S.; Kumar, J.; Kaiser, W.J.; Kraft, J.M. Inheritance and linkage of a gene for resistance to race 4 of fusarium wilt and RAPD markers in chickpea. Euphytica 1998, 102, 227–232. [Google Scholar] [CrossRef]
- Lal, D.; Ravikumar, R.L.; Jingade, P.; Subramanya, S. Validation of molecular markers linked to Fusarium wilt resistance (Foc 1) in recombinant inbred lines of chickpea (Cicer arietinum). Plant Breed. 2022, 141, 429–438. [Google Scholar] [CrossRef]
- Tar’an, B.; Warkentin, T.D.; Tullu, A.; Vandenberg, A. Genetic mapping of ascochyta blight resistance in chickpea (Cicer arietinum L.) using a simple sequence repeat linkage map. Genome 2007, 50, 26–34. [Google Scholar] [CrossRef]
- Soregoan, C.D.; Ravi Kumar, R.L. Marker assisted characterization of wilt resistance in productive chickpea genotypes. Electron. J. Plant Breed. 2010, 1, 1159–1163. [Google Scholar]
- Sharma, K.D.; Muehlbauer, F.J. Fusarium wilt of chickpea: Physiological specialization, genetics of resistance and resistance gene tagging. Euphytica 2007, 157, 1–14. [Google Scholar] [CrossRef]


Disclaimer/Publisher’s Note: The statements, opinions and data contained in all publications are solely those of the individual author(s) and contributor(s) and not of MDPI and/or the editor(s). MDPI and/or the editor(s) disclaim responsibility for any injury to people or property resulting from any ideas, methods, instructions or products referred to in the content. |
© 2024 by the authors. Licensee MDPI, Basel, Switzerland. This article is an open access article distributed under the terms and conditions of the Creative Commons Attribution (CC BY) license (https://creativecommons.org/licenses/by/4.0/).