Article

Propagation Dynamics from Meteorological to Agricultural Drought in Northwestern China: Key Influencing Factors

1
College of Water Conservancy, North China University of Water Resources and Electric Power, Zhengzhou 450045, China
2
College of Water Resources and Architectural Engineering, Northwest A&F University, Yangling 712100, China
*
Author to whom correspondence should be addressed.
Agronomy 2024, 14(9), 1987; https://doi.org/10.3390/agronomy14091987 (registering DOI)
Submission received: 6 June 2024 / Revised: 29 August 2024 / Accepted: 30 August 2024 / Published: 2 September 2024
(This article belongs to the Section Farming Sustainability)

Abstract

:
Meteorological and agricultural droughts are inherently correlated, whereas the propagation mechanism between them remains unclear in Northwestern China. Investigating the linkages between these drought types and identifying the potential influencing factors is crucial for effective water resource management and drought mitigation. This study adopted the Standardized Precipitation Evapotranspiration Index (SPEI) and Standardized Soil Moisture Index (SSMI) to characterize the meteorological and agricultural droughts from 1960 to 2018. The propagation time between these droughts was detected using the Pearson correlation analysis, and the cross-wavelet transform and wavelet cross-correlation were utilized to describe their linkages across the time–frequency scales. The grey relational analysis was applied to explore the potential factors influencing the propagation time. The results revealed that the agricultural drought typically lagged behind the meteorological drought by an average of 6 months in Northwestern China, with distinct seasonal and regional characteristics. The shortest propagation time occurred in the summer (3 months), followed by the autumn (4 months), and the propagation time was longer in the winter (8 months) and spring (9 months). Additionally, the average propagation time was longer in the plateau climate zone (8 months) than in the southeastern climate zone (6 months) and the westerly climate zone (4 months). There was a multi-timescale response between the meteorological and agricultural droughts, with a relatively stable and significant positive correlation over long timescales, whereas the correlation was less clear over short timescales. The key factors influencing the propagation time were soil moisture, elevation, precipitation, and potential evapotranspiration. Furthermore, the wavelet cross-correlation between agricultural and meteorological droughts was relatively high, with a lag of 0 to 3 months; as the timescale increased, the fluctuation period of their cross-correlation also increased.

1. Introduction

Drought is a severe natural hazard resulting from the imbalance between the supply and demand of water resources [1] and is closely associated with climate change and human activities. It is characterized by a high frequency, a long duration, and a widespread impact [2,3]. Prolonged water deficits are the primary cause of drought, leading to significant disruptions in food security, water resource management, ecological health, and socioeconomic stability [4,5]. Hence, understanding the evolution and propagation of droughts is essential for effective disaster prevention and mitigation.
Drought is a multifaceted phenomenon that is conceptualized differently across academic disciplines. Based on inducing factors and effects, drought can be categorized into five types: meteorological, agricultural, hydrological, socioeconomic, and ecological droughts [6,7,8]. These types are interconnected by the complex dynamics of the water cycle. The meteorological drought, characterized by insufficient precipitation and high potential evapotranspiration over an extended period, can typically mark the initial phase of drought emergence [9]. The prolonged precipitation deficits can reduce soil moisture and trigger agricultural drought [10]. The hydrological drought is associated with water shortages in rivers, lakes, or reservoirs [11]. The socioeconomic drought arises when the water supply fails to meet the demands of socioeconomic development [12]. Different types of droughts often occur simultaneously or sequentially, with strong correlations existing between meteorological drought and other drought types [13,14].
Drought propagation refers to the process by which one type of drought is transformed into another [15]. Typically, meteorological drought acts as a trigger for other drought types, which then propagate through the hydrological cycle on varying timescales, leading to the development of additional drought types [16]. Over the past few decades, although the change characteristics of drought are different around the world, the research of drought propagation in China, especially in arid and semi-arid areas, has become a significant focus, playing a crucial role in water resource management and early drought warning systems [9,10].
The onset and end of meteorological droughts are typically rapid, whereas other drought types often exhibit a delayed response [17]. Previous studies have primarily explored the relationships between these drought types using methods such as correlation analysis [18], wavelet analysis [19], hydrological modeling [20], machine learning, and copula function [21]. The wavelet analysis and correlation coefficients are particularly common for evaluating the differences in the propagation time between various drought types. The propagation time is a crucial parameter for understanding the transition of drought from meteorological to other forms. For instance, Xu et al. [22] reported that the propagation time from meteorological to agricultural drought increased from 1 to 2 months in the summer to 2–7 months by the following spring. Han et al. [23] examined the propagation characteristics of meteorological and groundwater droughts in the Xijiang River Basin of China, revealing that the propagation time varied from 8 to 42 months. Wang et al. [24] suggested that the response time of agricultural droughts to meteorological droughts in the APENC region ranged from 1 to 4 months, with an average of 1.69 months. However, neither the wavelet coherence nor the classical correlation analysis can fully quantify the correlation between two drought types across different timescales. The wavelet coherence can only determine the phase shifts, and the classical correlation analysis measures the similarity in drought time series. Therefore, a wavelet cross-correlation analysis can be applied to quantify the relationship between two drought types at different periodic scales, aiding early warning systems for agricultural droughts.
Previous research has shown that differences in underlying surfaces, such as topography and land use, as well as climatic conditions, such as precipitation and air temperature, significantly influence the drought responses [25]. Cao et al. [26] identified the topography and vegetation cover as the primary determinants affecting the response time of meteorological and agricultural droughts. Even within specific regions, such as the Loess Plateau and Qilian Mountains, forest areas have a substantial impact on drought propagation [27]. However, the mechanisms by which these environmental factors influence drought propagation remain unclear. In particular, the variability in drought propagation with the changes in altitude within the same region is not well understood, hindering effective drought mitigation in areas with complex terrains.
Therefore, investigating the propagation process between different droughts and the possible influencing factors is significant for drought disaster warning and mitigation. The purpose of this study was to (1) analyze the dynamic characteristics of meteorological and agricultural droughts based on a three-dimensional clustering method; (2) investigate the propagation time from meteorological drought to agricultural drought and quantify their relation at multiple periodic scales; and (3) reveal the possible factors influencing drought propagation in the study area.

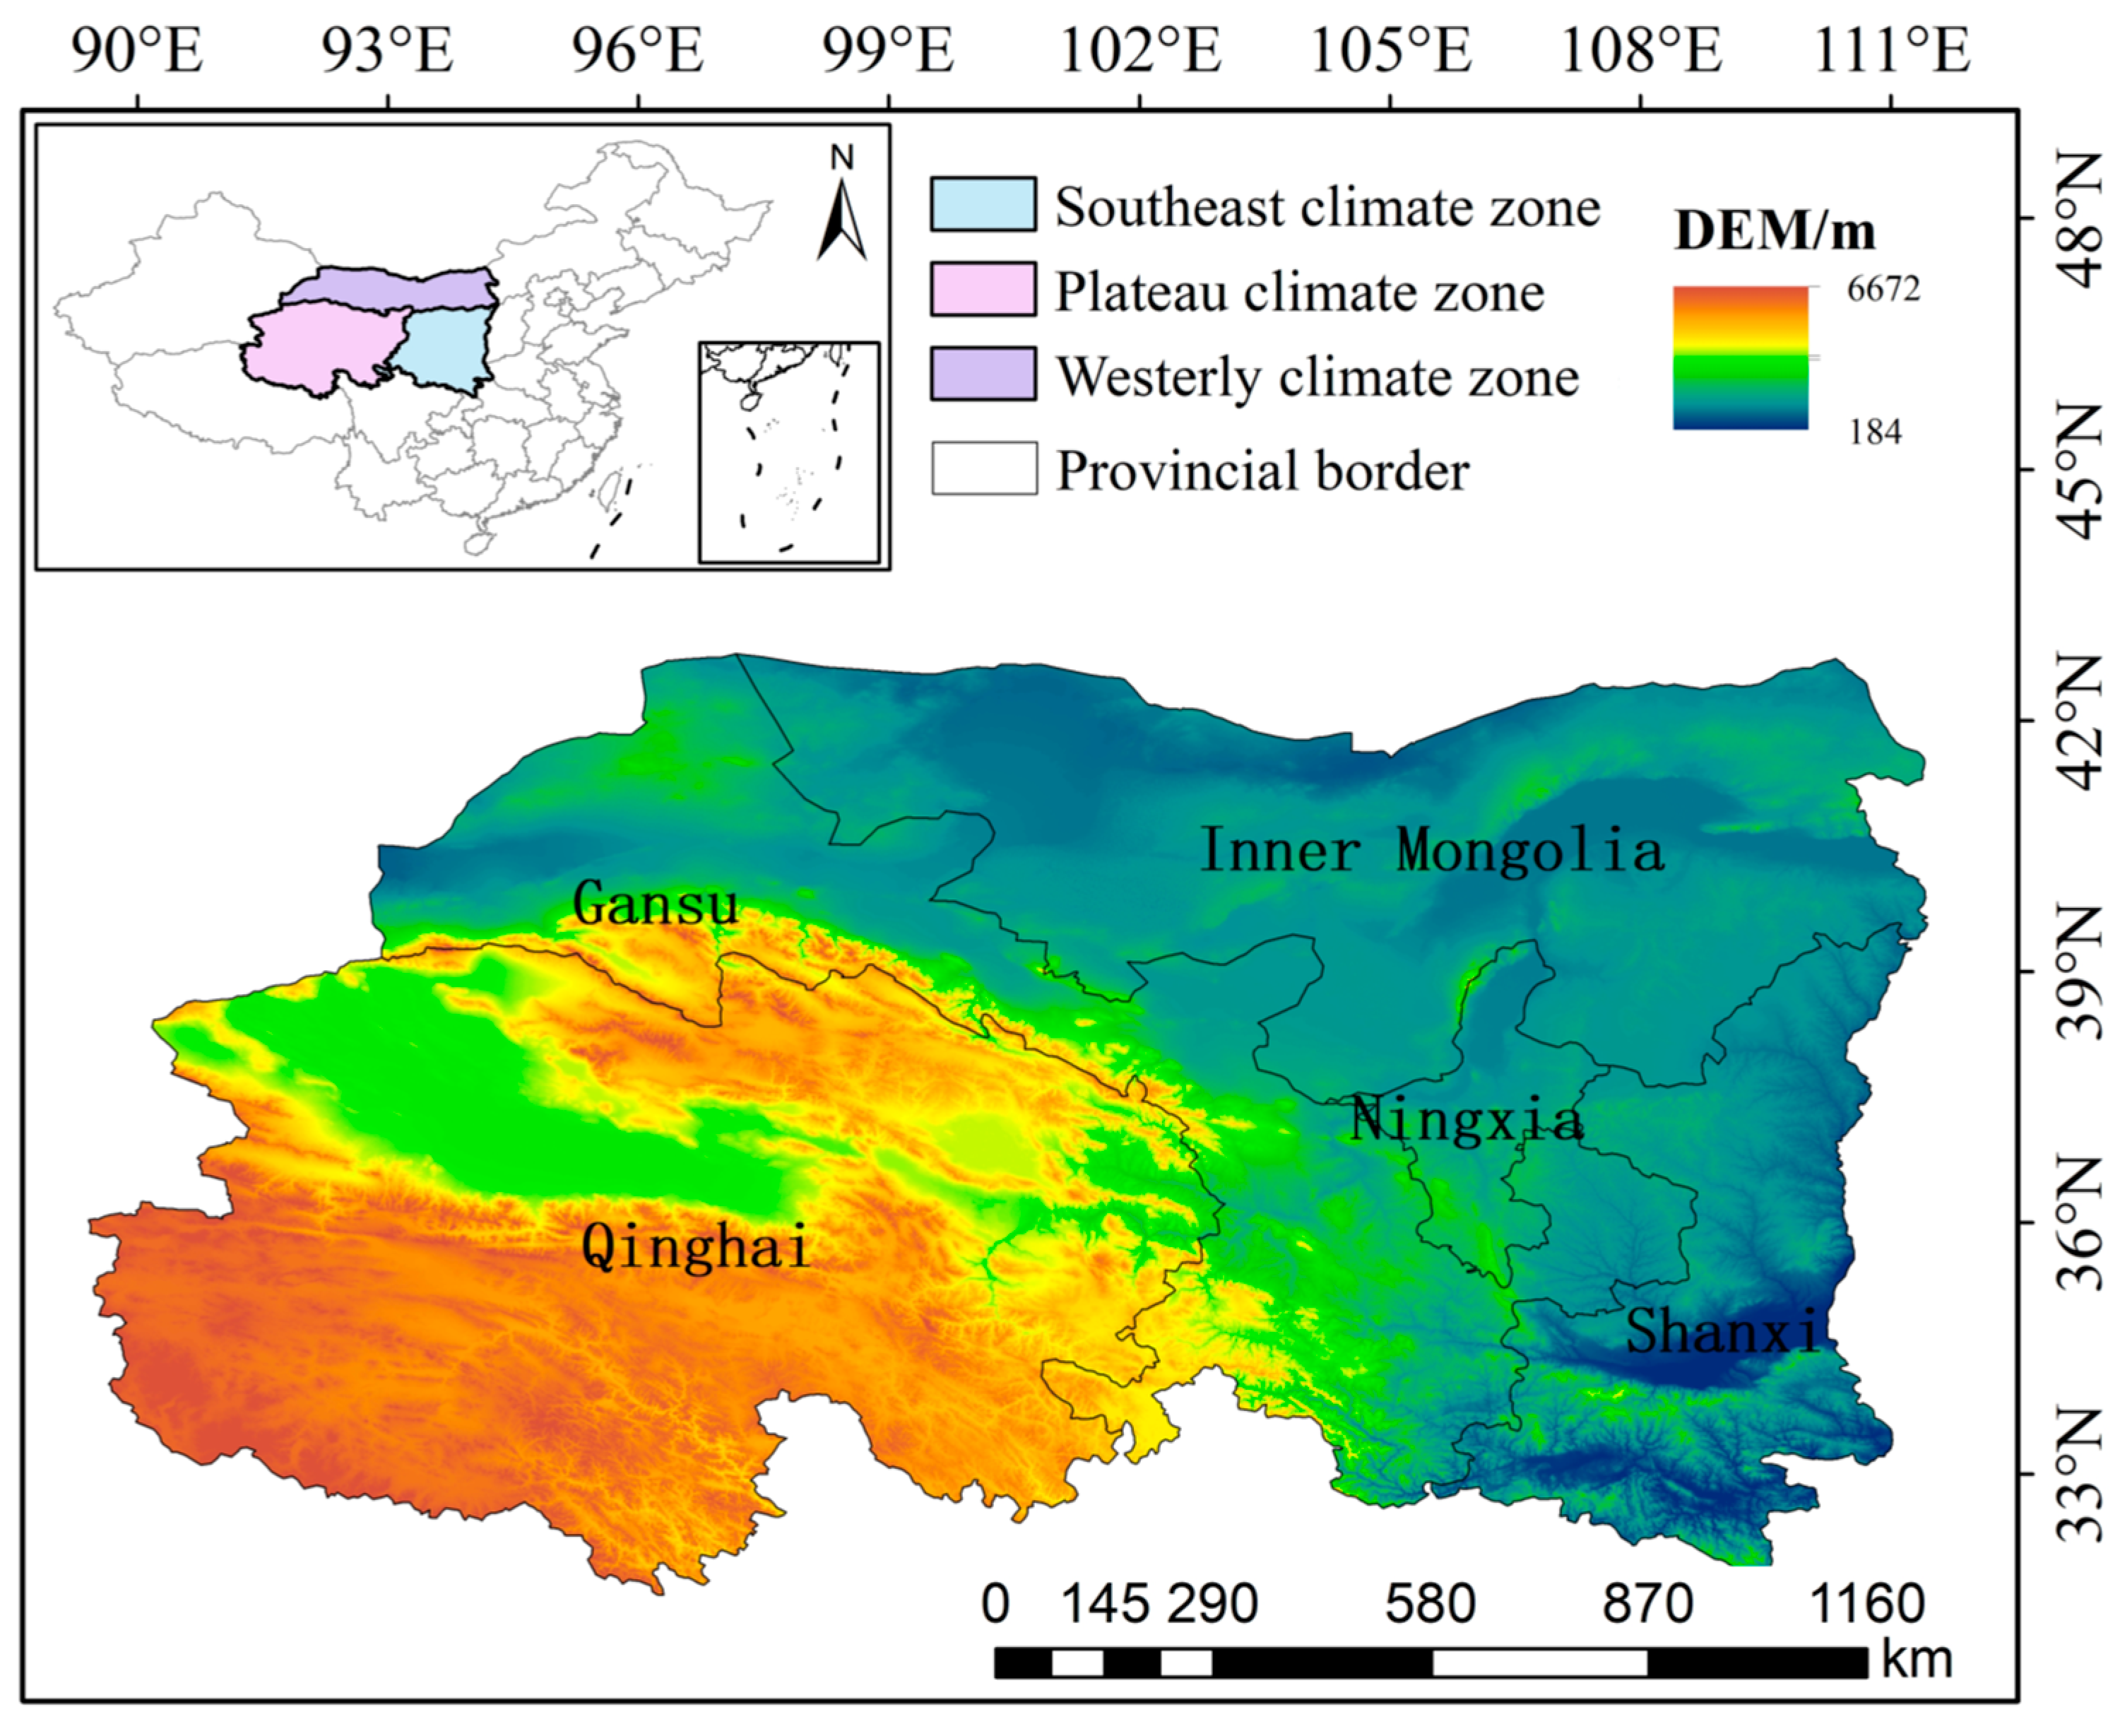
2. Study Area and Data

The study area is located in the northwestern region of China, including Shaanxi Province, Qinghai Province, Gansu Province, Ningxia Hui Autonomous Region, and the western part of Inner Mongolia Autonomous Region, which ranges from 89°25′ E to 111°27′ E and 31°33′ N to 42°48′ N. This region, with a total area of approximately 1.87 million km2, accounts for approximately 19.46% of the national land area. The altitude of the study area ranges from 184 m in the west to 6672 m in the east. The spatiotemporal distributions of precipitation are extremely irregular, and nearly 70% of the annual precipitation occurs from June to September [26], with annual precipitation gradually increasing from 50 mm in the northwest to 900 mm in the southeast. The average annual temperature is approximately 9 °C, and the annual potential evapotranspiration is between 800 mm and 1600 mm [28]. Due to the vast extent of the study area and the complexity of climate types, it spans three distinct climatic zones from west to east: the westerly climate zone (WCZ) includes the western part of the Hexi Corridor and the western part of the Inner Mongolia Autonomous Region, the plateau climate zone (PCZ) includes the Qilian Mountains of Qinghai Province and Gansu Province, and the southeastern climate zone (SCZ) includes the eastern part of Gansu Province, Ningxia Hui Autonomous Region, and Shaanxi Province [29]. The geographical location is shown in Figure 1.
The grid precipitation and potential evapotranspiration (PET) data with a spatial resolution of 0.5° × 0.5°and a temporal resolution of a monthly scale were obtained from the CRU dataset produced by the UK’s National Centre for Atmospheric Science (NCAS) (CRU TS v.4.03, https://crudata.uea.ac.uk/cru/data/hrg/) (accessed on 12 March 2023). The soil moisture data used in this study on a monthly timescale and with a spatial resolution of 0.25° × 0.25° are from the Global Land Data Assimilation System (GLDAS) version 2, which was developed by the National Aeronautics and Space Administration (NASA). To make the spatial resolution of the grid data consistent, they were spatially interpolated into a spatial resolution of 0.25° × 0.25° based on inverse distance weighting (IDW). The temporal scope of all datasets used in this study spans from 1960 to 2018. The applicability of the data used in the study area was demonstrated in our previous research [30], and the detailed descriptions are shown in Supplementary Materials Figures S1 and S2.

3. Methodology

3.1. Standardized Drought Index

In this study, the Standardized Precipitation Evapotranspiration Index (SPEI) and the Standardized Soil Moisture Index (SSMI) were utilized to indicate meteorological drought and agricultural drought, respectively. Both the SPEI and SSMI can delineate drought features at different timescales, and their calculation procedures are similar to the standardized precipitation index (SPI) [31]. For the detailed computation process, one can refer to the research of Feng et al. [30].
The main calculation process of the SPEI and SSMI includes (1) selecting the appropriate timescale according to research demands, (2) fitting water deficit and soil moisture data based on the optimal probability distribution function, and (3) converting water deficit and soil moisture accumulation into a normal distribution using the equal probability transformation method. The drought classes of the SPEI and SSMI are listed in Table 1.

3.2. Three-Dimensional Clustering Method

Recently, the three-dimensional clustering method with obvious advantages in capturing drought dynamics has become more utilized in drought research [32,33,34]. This approach can better track the spatiotemporal dynamic evolution characteristics of drought events [35]. Before identifying drought events, the spatial fields of the SPEI were smoothed using a 3 × 3 median filter to reduce distortion [36]. The primary procedure was conducted with the following two steps: (1) spatial identification of a single drought event and (2) temporal connection of drought clusters. Eventually, a set of continuous drought patches was identified, and more drought information (drought duration, severity, area, and migration distance) was extracted. The detailed steps can be found in Feng et al. [37]. The procedure mainly includes two components, namely the spatial identification of drought clusters and the temporal connection of drought clusters. After the application of the above two steps, four drought variables can be extracted, and their definitions are described in the following paragraph.
Drought duration denotes the time interval from the initiation to the termination of one drought event. Drought area refers to the total area affected by a drought event. Drought severity indicates the degree of water deficit during a drought episode. Migration distance represents the total distance traveled by the centroid of the drought cluster between two consecutive months during the entire drought period [35,37].

3.3. Cross-Wavelet Transform

The cross-wavelet transform combined with wavelet transformation and cross-spectrum analysis is a novel time–frequency technique capable of analyzing multiple signals and scales, revealing correlations between two time series across both time and frequency domains [38]. The wavelet energy spectrum can effectively evaluate the correlation degree between two sequences and reflect the phase structure and details of the sequences, whereas the wavelet coherence spectrum can illustrate the local correlation strength and reflect the degree of coherence of two wavelet transforms in the time–frequency domain [39]. The detailed calculation procedure is shown in Supplementary Materials Section S3.

3.4. Wavelet Cross-Correlation

Wavelet cross-correlation can quantitatively describe the correlation between two non-stationary time series at specific timescales and lags. It proves to be more applicable and superior in revealing the interrelationships between hydrological elements. Assuming the existence of two time series, x(t) and y(t), the real component within the results of continuous wavelet transform coefficients represents the distribution and phase information of signals with varying scales and time points. Its corresponding wavelet intercorrelation covariance can be defined as follows:
W C x y ( a , k ) = R ( W cov x y ( a , k ) ) 2
W cov x y ( a , k ) = E [ W x ( a , b ) W y ( a , b + k ) ]
where Wx(a,b) and Wy(a,b) represent the corresponding continuous wavelet transform coefficients of the two time series at scale a, and k is the lag time. R( ) indicates the real part of the variables in the parentheses, E( ) denotes the mean of the results in the square brackets, and WCxy(a,k) denotes the wavelet intercovariance of the two time series at scale a and lag time k.
The two time series are then analyzed for wavelet correlation, and the wavelet correlation coefficient can be defined as follows:
W R x y ( a , k ) = R ( W cov x y ( a , k ) ) R ( W cov x x ( a , 0 ) ) + R ( W cov y y ( a , 0 ) )
Based on the calculation results, contour plots of wavelet interrelationships can be drawn. These plots quantitatively depict the interrelationships between the two time series across various timescales and lag conditions, ranging from global to local. They can be employed for the time–frequency synthesis of the interrelationships between the time series [40].

3.5. Grey Relational Analysis

Grey relational analysis is a quantitative method used to analyze the geometry of time-series curves and measure the correlation between them by their magnitude, direction, and speed of proximity. Correlations can be considered high if the patterns of change in the comparison series are essentially similar and the degree of simultaneous change is high, and vice versa [41]. The specific calculation steps are outlined as follows:
(1) Initially, the original data are standardized and transformed into comparable sequences. This paper employs homogenization transformation, dividing each data sequence by its respective mean value.
(2) The correlation coefficient L between the reference sequence and the comparison sequence is calculated using the following formula:
L ( k ) = Δ min + ρ Δ max Δ k + ρ Δ max
where Δ(k) represents the absolute difference between the reference sequence and each comparison sequence at k moments; Δmax and Δmin denote the maximum and minimum values of the absolute difference between all comparison sequences and the reference sequence at each moment, respectively; and ρ is the resolution coefficient, typically set to 0.5.
(3) The grey relational degree, denoted as R, which measures the degree of correlation between the sequences of factors, is calculated. The formula is as follows:
R = 1 N k = 1 N L ( k )
where N represents the length of the comparison sequence.

4. Results

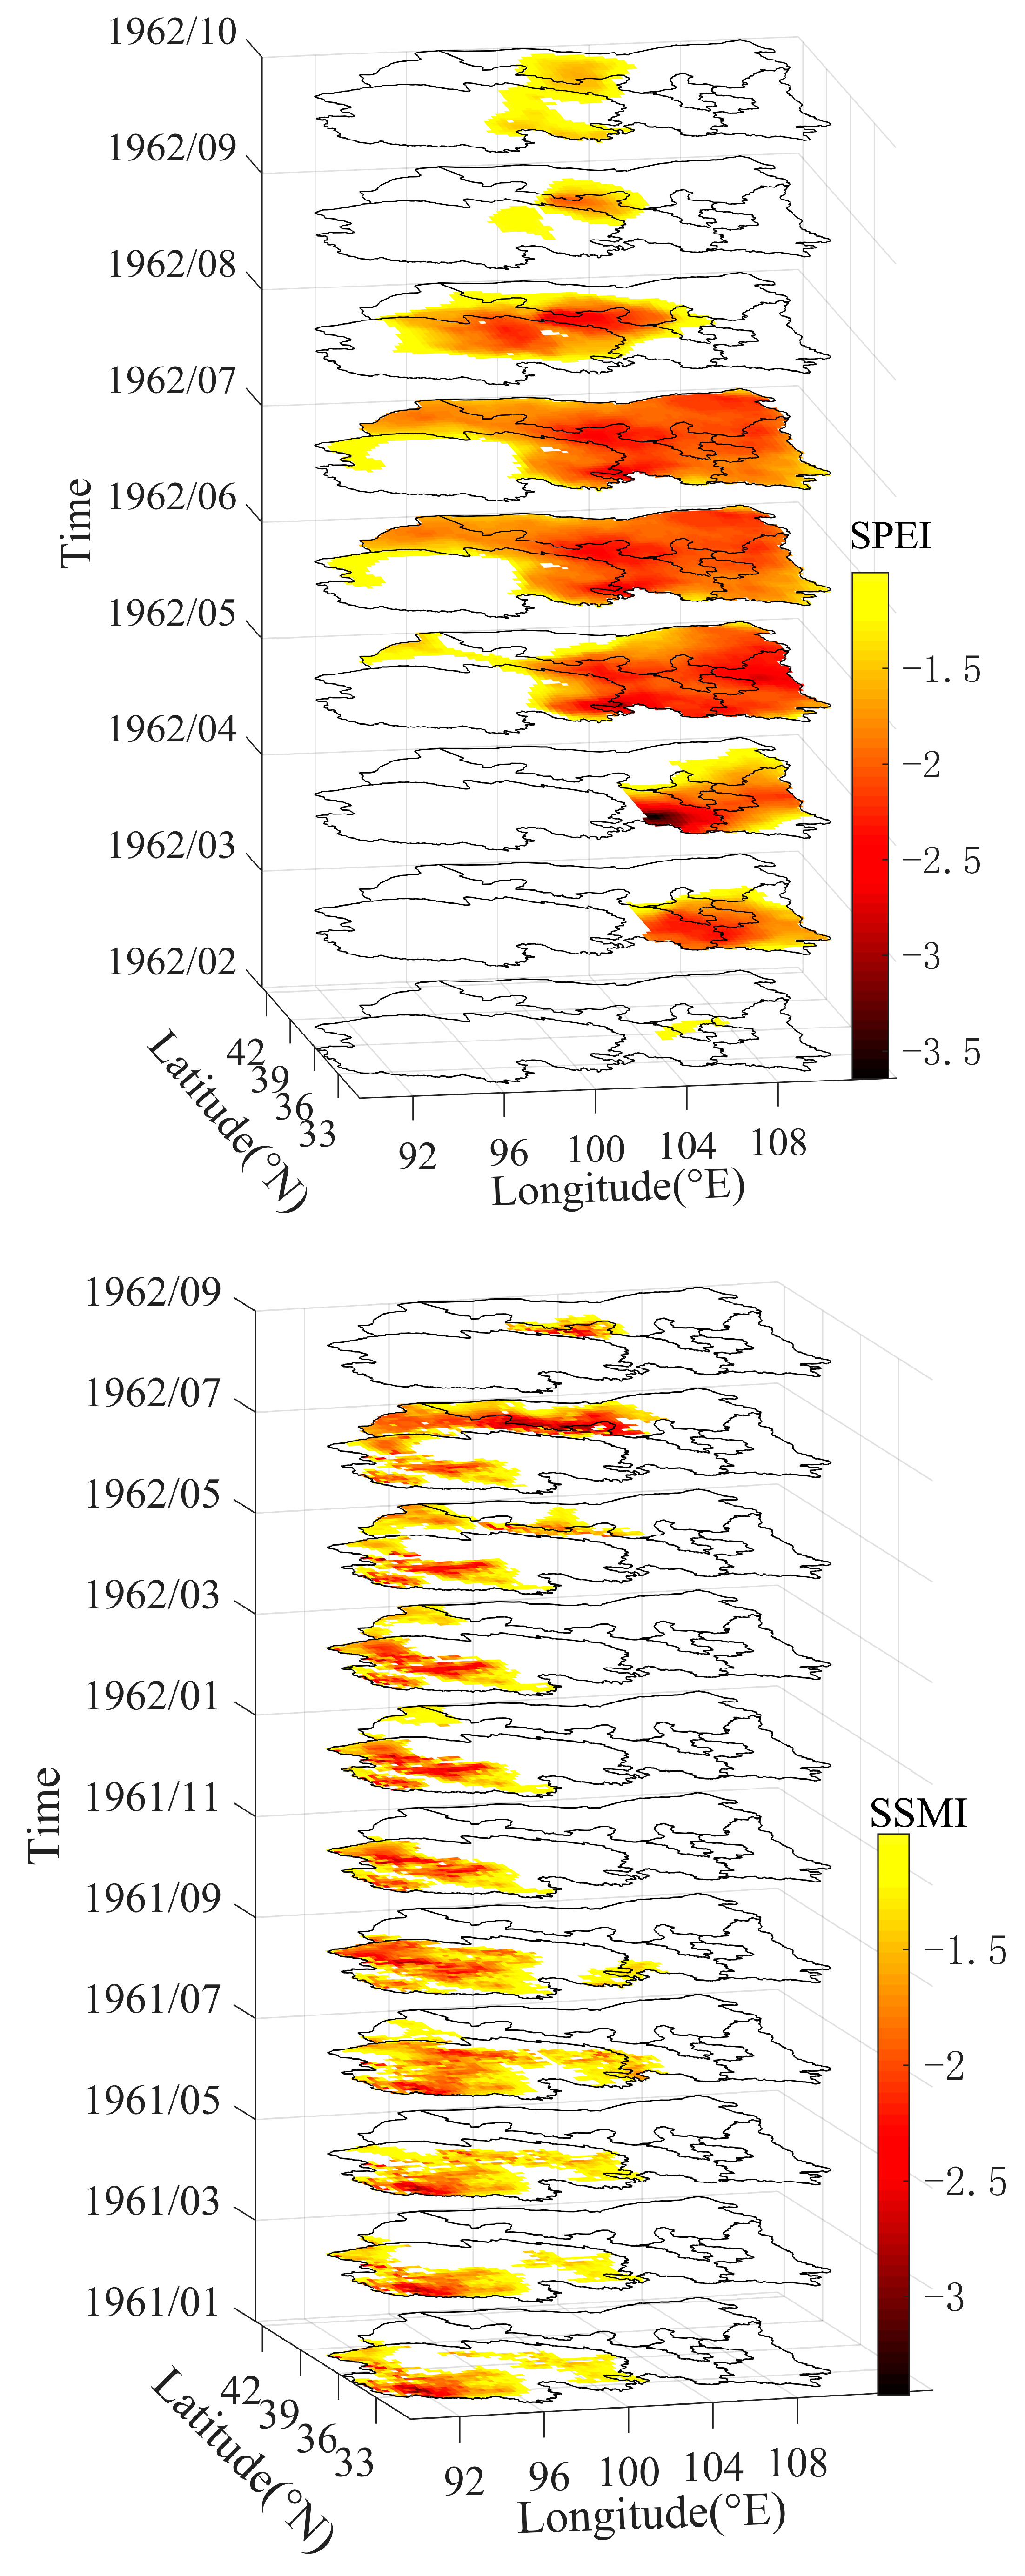
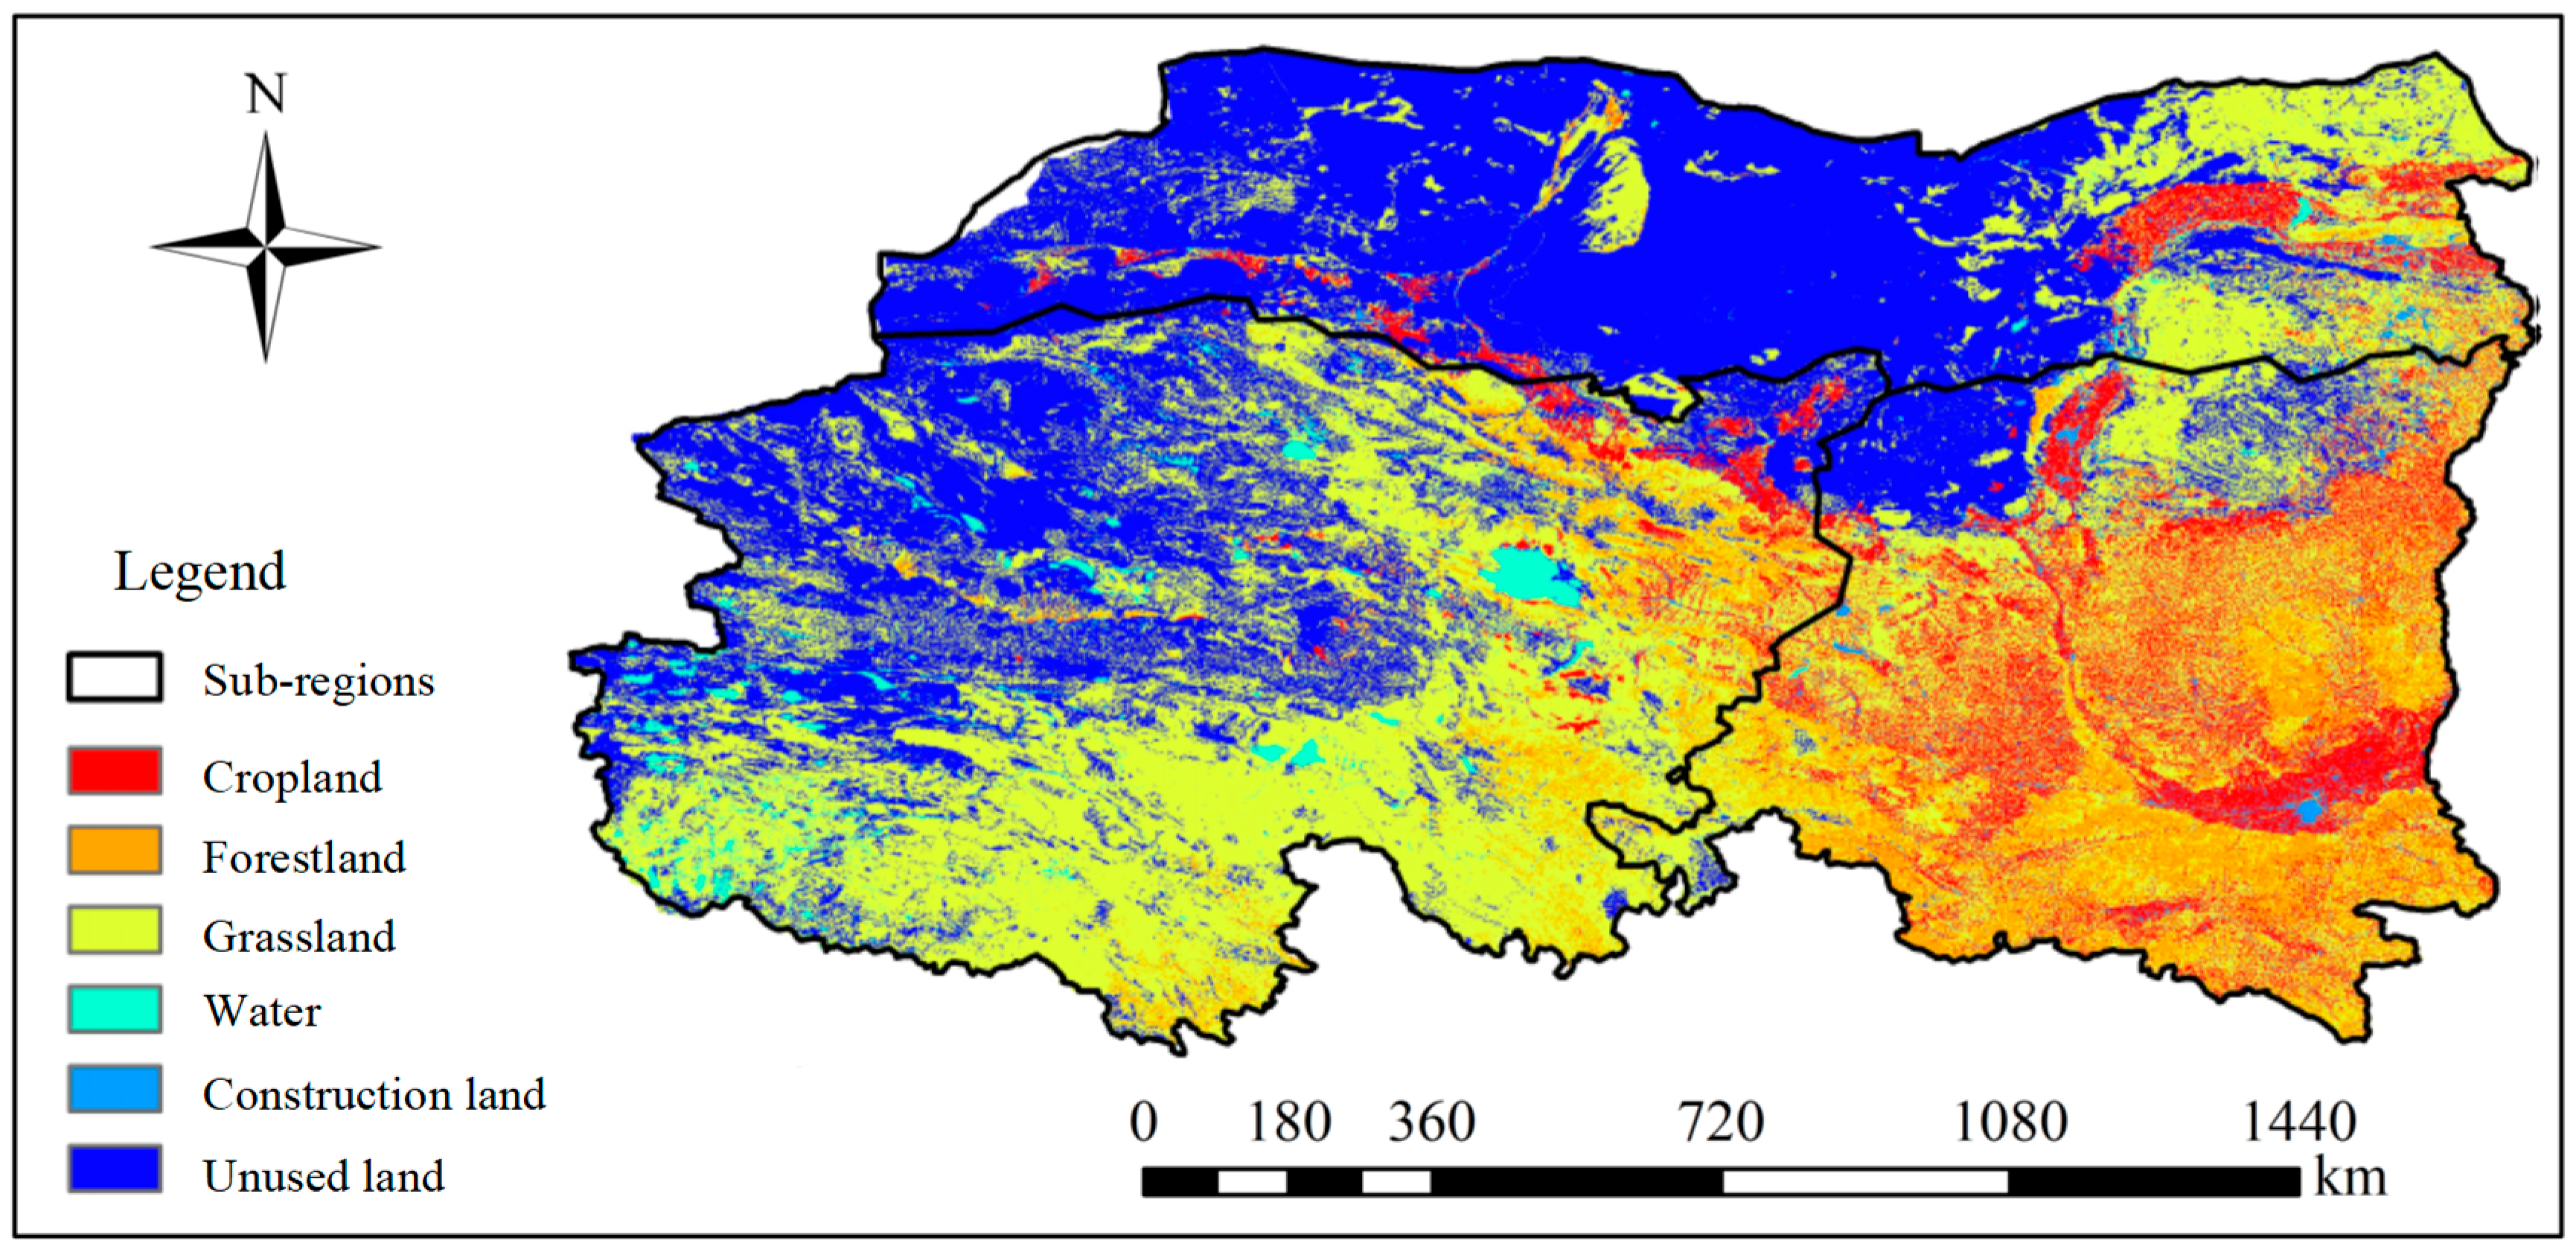
4.1. Spatiotemporal Patterns of Meteorological and Agricultural Droughts

This study employed a 3-month-timescale SPEI (SPEI3) and SSMI (SSMI3) to characterize long-term seasonal variations in meteorological and agricultural droughts, using a threshold value of -1 to define drought conditions. Table 2 presents the decadal statistics for meteorological and agricultural drought characteristics, including the number of drought events, duration, area, severity, and migration distance. In the 1960s, meteorological droughts were the least frequent but had the highest average duration, area, and severity. Notably, 52.0% of drought events in this decade lasted more than two months, marking it as the most severe drought period in Northwestern China. The subsequent decades ranked in severity as follows: 1990s, 1980s, 1970s, 2010s, and 2000s. Although the 2000s experienced the most drought occurrences (66 events), these events were characterized by the shortest durations, the smallest affected areas, the lowest severity, and a minimal migration, indicating a milder overall drought impact.
The agricultural droughts followed a pattern similar to that of the meteorological droughts, with the number of drought events steadily increasing from the 1960s to the 2010s, indicating a rising drought frequency in the study area. However, the 1960s emerged as the most severe decade in terms of average drought duration, area, severity, and migration distance, with the peak values for all four characteristics. Although the 2000s recorded the highest number of drought events (33), the drought conditions in the 2010s were the mildest, with the lowest averages in duration, area, severity, and migration distance.
In summary, both meteorological and agricultural droughts in the northwestern region exhibited a decreasing trend in duration and a reduced proportion of large-scale drought events from the 1960s to the 2010s.
Using the three-dimensional clustering method, 344 meteorological and 169 agricultural drought events were identified from 1960 to 2018. Figure 2 illustrates the dynamic evolution of two of the largest meteorological and agricultural drought events across time, latitude, and longitude. An example is the most severe meteorological drought that occurred from February to October 1962. Originating in the Ningxia Hui Autonomous Region, this drought event centered in the northern part of Guyuan City and initially affected an area of 3 × 10⁴ km2. The magnitude of the drought increased over time, reaching its peak in June 1962 with a severity of 2.49 × 10⁶ month·km2 and covering 1.34 × 10⁶ km2 or 77% of the study region. The magnitude of the drought gradually weakened, and it ended in October 1962. The most severe agricultural drought event began in Qinghai Province in January 1961, covering an area of 0.39 × 10⁶ km2 with a severity of 0.57 × 10⁶ month·km2. From February to September, the drought magnitude fluctuated, peaking in July with an average area of 0.46 × 10⁶ km2 and an average severity of 0.67 × 10⁶ month·km2. The drought centers were situated in central Qinghai Province. From October to December, the drought magnitude exhibited a mitigating trend. The drought event intensified from January to July 1962, reaching its peak severity in July. Starting in August 1962, the drought began to weaken and gradually dissipate.
According to Feng et al. [30], a severe drought affected Qinghai Province during the spring and summer of 1961, damaging approximately 161,000 hectares of crops and reducing grain yield by 34.6 × 10⁶ kg. Specifically, Jainca County in Huangnan Autonomic Prefecture experienced a particularly severe drought from March to July, affecting 72.9% of the sown area. The entire Hainan Tibetan Autonomous Prefecture suffered from drought, and 1340 hectares of crops in the Haixi Mongolian and Tibetan Autonomous Prefecture were affected. In 1962, Qinghai Province, Gansu Province, and the central and western regions of the Inner Mongolia Autonomous Region experienced a continuous drought during the spring and summer. These records aligned closely with the findings of the dynamic process of the most severe drought event analyzed in this study.
Overall, from a three-dimensional perspective, the dynamic migration process of drought events can be objectively and clearly depicted. This method of extracting drought structures can also visualize the dynamic spatiotemporal distribution patterns and movement of drought events in the future. It can predict the frequent occurrence and persistent locations of drought events as well as their predominant migration paths, thus providing a more accurate representation of the current state of drought events.

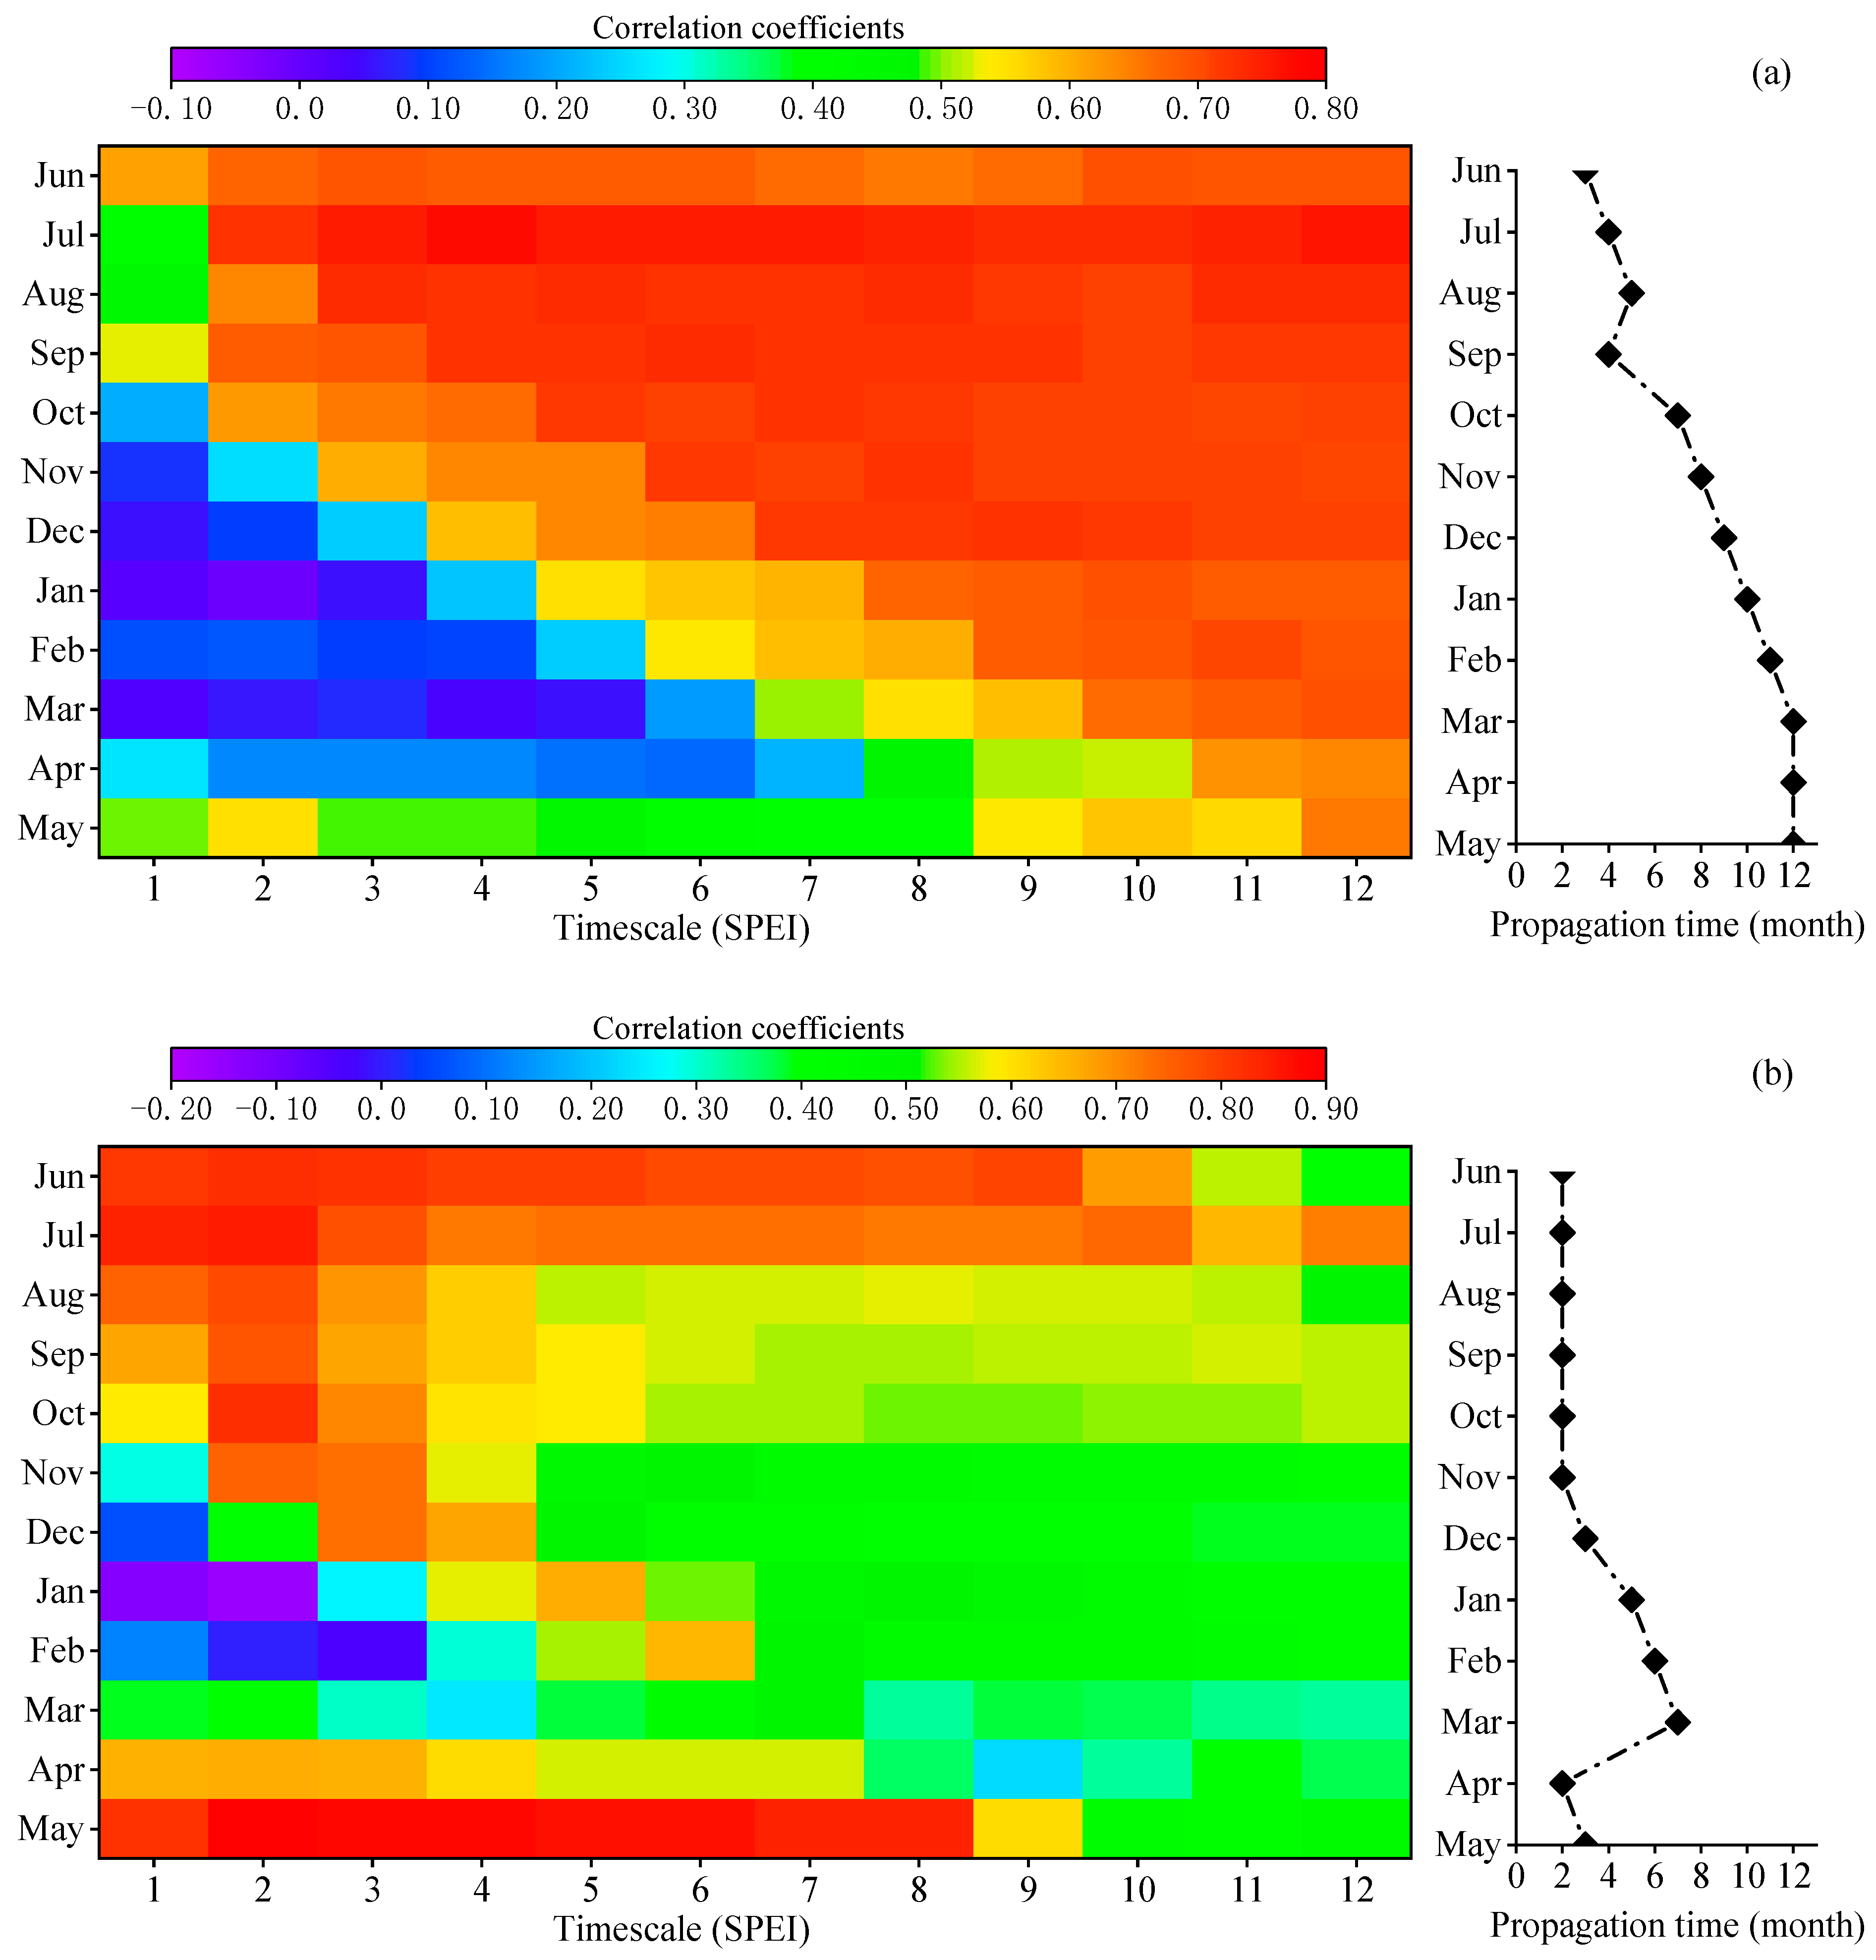
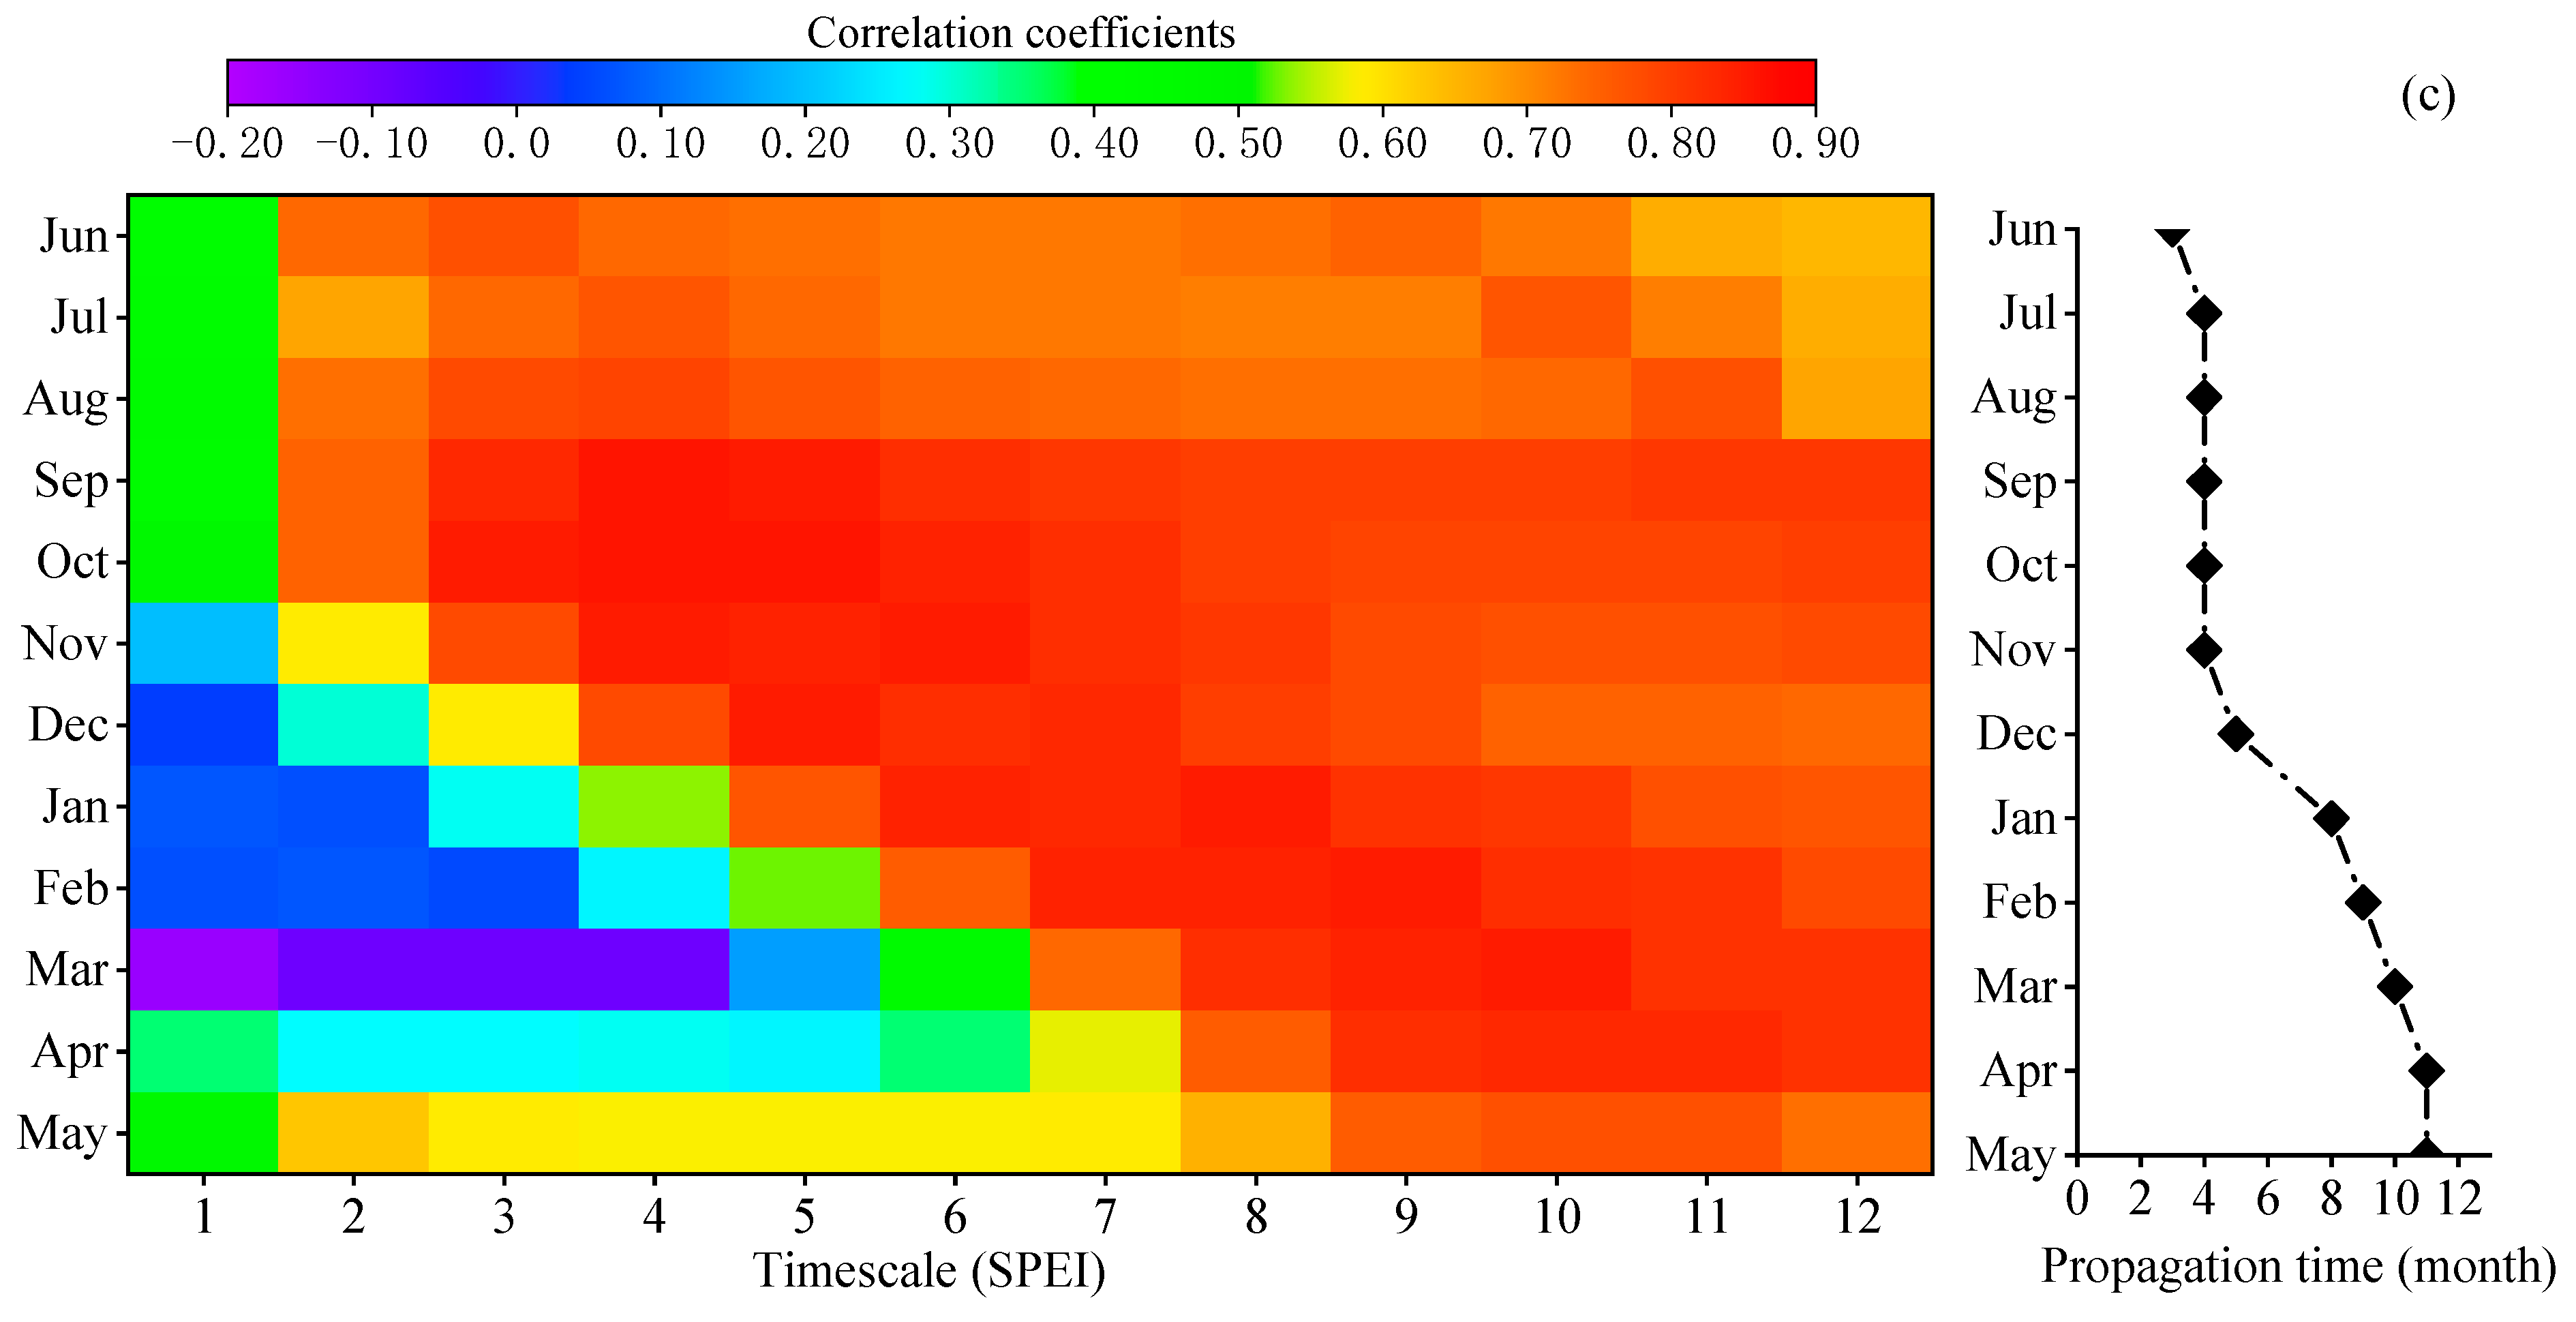
4.2. Propagation Time from Meteorological Drought to Agricultural Drought

The development of meteorological drought to a certain stage can affect soil moisture conditions, which can subsequently reduce crop yields. Compared with meteorological drought, the agricultural drought monitoring results exhibit a certain delay [42]. In this study, the accumulation period with the highest Pearson correlation coefficient between the SPEI-n (n = 1, 2, …, 12) and SSMI-1 was identified as an indicator of drought propagation time. Figure 3 displays the month-by-month correlations between the monthly SSMI and SPEI at various timescales (1 to 12 months) across different sub-regions of Northwestern China. The x-axis represents the varying timescales of SPEI-n (1–12 months), whereas the y-axis denotes different months within the annual cycle. The color bar indicates the correlation between the SSMI-1 and SPEI-n series. Figure 3 illustrates that the propagation time from meteorological drought to agricultural drought in different sub-regions exhibited distinct seasonal patterns, being relatively long during the wet season (June to November) and relatively short during the dry season (December to May of the following year). Figure 3a shows that in the plateau climate zone, the correlation between the SSMI and SPEI was relatively high (>0.7) during the summer (June to August) and autumn (September to November). The maximum correlation occurred in July at a 4-month timescale, reaching 0.77, and in November at an 8-month timescale, reaching 0.72. In general, the propagation time in the summer and autumn was approximately 4 months and 6.3 months, respectively, which was shorter than in other seasons. Conversely, in the winter (December to February) and spring (March to May), the maximum correlations between the monthly SSMI and SPEI were lower, mostly ranging from 0.6 to 0.7. The average propagation times in the winter and spring were 10 and 12 months, respectively, which were longer than those in the summer and autumn. Thus, the response of agricultural drought to meteorological drought was fastest in the summer, with the shortest propagation time.
Figure 3b indicates that in the westerly climate zone, the propagation time from meteorological to agricultural drought exhibited distinct seasonal variations. The maximum correlations from January to December were 0.82, 0.84, 0.78, 0.76, 0.83, 0.75, 0.73, 0.66, 0.65, 0.51, 0.66, and 0.87, with the corresponding propagation times of 2, 2, 2, 2, 2, 2, 3, 5, 6, 7, 2, and 3 months, respectively. The average propagation times in the summer and autumn were shorter by approximately two months, whereas in the winter and spring, they were longer, ranging from four to five months. Thus, the propagation time from meteorological to agricultural drought in the westerly climate zone was shorter than that in the plateau climate zone.
In the southeastern climate zone (Figure 3c), the correlations between the monthly SSMI and SPEI series at various timescales were higher than those in the plateau and westerly climate zones. The highest correlations, nearly 0.86, occurred from June to November on a 4-month timescale, while the correlations were approximately 0.85 from December to May of the following year on a 9-month timescale. Notably, the propagation time from the meteorological to agricultural drought ranged from 3 to 11 months. The shortest propagation time, from June to November, was 3–4 months, whereas from December to May of the following year, it extended to 5–11 months.
The propagation time from meteorological drought to agricultural drought in different sub-regions from 1960 to 2018 was quantified using the Pearson correlation between the monthly SSMI and SPEI series at various timescales (Figure 4). The correlations in all the three sub-regions were above 0.27. The southeast climate zone displayed relatively higher correlations between the SPI with accumulated periods of 1–12 months and SSMI-1 than the other regions. In the plateau and southeast climate zones, the correlation curve shows a continuous increase followed by stabilization, whereas in the westerly climate zone, it initially increased and then declined. The maximum correlations were 0.70 in the plateau climate zone, 0.61 in the plateau, westerly, and 0.78 in the southeast climate zone, with the corresponding propagation times of 12, 5, and 9 months, respectively. This indicated that the agricultural drought could be better predicted by the meteorological drought in the plateau and westerly climate zones. Consequently, SSMI-1, SPEI-12, SPEI-5, and SPEI-9 were selected for further analysis of the linkage between agricultural and meteorological drought in these regions.

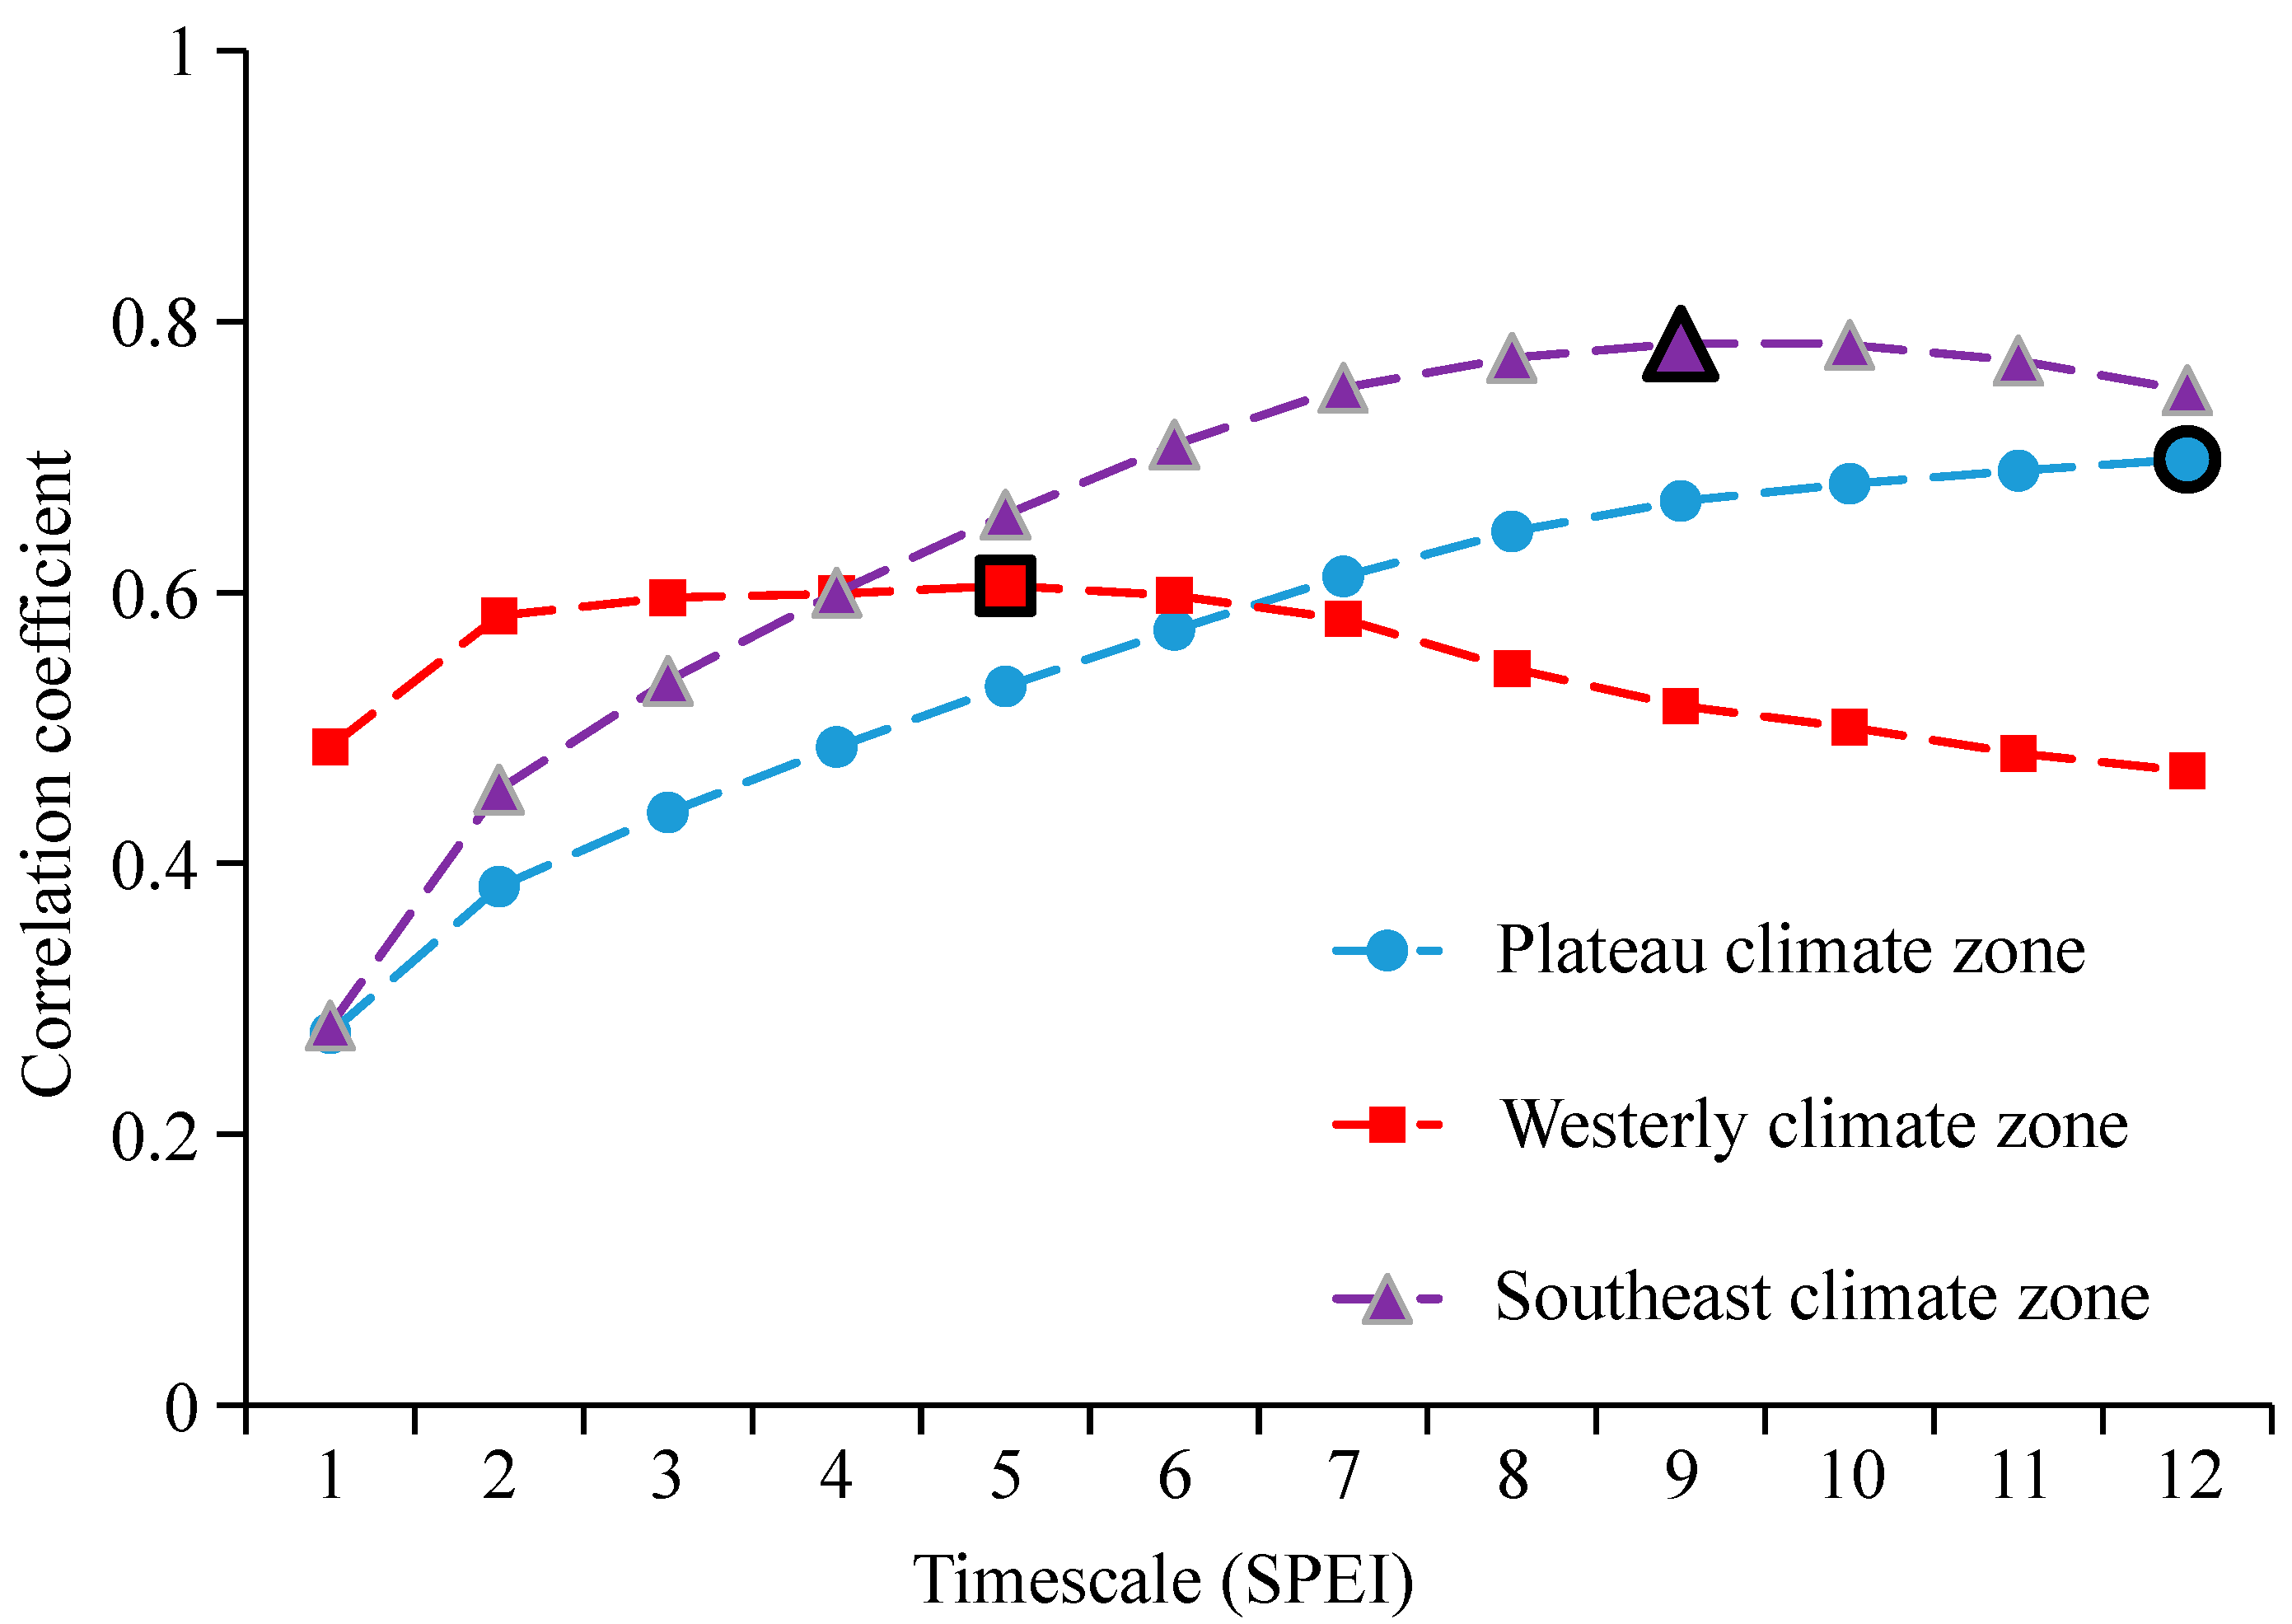
4.3. Multi-Timescale Linkages between Meteorological and Agricultural Droughts

Figure 5 illustrates the cross-wavelet spectrum and wavelet coherency of the optimal timescale SPEI and monthly SSMI in various sub-regions from 1960 to 2018. The thin solid line represents the wavelet influence cone curve, marking the effective spectral area, while the region outside this curve is excluded owing to boundary effects. The thick solid line delineates areas where the correlation is significant at the α = 0.05 level. The direction of the arrows indicates the relative phase difference; arrows pointing right signify a positive correlation, whereas arrows pointing left indicate a negative correlation.
The cross-wavelet spectrum primarily reflects the correlation between the two sequences in high-energy regions. Figure 5a shows three significant resonance periods with positive correlations between the meteorological and agricultural droughts in the plateau climate zone: 24–56 months from 1965 to 1975, 20–48 months from 1978 to 1998, and 16–32 months from 2005 to 2015. These periods indicated that meteorological drought strongly affected agricultural drought and exhibited multi-timescale characteristics. The wavelet coherency mainly represented the correlation in the low-energy regions. As shown in Figure 5b, there was a significant resonance period of 8 to 125 months between meteorological and agricultural droughts from 1960 to 2018, demonstrating a high correlation throughout this time frame. The phase difference revealed a positive correlation for periods of 8 to 125 months, with the correlations exceeding 0.8, indicating a stable and significant impact of meteorological drought on agricultural drought in low-energy areas.
Figure 5c presents the cross-wavelet spectrum of meteorological and agricultural droughts in the western climate zone. Three notable resonance periods were revealed: 16–40 months from 1965 to 1983, over 128 months from 1980 to 1995, and 8–24 months from 2000 to 2015. The phase difference indicated a significant positive correlation between meteorological and agricultural droughts during these periods. Figure 5d shows that the wavelet coherence revealed two significant resonance periods between meteorological and agricultural droughts: 8–40 months from 1960 to 2018 and over 64 months between 1970 and 2000. The phase difference indicated a strong positive correlation between meteorological and agricultural droughts, with values close to 1, in the low-energy areas across these periods. Additionally, the short-term intermittent oscillatory periods of 1–8 months with chaotic phase relationships between the two types of droughts were observed throughout the time domain.
Figure 5e illustrates the cross-wavelet spectrum of the meteorological and agricultural droughts in the southeastern climate zone, revealing two significant resonant periods with positive correlations: 12–32 months from 1965 to 2005 and 48–90 months overlapping from 1980 to 1990. Figure 5f shows that the wavelet coherence indicated a significant resonance period of 8–192 months between the meteorological and agricultural droughts from 1960 to 2018 in the low-energy areas, highlighting a notable resonance cycle that was not apparent in the high-energy zones. The phase angle generally exhibited a positive correlation throughout the time domain. Additionally, a short-term intermittent oscillatory period of 1–8 months with disorganized phase relationships between the meteorological and agricultural droughts was observed from 1960 to 2018.
In summary, the meteorological and agricultural droughts in sub-regions demonstrated relatively stable and significant positive correlations at long timescales, whereas the relationship at short timescales was more chaotic. This stability at longer timescales may be attributed to the large-scale circulation factors, such as the global climate signals including El Niño, Arctic Oscillation, and sunspots, which significantly influenced the relationship between the meteorological and agricultural droughts. Conversely, at shorter timescales, the relationship was affected more by local surface conditions and human activities [43].

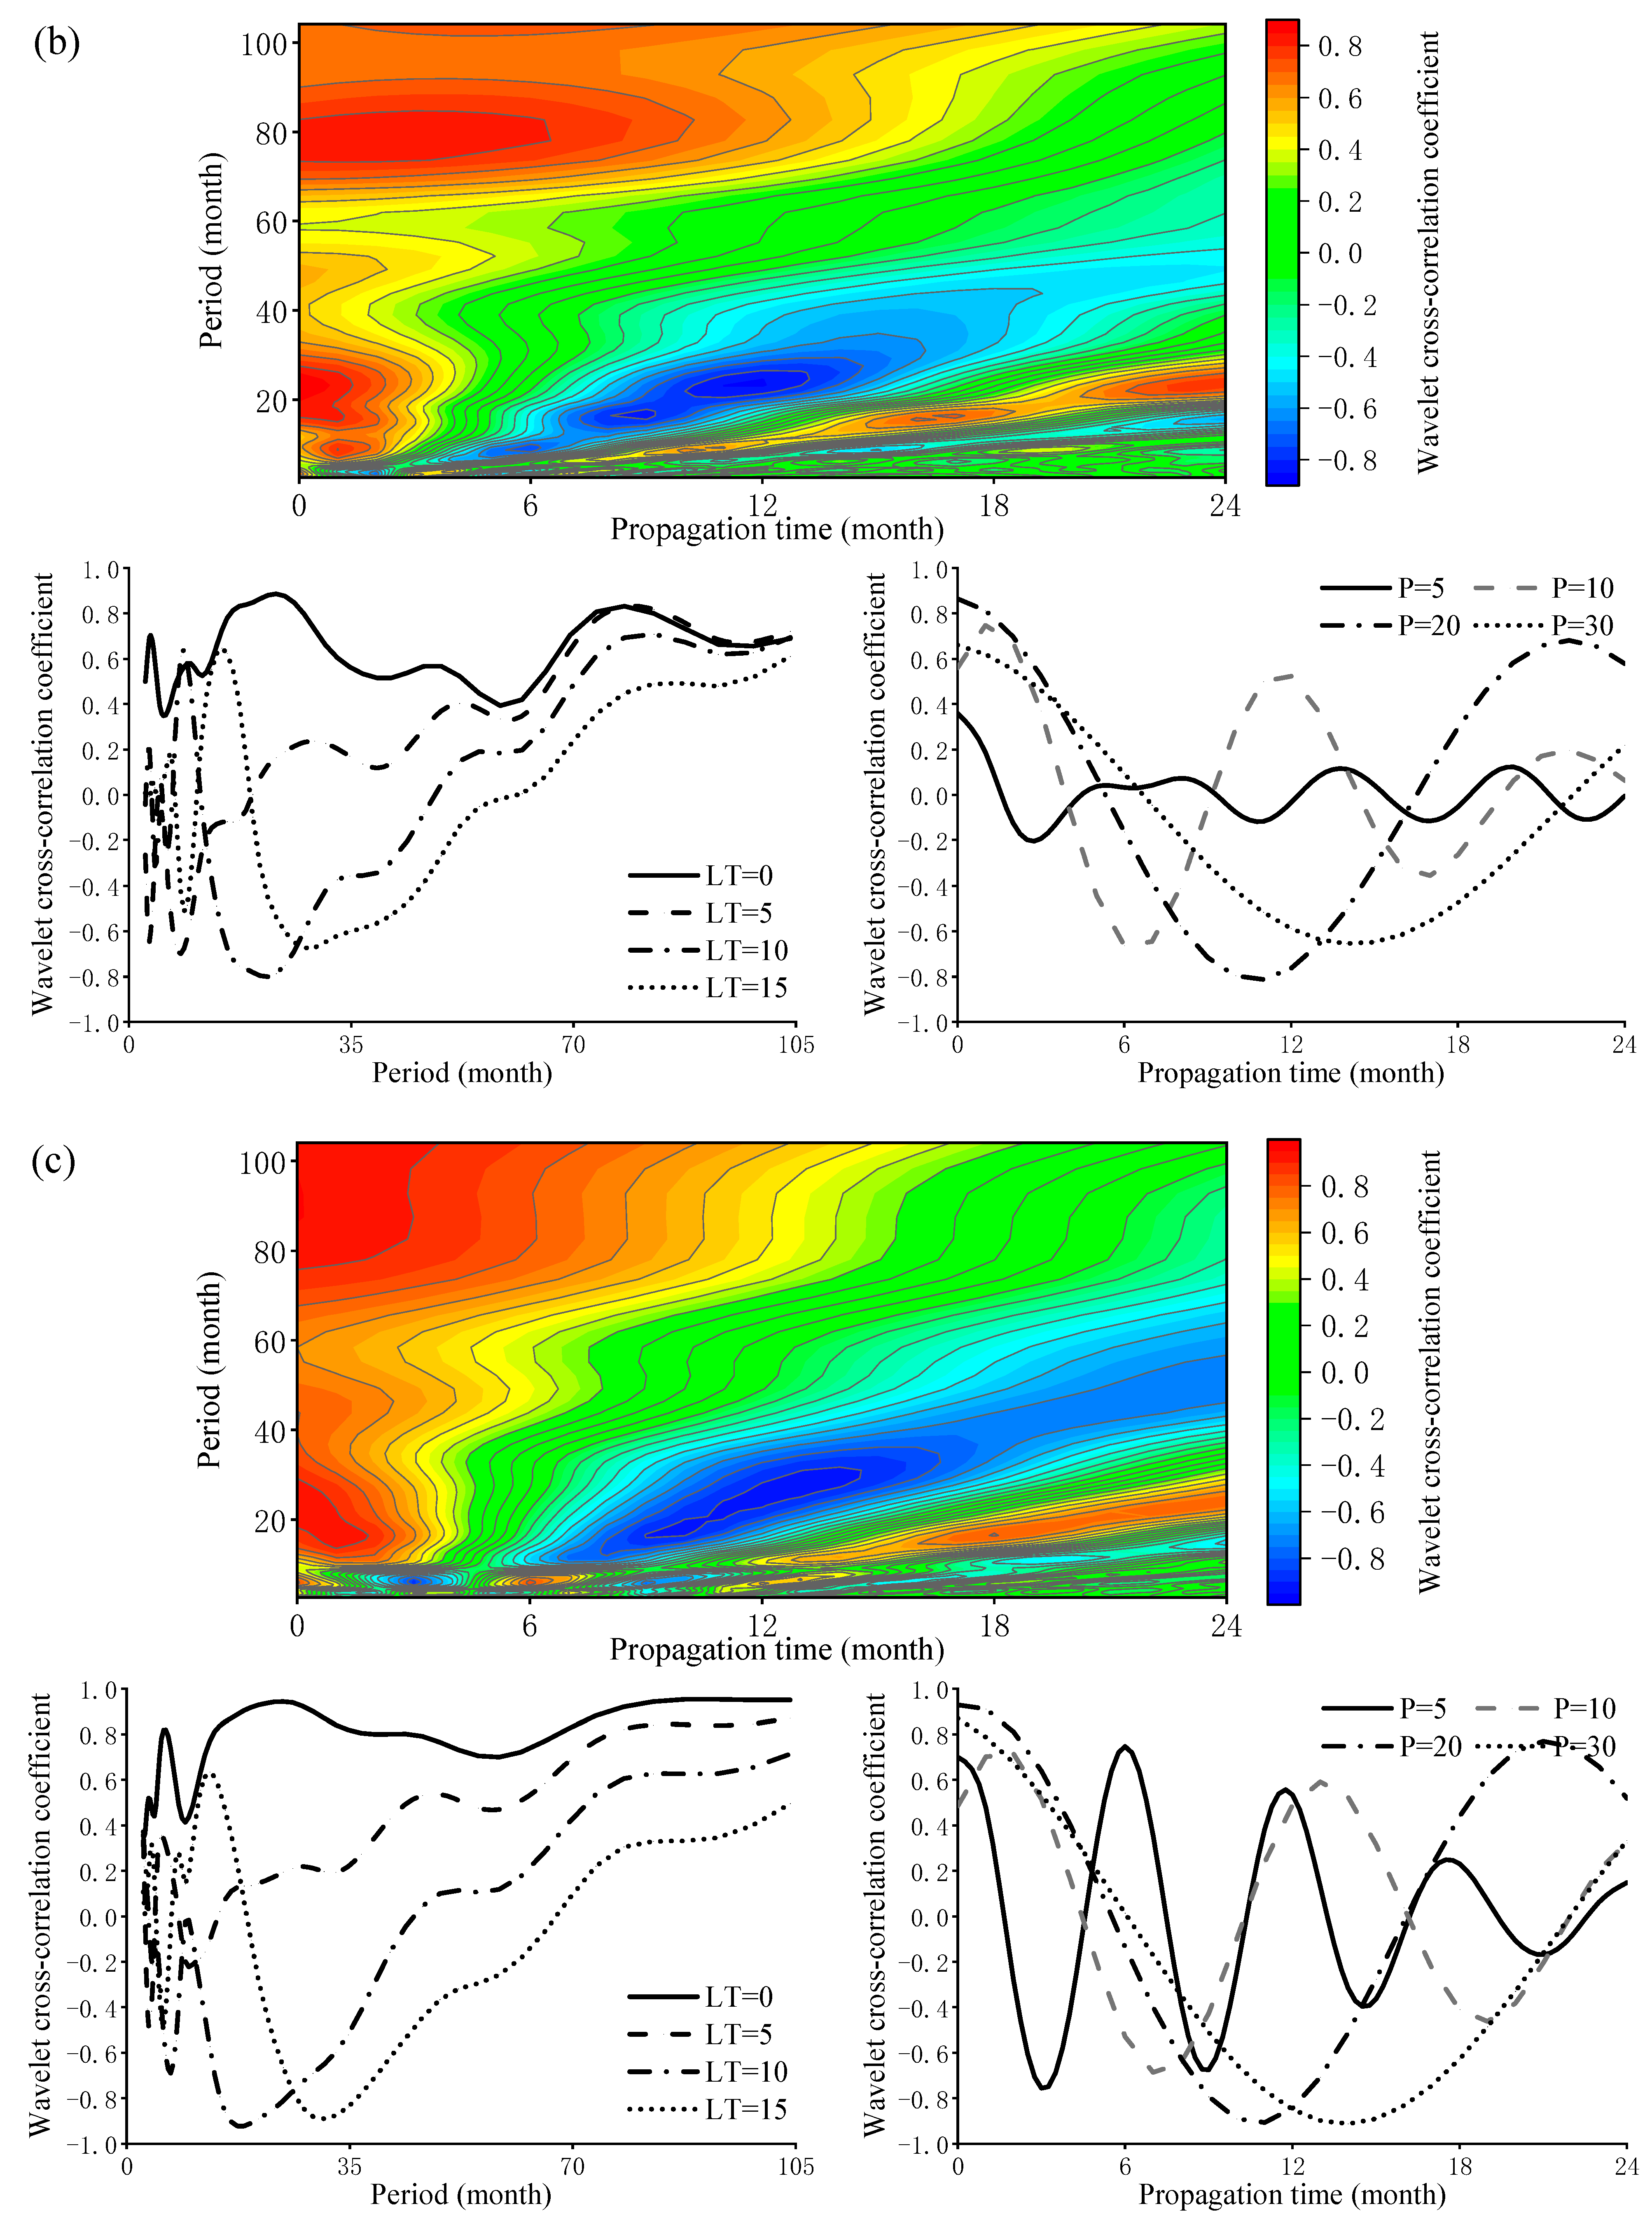
4.4. Wavelet Cross-Correlation between Meteorological and Agricultural Droughts

The wavelet cross-correlation analysis method quantified the cross-correlation between meteorological and agricultural droughts across multiple timescales and specific propagation times. In addition, the longitudinal contour plot of wavelet cross-correlation revealed the variation in the degree of cross-correlation between meteorological and agricultural droughts at different timescales for a fixed propagation time. Conversely, the lateral contour plot analyzed the variation in the cross-correlation at different propagation times for a fixed timescale.
Figure 6 illustrates the wavelet cross-correlation between the SSMI and SPEI at the optimal timescale for different sub-regions. In the plateau climate zone, higher wavelet cross-correlations (>0.8) between the SSMI and SPEI12 were concentrated at timescales of 20 to 60 months, with the peak cross-correlation of 0.88 at 46 months. In the westerly climate zone, elevated wavelet cross-correlations (>0.8) between the SSMI and SPEI5 occurred at timescales of 16 to 26 months and 73 to 82 months, with the maximum cross-correlation of 0.89 at 23 months. In the southeastern climate zone, high wavelet cross-correlations (>0.8) between the SSMI and SPEI9 were observed at timescales of 13 to 43 months and 69 to 104 months, with the peak cross-correlation of 0.95 at 87 months. The largest cross-correlation between the SSMI and SPEI series across different timescales in these sub-regions was observed at propagation times of 0 to 3 months, with the most pronounced correlation at zero propagation time. This finding supported the reliability of the conclusions from Section 4.2 and Section 4.3. Both the positive and negative correlations with absolute values above 0.8 demonstrated that the wavelet cross-correlation was more applicable and effective than the Pearson correlation analysis, particularly in the time–frequency domain [40].
The longitudinal interception results of the contour plot of the wavelet cross-correlations revealed significant variations in the positive and negative characteristics of the correlation between the SSMI and SPEI across different timescales at the same propagation time. In the plateau climate zone, for a propagation time of 5 months, the timescales of 10, 30, 50, and 70 months corresponded to wavelet cross-correlations of −0.60, 0.69, 0.72, and 0.67, respectively. In the westerly climate zone, with a propagation time of 10 months, the timescales of 10, 30, 50, and 70 months corresponded to wavelet cross-correlations of 0.29, −0.42, 0.04, and 0.47, respectively. Additionally, as the propagation time increased from 0 to 15 months, the cross-correlation exhibited a weakening trend at timescales greater than 27 months.
The lateral interception results of the contour plot of wavelet cross-correlations indicated that at the same timescale, the cross-correlation between the SSMI and SPEI exhibited periodic fluctuations with the changes in propagation time, and the degree of cross-correlation gradually weakened. For instance, in the westerly climate zone, at a timescale of 10 months, the wavelet cross-correlations were 0.56, −0.44, 0.29, and −0.15 for propagation times of 0, 5, 10, and 15 months, respectively. In the southeastern climate zone, at a timescale of 20 months, the wavelet cross-correlations were 0.93, 0.14, −0.89, and −0.28 for propagation times of 0, 5, 10, and 15 months, respectively. Furthermore, as the timescale increased, the cross-correlation between the SSMI and SPEI demonstrated a gradual increase with the changes in the fluctuation period of the propagation time.

5. Discussion

5.1. Lag Effects on Drought Propagation

Understanding the relationship between meteorological and agricultural droughts is crucial for forecasting agricultural drought occurrences. Typically, drought propagation exhibits a lag between meteorological and agricultural droughts [44]. This study analyzed the lag time characteristics of the drought propagation from meteorological to agricultural drought in Northwestern China. The results indicated that the propagation time was shortest in the summer, followed by the autumn, and longer in the winter and spring, highlighting a more sensitive response of agricultural drought to meteorological drought in the summer and autumn. The transfer of drought conditions from the SPEI to the SSMI varied significantly across seasons and regions [45]. During the summer, the highest annual temperatures combined with the maximum soil evapotranspiration and crop transpiration resulted in high, concentrated precipitation. In the arid and semi-arid regions where runoff is primarily generated through excess infiltration, the summer precipitation often forms the runoff directly, insufficiently supplementing the soil moisture [43]. This accelerates the water circulation process, leading to the rapid dissipation of soil moisture when meteorological drought occurs. Without timely replenishment, this contributes to the agricultural drought. Therefore, the agricultural drought responses are more immediate during the summer [46], and it is essential for managers to remain vigilant about meteorological droughts during this season to allow sufficient time to address the resulting agricultural drought.
The lag time increased from the summer to the winter. In the autumn, as temperatures and evapotranspiration decreased and the precipitation remained relatively abundant, the additional moisture in the soil extended the drought propagation time, thereby delaying the onset of soil-moisture-related drought conditions, which was consistent with previous studies [47]. Consequently, the drought propagation time in the autumn was longer than that in the summer. However, in the winter and spring, the precipitation decreased, and the soil and crop transpiration and evaporation were minimal, resulting in a slower water circulation process. Concurrently, the snowfall in the winter and subsequent melting in the spring, along with crop irrigation in the spring, partially replenished the soil moisture. When meteorological drought occurs under these conditions, the ability of soil to resist agricultural drought could be stronger, leading to an extended drought propagation time [48]. Similar phenomena have been observed in other studies, which can attribute this to high summer evapotranspiration and snow and glacier accumulation and melting in winter processes that contribute to delayed drought propagation [49,50,51].
The propagation time varied across sub-regions, with the average correlation between the SSMI and SPEI being higher in the plateau and southeastern climate zones than in the westerly climate zone. The average propagation time from meteorological to agricultural drought was the longest in the plateau climate zone, followed by the southeastern climate zone, and the shortest in the westerly climate zone. This variation was closely related to the topography, geomorphological characteristics, and land cover types of each sub-region [52]. The higher elevations typically experience lower temperatures and reduced evaporation, extending the propagation time. In the plateau climate zone, higher altitudes and persistent snow cover [53] contribute to the groundwater recharge through snowmelt, which enhances the regional water resources and helps to mitigate the propagation of agricultural drought.
Vegetation is crucial in transmitting the drought signals because it facilitates moisture and energy exchange between the soil and atmosphere, significantly affecting regional water cycles and drought development [54]. Figure 7 illustrates that the dominant land use in the plateau climate zone was grassland, and the southeastern climate zone was primarily used for cropland and forest land. In contrast, the westerly climate zone was predominantly desert with limited grassland in the east and severe sandstorm conditions. Consequently, the evapotranspiration in the westerly climate zone was substantially higher than that in the plateau and southeastern climate zones. Previous studies have indicated that the vegetation cover can influence drought propagation, with denser vegetation enhancing the water retention and the regional resistance to mild droughts [55,56]. Sterling et al. [57] discovered that forest land had higher evapotranspiration than cropland and grassland, and Zhang et al. [58] suggested that forests had a shorter drought propagation time than meadows because of their greater water consumption. These findings align with our results, demonstrating that the propagation time in the plateau climate zone could be longer than that in the westerly and southeastern climate zones. Sun et al. [25] reported that the soil moisture from snow and permafrost melt could delay the drought response in plateau grasslands, supporting the results of this study.

5.2. Influencing Factors on Drought Propagation

The correlation coefficient method and grey relational analysis were employed to assess the impact of various factors on the propagation of drought from meteorological to agricultural drought across different sub-regions. Based on prior studies [15,41], the precipitation, potential evapotranspiration, soil moisture, and elevation were identified as the key climatic variables influencing drought propagation. Table 3 shows that in the plateau climate zone, precipitation, potential evapotranspiration, soil moisture, and elevation in the spring, summer, and autumn significantly affected the propagation time. Specifically, the soil moisture and elevation were positively correlated with the propagation time, whereas the potential evapotranspiration exhibited a significant negative correlation. The strongest correlation was between the propagation time and the elevation in the winter, with correlation coefficients of 0.64 and 0.63, respectively, for the soil moisture. The ranking of influencing factors by the degree of correlation was as follows: in the spring, soil moisture > potential evapotranspiration > precipitation > elevation; in the summer, soil moisture > precipitation > elevation > potential evapotranspiration; in the autumn, soil moisture > precipitation > elevation > potential evapotranspiration; and in the winter, soil moisture > precipitation > elevation > potential evapotranspiration.
In the southeastern climate zone, the propagation time exhibited a significant positive correlation with the soil moisture and the elevation in spring, with correlations of 0.20 and 0.09, respectively. The factors were ranked as follows: soil moisture > precipitation > potential evapotranspiration > elevation. In the summer, all the influencing factors significantly affected the propagation time, with elevation having the greatest impact, followed by soil moisture. The ranking was soil moisture > elevation > precipitation > potential evapotranspiration. In the autumn, the propagation time exhibited a strong positive correlation with soil moisture and elevation and a significant negative correlation with potential evapotranspiration. The influencing factors were ranked as follows: elevation > soil moisture > precipitation > potential evapotranspiration. In the winter, the soil moisture had the greatest effect on the propagation time, followed by potential evapotranspiration, with correlations of 0.52 and 0.32, respectively. The order of influencing factors was soil moisture > precipitation > potential evapotranspiration > elevation.
In the westerly climate zone, the propagation time presented the strongest positive correlation with the soil moisture across all seasons, with correlations of 0.89 and 0.92 in the spring and summer, 0.84 in the autumn, and 0.75 in the winter. This was followed by precipitation, with correlations of 0.68 in the spring, 0.72 in the summer, 0.67 in the autumn, and 0.39 in the winter. The order of influencing factors was as follows: in the spring, soil moisture > elevation > precipitation > potential evapotranspiration; in the summer, soil moisture > potential evapotranspiration > precipitation > elevation; in the autumn, soil moisture > potential evapotranspiration > elevation > precipitation; and in the winter, precipitation > soil moisture > elevation > potential evapotranspiration.
In summary, the propagation time from meteorological drought to agricultural drought in northwest China could be primarily influenced by soil moisture serving as the most significant factor, followed by elevation and precipitation. The impact of the potential evapotranspiration was relatively minor, aligning with previous findings. Lin et al. [21] highlighted that soil water constituting a large portion of annual precipitation played a crucial role in drought propagation, suggesting that monitoring soil moisture levels can serve as an early warning system. Furthermore, topographic conditions such as elevation are critical for drought propagation [16], indicating that higher-elevation areas should be prioritized for water conservation strategies. Zhao et al. [59] also suggested that the adverse effects of reduced precipitation on drought propagation outweighed the benefits of decreased evapotranspiration.

6. Conclusions

Investigating the propagation from meteorological to agricultural drought and its influencing factors is essential. This understanding can clarify the drought process and patterns and aid in developing an agricultural drought warning system based on meteorological information. Therefore, the SPEI and SSMI derived from the reanalysis of meteorological and remote sensing data were adopted to characterize the meteorological and agricultural droughts. Moreover, the spatiotemporal dynamics of the drought events from 1960 to 2018 were analyzed using a three-dimensional clustering method. The propagation characteristics and potential influencing factors were examined through cross-wavelet transform, wavelet cross-correlation, and grey relational analysis. The major conclusions of this study are as follows:
(1) A total of 344 meteorological events and 169 agricultural drought events were identified using the clustering method. In Northwestern China, the high-intensity meteorological and agricultural drought events exhibited a synchronous dynamic trend, primarily concentrated in the 1960s. Over time, there was a decrease in both the duration and proportion of large-scale drought events from the 1960s to the 2010s. The dynamic migration process of individual drought events was effectively visualized from a three-dimensional perspective, and the identification results aligned with the actual drought records. This approach provided new insights into the quantitative study of drought evolution.
(2) Meteorological and agricultural droughts were closely related nationwide. The XWT analysis revealed that the sub-regions exhibited similar periodic characteristics for both types of droughts. A relatively stable and significant positive correlation was observed between meteorological and agricultural droughts at long timescales, whereas the correlation fluctuated between the positive and the negative at short timescales. The WTC analysis demonstrated that these two drought types shared similar resonance frequency and phase-shift characteristics. Furthermore, the wavelet cross-correlation results indicated that the strong correlation between the SSMI and SPEI across different timescales was concentrated within a lag time of 0–3 months, with the most significant correlation occurring at a lag time of 0 months.
(3) In Northwestern China, the plateau climate zone exhibited the longest average propagation time of eight months. The southeastern climate zone demonstrated a range of 3 to 11 months, while the westerly climate zone had the shortest propagation time. Overall, the average propagation time from meteorological to agricultural drought in Northwestern China was 6 months, with notable seasonal variations. The propagation time was shortest in the summer, followed by the autumn, and was relatively longer in the winter and spring.
(4) Precipitation, soil moisture, and DEM were positively correlated with the propagation time from meteorological to agricultural drought, while PET was negatively correlated with this propagation time. Adequate precipitation and soil moisture could delay the onset of soil-moisture-related drought conditions, thereby prolonging the propagation time. Conversely, the increased PET reduced soil moisture, which shortened the propagation time. Soil moisture could be the key factor directly determining the occurrence of agricultural drought and exerting the greatest influence on the propagation time compared to other factors. Although precipitation and PET could be the critical components of the water cycle and indirectly affect the soil moisture levels, neither the decreased precipitation nor the increased PET directly caused the agricultural drought, as the soil moisture could replenish the surface water requirements and thus mitigate the agricultural drought.
The results of this study on drought dynamics and propagation processes are expected to support the future development of drought warning systems and enhance drought preparedness. However, uncertainties remain regarding the factors influencing the drought propagation time. The application of the inverse distance weighting method to standardize the spatial resolution across grid data may introduce calculation errors owing to the lack of measured data. Future efforts should focus on collecting more meteorological and hydrological data to validate the reanalysis data and applying statistical or dynamical downscaling methods to improve the spatial resolution. Additionally, accurately identifying and disentangling the effects of various factors can be challenging owing to their inherent complexities. The influence of human activities on the hydrological cycle requires quantitative analyses in future research. Combining hydrological models with machine learning techniques may provide valuable support for predicting and managing drought propagation.

Supplementary Materials

The following supporting information can be downloaded at https://www.mdpi.com/article/10.3390/agronomy14091987/s1: Figure S1: Correlation between measured precipitation data and CRU data; Figure S2: The correlation coefficient of soil moisture between GLDAS and GLEAM.

Author Contributions

Conceptualization, K.F. and F.W.; methodology, H.Y. and Y.W.; original draft preparation, X.W. and Z.Z.; funding acquisition, K.F., Y.L. and X.S. All authors have read and agreed to the published version of the manuscript.

Funding

This research was supported by the National Natural Science Fund of China (grant number 42301024, 52079111, and 52179015), Science and Technology Projects in Henan Province (grant number 242102321114 and 222102320043), National Key R&D Program of China (grant number 2023YFC3006603), Yinshanbeilu Grassland Eco-hydrology National Observation and Research Station, China Institute of Water Resources and Hydropower Research (grant number YSS202316), and Key R & D projects in Henan Province (241111112600).

Data Availability Statement

Data can be requested from the corresponding author upon reasonable request.

Conflicts of Interest

The authors declare no conflicts of interest.

References

  1. Li, H.; Wang, H.; Sui, H.; Wardlow, B.; Hayes, M.; Wang, J. Mapping the Spatial-Temporal Dynamics of Vegetation Response Lag to Drought in a Semi-Arid Region. Remote Sens. 2019, 11, 1873. [Google Scholar] [CrossRef]
  2. Zhang, T.; Su, X.; Zhang, G.; Wu, H.; Wang, G.; Chu, J. Evaluation of the impacts of human activities on propagation from meteorological drought to hydrological drought in the Weihe River Basin, China. Sci. Total Environ. 2022, 819, 153030. [Google Scholar] [CrossRef] [PubMed]
  3. Wang, T.; Tu, X.; Singh, V.; Chen, X.; Lin, K. Global data assessment and analysis of drought characteristics based on CMIP6. J. Hydrol. 2021, 596, 126091. [Google Scholar] [CrossRef]
  4. Samantaray, A.K.; Ramadas, M.; Panda, R.K. Changes in drought characteristics based on rainfall pattern drought index and the CMIP6 multi-model ensemble. Agr. Water Manag. 2022, 266, S606841849. [Google Scholar] [CrossRef]
  5. Guo, W.; Huang, S.; Huang, Q.; Leng, G.; Mu, Z.; Han, Z.; Wei, X.; She, D.; Wang, H.; Wang, Z. Drought trigger thresholds for different levels of vegetation loss in China and their dynamics. Agr. Forest Meteorol. 2023, 331, 109349. [Google Scholar] [CrossRef]
  6. Mishra, A.K.; Singh, V.P. A review of drought concepts. J. Hydrol. 2010, 391, 202–216. [Google Scholar] [CrossRef]
  7. Zhu, H.; Chen, K.; Hu, S.; Liu, J.; Shi, H.; Wei, G.; Chai, H.; Li, J.; Wang, T. Using the Global Navigation Satellite System and Precipitation Data to Establish the Propagation Characteristics of Meteorological and Hydrological Drought in Yunnan, China. Water Resour. Res. 2023, 59, e2022WR033126. [Google Scholar] [CrossRef]
  8. Sadiqi, S.S.J.; Hong, E.M.; Nam, W.H.; Kim, T. Review: An integrated framework for understanding ecological drought and drought resistance. Sci. Total Environ. 2022, 846, 157477. [Google Scholar] [CrossRef]
  9. Xu, Y.; Zhang, X.; Wang, X.; Hao, Z.; Singh, V.P.; Hao, F. Propagation from meteorological drought to hydrological drought under the impact of human activities: A case study in northern China. J. Hydrol. 2019, 579, 124147. [Google Scholar] [CrossRef]
  10. Zhou, K.; Li, J.; Zhang, T.; Kang, A. The use of combined soil moisture data to characterize agricultural drought conditions and the relationship among different drought types in China. Agr. Water Manag. 2021, 243, 106479. [Google Scholar] [CrossRef]
  11. Gevaert, A.; Veldkamp, T.I.E.; Ward, P. The effect of climate type on timescales of drought propagation in an ensemble of global hydrological models. Hydrol. Earth Syst. Sci. 2018, 22, 4649–4665. [Google Scholar] [CrossRef]
  12. Shi, H.; Chen, J.; Wang, K.; Niu, J. A new method and a new index for identifying socioeconomic drought events under climate change: A case study of the East River basin in China. Sci. Total Environ. 2018, 616–617, 363–375. [Google Scholar] [CrossRef] [PubMed]
  13. Sun, H.; Sun, X.; Chen, J.; Deng, X.; Yang, Y.; Qin, H.; Chen, F.; Zhang, W. Different types of meteorological drought and their impact on agriculture in Central China. J. Hydrol. 2023, 627, 130423. [Google Scholar] [CrossRef]
  14. Fang, W.; Huang, S.; Huang, Q.; Huang, G.; Wang, H.; Leng, G.; Wang, L. Identifying drought propagation by simultaneously considering linear and nonlinear dependence in the Wei River basin of the Loess Plateau, China. J. Hydrol. 2020, 591, 125287. [Google Scholar] [CrossRef]
  15. Wang, Z.; Chang, J.; Wang, Y.; Yang, Y.; Guo, Y.; Yang, G.; He, B. Temporal and spatial propagation characteristics of meteorological drought to hydrological drought and influencing factors. Atmos. Res. 2024, 299, 107212. [Google Scholar] [CrossRef]
  16. Han, Z.; Huang, S.; Zhao, J.; Leng, G.; Huang, Q.; Zhang, H.; Li, Z. Long-chain propagation pathways from meteorological to hydrological, agricultural and groundwater drought and their dynamics in China. J. Hydrol. 2023, 625, 130131. [Google Scholar] [CrossRef]
  17. Yang, F.; Xingwu, D.; Guo, Q.; Lu, S.; Hsu, K. The spatiotemporal variations and propagation of droughts in Plateau Mountains of China. Sci. Total Environ. 2021, 805, 150257. [Google Scholar] [CrossRef]
  18. Geng, G.; Zhang, B.; Gu, Q.; He, Z.; Zheng, R. Drought propagation characteristics across China: Time, probability, and threshold. J. Hydrol. 2024, 631, 130805. [Google Scholar] [CrossRef]
  19. Wang, F.; Wang, Z.; Yang, H.; Di, D.; Zhao, Y.; Liang, Q.; Hussain, Z. Comprehensive evaluation of hydrological drought and its relationships with meteorological drought in the Yellow River basin. China. J. Hydrol. 2020, 584, 124751. [Google Scholar] [CrossRef]
  20. Zhu, Y.; Liu, Y.; Wang, W.; Singh, V.P.; Ma, X.; Yu, Z. Three dimensional characterization of meteorological and hydrological droughts and their probabilistic links. J. Hydrol. 2019, 578, 124016. [Google Scholar] [CrossRef]
  21. Lin, Q.; Wu, Z.; Zhang, Y.; Peng, T.; Chang, W.; Guo, J. Propagation from meteorological to hydrological drought and its application to drought prediction in the Xijiang River basin, South China. J. Hydrol. 2022, 617, 128889. [Google Scholar] [CrossRef]
  22. Xu, Y.; Zhang, X.; Hao, Z.; Singh, V.P.; Hao, F. Characterization of agricultural drought propagation over China based on bivariate probabilistic quantification. J. Hydrol. 2021, 598, 126194. [Google Scholar] [CrossRef]
  23. Han, Z.; Huang, S.; Huang, Q.; Leng, G.; Liu, Y.; Bai, Q.; He, P.; Liang, H.; Shi, W. GRACE-based high-resolution propagation threshold from meteorological to groundwater drought. Agr. Forest Meteorol. 2021, 307, 108476. [Google Scholar] [CrossRef]
  24. Wang, X.; Zhang, B.; Zhang, Z.; Tian, L.; Kunstmann, H.; He, C. Identifying spatiotemporal propagation of droughts in the agro-pastoral ecotone of northern China with long-term WRF simulations. Agr. Forest Meteorol. 2023, 336, 109474. [Google Scholar] [CrossRef]
  25. Sun, P.; Liu, R.; Yao, R.; Hao, S.; Bian, Y. Responses of agricultural drought to meteorological drought under different climatic zones and vegetation types. J. Hydrol. 2023, 619, 129305. [Google Scholar] [CrossRef]
  26. Cao, S.; Zhang, L.; He, Y.; Zhang, Y.; Chen, Y.; Yao, S.; Yang, W.; Sun, Q. Effects and contributions of meteorological drought on agricultural drought under different climatic zones and vegetation types in Northwest China. Sci. Total Environ. 2022, 821, 153270. [Google Scholar] [CrossRef] [PubMed]
  27. Zhou, J.; Li, Q.; Wang, L.; Lei, L.; Huang, M.; Xiang, J.; Feng, W.; Zhao, Y.; Xue, D.; Liu, C.; et al. Impact of Climate Change and Land-Use on the Propagation from Meteorological Drought to Hydrological Drought in the Eastern Qilian Mountains. Water. 2019, 11, 1602. [Google Scholar] [CrossRef]
  28. Cao, S.; He, Y.; Zhang, L.; Chen, Y.; Yang, W.; Yao, S.; Sun, Q. Spatiotemporal characteristics of drought and its impact on vegetation in the vegetation region of Northwest China. Ecol. Indic. 2021, 133, 108420. [Google Scholar] [CrossRef]
  29. Han, Z.; Zhang, B.; Yang, L.; He, C. Assessment of the impact of future climate change on maize yield and water use efficiency in agro-pastoral ecotone of Northwestern China. J. Agron. Crop Sci. 2021, 207, 317–331. [Google Scholar] [CrossRef]
  30. Feng, K.; Yan, Z.; Li, Y.; Wang, F.; Zhang, Z.; Su, X.; Wu, H.; Zhang, G.; Wang, Y. Spatio-temporal dynamic evaluation of agricultural drought based on a three-dimensional identification method in Northwest China. Agr. Water Manag. 2023, 284, 108325. [Google Scholar] [CrossRef]
  31. Gao, S.; Lai, H.; Wang, F.; Qiang, X.; Li, H.; Di, D. An Analysis of Spatial–Temporal Evolution and Propagation Features of Vegetation Drought in Different Sub-Zones of China. Agronomy 2023, 13, 2101. [Google Scholar] [CrossRef]
  32. Yang, G.; Chang, J.; Wang, Y.; Guo, A.; Zhang, L.; Zhou, K.; Wang, Z. Understanding drought propagation through coupling spatiotemporal features using vine copulas: A compound drought perspective. Sci. Total Environ. 2024, 921, 171080. [Google Scholar] [CrossRef] [PubMed]
  33. Chen, X.; Li, F.W.; Li, J.Z.; Feng, P. Three-dimensional identification of hydrological drought and multivariate drought risk probability assessment in the Luanhe River basin, China. Theor. Appl. Climatol. 2019, 137, 3055–3076. [Google Scholar] [CrossRef]
  34. Luo, M.; Lau, N.-C.; Liu, Z.; Wu, S.; Wang, X. An Observational Investigation of Spatiotemporally Contiguous Heatwaves in China From a 3D Perspective. Geophys. Res. Lett. 2022, 49, e2022GL097714. [Google Scholar] [CrossRef]
  35. Meng, C.; Dong, Z.; Liu, K.; Wang, Y.; Zhang, Y.; Zhu, Y. Identification and analysis of evolution characteristics of flash drought based on three-dimensional perspective: A case study in the Jialing River basin. Urban Clim. 2024, 53, 101803. [Google Scholar] [CrossRef]
  36. Ji, Y.; Fu, J.; Lu, Y.; Liu, B. Three-dimensional-based global drought projection under global warming tendency. Atmos. Res. 2023, 291, 106812. [Google Scholar] [CrossRef]
  37. Feng, K.; Su, X.; Singh, V.P.; Ayantobo, O.O.; Zhang, G.; Wu, H.; Zhang, Z. Dynamic evolution and frequency analysis of hydrological drought from a three-dimensional perspective. J. Hydrol. 2021, 600, 126675. [Google Scholar] [CrossRef]
  38. Han, Z.; Huang, S.; Huang, Q.; Leng, G.; Wang, H.; Bai, Q.; Zhao, J.; Ma, L.; Wang, L.; Du, M. Propagation dynamics from meteorological to groundwater drought and their possible influence factors. J. Hydrol. 2019, 578, 124102. [Google Scholar] [CrossRef]
  39. Lin, Q.; Wu, Z.; Singh, V.P.; Sadeghi, S.H.R.; He, H.; Lu, G. Correlation between hydrological drought, climatic factors, reservoir operation, and vegetation cover in the Xijiang Basin, South China. J. Hydrol. 2017, 549, 512–524. [Google Scholar] [CrossRef]
  40. Li, Q.; He, P.; He, Y.; Han, X.; Zeng, T.; Lu, G.; Wang, H. Investigation to the relation between meteorological drought and hydrological drought in the upper Shaying River Basin using wavelet analysis. Atmos. Res. 2020, 234, 104743. [Google Scholar] [CrossRef]
  41. Yang, P.; Zhai, X.; Huang, H.; Zhang, Y.; Zhu, Y.; Shi, X.; Zhou, L.; Fu, C. Association and driving factors of meteorological drought and agricultural drought in Ningxia, Northwest China. Atmos. Res. 2023, 289, 106753. [Google Scholar] [CrossRef]
  42. Potopová, V.; Štěpánek, P.; Možný, M.; Türkott, L.; Soukup, J. Performance of the standardised precipitation evapotranspiration index at various lags for agricultural drought risk assessment in the Czech Republic. Agr. Forest Meteorol. 2015, 202, 26–38. [Google Scholar] [CrossRef]
  43. Feng, K.; Su, X.; Zhang, G.; Javed, T.; Zhang, Z. Development of a new integrated hydrological drought index (SRGI) and its application in the Heihe River Basin, China. Theor. Appl. Climatol. 2020, 141, 43–59. [Google Scholar] [CrossRef]
  44. Zhan, C.; Liang, C.; Zhao, L.; Jiang, S.; Niu, K.; Zhang, Y. Drought-related cumulative and time-lag effects on vegetation dynamics across the Yellow River Basin, China. Ecol. Indic. 2022, 143, 109409. [Google Scholar] [CrossRef]
  45. Lin, H.; Yu, Z.; Chen, X.; Gu, H.; Ju, Q.; Shen, T. Spatial-temporal dynamics of meteorological and soil moisture drought on the Tibetan Plateau: Trend, response, and propagation process. J. Hydrol. 2023, 626, 130211. [Google Scholar] [CrossRef]
  46. Yang, Y.; Shang, S.; Jiang, L. Remote sensing temporal and spatial patterns of evapotranspiration and the responses to water management in a large irrigation district of North China. Agr. Forest Meteorol. 2012, 164, 112–122. [Google Scholar] [CrossRef]
  47. Faiz, M.A.; Zhang, Y.Q.; Tian, X.Q.; Zhang, X.Z.; Ma, N.; Aryal, S. Time series analysis for droughts characteristics response to propagation. Int. J. Climatol. 2023, 43, 1561–1575. [Google Scholar] [CrossRef]
  48. Huang, S.; Li, P.; Huang, Q.; Leng, G.; Hou, B.; Ma, L. The propagation from meteorological to hydrological drought and its potential influence factors. J. Hydrol. 2017, 547, 184–195. [Google Scholar] [CrossRef]
  49. Qi, W.; Feng, L.; Liu, J.; Yang, H. Snow as an important natural reservoir for runoff and soil moisture in Northeast China. J. Geophys. Res. Atmos. 2020, 125, e2020JD033086. [Google Scholar] [CrossRef]
  50. Zhang, H.; Ding, J.; Wang, Y.S.; Zhou, D.Y.; Zhu, Q. Investigation about the correlation and propagation among meteorological, agricultural and groundwater droughts over humid and arid/semi-arid basins in China. J. Hydrol. 2021, 603, 127007. [Google Scholar] [CrossRef]
  51. Huang, S.Z.; Huang, Q.; Chang, J.X.; Leng, G.Y.; Xing, L. The response of Agricultural drought to Meteorological drought and the influencing factors: A case study in the Wei River Basin, China. Agric. Water Manag. 2015, 159, 45–54. [Google Scholar] [CrossRef]
  52. Yang, Y.; McVicar, T.; Donohue, R.; Zhang, Y.; Roderick, M.; Chiew, F.; Zhang, L.; Zhang, J. Lags in hydrologic recovery following an extreme drought: Assessing the roles of climate and catchment characteristics. Water Resour. Res. 2017, 53, 4821–4837. [Google Scholar] [CrossRef]
  53. Wu, Z.; Feng, H.; He, H.; Zhou, J.; Zhang, Y. Evaluation of soil moisture climatology and anomaly components derived from ERA5-land and GLDAS-2.1 in China. Water Resour. Manag. 2021, 35, 629–643. [Google Scholar] [CrossRef]
  54. Fuentes, I.; Padarian, J.; Vervoort, R.W. Spatial and temporal global patterns of drought propagation. Front. Environ. Sci. 2022, 10, 21. [Google Scholar] [CrossRef]
  55. Zhu, Y.; Yang, P.; Xia, J.; Huang, H.; Chen, Y.; Li, Z.; Sun, K.; Song, J.; Shi, X.; Lu, X. Drought propagation and its driving forces in central Asia under climate change. J. Hydrol. 2024, 636, 131260. [Google Scholar] [CrossRef]
  56. Hope, A.; Fouad, G.; Granovskaya, Y. Evaluating drought response of Southern Cape Indigenous Forests, South Africa, using MODIS data. Int. J. Remote Sens. 2014, 35, 4852–4864. [Google Scholar] [CrossRef]
  57. Sterling, S.; Ducharne, A.; Polcher, J. The impact of global land-cover change on the terrestrial water cycle. Nat. Clim. Chang. 2013, 3, 13688. [Google Scholar] [CrossRef]
  58. Zhang, X.; Hao, Z.; Singh, V.P.; Zhang, Y.; Feng, S.; Xu, Y.; Hao, F. Drought propagation under global warming: Characteristics, approaches, processes, and controlling factors. Sci. Total Environ. 2022, 838, 156021. [Google Scholar] [CrossRef]
  59. Zhao, W.; Wu, J.; Du, E.; Deng, X.; Sun, G.; Wang, G. Deciphering the influence of climate change and human activities on the drought propagation. J. Hydrol.-Reg. Stud. 2024, 51, 101654. [Google Scholar] [CrossRef]
Figure 1. The geographical location and topography of Northwestern China.
Agronomy 14 01987 g001
Figure 2. Evolution of typical meteorological drought (top) and agricultural drought (bottom) events in the time–latitude–longitude dimensions.
Agronomy 14 01987 g002
Figure 3. Correlation coefficients between the monthly SSMI and SPEI series at various timescales in different sub-regions: (a) plateau climate zone, (b) westerly climate zone, and (c) southeast climate zone.
Agronomy 14 01987 g003aAgronomy 14 01987 g003b
Figure 4. Correlation coefficient between monthly SSMI and SPEI series at various timescales in different sub-regions during 1960–2018. The highlighted symbols indicate the optimal timescales of SPEI.
Agronomy 14 01987 g004
Figure 5. The cross-wavelet spectrum (XWT) and wavelet coherency (WTC) of the optimal timescale SPEI and monthly SSMI in different sub-regions during 1960–2018: (a,b) plateau climate zone, (c,d) westerly climate zone, and (e,f) southeast climate zone.
Agronomy 14 01987 g005
Figure 6. The wavelet cross-correlation between the optimal timescale SPEI and monthly SSMI in different sub-regions: (a) plateau climate zone, (b) westerly climate zone, and (c) southeast climate zone. P and LT indicate the period and lag time, respectively.
Agronomy 14 01987 g006aAgronomy 14 01987 g006b
Figure 7. Land use types of sub-regions.
Agronomy 14 01987 g007
Table 1. Drought classification of SPEI and SSMI.
Drought Level SPEI/SSMIClass
I−0.5 < SPEI and SSMINo drought
II−1.0 < SPEI and SSMI ≤ −0.5Mild drought
III−1.5 < SPEI and SSMI ≤ −1.0Moderate drought
IV−2.0 < SPEI and SSMI ≤ −1.5Severe drought
VSPEI and SSMI ≤ −2Extreme drought
Table 2. Decadal statistics of meteorological and agricultural drought characteristics.
Drought
Variable
Meteorological DroughtAgricultural Drought
1960s1970s1980s1990s2000s2010s1960s1970s1980s1990s2000s2010s
Number of events 506458546652233033331733
Drought duration
(month)
Mean2.662.582.262.301.922.21755.276.2454.82
Max91111889222621241721
SD2.262.302.071.841.551.676.416.244.815.724.304.99
Proportion for ≥252.0%48.4%41.4%46.3%39.4%51.9%81.8%70%86.7%69.7%82.4%66.7%
Drought area
(106 km2)
Mean0.340.300.310.330.220.290.210.110.140.140.160.11
Max1.541.491.621.611.331.611.030.350.550.730.820.45
SD0.380.310.390.350.260.320.260.090.150.170.190.10
Drought severity
(106 month·km2)
Mean1.210.770.900.980.530.711.820.590.871.130.760.66
Max9.386.817.318.537.155.4112.984.546.098.214.164.19
Min0.040.040.030.030.030.030.030.030.040.040.030.04
SD2.041.161.621.721.071.113.170.991.572.001.060.99
Migration distance
(km)
Mean259.28282.64243.33234.56189.14258.13341.45159.58195.35244.19217.42212.86
Max1763.712572.171685.601554.162115.551901.331955.27965.701019.141188.271470.72970.83
SD398.34473.57436.02396.07383.38401.80489.36245.94272.95336.21341.41250.08
Table 3. Correlation and grey relational degree between drought propagation time and influencing factors in sub-regions.
Sub-RegionsInfluencing FactorsSpringSummerAutumnWinter
rRrRrRrR
Plateau climate zonePrecipitation0.16 **0.6400.79 **0.7290.53 **0.7550.13 *0.655
PET−0.66 **0.657−0.73 **0.531−0.47 **0.618−0.0050.602
Soil moisture0.69 **0.6930.85 **0.8170.71 **0.7590.63 **0.695
DEM0.55 **0.6300.47 **0.6410.57 **0.6410.64 **0.638
Southeastern climate zonePrecipitation−0.040.755−0.10 *0.6240.37 **0.7490.26 **0.826
PET−0.020.7440.14 **0.615−0.27 **0.7230.32 **0.751
Soil moisture0.20 **0.7920.15 **0.7270.51 **0.8230.52 **0.931
DEM0.09 *0.6810.20 **0.6490.52 **0.8450.21 **0.541
Westerly climate zonePrecipitation0.68 **0.7530.72 **0.6830.67 **0.7440.39 **0.806
PET0.09 *0.615−0.31 **0.6870.030.7560.35 **0.681
Soil moisture0.89 **0.8130.92 **0.8060.84 **0.7580.75 **0.737
DEM0.10 *0.7890.020.4770.12 **0.7490.070.733
Note: “*” and “**” indicate α = 0.05 and α = 0.01 significance levels, respectively. r and R indicate the correlation coefficient and grey relational degree, respectively.
Disclaimer/Publisher’s Note: The statements, opinions and data contained in all publications are solely those of the individual author(s) and contributor(s) and not of MDPI and/or the editor(s). MDPI and/or the editor(s) disclaim responsibility for any injury to people or property resulting from any ideas, methods, instructions or products referred to in the content.

