Article

V-YOLO: A Lightweight and Efficient Detection Model for Guava in Complex Orchard Environments

1
College of Electronic Engineering (College of Artificial Intelligence), South China Agricultural University, Guangzhou 510642, China
2
National Center for International Collaboration Research on Precision Agricultural Aviation Pesticide Spraying Technology, Guangzhou 510642, China
3
College of Mathematics and Informatics, South China Agricultural University, Guangzhou 510642, China
4
Shenzhen International Graduate School, Tsinghua University, Shenzhen 518055, China
*
Author to whom correspondence should be addressed.
Agronomy 2024, 14(9), 1988; https://doi.org/10.3390/agronomy14091988
Submission received: 6 August 2024 / Revised: 24 August 2024 / Accepted: 26 August 2024 / Published: 2 September 2024

Abstract

:
The global agriculture industry is encountering challenges due to labor shortages and the demand for increased efficiency. Currently, fruit yield estimation in guava orchards primarily depends on manual counting. Machine vision is an essential technology for enabling automatic yield estimation in guava production. To address the detection of guava in complex natural environments, this paper proposes an improved lightweight and efficient detection model, V-YOLO (VanillaNet-YOLO). By utilizing the more lightweight and efficient VanillaNet as the backbone network and modifying the head part of the model, we enhance detection accuracy, reduce the number of model parameters, and improve detection speed. Experimental results demonstrate that V-YOLO and YOLOv10n achieve the same mean average precision (mAP) of 95.0%, but V-YOLO uses only 43.2% of the parameters required by YOLOv10n, performs calculations at 41.4% of the computational cost, and exhibits a detection speed that is 2.67 times that of YOLOv10n. These findings indicate that V-YOLO can be employed for rapid detection and counting of guava, providing an effective method for visually estimating fruit yield in guava orchards.

1. Introduction

Guava, known for its nutritional value, is renowned as one of the sweetest fruits globally, being abundant in fiber and serving as a rich source of essential vitamins and minerals [1]. Additionally, it boasts a diverse array of health-promoting antioxidants, including flavonoids. As per the China Statistical Yearbook, the Chinese agricultural workforce dwindled from 560 million in 1996 to 314 million in 2016, with the percentage of elderly laborers escalating from 9.86% to 33.57%. The scarcity of labor and the aging demographic are escalating fruit production costs. Machine vision technology can actively monitor the growth of fruits and vegetables, empowering farmers to assess production distribution and quality—a pivotal step toward automating plantation management and enhancing fruit and vegetable yields [2]. At the same time, it is also possible to estimate the market sales quantity storage space and market price [3]. Fruit and vegetable recognition plays a crucial role in advancing intelligent fruit and vegetable production and harvesting processes, contributing significantly to plantation management and streamlining operational automation.
Before the era of machine learning (ML), fruit detection primarily involved capturing images from orchards and applying diverse segmentation algorithms (like K-means, watershed, and contour detection) to detect salient fruit features, encompassing size, shape, ccolor, and texture. Over the past decade, much work has been accomplished using ML technology for fruit yield estimation because of its good capability [4,5,6,7].
Payne et al. [4] introduced a pixel segmentation method for mango fruits based on RGB and YCbCr color components and conducted texture segmentation by recognizing adjacent pixels. The results indicated an R2 value of 0.91 for four-sided imaging and 0.74 for one-sided imaging. Dorj et al. [6] developed a watershed algorithm to detect and segment citrus fruits after converting RGB images into an HSV color space, achieving an R2 value of 0.93. Some studies utilized size as a criterion for detecting object boundaries [7,8,9]. Yasar and Akdemir [10] devised an artificial neural network (ANN) method for orange detection by extracting color features from an HSV color space, achieving an accuracy rate of 89.80% on the test set. Another study proposed by Zhao et al. [11] applied the sum of absolute transformed difference (SATD) method to detect fruit pixels of immature green citrus, employing a support vector machine classifier to eliminate false positives based on texture features, resulting in accuracy and recall rates of 0.88 and 0.80, respectively.
Although machine learning techniques perform well in most fruit detection tasks, their yield estimates over large areas are poor. Due to their poor generalization ability, these technologies are difficult to popularize [5]. In all machine learning techniques, features need to be extracted from raw input data prior to training, which is tedious and time-consuming [12]. Deep learning, a more recently developed layering technique based on neural networks, has provided promising results in nearly all agricultural sectors [12]. Intelligent fruit yield estimation using deep learning is an important application of precision agriculture; this approach significantly reduces manpower by providing high-precision results, thereby improving fruit management practices [13].
Koirala et al. [14] developed a network called MangoYOLO, achieving an F1 score of 0.89 by simplifying the backbone network of YOLOv3. Similarly, Liang et al. [15] utilized the YOLOv3 network to detect litchi fruits. Ganesh et al. [16] proposed a method for detecting and segmenting oranges in orchards, evaluating the performance of their method using precision, recall rate, and F1 score. Wan and Goudos [17] introduced an improved Faster R-CNN architecture for multitype fruit detection, reporting accuracies of 92.51%, 88.94%, and 90.73% for apple, mango, and orange detection, respectively.
Figure 1a illustrates the current research in fruit detection and classification in natural environments, which typically employs two separate models to accomplish these tasks. Initially, fruits are detected, and subsequently, they are classified. The detection network solely focuses on fruit detection and does not perform classification. Tu et al. [18] conducted a study on the detection and counting of small passion fruits. They employed Faster R-CNN for fruit detection and achieved a detection accuracy of 92.71% and a classification accuracy of 91.52% for determining the maturity of passion fruits. Tan et al. [19] substituted cropped image patches with sliding windows and extracted HOG features to detect fruit regions. They then utilized color features of R, B, and H to differentiate ripening stages. Chen et al. [20] introduced a novel method for assessing citrus fruit ripeness that integrated visual saliency and convolutional neural networks. The researchers employed YOLOv5s to detect fruits in the images, integrating them with an enhanced saliency map to classify citrus ripeness using the ResNet34 network. YOLOv5s achieved a 95.4% mAP on the test set, and the classification accuracy of the ResNet34 network was 95.07%. Kao et al. [21] developed a convolutional autoencoder network to generate a mask of tomato fruit on a tree and used handmade color signatures as well as BP neural networks to detect tomato ripening periods.
Several studies have utilized a unified model for simultaneous fruit detection and classification (Figure 1b). Concurrently, the detection network classifies the fruits during their detection process. Wu and Tang [22] employed an enhanced version of YOLOv3 for both detecting and classifying passion fruit; experimental results demonstrated its efficacy in detecting passion fruit at various stages of ripeness within natural environments. Habaragamuwa et al. [23] applied a deep convolutional neural network (DCNN) to detect ripe greenhouse strawberries under a natural lighting condition. Gao et al. [24] proposed a multiclassification detection method based on Faster R-CNN to classify and detect fruits with no shade, shade by leaves, shade by branches/wires, and shade by fruit, with an average detection accuracy of 0.879 for the four categories.
Of the two methods described above, the first method (shown in Figure 1a) requires training two models, and there are errors in both stages, and the errors in both stages add up. For example, the detection accuracy of research [18] is 92.71% and the classification accuracy is 91.52%, so the accuracy of both the correct detection and correct classification is 84.60%. Therefore, this article uses the second method, as shown in Figure 1b.
Guava remains green in both ripe and immature stages, making it more challenging to detect than fruits and vegetables with dissimilar color backgrounds (e.g., ripe cherries, waxberries, and strawberries) [25]. Lin et al. [26] developed a 3D reconstruction technique for guava fruits and branches, achieving an F1 score of 0.518 with the tiny Mask R-CNN. The 2D and 3D fruit indices yielded F1 scores of approximately 0.851 and 0.833, respectively, while the 2D and 3D branch indices produced F1 values of 0.394 and 0.415, respectively. Under the 2D and 3D branch indices, the F1 values of branch reconstruction were 0.394 and 0.415, respectively. However, the above research is mainly aimed at the picking positioning of the picking robot and the picking obstacle avoidance of the manipulator. These methods only detect guava within a limited distance, and the detected images contain fewer guavas; thus, they are not suitable for calculating the number of fruits in a large area. Therefore, this study proposes a rapid detection method for guava in natural environments, and its main contributions are as follows:
(1) To address the challenges posed by complex backgrounds, occlusions, multiple targets, and objects with colors similar to leaves in natural settings, this study aims to introduce a high-precision, high-performance lightweight guava detection model for accurate and real-time guava detection and localization. The proposed model, named V-YOLO, is an enhanced version of the YOLOv10 model with VanillaNet as its backbone network and the incorporation of the SimAM attention mechanism.
(2) The V-YOLO model presented in this study achieves precise and swift guava detection in natural environments. Through ablation and comparison experiments, the model exhibited exceptional efficiency and performance, with detection accuracy comparable to YOLOv10n while surpassing it in detection speed and requiring fewer computational resources. This research offers technical solutions and support for guava yield estimation in natural settings, enabling the deployment of the proposed model on edge devices like mobile terminals for real-time yield estimation in orchards.

2. Materials and Methods

2.1. Image Acquisition

Guava images were collected from 8:00 to 18:00 on Jiashuo Farm (113°30′55.969″ E, 22°57′6.732″ N), Gull Island, Guangzhou, China. The farm has a fruit planting area of more than 3000 mu, and two varieties of guava, carmine guava and pearl guava, were photographed. The flesh of these two types of guavas is different but similar in appearance; both are oval, immature for cyan green, and mature for yellow green, among which the flesh of carmine guava is light red and the flesh of pearl guava is white. A Nikon D5300 camera (Manufacturer: Nikon Corporation, Tokyo, Japan; Sourced in Guangzhou, China) was used for taking the pictures. The image resolution was 2992 pixels × 2000 pixels, and the shooting distance was 50–200 cm. Images were taken from different angles, as shown in Figure 2.

2.2. Data Set Making and Partitioning

A total of 1153 images were initially collected. After discarding 63 blurred images, 1090 images remained. The manual labeling of these 1090 images was performed using LabelImg (https://github.com/tzutalin/labelImg (accessed on 3 December 2018)), as illustrated in Figure 3. Following the labeling process, the coordinates of the fruit center point within each image and the dimensions of the minimum bounding rectangle were acquired. Subsequently, a dataset for training and testing the guava recognition network was established.
Guava fruit changes in size, texture and color from fruiting to ripening. To enable the trained model to detect guava with different maturities, guava images of different growth stages were collected during data collection. As shown in Figure 4, in this paper, according to the size of the guava fruit, the skin texture, and skin color, the guava fruits were divided into two categories that have a relatively large difference in appearance: small fruit and large fruit.
As shown in Figure 4, the size and color of these two types of fruits were significantly different. If all fruits are given the same label, will affect the accuracy of the final model. Therefore, fruits of 2 species in Figure 4 were distinguished by two different labels, which were divided into two labels: large fruit and small fruit. As depicted in Table 1, employing the fruit classification method described above resulted in a dataset containing 1090 images, comprising 510 large guava images and 580 small guava images. The division of the dataset into training, testing, and validation sets follows a ratio of 7:1.5:1.5 [27,28]. Post-separation, there are 763 images in the training set, while the test and validation sets consist of 164 and 163 images, respectively. Notably, the model is exclusively trained using the training set; conversely, both the verification and test sets are excluded from model training.

2.3. Standard YOLOv10 Model

In recent years, significant advancements in object detection have been achieved through deep learning. After convolutional neural network [29], Girshick et al. [30] introduced a regional convolutional neural network (RCNN), enhancing the average accuracy of the VOC2012 dataset by 30% to 53.3%. Building upon R-CNN, Girshick et al. [31] and Ren et al. [32] proposed fast regional convolutional neural network (Fast R-CNN) and faster convolutional neural network (Faster R-CNN) to enhance both detection accuracy and speed, achieving a detection rate of up to 5 FPS (frames per second). Subsequently, in 2016, Redmon et al. [33] developed YOLO, significantly boosting the efficiency of target detection networks with a detection rate of up to 45 FPS and an average accuracy of 63.4%. The evolution continued in 2017 with Redmon et al. [34] developing YOLOv2 based on YOLO, boasting a mean average precision (mAP) of 76.8% and a detection rate of 67 FPS on VOC2007. In 2018, Redmon et al.’s [35] unveiling of YOLOv3 was a refinement over YOLOv2 that greatly improved object detection accuracy.
Based on the YOLOv3 architecture, Glenn et al. [36] introduced YOLOv5, which successfully achieved high detection accuracy and speed. Contrasted with an enhanced version of YOLOv3 and YOLOv4 [37], YOLOv5 demonstrated a superior balance between accuracy and speed. In 2021, Huang et al. [38] developed PP-YOLOV2 based on PP-YOLO [39], which attained a better equilibrium between detection accuracy and speed, surpassing the performance of pre-existing object detectors (YOLOV4-CSP, YOLOv5l) while maintaining similar parameter numbers. The detection rate reached 87 frames per second (FPS) for images sized at 640 × 640 pixels, satisfying the real-time fruit yield estimation detection requirements. As of 2024, there have been continuous iterations in the development of the YOLO series including versions v6 [40], v7 [41], v8 [42], v9 [43], and v10 [44].
YOLOv10 adopts the dual-label allocation strategy and uses one-to-many detection heads in the training stage to provide more authentic samples to enrich the training of the model. In the inference stage, the method of gradient truncation switches to one-to-one detection header so that the NMS post-processing is not required, and the inference cost is reduced while the performance is maintained. Using advanced structures such as CSPNet as the backbone network and PAN as the neck network to optimize feature extraction and multi-scale feature fusion, YOLOv10 shows significant performance and efficiency improvements at various model scales. YOLOv10 has achieved the most advanced performance and efficiency at different model scales, so this paper chooses YOLOv10n as the base model; the model structure of YOLOv10n is shown in Figure 5.

2.4. V-YOLO

2.4.1. Backbone

In order to adapt the model for diverse terminal devices and reduce both the computational load and parameter count, this study introduces the VanillaNet [45] module into the backbone. VanillaNet comprises solely fundamental convolutional and pooling layers, devoid of intricate connections, thereby diminishing computational requirements and model parameters. The structural layout of VanillaNet-6 is illustrated in Figure 6. The VanillaNet-6 model architecture features only 6 convolutional layers, making it highly compatible with most contemporary hardware setups. Drawing inspiration from classical neural networks like AlexNet [29] and VGGNet [46], this approach downscales input feature dimensions at each level while doubling channel quantities. As show in Figure 7, the backbone network in this research incorporates 1 standard convolutional layer and 4 VanillaNet layers, significantly trimming both computational demands and parameter count.

2.4.2. Attention Mechanism

In orchards, detecting guavas can be challenging due to their color similarity to the leaves and the overlapping nature of certain guavas. To enhance the accurate differentiation between guava and background information while minimizing background interference, an attention mechanism was incorporated in detection head in this study. This integration serves to improve the network’s feature extraction capabilities.
In order to maintain the model’s parameter count and computational load post-implementation of the attention mechanism, this study opted to integrate the SimAM [47] attention mechanism into the network. SimAM serves as a straightforward yet highly effective attention mechanism designed for convolutional neural networks. Diverging from conventional channel or spatial attention mechanisms, SimAM operates by deducing 3D attention weights within feature maps without introducing additional parameters to the original network. Specifically, SimAM leverages established neuroscience theories to enhance the energy function optimization for assessing the significance of individual neurons. Another notable attribute of SimAM is its reliance on predefined energy function solutions for most operations, thereby circumventing excessive structural adjustments. Quantitative assessments across various visual tasks demonstrate that the SimAM module exhibits flexibility and efficiency, enhancing the representation of numerous convolutional networks. The calculation of SimAM is shown in Equation (1).
w i = 1 k j N i S f i ,   f j
In Equation (1), w i represents the attention weight of the i pixel, k is the normalization constant, Ni denotes the set of adjacent pixels of the i pixel, and S f i ,   f j   indicates the similarity between the i pixel and the j pixel. As shown in Equation (2), SimAM employs the Euclidean distance as a simple and effective measure of similarity.
S f i ,   f j   = f i f j 2 2

2.4.3. Head

YOLOv10 uses dual-label assignments. YOLOv10 adds another one-on-one head. It retains the same structure as the original one-to-many branch and adopts the same optimization goals but utilizes one-to-one matching to obtain label assignments. During training, the two heads are co-optimized with the model, allowing the backbone and neck to enjoy the rich supervision provided by a one-to-many assignment. In the inference process, one-to-many heads are discarded, and one-to-one heads are used to make predictions. In this paper, we found that dual-label assignments did not bring improvement to guava detection tasks, and a single one-to-many head assignment was better in guava detection tasks. Therefore, this paper finally chooses a single one-to-many head. In addition, the YOLOv10 header is slightly different from the YOLOv8 header in other modules, using C2fCIB and SCDown (spatial channel decoupled downsampling). In this paper, it is found through test comparison that the C2f module is superior to the C2fCIB module, and the conv module is superior to the SCDown module in the performance of guava detection. The final model diagram of this paper is shown in Figure 7.

2.5. Model Evaluation Metrics

The primary evaluation metrics selected for this study are parameters, model computation amount (floating point operations, FLOPs), frames per second (FPS), precision (P), recall (R), and mAP (mean average precision). The mAP is assessed using an IoU threshold of 0.5.
F P S = F r a m e N u m E l a p s e d T i m e
P r e c i s i o n = T P T P + F P
R e c a l l = T P T P + F N
A P = P R d R
m A P = 1 c i = 1 c A P i × 100 %
In Equation (3), FrameNum denotes the total number of images detected, while ElapsedTime signifies the total detection time. Higher frames per second (FPS) indicates a faster detection rate and improved real-time model performance. Equations (4) and (5) define TP as correct predictions of positive class samples, FP as incorrect predictions of negative class samples as positive, and FN as incorrect predictions of positive class samples as negative. Equation (6) introduces P(R) as the function representing the precision–recall (PR) curve, which is plotted based on precision (P) and recall (R) at various confidence thresholds, with the area under the curve calculated as the average precision (AP) value through integration. In Equation (7), c represents the total number of image categories, and i denotes the detection category. The mean average precision (mAP) across all categories is derived by averaging the sum of AP values for each category, serving as an evaluation metric for the model’s overall performance.

2.6. Experiment Settings

The computer configuration utilized for model training and testing in this research comprises an NVIDIA GeForce RTX 3090 with 24 GB video memory, a 4-core CPU, 32GB memory, Python 3.9 as the deployment environment, PyTorch 2.0.1 as the deep learning framework, and CUDA 11.7 for acceleration. All network models are trained using pre-training weights provided by the model authors. The primary training parameters employed include the SGD optimizer with a momentum of 0.937 and weight decay rate of 0.0005. The initial learning rate is established at 0.01, maximum epochs at 1000, and batch size at 16. The input picture size is set at 640 × 640 pixels. During the training phase, prior to each batch training iteration, automatic data augmentation techniques (such as Mosaic augmentation, chromatic adjustments with a specific probability, and geometric transformations) were applied to the batch of images. An example of the augmented images from one batch is illustrated in Figure 8. If the model’s mean average precision (mAP) does not exhibit improvement after 50 epochs, the training of the model is halted.

3. Result

3.1. Ablation Experiments

This paper employs YOLOv10n as the base model, integrating the VanillaNet module into the f backbone to reduce model complexity and incorporating the SimAM attention mechanism module to enhance detection accuracy without escalating computational load. Meanwhile, one-to-one heads were eliminated from the head, retaining only one-to-many heads. The final model is depicted in Figure 7. To validate the efficacy of these enhancements over the baseline model, an ablation experiment was conducted, with experimental results presented in Table 2.
Table 2 data indicate that incorporating the VanillaNet module into the backbone significantly decreases the model’s parameter count and computational load, leading to a substantial increase in frames per second (FPS); however, it results in reduced detection accuracy. Upon introducing the SimAM attention mechanism, there is a slight enhancement in accuracy. Following head modification, there is a minor increase in parameters but a reduction in computation, resulting in a significant improvement in detection speed. In the final modified model, compared to YOLOv10n, there is a 56.77% reduction in parameters and a 58.54% decrease in computational load while achieving a 166.67% increase in detection speed. In terms of detection accuracy, no significant difference exists between the proposed model and YOLOv10n; precision increases by 3.3%, recall decreases by 0.6%, and mean average precision (mAP) remains unchanged.

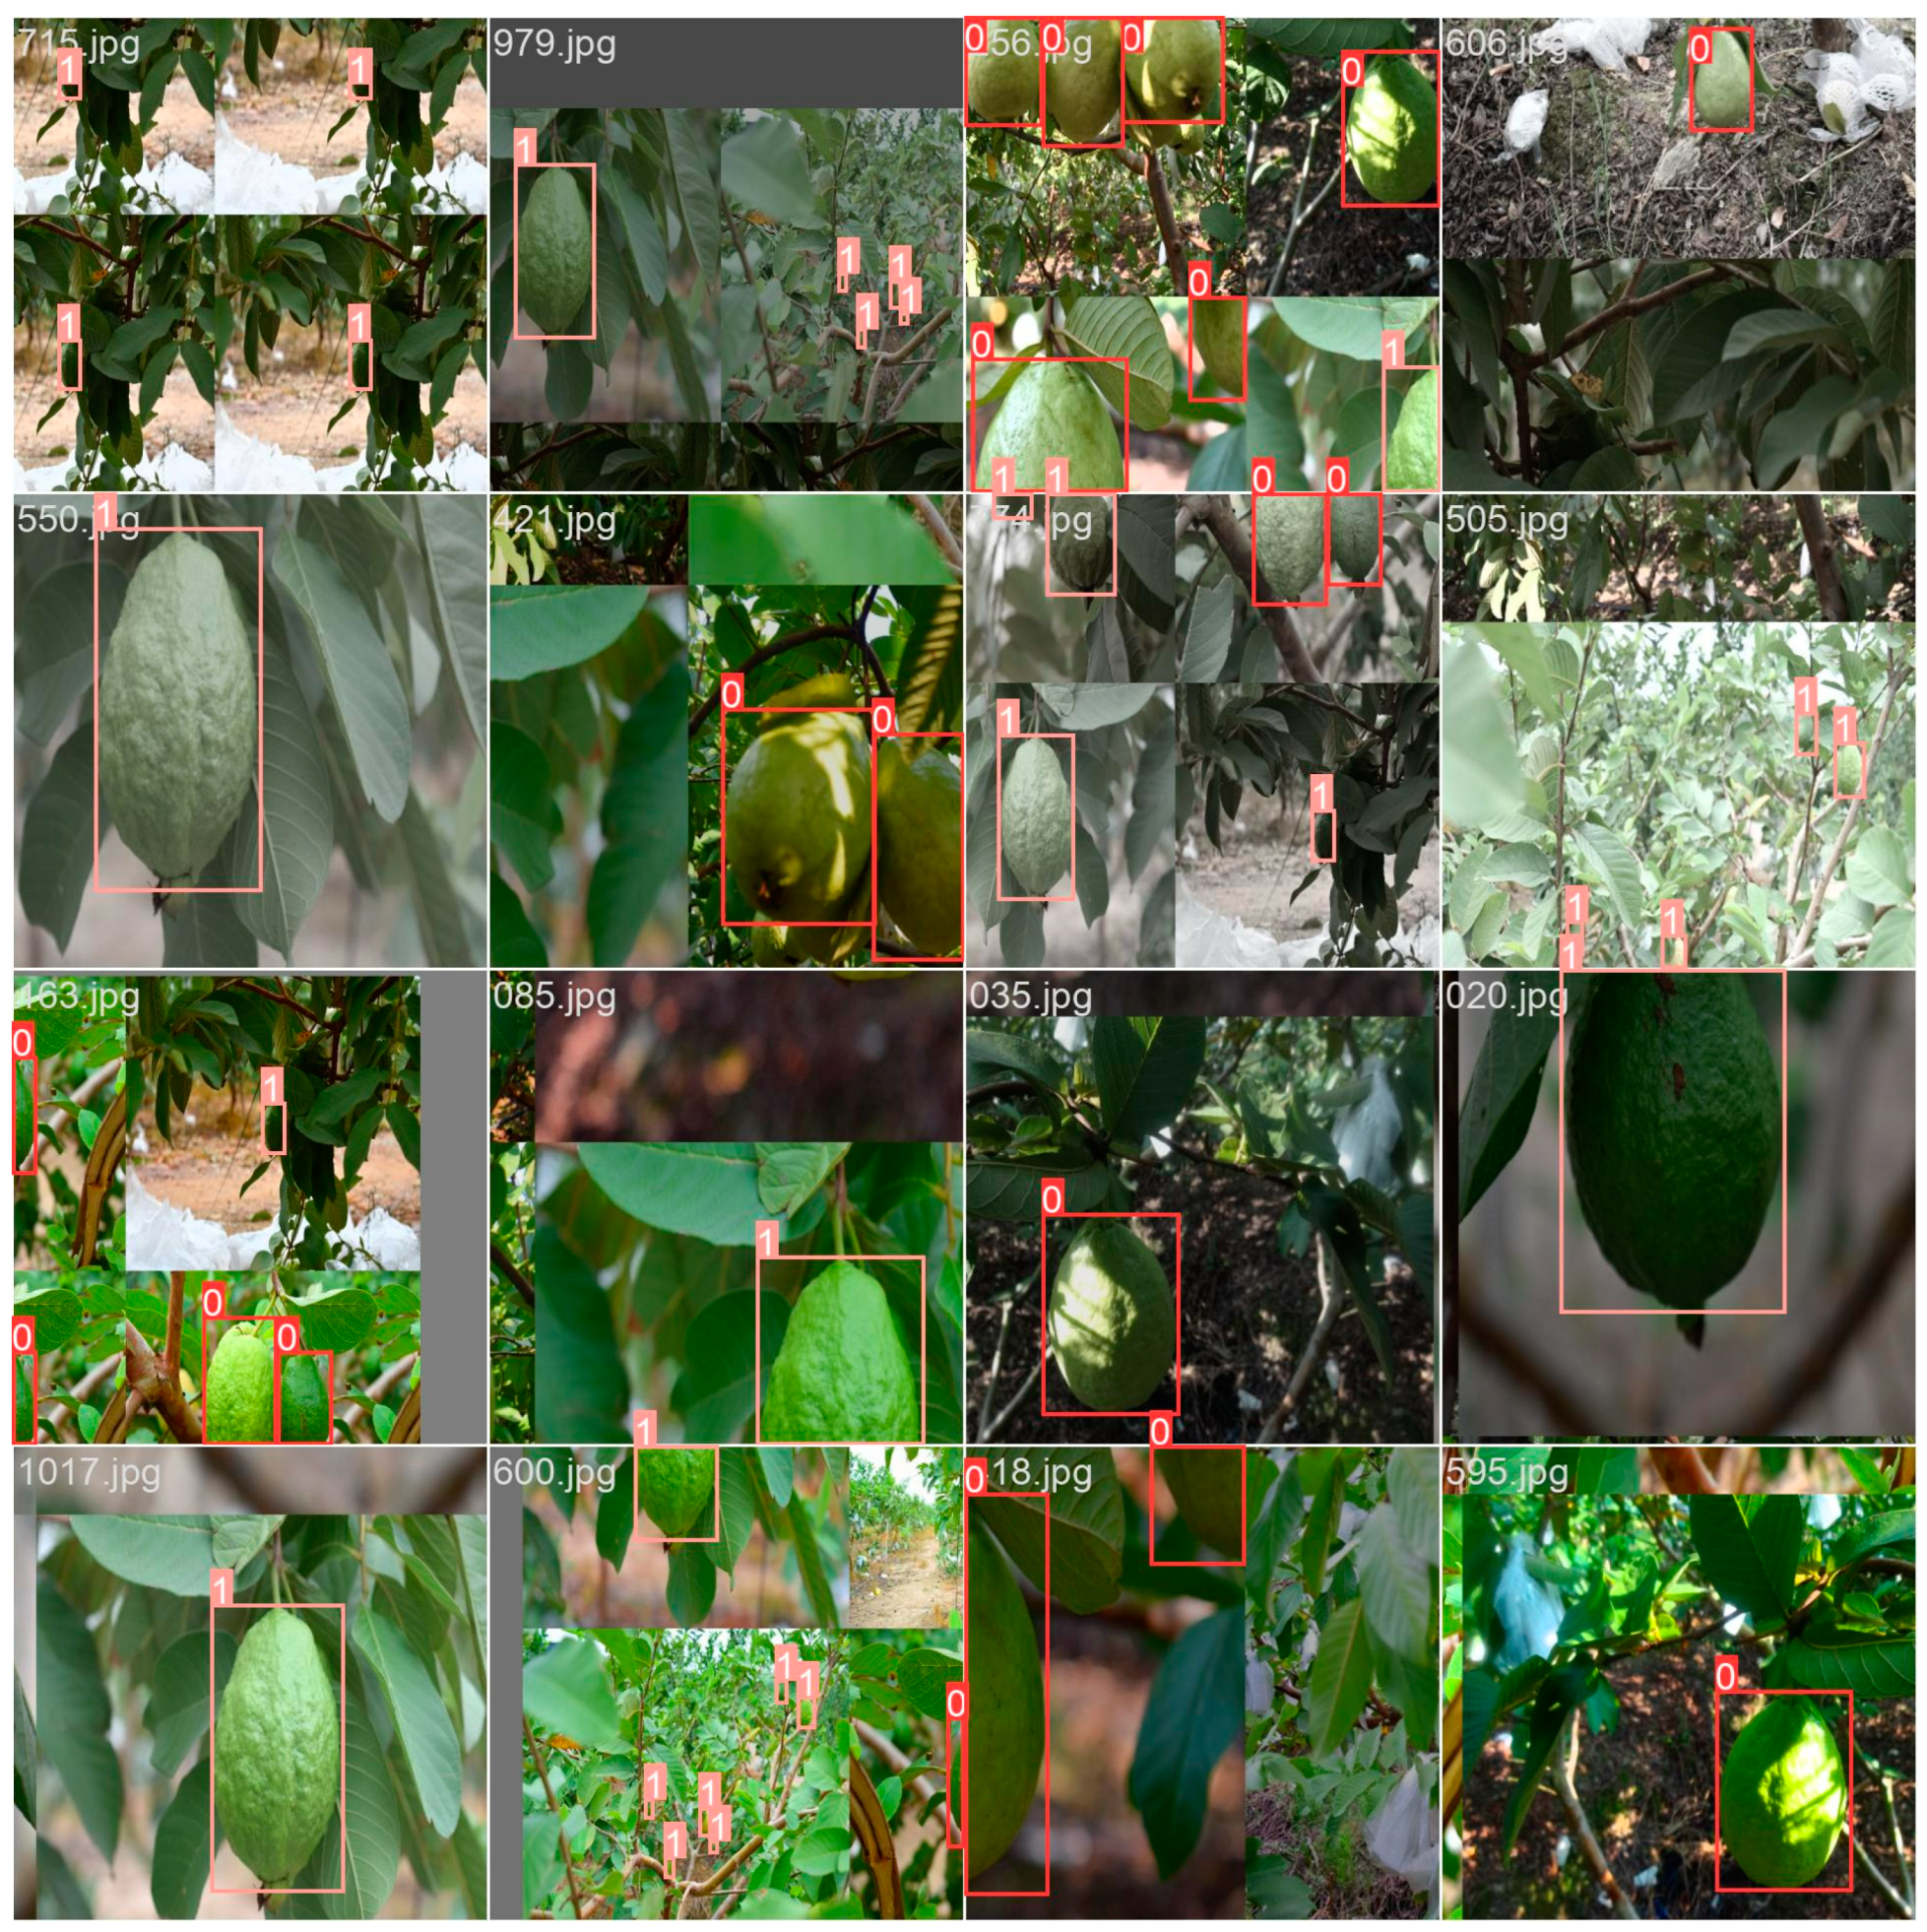
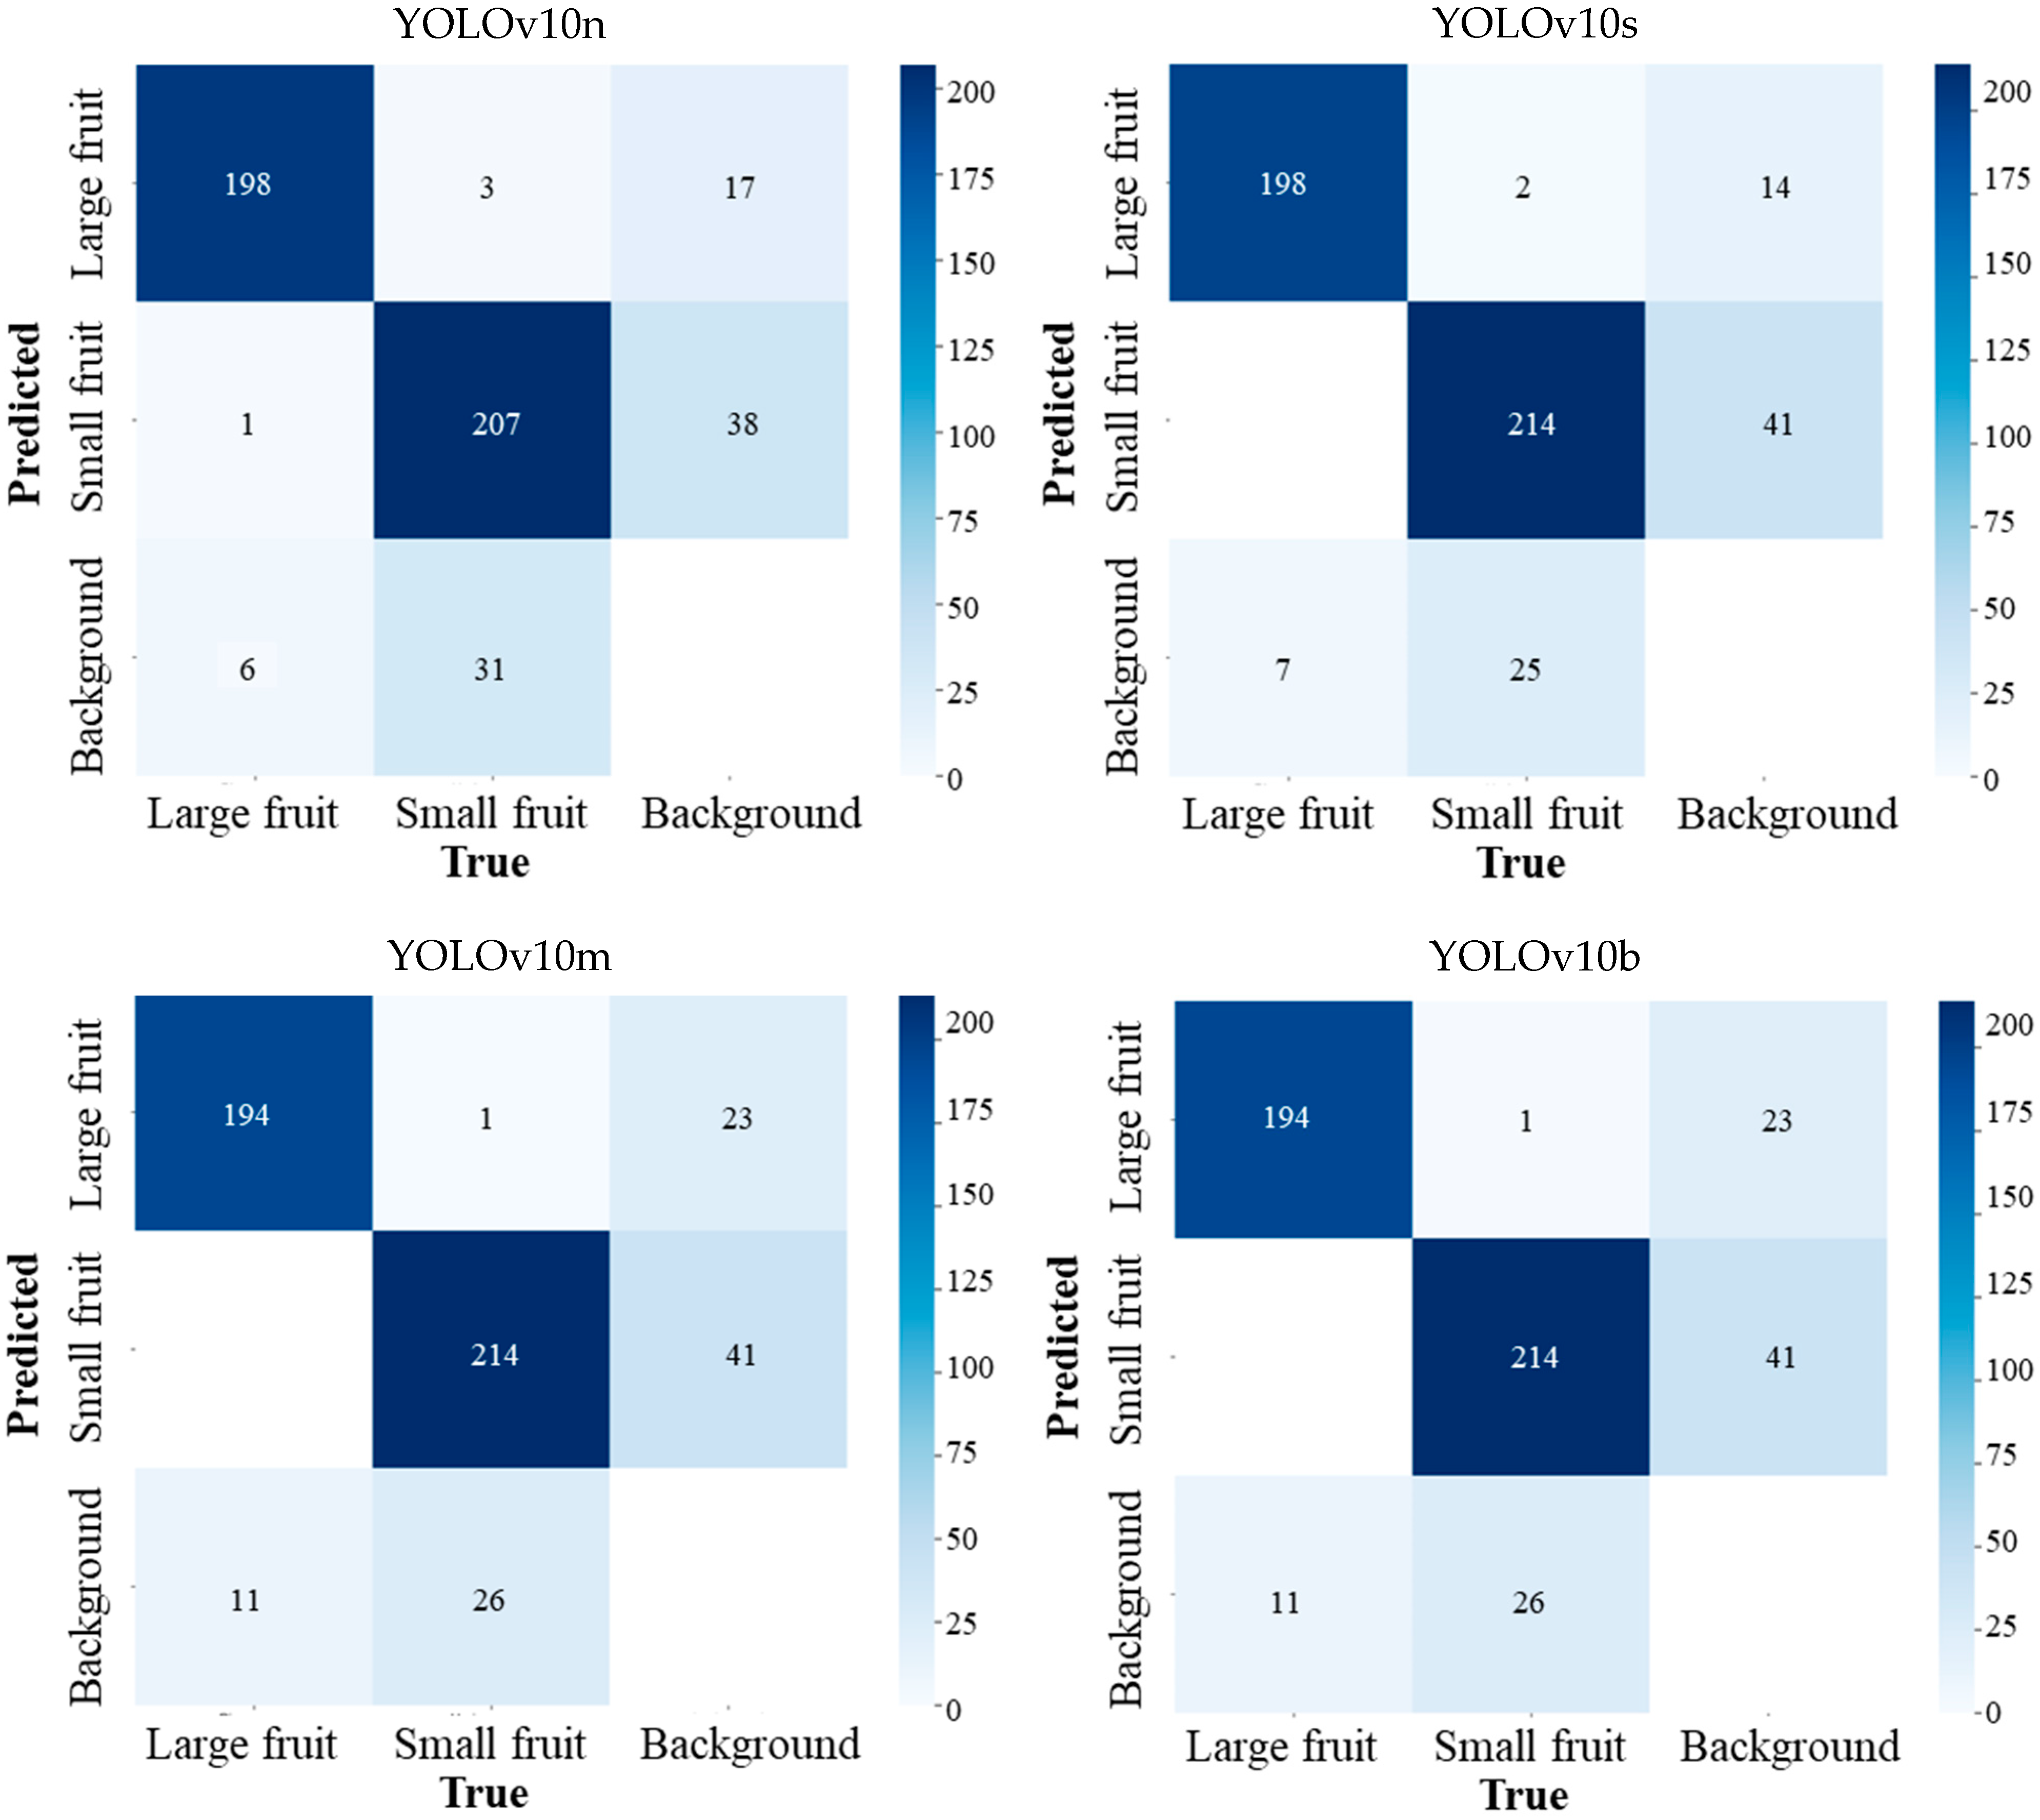
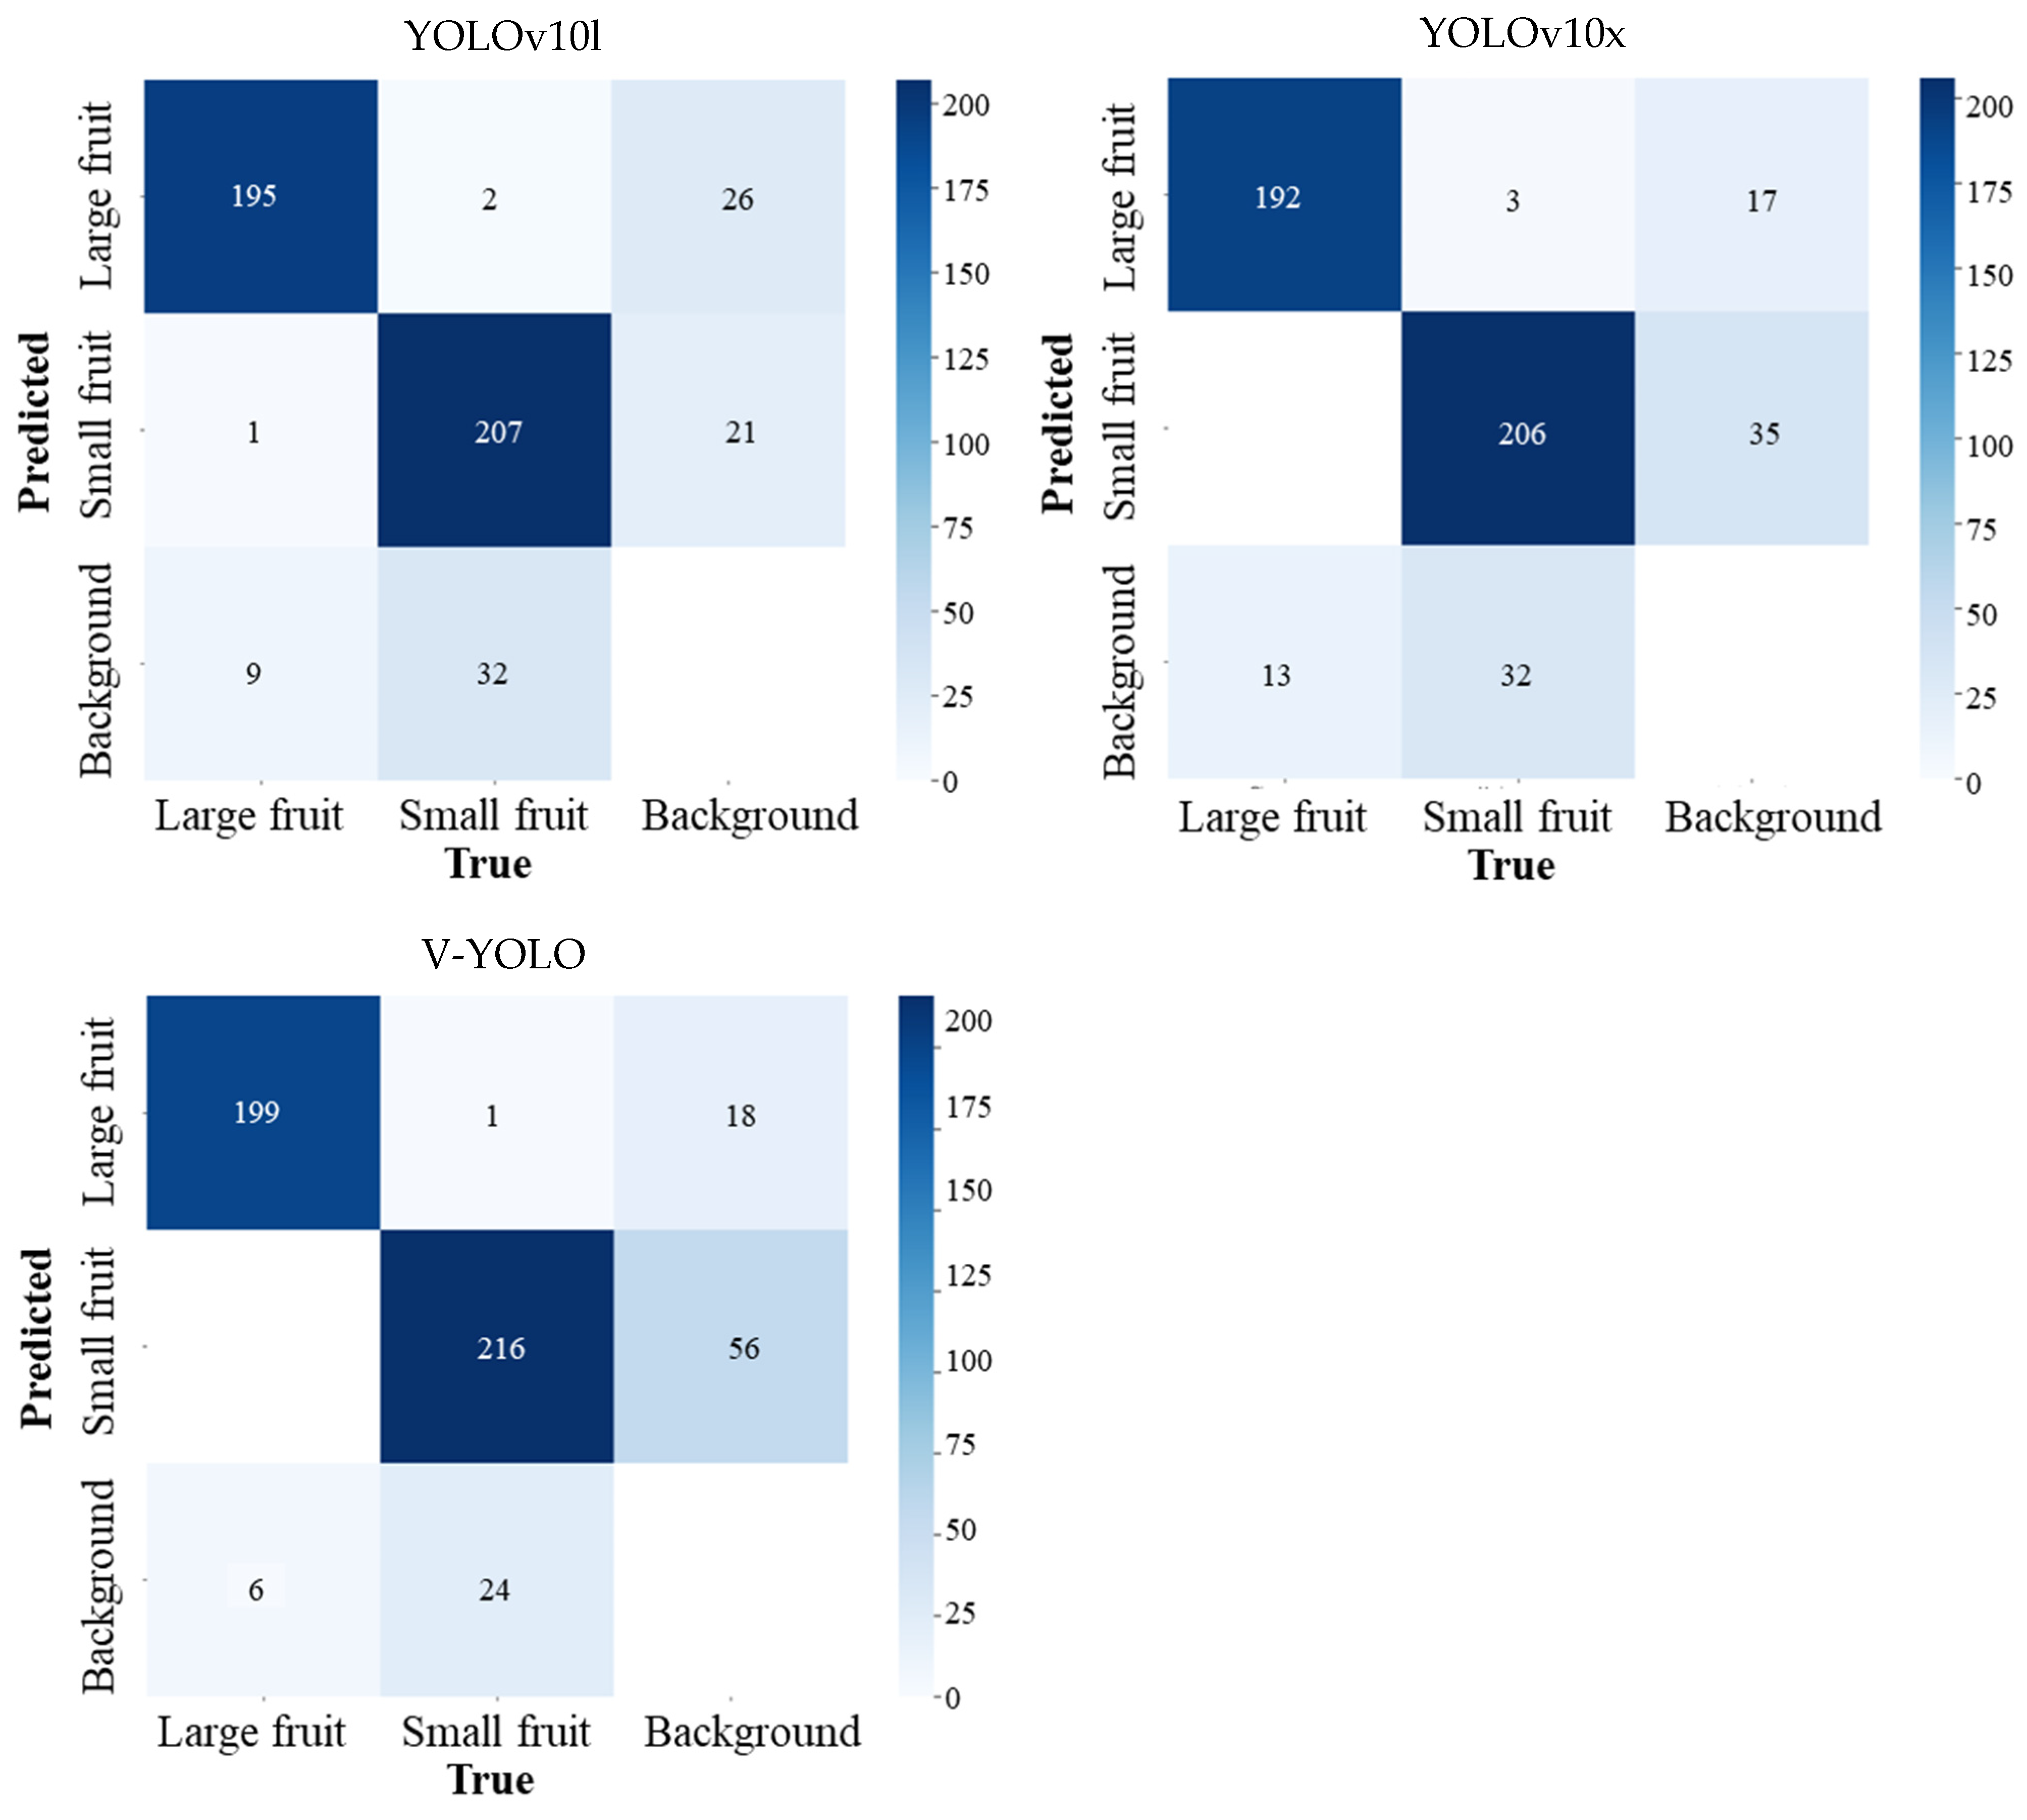
3.2. Guava Detection Performance

Currently, the YOLOv10 series models demonstrate superior performance and efficiency across various model scales. Alongside YOLO and its variants, RT-DETR [48] stands out as a model exhibiting commendable performance and efficiency. To assess the performance and efficiency of the proposed V-YOLO model, comparative experiments were conducted against YOLOv10 series models and RT-DETR. The corresponding experimental results are presented in Table 3.
As can be seen from the experimental results in Table 3, the performance of YOLOv10 has reached the limit for the guava detection task, and the mAP of different models has little difference, and the performance gap between different models may be caused by training errors. For the guava detection task, the performance of the YOLOv10 series may be excessive, and the size of the model can be further reduced. The V-YOLO guava detection model proposed in this paper has less than half of YOLOv10n in terms of parameters and computation, and the detection speed is 2.67 times that of YOLOv10n. Meanwhile, in terms of model performance, the detection performance of the V-YOLO proposed in this paper is not much different from that of the YOLOv10 series models. The precision is slightly higher than all models of the YOLOv10 series, recall is slightly lower than some models of the YOLOv10 series, and mAP is the same as that of the highest in the YOLOv10 series models. The confusion matrix is shown in Figure 9.
According to the confusion matrix in Figure 8, the number of large and small fruits correctly detected by V-YOLO is the highest, and the number of fruits incorrectly detected by V-YOLO is also the lowest. It can be seen from Table 3 that the precision of V-YOLO is the highest. However, V-YOLO also missed more small fruits, which reduced the recall of the model, but the total recall of the model was still higher than that of YOLOv10b, YOLOv10l, and YOLOv10x. Of course, the difference in performance may be caused by training errors, but it can be confirmed that the detection performance of the model proposed in this paper is not significantly different from the YOLOv10 series models in guava detection tasks. Some detection results of YOLOv10n and V-YOLO are shown in Figure 10; YOLOv10n and V-YOLO test results are only slightly different.

4. Discussion

With the gradual aging of the Chinese population and the increasing shortage of agricultural labor, enhancing agricultural production efficiency has become urgent. Currently, production estimates of guava orchards primarily rely on manual counting. Machine vision is a key technology for achieving automatic yield estimation in guava production. Traditional fruit detection methods are limited, as they mainly rely on color, size, and texture characteristics, resulting in poor generalization performance and difficulty in surpassing detection accuracy bottlenecks. Deep learning networks offer good generalization and high accuracy; however, models with better performance typically have more parameters and demand greater computational resources. Researchers are continually balancing performance and efficiency in deep learning models, aiming for smaller models to achieve better performance. In specific application scenarios, the performance of some models may be excessive, and it can be optimized to enhance efficiency while maintaining original performance.
This paper presents a V-YOLO network model based on an improved YOLOv10n for the visual inspection of guava, which successfully reduces model parameters and computational requirements while maintaining performance equivalent to YOLOv10n. By replacing the backbone layer with VanillaNet and incorporating the SimAM attention mechanism in the network’s head, the model’s feature diversity and generalization ability are enhanced, memory resource usage is minimized, and detection efficiency in complex environments is improved. Additionally, the one-to-one head was removed, and the C2fCIB and SCDown modules were replaced. Experimental results demonstrate that compared to YOLOv10n, the improved network reduces model parameters by 56.77%, computation by 58.54%, and detection speed by 166.67%. In terms of performance, the proposed model exhibits no significant difference from YOLOv10n in detection accuracy, with precision (P) being 3.3% higher, recall (R) 0.6% lower, and mean average precision (mAP) remaining unchanged.
After the model improvement, the detection efficiency of the model was significantly increased to 1666 FPS, enabling real-time and rapid detection of guava with efficient processing capabilities. Due to the reduction in parameters and computational requirements, this detection model can be easily deployed on resource-limited edge devices, such as mobile terminals, and applied to real-time yield estimation in orchards. However, there are some limitations to this study. Firstly, the model was specifically improved for guava detection, and its performance when applied to other objects needs further exploration. Additionally, although efforts were made to ensure the robustness of the model by considering different conditions during data acquisition, such as varying lighting conditions, occlusion levels, and angles, the specific impact of these factors on the model’s performance and strategies for further optimizing the model to address these challenges were not investigated.

5. Conclusions

For the visual detection task of guava, this paper proposes an efficient V-YOLO network model based on YOLOv10 to strike a balance between model performance and efficiency. Targeted improvements are made to YOLOv10, including the replacement of the backbone layer with VanillaNet and the introduction of the SimAM attention mechanism at the network’s head. Additionally, the one-to-one head is removed, and the C2fCIB module and the SCDown module are replaced. These enhancements improve the efficiency of the model while maintaining its performance. Compared to the original YOLOv10 model, the number of parameters is reduced by 56.77%, the computational load is reduced by 58.54%, and the detection speed is increased by 166.67%. V-YOLO greatly reduces the number of parameters and computational load, significantly improving the detection speed without compromising the model’s detection ability. It can be easily deployed on resource-constrained edge devices, such as mobile terminals, and applied to real-time yield estimation in orchards. Furthermore, future research will focus on addressing the shortcomings and challenges discussed in the previous section, particularly exploring the generalization ability of the model for detecting different types of fruits at various growth stages.

Author Contributions

Z.L. contributed to the design of data collection, experimental design, completion of experiments, interpretation of results, and preparation of the manuscript. J.X. and M.C. contributed to the experimental work. X.L. and X.T. contributed to the writing of the manuscript. All authors have read and agreed to the published version of the manuscript.

Funding

This research was funded by the National Natural Science Foundation of China 32071912.

Data Availability Statement

The data presented in this study are available on request from the corresponding author. The data are not publicly available due to them also being necessary for future essay writing.

Conflicts of Interest

The authors declare no conflicts of interest.

References

  1. Aditya, R.; Sadia, S.; Rashiduzzaman, S.; Bonna, A.; Umme, S. A comprehensive guava leaves and fruits dataset for guava disease recognition. Data Brief 2022, 42, 108174. [Google Scholar] [CrossRef]
  2. Li, H.; Lee, W.S.; Wang, K. Identifying blueberry fruit of different growth stages using natural outdoor color images. Comput. Electron. Agric. 2014, 106, 91–101. [Google Scholar] [CrossRef]
  3. Li, P.; Lee, S.H.; Hsu, H.Y. Review on fruit harvesting method for potential use of automatic fruit harvesting systems. Procedia Eng. 2011, 23, 351–366. [Google Scholar] [CrossRef]
  4. Payne, A.B.; Walsh, K.B.; Subedi, P.P.; Jarvis, D. Estimation of mango crop yield using image analysis—Segmentation method. Comput. Electron. Agric. 2013, 91, 57–64. [Google Scholar] [CrossRef]
  5. Yamamoto, K.; Guo, W.; Yoshioka, Y.; Ninomiya, S. On plant detection of intact tomato fruits using image analysis and machine learning methods. Sensors 2014, 14, 12191–12206. [Google Scholar] [CrossRef]
  6. Dorj, U.O.; Lee, M.; Yun, S.S. An yield estimation in citrus orchards via fruit detection and counting using image processing. Comput. Electron. Agric. 2017, 140, 103–112. [Google Scholar] [CrossRef]
  7. Qureshi, W.S.; Payne, A.; Walsh, K.B.; Linker, R.; Cohen, O.; Dailey, M.N. Machine vision for counting fruit on mango tree canopies. Precis. Agric. 2017, 18, 224–244. [Google Scholar] [CrossRef]
  8. Malik, Z.; Ziauddin, S.; Shahid, A.R.; Safi, A. Detection and counting ofon-tree citrus fruit for crop yield estimation. Int. J. Adv. Comput. Sci. 2016, 7, 519–523. [Google Scholar] [CrossRef]
  9. Mehta, S.S.; Ton, C.; Asundi, S.; Burks, T.F. Multiple camera fruit localization using a particle filter. Comput. Electron. Agric. 2017, 142, 139–154. [Google Scholar] [CrossRef]
  10. Yasar, G.H.; Akdemir, B. Estimating yield for fruit trees using image processing and artificial neural network. Int. J. Adv. Agric. Environ. Engg IJAAEE 2017, 4, 8–11. [Google Scholar]
  11. Zhao, C.; Lee, W.S.; He, D. Immature green citrus detection based on colour feature and sum of absolute transformed difference (SATD) using colour images in the citrus grove. Comput. Electron. Agric. 2016, 124, 243–253. [Google Scholar] [CrossRef]
  12. Kamilaris, A.; Prenafeta-Boldu, F.X. Deep learning in agriculture: A survey. Comput. Electron. Agric. 2018, 147, 70–90. [Google Scholar] [CrossRef]
  13. Koirala, A.; Walsh, K.B.; Wang, Z.; McCarthy, G. Deep learning—Method overview and review of use for fruit detection and yield estimation. Comput. Electron. Agric. 2019, 162, 219–234. [Google Scholar] [CrossRef]
  14. Koirala, A.; Walsh, K.B.; Wang, Z.; McCarthy, C. Deep learning for real-time fruit detection and orchard fruit load estimation: Benchmarking of ‘MangoYOLO’. Precis. Agric. 2019, 20, 1107–1135. [Google Scholar] [CrossRef]
  15. Liang, C.; Xiong, J.; Zheng, Z.; Zhong, Z.; Li, Z.; Chen, S.; Yang, Z. A visual detection method for nighttime litchi fruits and fruiting stems. Comput. Electron. Agric. 2020, 169, 105192. [Google Scholar] [CrossRef]
  16. Ganesh, P.; Volle, K.; Burks, T.F.; Mehta, S.S. Deep orange: Mask R-CNN based orange detection and segmentation. IFAC PapersOnLine 2019, 52, 70–75. [Google Scholar] [CrossRef]
  17. Wan, S.; Goudos, S. Faster R-CNN for multi-class fruit detection using a robotic vision system. Comput. Netw. 2020, 168, 107036. [Google Scholar] [CrossRef]
  18. Tu, S.; Xue, Y.; Chan, Z.; Yu, Q.; Liang, M. Detection of passion fruits and maturity classification using red-green-blue depth images. Biosyst. Eng. 2018, 175, 156–167. [Google Scholar] [CrossRef]
  19. Tan, K.; Lee, W.; Gan, H.; Wang, S. Recognising blueberry fruit of different maturity using histogram oriented gradients and colour features in outdoor scenes. Biosyst. Eng. 2018, 176, 59–72. [Google Scholar] [CrossRef]
  20. Chen, S.; Xiong, J.; Jiao, J.; Xie, Z.; Huo, Z.; Hu, W. Citrus fruits maturity detection in natural environments based on convolutional neural networks and visual saliency map. Precis. Agric. 2022, 23, 1515–1531. [Google Scholar] [CrossRef]
  21. Kao, I.H.; Hsu, Y.W.; Yang, Y.Z.; Chen, Y.L.; Lai, Y.H.; Perng, J.W. Determination of lycopersicon maturity using convolutional autoencoders. Sci. Hortic. 2019, 256, 108538. [Google Scholar] [CrossRef]
  22. Wu, X.; Tang, R. Fast Detection of Passion Fruit with Multi-class Based on YOLOv3. In Proceedings of the 2020 Chinese Intelligent Systems Conference, Shenzhen, China, 24–25 October 2020; pp. 818–825. [Google Scholar] [CrossRef]
  23. Habaragamuwa, H.; Ogawa, Y.; Suzuki, T.; Shiigi, T.; Ono, M.; Kondo, N. Detecting greenhouse strawberries (mature and immature), using deep convolutional neural network. Eng. Agric. Environ. Food 2018, 11, 127–138. [Google Scholar] [CrossRef]
  24. Gao, F.; Fu, L.; Zhang, X.; Majeed, Y.; Zhang, Q. Multi-class fruit-on-plant detection for apple in snap system using faster r-cnn. Comput. Electron. Agric. 2020, 176, 105634. [Google Scholar] [CrossRef]
  25. Lv, J.; Xu, H.; Xu, L.; Zou, L.; Rong, H.; Yang, B.; Niu, L.; Ma, Z. Recognition of fruits and vegetables with similar-color background in natural environment: A survey. J. Field Robot. 2022, 39, 888–904. [Google Scholar] [CrossRef]
  26. Lin, G.; Tang, Y.; Zou, X.; Wang, C. Three-dimensional reconstruction of guava fruits and branches using instance segmentation and geometry analysis. Comput. Electron. Agric. 2021, 184, 106107. [Google Scholar] [CrossRef]
  27. Zhang, Q.; Chen, Q.; Xu, W.; Xu, L.; Lu, E. Prediction of Feed Quantity for Wheat Combine Harvester Based on Improved YOLOv5s and Weight of Single Wheat Plant without Stubble. Agriculture 2024, 14, 1251. [Google Scholar] [CrossRef]
  28. Hao, X.; Jia, J.; Gao, W.; Guo, X.; Zhang, W.; Zheng, L.; Wang, M. MFC-CNN: An automatic grading scheme for light stress levels of lettuce (Lactuca sativa L.) leaves. Comput. Electron. Agric. 2020, 179, 105847. [Google Scholar] [CrossRef]
  29. Krizhevsky, A.; Sutskever, I.; Hinton, G.E. ImageNet classification with deep convolutional neural networks. Commun. ACM 2017, 60, 84–90. [Google Scholar] [CrossRef]
  30. Girshick, R.; Donahue, J.; Darrell, T.; Malik, J. Rich feature hierarchies for accurate object detection and semantic segmentation. In Proceedings of the IEEE Conference on Computer Vision and Pattern Recognition (CVPR), Columbus, OH, USA, 23–28 June 2014; pp. 580–587. [Google Scholar] [CrossRef]
  31. Girshick, R. Fast R-CNN. In Proceedings of the IEEE International Conference on Computer Vision (ICCV), Santiago, Chile, 7–13 December 2015; pp. 1440–1448. [Google Scholar] [CrossRef]
  32. Ren, S.; He, K.; Girshick, R.; Sun, J. Faster r-cnn: Towards real-time object detection with region proposal networks. IEEE T. Pattern Anal. 2017, 39, 1137–1149. [Google Scholar] [CrossRef]
  33. Redmon, J.; Divvala, S.; Girshick, R.; Farhadi, A. You Only Look Once: Unified, Real-Time Object Detection. In Proceedings of the IEEE Conference on Computer Vision and Pattern Recognition (CVPR), Las Vegas, NV, USA, 26 June–1 July 2016; pp. 779–788. [Google Scholar] [CrossRef]
  34. Redmon, J.; Farhadi, A. YOLO9000: Better, Faster, Stronger. In Proceedings of the IEEE Conference on Computer Vision and Pattern Recognition (CVPR), Honolulu, HI, USA, 21–26 July 2017; pp. 6517–6525. [Google Scholar] [CrossRef]
  35. Redmon, J.; Farhadi, A. Yolov3: An incremental improvement. arXiv 2018, arXiv:1804.02767. [Google Scholar] [CrossRef]
  36. Jocher, G.; Chaurasia, A.; Stoken, A.; Borovec, J.; NanoCode012; Kwon, Y.; Michael, K.; Tao, X.; Fang, J.; Imyhxy; et al. Ultralytics. 2020. Available online: https://github.com/ultralytics/yolov5 (accessed on 9 November 2022).
  37. Bochkovskiy, A.; Wang, C.Y.; Liao, H. Yolov4: Optimal speed and accuracy of object detection. arXiv 2020, arXiv:2004.10934. [Google Scholar] [CrossRef]
  38. Huang, X.; Wang, X.; Lv, W.; Bai, X.; Yoshie, O. PP-YOLOv2: A practical object detector. arXiv 2021, arXiv:2104.10419. [Google Scholar] [CrossRef]
  39. Long, X.; Deng, K.; Wang, G.; Zhang, Y.; Wen, S. PP-YOLO: An effective and efficient implementation of object detector. arXiv 2020, arXiv:2007.12099. [Google Scholar] [CrossRef]
  40. Li, C.; Li, L.; Geng, Y.; Jiang, H.; Cheng, M.; Zhang, B.; Ke, Z.; Xu, X.; Chu, X. Yolov6 v3.0: A full-scale reloading. arXiv 2023, arXiv:2301.05586. [Google Scholar] [CrossRef]
  41. Wang, C.; Bochkovskiy, A.; Liao, H. Yolov7: Trainable bag-of-freebies sets new state-of-the-art for real-time object detectors. In Proceedings of the IEEE Conference on Computer Vision and Pattern Recognition (CVPR), Vancouver, BC, Canada, 18–22 June 2023; pp. 7464–7475. [Google Scholar] [CrossRef]
  42. Rizwan, M.; Glenn, J. Ultralytics. 2023. Available online: https://github.com/ultralytics/ultralytics (accessed on 10 January 2023).
  43. Wang, C.; Yeh, I.; Liao, H. Yolov9: Learning what you want to learn using programmable gradient information. arXiv 2024, arXiv:2402.13616. [Google Scholar] [CrossRef]
  44. Wang, A.; Chen, H.; Liu, L.; Chen, K.; Lin, Z.; Han, J.; Ding, G. Yolov10: Real-time end-to-end object detection. arXiv 2024, arXiv:2405.14458. [Google Scholar] [CrossRef]
  45. Chen, H.; Wang, Y.; Guo, J.; Tao, D. Vanillanet: The power of minimalism in deep learning. arXiv 2023, arXiv:2305.12972. [Google Scholar] [CrossRef]
  46. Simonyan, K.; Zisserman, A. Very deep convolutional networks for large-scale image recognition. arXiv 2014, arXiv:1409.1556. [Google Scholar] [CrossRef]
  47. Yang, L.; Zhang, R.Y.; Li, L.; Xie, X. Simam: A simple, parameter-free attention module for convolutional neural networks. In Proceedings of the International Conference on Machine Learning, Online, 18–24 July 2021; pp. 11863–11874. Available online: https://proceedings.mlr.press/v139/yang21o (accessed on 6 July 2024).
  48. Zhao, Y.; Lv, W.; Xu, S.; Wei, J.; Wang, G.; Dang, Q.; Chen, J. Detrs beat yolos on real-time object detection. In Proceedings of the IEEE Conference on Computer Vision and Pattern Recognition (CVPR), Seattle, WA, USA, 17–21 June 2024; pp. 16965–16974. Available online: https://openaccess.thecvf.com/content/CVPR2024/html/Zhao_DETRs_Beat_YOLOs_on_Real-time_Object_Detection_CVPR_2024_paper.html (accessed on 6 July 2024).
Figure 1. Two detection and classification processes ((a) the fruits in the image were first detected and then classified; (b) detection and classification are conducted simultaneously).
Agronomy 14 01988 g001
Figure 2. Guava image ((a) large fruit, (b) small fruit).
Agronomy 14 01988 g002
Figure 3. Manual labeling. (The green boxes in the figure are manual labeling).
Agronomy 14 01988 g003
Figure 4. Guava images of different growth stages ((a) small fruit, (b) large fruit).
Agronomy 14 01988 g004
Figure 5. Model structure of YOLOv10n. (In the figure, Conv is basic convolution units, C2f is a module proposed by YOLOv8, PSA is partial self-attention (PSA), SPFF is spatial pyramid pooling module, SCDown is spatial-channel decoupled downsampling module, and CIB is compact inverted block).
Agronomy 14 01988 g005
Figure 6. Model structure of VanillaNet-6. (In the figure, the white cuboid is the picture and feature map, and the blue is the convolution; The pink represents the process by which the convolution generates the feature map).
Agronomy 14 01988 g006
Figure 7. Model structure of V-YOLO. (In the figure, Conv is basic convolution units, VanillaNet is VanillaNet units, C2f is a module proposed by YOLOv8, and SimAM is SimAM attention unit).
Agronomy 14 01988 g007
Figure 8. The image augmented results of one batch (the red box in the figure is the fruit label of the augmented image).
Agronomy 14 01988 g008
Figure 9. Confusion matrix. (In each figure, the vertical coordinate is the predicted result, and the horizontal coordinate is the true label. Each square in the figure represents the predicted result of different labels; for example, the square in the upper-right corner is the number large fruits of correctly predicted as large fruits).
Agronomy 14 01988 g009aAgronomy 14 01988 g009b
Figure 10. Detection results. (The red box in the figure shows the forecast results).
Agronomy 14 01988 g010
Table 1. The dataset of guava images.
TotalTraining SetVerification SetTest Set
Images of large fruit5103518178
Images of small fruit5804128286
Total1090763163164
Table 2. The results of the ablation test.
Modified PartParametersFLOPsFPSPRmAP
BackboneSimAMHead
×××2,695,1968.2 G62590.0%89.9%95.0%
××1,147,6844.1 G100089.1%89.0%93.7%
×1,147,6844.1 G100091.0%86.7%93.8%
1,165,1183.4 G166693.3%89.3%95.0%
Note: √ indicates that the section has been modified, × indicates that this section has not been modified.
Table 3. Performance comparison of different models.
ModelParametersFLOPsFPSPRmAP
YOLOv10n2,695,1968.2 G62590.0%89.9%95.0%
YOLOv10s8,036,50824.4 G40090.7%90.1%94.9%
YOLOv10m16,452,70063.4 G19289.9%90.4%93.6%
YOLOv10b20,414,23697.9 G14992.8%87.4%94.2%
YOLOv10l25,719,452126.3 G12290.7%87.9%93.9%
YOLOv10x31,587,932169.8 G79.91.6%88.0%94.1%
RT-DETR-l31,987,850103.4 G13587.6%85.1%91.6%
RT-DETR-R5041,938,794125.6 G11484.4%81.7%88.1%
RT-DETR-R10160,904,810186.2 G7587.0%85.9%91.2%
RT-DETR-x65,471,546222.5 G8383.9%86.0%90.6%
V-YOLO1,165,1183.4 G166693.3%89.3%95.0%
Disclaimer/Publisher’s Note: The statements, opinions and data contained in all publications are solely those of the individual author(s) and contributor(s) and not of MDPI and/or the editor(s). MDPI and/or the editor(s) disclaim responsibility for any injury to people or property resulting from any ideas, methods, instructions or products referred to in the content.

