Article

Design and Development of a Side Spray Device for UAVs to Improve Spray Coverage in Obstacle Neighborhoods

1
College of Mechanical Engineering, Anhui Science and Technology University, Chuzhou 233100, China
2
Key Laboratory of Plant Protection Engineering, Ministry of Agriculture and Rural Affairs, Jiangsu University, Zhenjiang 212013, China
3
Key Laboratory of Modern Agricultural Equipment and Technology, Ministry of Education, Jiangsu University, Zhenjiang 212013, China
*
Author to whom correspondence should be addressed.
Agronomy 2024, 14(9), 2002; https://doi.org/10.3390/agronomy14092002
Submission received: 6 July 2024 / Revised: 19 August 2024 / Accepted: 30 August 2024 / Published: 2 September 2024

Abstract

:
Electric multirotor plant protection unmanned aerial vehicles (UAVs) are widely used in China for efficient and precise plant protection at low altitude for low volumes. Unstructured farmland in China has various types of obstacles, and UAVs usually use a detour path to avoid obstacles due to flight altitude limitations. However, existing UAV spray systems do not spray when in obstacle neighborhoods during obstacle avoidance, resulting in insufficient droplet coverage and reduced plant protection quality in the area. To improve the droplet coverage in obstacle neighborhoods, this article carries out a study of side spray technology with an electric quadrotor UAV, and proposes the design and development of a side spray device. The relationship between the obstacle avoidance path of the UAV and the spray pattern of the side spray device and their effect on droplet coverage in obstacle neighborhoods was explored. An accurate measurement method of the relative position between the UAV and obstacles was proposed. Spray angle calculations and nozzle selection for the side spray device were carried out in conjunction with the relative position. A rotor wind field simulation model was designed based on the lattice Boltzmann method (LBM), and the spatial layout of the side spray device on the UAV was designed based on the simulation results. To explore suitable spray patterns for the side spray device, comparative experiments of droplet coverage in obstacle neighborhoods were carried out under different environments, spray patterns, and flight parameter combinations. The relationship between the flight parameter combinations and the distribution uniformity of droplets and the effective swath width of the side spray device was explored. The experimental results were analyzed by an analysis of variance (ANOVA) and a relationship model was obtained. The results showed that the side spray device can effectively improve droplet coverage in obstacle neighborhoods compared to a device without side spray using the same flight parameter combinations. The effective swath width in obstacle neighborhoods can be increased by a minimum of 6.35%, maximum of 35.32%, and average of 15.25% using the side spray device. The error between the predicted values of the relational model and the field experiment results was less than 15%. The results verify the effectiveness and rationality of the method proposed in this article. This study can provide technical and theoretical references for improving the plant protection quality of UAVs in obstacle environments.

1. Introduction

Efficient and precise spraying by plant protection unmanned aerial vehicle (UAVs) is an effective means of controlling diseases, insects, and weeds. More than 95% of agricultural aviation technology is used for plant protection in China [1,2,3], and dominated by electric multirotor, low-altitude (2–10 m), and low-volume (7.5–15 L/ha) UAVs [4]. The distinctive features of unstructured farmland in China include complex low-altitude environments and a random distribution of micro-obstacles (inclined cable, power lines, etc.), small and medium obstacles (tree, telegraph pole, etc.), large obstacles (shelter forest, high-pressure tower, etc.), and non-fixed or vision-distorting obstacles (bird, pond, etc.) [5].
It is worth noting that most of the obstacles in Chinese unstructured farmland are micro, small, and medium obstacles [6]. Facing such obstacles, the traditional method was to mark the position of the obstacles manually in the field in advance, which has high time and personnel costs with low operation efficiency. In order to achieve a safe and efficient spraying operation for UAVs under micro-obstacles or small and medium obstacles, scholars have conducted lots of research on obstacle avoidance and spraying [7,8,9].
Research on obstacle avoidance for UAVs can be divided into two main aspects: obstacle detection and obstacle avoidance algorithms. Some common sensors, such as light detection and ranging (LIDAR) [10] and millimeter-wave radar [11], have been widely used on UAVs to detect obstacles. In addition, monocular cameras have also been commonly used on UAVs, and, combined with image processing techniques, can achieve UAV localization in space [12]. In recent years, deep learning has shown high performance in the field of obstacle detection and obstacle avoidance path planning [13,14,15].
For UAV spraying, scholars have mainly performed theoretical analysis and laboratory and field trials. Zhang et al. [16] utilized a 3D wind field measurement system and found that the flight speed and altitude of an electric four-rotor UAV significantly affected the rotor wind field distribution in the crop canopy. Tang et al. [17,18] obtained the unmanned helicopter rotor wind field and droplet motion based on the lattice Boltzmann method (LBM) and particle image velocimetry (PIV) technique, the results showed that the wind field distribution range, droplet deposition uniformity, and deposition amount were closely related to the flight altitude. Xue et al. [19] compared plant protection UAV spraying with conventional spraying and found that the droplets possessed a stronger ability to penetrate the crop canopy under the effect of rotor wind field downforce. Wang et al. [20] explored a relationship model between the droplet deposition characteristics of a UAV and different factors such as nozzle type, flight speed, and spray adjuvant in a wind tunnel. The results showed that both nozzle type and size had an obvious impact on the spray drift potential by affecting droplet size and the ratio of fine droplets; the flight speed and spray additives had a significant effect on spray drift. Liang et al. [21] explored a wind-stressed droplet deposition distribution model based on a bimodal distribution, and clarified the effects of different crosswind intensities, spray altitude, and spray pressures on the droplet deposition distribution. Kharim et al. [22] carried out research on organic liquid fertilizer spraying by UAVs with different flight speeds and spray volumes in rice fields; they found that the droplet deposition density was directly proportional to the spray volume and the droplet uniformity was directly affected by the flight speed. Chen et al. [23] explored the influence of the flight speed and altitude of an electric single-rotor UAV on the distribution of droplet deposition in a rice canopy, and found that the flight altitude and speed significantly affected the average droplet deposition, while the effect on the droplet distribution uniformity was insignificant. Zhang et al. [24] found that citrus tree shape and flight altitude significantly affected the droplet deposition of a quadrotor UAV, with better droplet deposition at a 1 m flight altitude on a heart-shaped canopy.
In summary, scholars have carried out a lot of research on obstacle avoidance and spraying for UAVs, and remarkable achievements have been made. However, it was also found that UAVs usually use triangle-like or rectangle-like detours for obstacle avoidance due to constraints such as economic cost, control cost, and energy consumption [5,25]. The distance from UAVs to obstacles is typically 2–5 m, and there are not enough droplets to completely cover the obstacle neighborhoods [5,6]. This results in insufficient droplet coverage in the area and requires manual supplemental spray application to ensure acceptable plant protection quality. Moreover, there are few studies on improving droplet coverage of UAVs in obstacle neighborhoods during obstacle avoidance [26,27,28].
In order to improve droplet coverage in obstacle neighborhoods during obstacle avoidance by UAVs, this article carries out the design and development of a side spray device specific to this area. The study mainly includes exploring the relationship between droplet coverage in the obstacle neighborhoods and both the obstacle avoidance path of the UAV and spray pattern of the side spray device. The spray angle calculations and nozzle selection of the side spray device were carried out in combination with the relative position between the UAV and obstacles during obstacle avoidance. A rotor wind field simulation model of the UAV is proposed based on the LBM. And the spatial layout design of the side spray device on the UAV is carried out based on the rotor wind field distribution obtained from the simulation model. A regression model and the linear relationship between the droplet coverage uniformity and effective spray width of the side spray device in the obstacle neighborhoods and the flight altitude, speed, and interaction between the two were explored. This article aims to further improve the droplet deposition, pesticide utilization rate, and operational effectiveness of UAVs operating in obstacle environments, and to provide new ideas for improving pesticide application using a UAV.

2. Materials and Methods

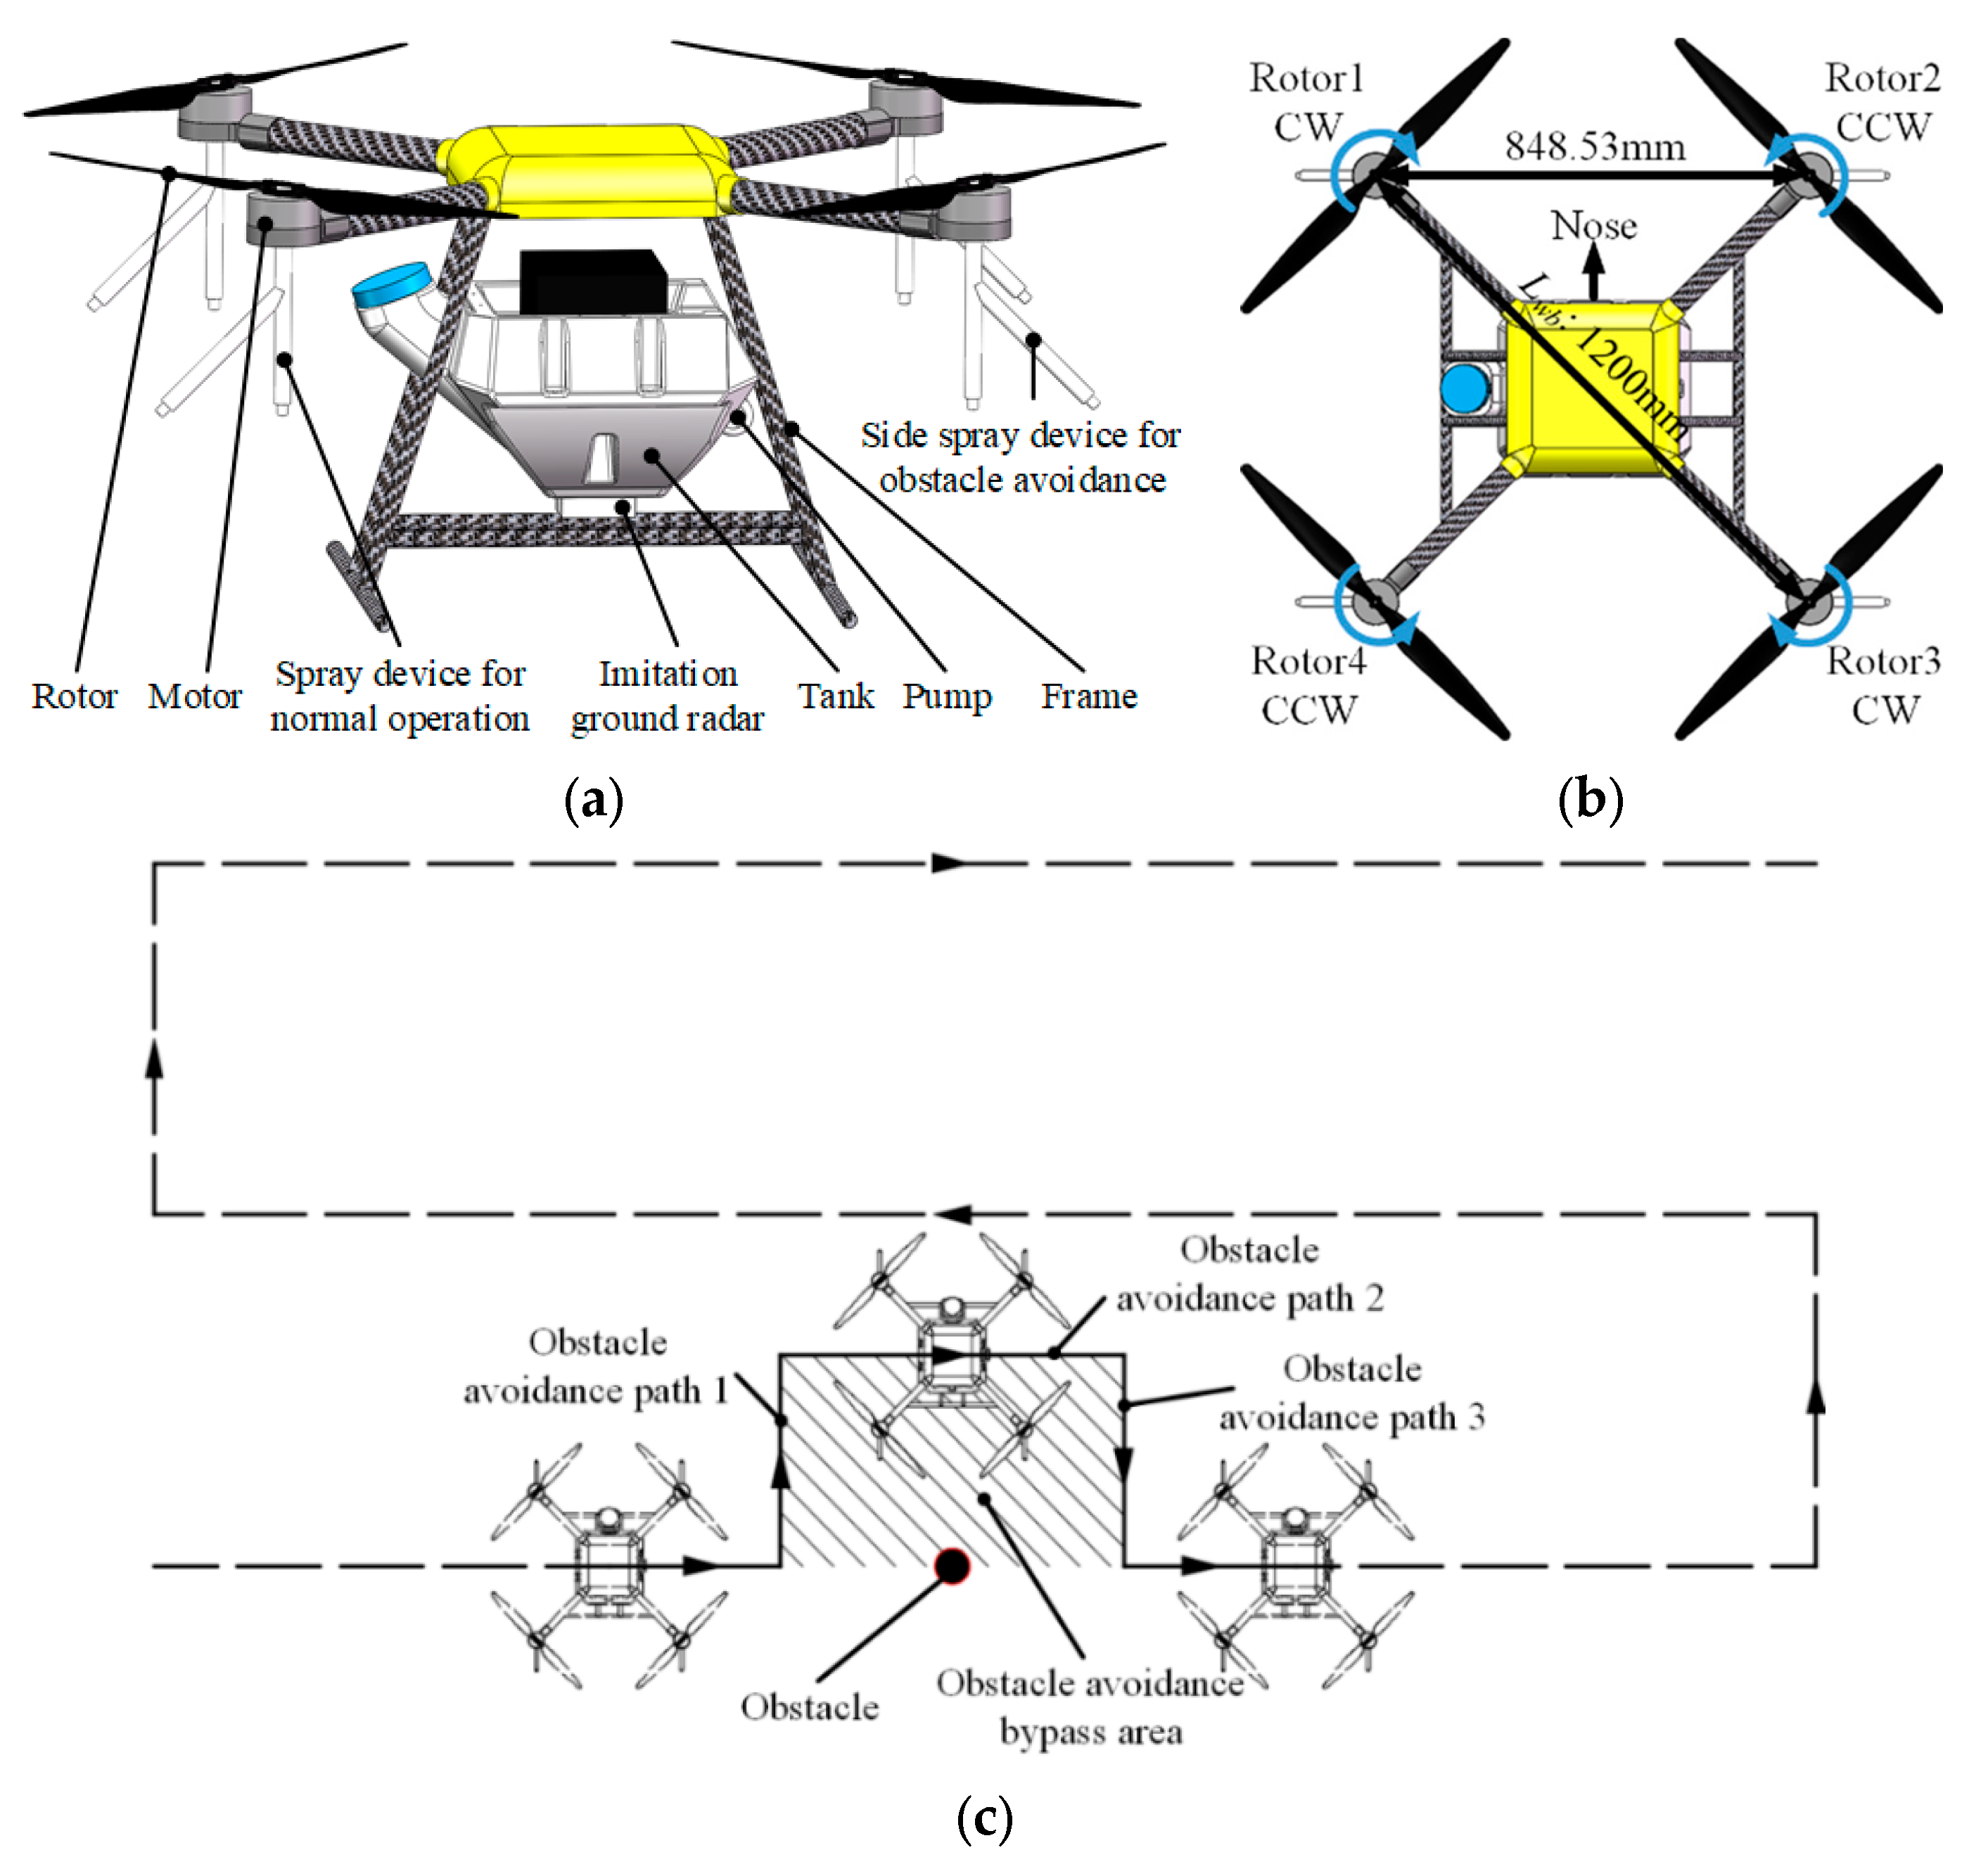
2.1. Side Spray Device Structure and Working Principle

As shown in Figure 1a, the UAV used in this article is an X-type frame with 1200 mm diagonal wheelbase and assembled by Jiangsu University. The components used to assemble the UAV include the motor (Hobbywing-X8, Shenzhen Hobbywing Technology Co., Ltd., Shenzhen, China), rotor (Hobbywing-736.6 mm, Shenzhen Hobbywing Technology Co., Ltd., Shenzhen, China), flight controller (JIYI K++, Shanghai JIYI Robot Co., Ltd., Shanghai, China), and nozzle (Lechler-TR60, Lechler GmbH, Metzingen, Germany). And, the pesticide tank, carbon-fiber airframe, and other components were all manufactured by the JSUAV company (Jiangsu JSUAV Intelligent Technology Co., Ltd., Zhenjiang, China). The UAV was equipped with a spray device for normal flight operation and side spray devices mounted on both sides of the airframe for increasing droplet coverage in obstacle neighborhoods during obstacle avoidance. The UAV parameters are shown in Table 1.
As shown in Figure 1c, the dashed line shows the operation path of the UAV. When there no obstacles in the operation path, it does not need obstacle avoidance, it just runs the spray device for normal flight operation. When there are obstacles in the field and located on the operation path, the UAV enters obstacle avoidance flight mode. The obstacle avoidance paths are shown as solid lines in Figure 1c; the paths are divided into path 1, that moves vertically away from the operation path; path 2, that moves forward; and path 3, that returns vertically to the operation path.
In order to avoid the re-spray effect of the droplets from the side spray device on the droplet coverage of the normal operation spray device, the synergistic spray pattern of the side spray device and normal operation spray device on obstacle avoidance paths 1, 2, and 3 is as follows. On paths 1 and 3, neither the side spray device nor the normal operation spray device spray; they spray at the same time only on path 2. And, on path 2, the nozzle near the obstacle is automatically selected for spraying, to ensure that the droplets are targeted toward the obstacle neighborhood and to reduce re-spray on the next operation path.
The detailed reasons for adopting this spray pattern for the side spray device and the study of different spray patterns are described in “Section 2.4”. The side spray device in this spray pattern allows for no spraying during normal flight to reduce re-spray, and starts spraying during obstacle avoidance to increase the droplet coverage in obstacle neighborhoods and reduce manual replenishment spraying.

2.2. UAV and Obstacle Relative Position Measurement Method

The spray angle of the nozzle used for the side spray device determines the droplet coverage under the same spray conditions (spray pressure, spray volume, and droplet size, etc.). A reasonable spray angle helps the side spray device to improve the droplet coverage in obstacle neighborhoods. Many factors affect the spray angle, such as flight altitude, speed, liquid type, and nozzle tip diameter, etc. Therefore, considerable work is required on the design and experimentation of the nozzle itself. Therefore, this method proposes a more convenient method of nozzle selection: it does not carry out the design of the nozzle itself, but simply considers the reasonable spray angle required for the side spray device and selects the appropriate nozzle based on the spray angle. As can be seen from Figure 2, the relative position of the UAV to the obstacle during obstacle avoidance determines the required spray angle of the side spray nozzle. Ideally, the relationship between the relative position and the spray angle can be calculated by Equation (1) [29,30].
θ = tan 1 D H D V
where θ is the spray angle in °; DH is the distance between the side spray nozzle and the obstacle when avoiding obstacles, in mm; and DV is the distance between the side spray nozzle and the ground when avoiding obstacles, in mm.
As can be seen from Equation (1), accurately obtaining the relative position between the UAV and obstacle can guide the calculation of the required spray angle of the side spray device and nozzle selection. With reference to our team’s previous research [31], this article proposes an accurate measurement method for the relative position of the UAV and obstacles based on the Leica AT960-LR laser tracker measurement system (Hexagon AB (Publ), Stockholm, Sweden). The parameters of the Leica AT960-LR laser tracker measurement system are as shown in Table 2.
According to Table 2, the maximum measurement distance of the Leica AT960-LR laser tracker measurement system is 160 m when working with the Leica 38.1 mm target ball, which meets the requirements for UAV flight path measurement in the relevant literature [32] and standard [33].
As shown in Figure 3, when measuring the relative position of the UAV and obstacle, the laser tracker used the instrument’s own coordinate system as the target coordinate system. The coordinate origin was at the center of the tracking head. The Z-axis was the normal direction of the horizontal dial. The zero-scale direction of the horizontal dial was established as the X-axis, and the Y-axis was determined by the right-hand rule. The three-dimensional coordinates of the UAV were calculated according to Equation (2).
x = L sin θ V cos θ H y = L sin θ V sin θ H z = L cos θ V
where L is the distance from the tracker to the center of the target ball; θH is the horizontal angle; θV is the vertical angle; and x, y, and z are the projection distances of the target ball on the tracker’s X, Y, and Z axes.
Studies have shown that the spray performance of UAVs (droplet deposition coverage, deposition distribution uniformity, etc.) is better when the flight speed is 1–3 m·s−1 and the flight altitude is 1–3 m during spraying [34,35,36,37]. Therefore, in the relative position measurement experiment between the UAV and an obstacle, a flight speed of 1–3 m·s−1 with a variation step of 1 m·s−1, and flight altitude of 1–3 m with variation step of 1 m, were used as the flight parameters. The detailed flight parameter combinations are as shown in Table 3.
Based on this, with reference to the standard [33] and our team’s previous research [31], the method for the relative position measurement of the UAV and obstacle was as follows.
(1)
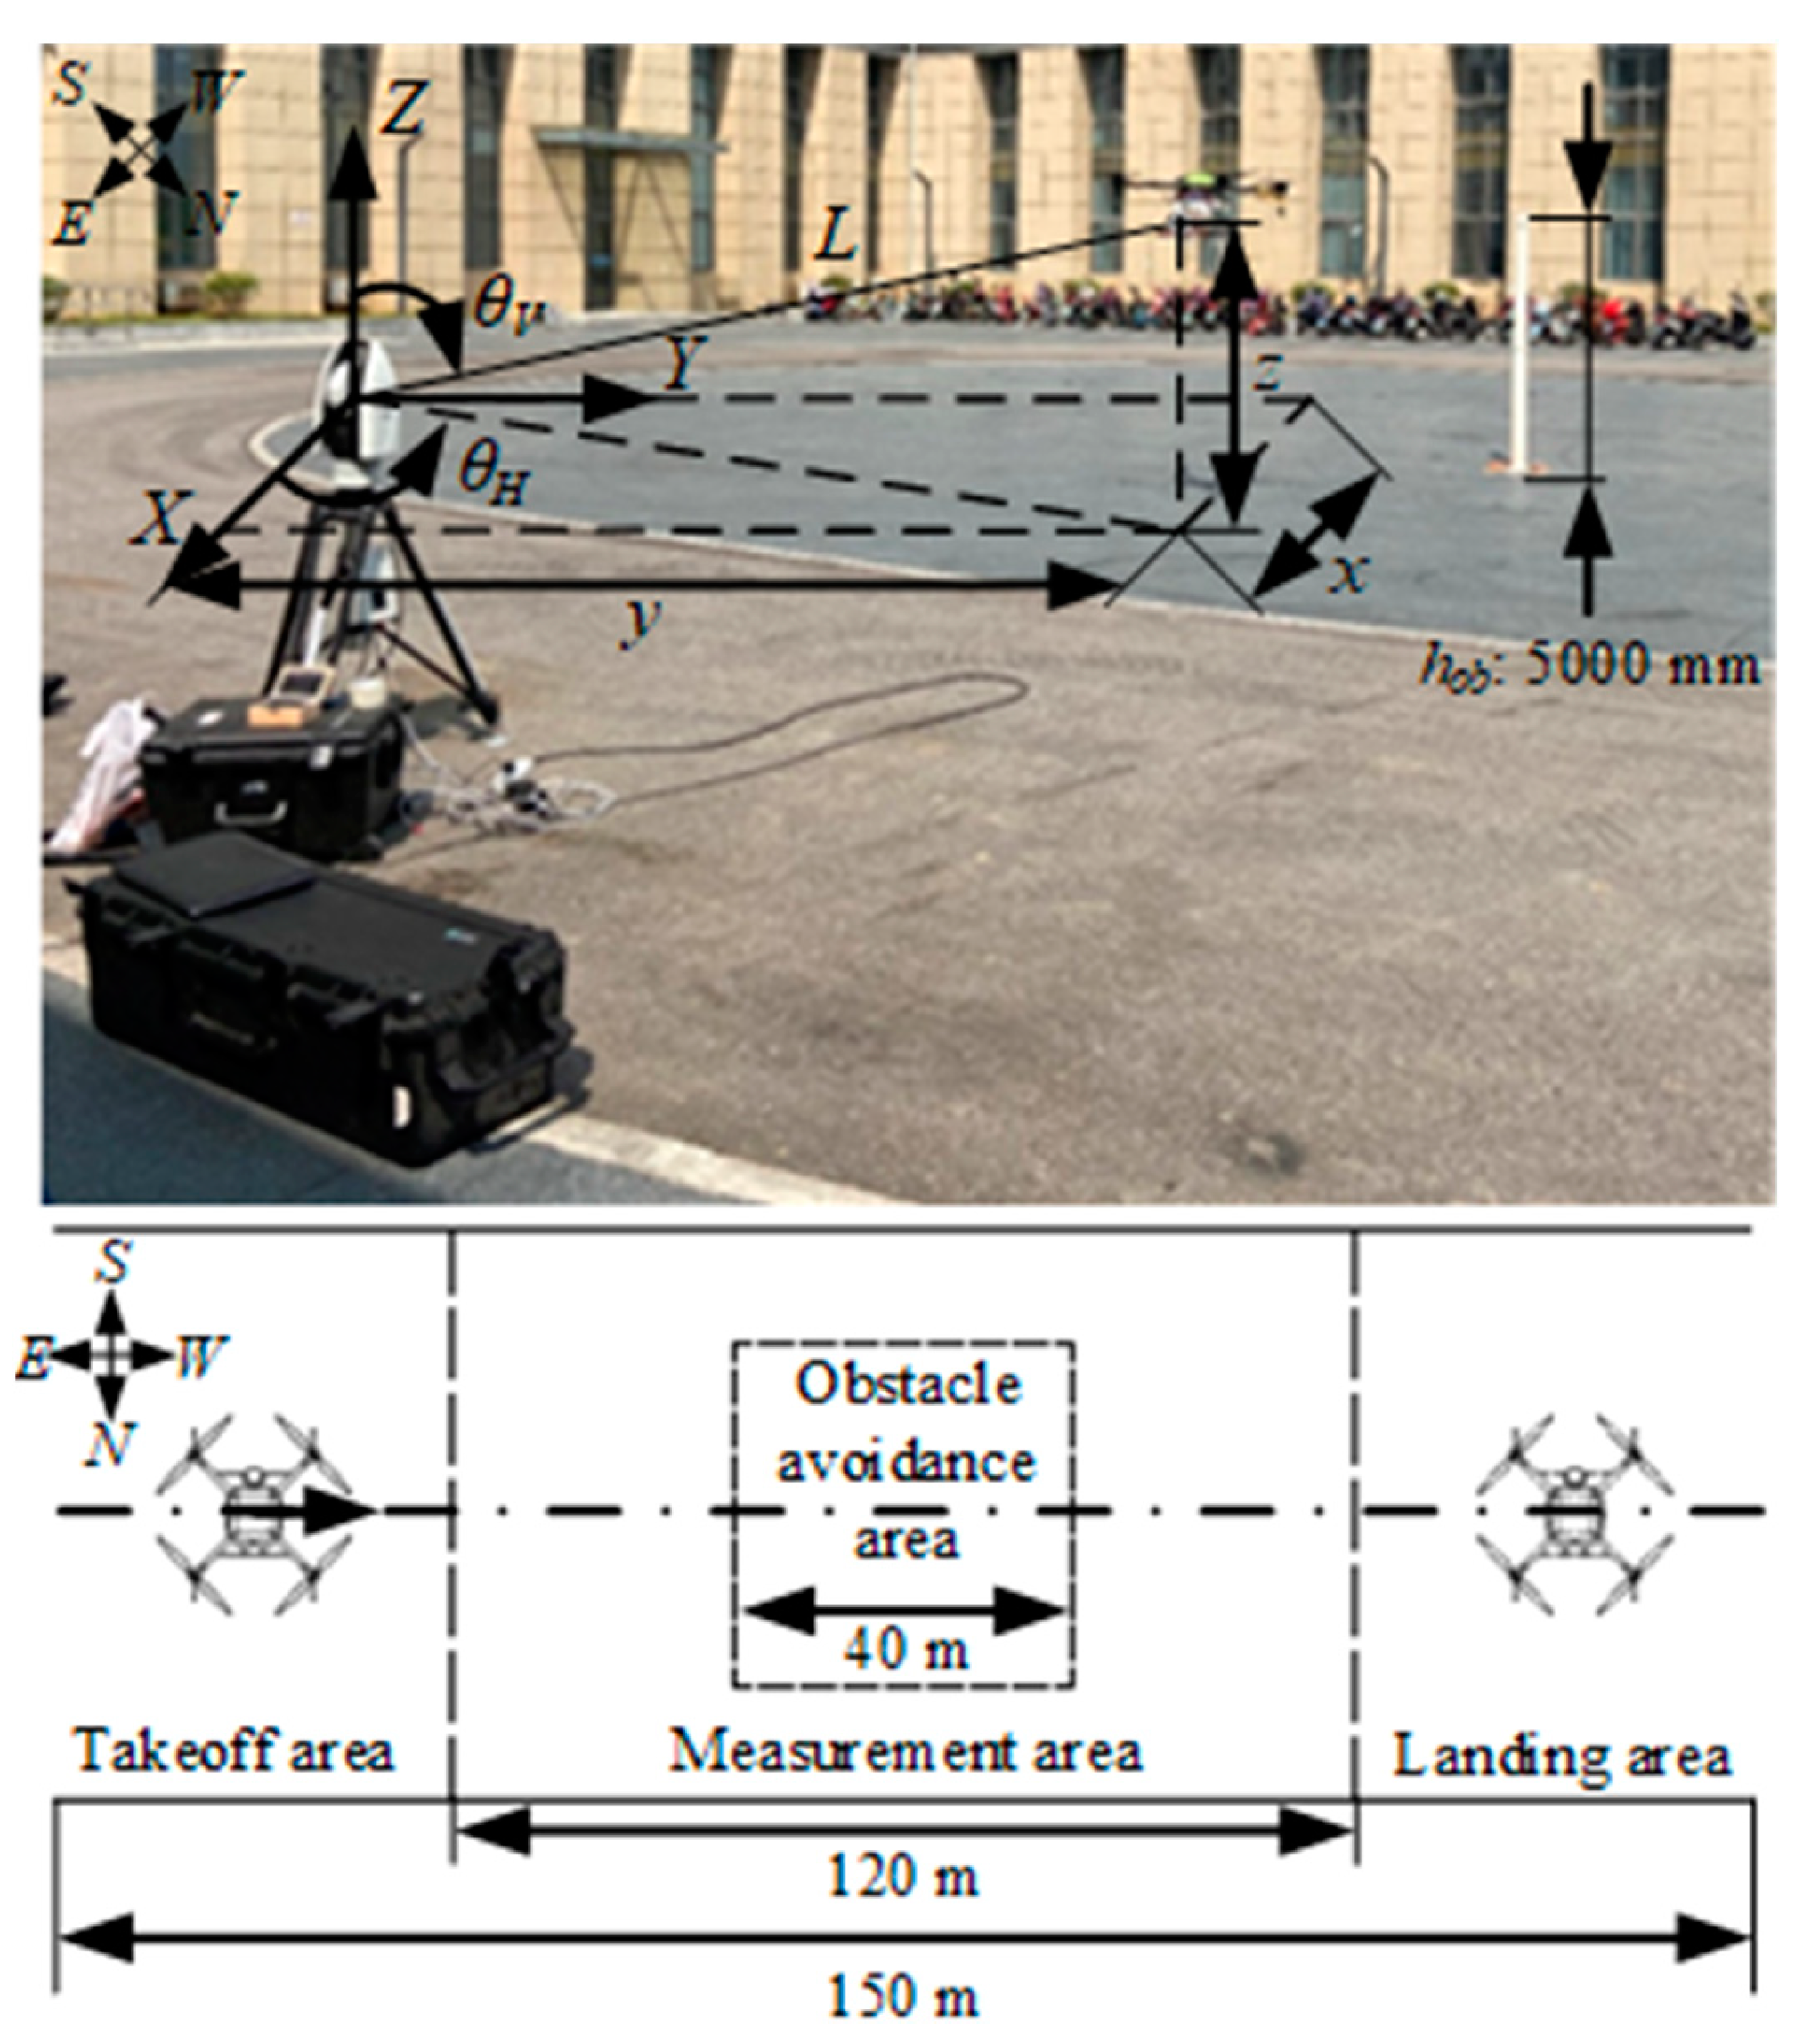
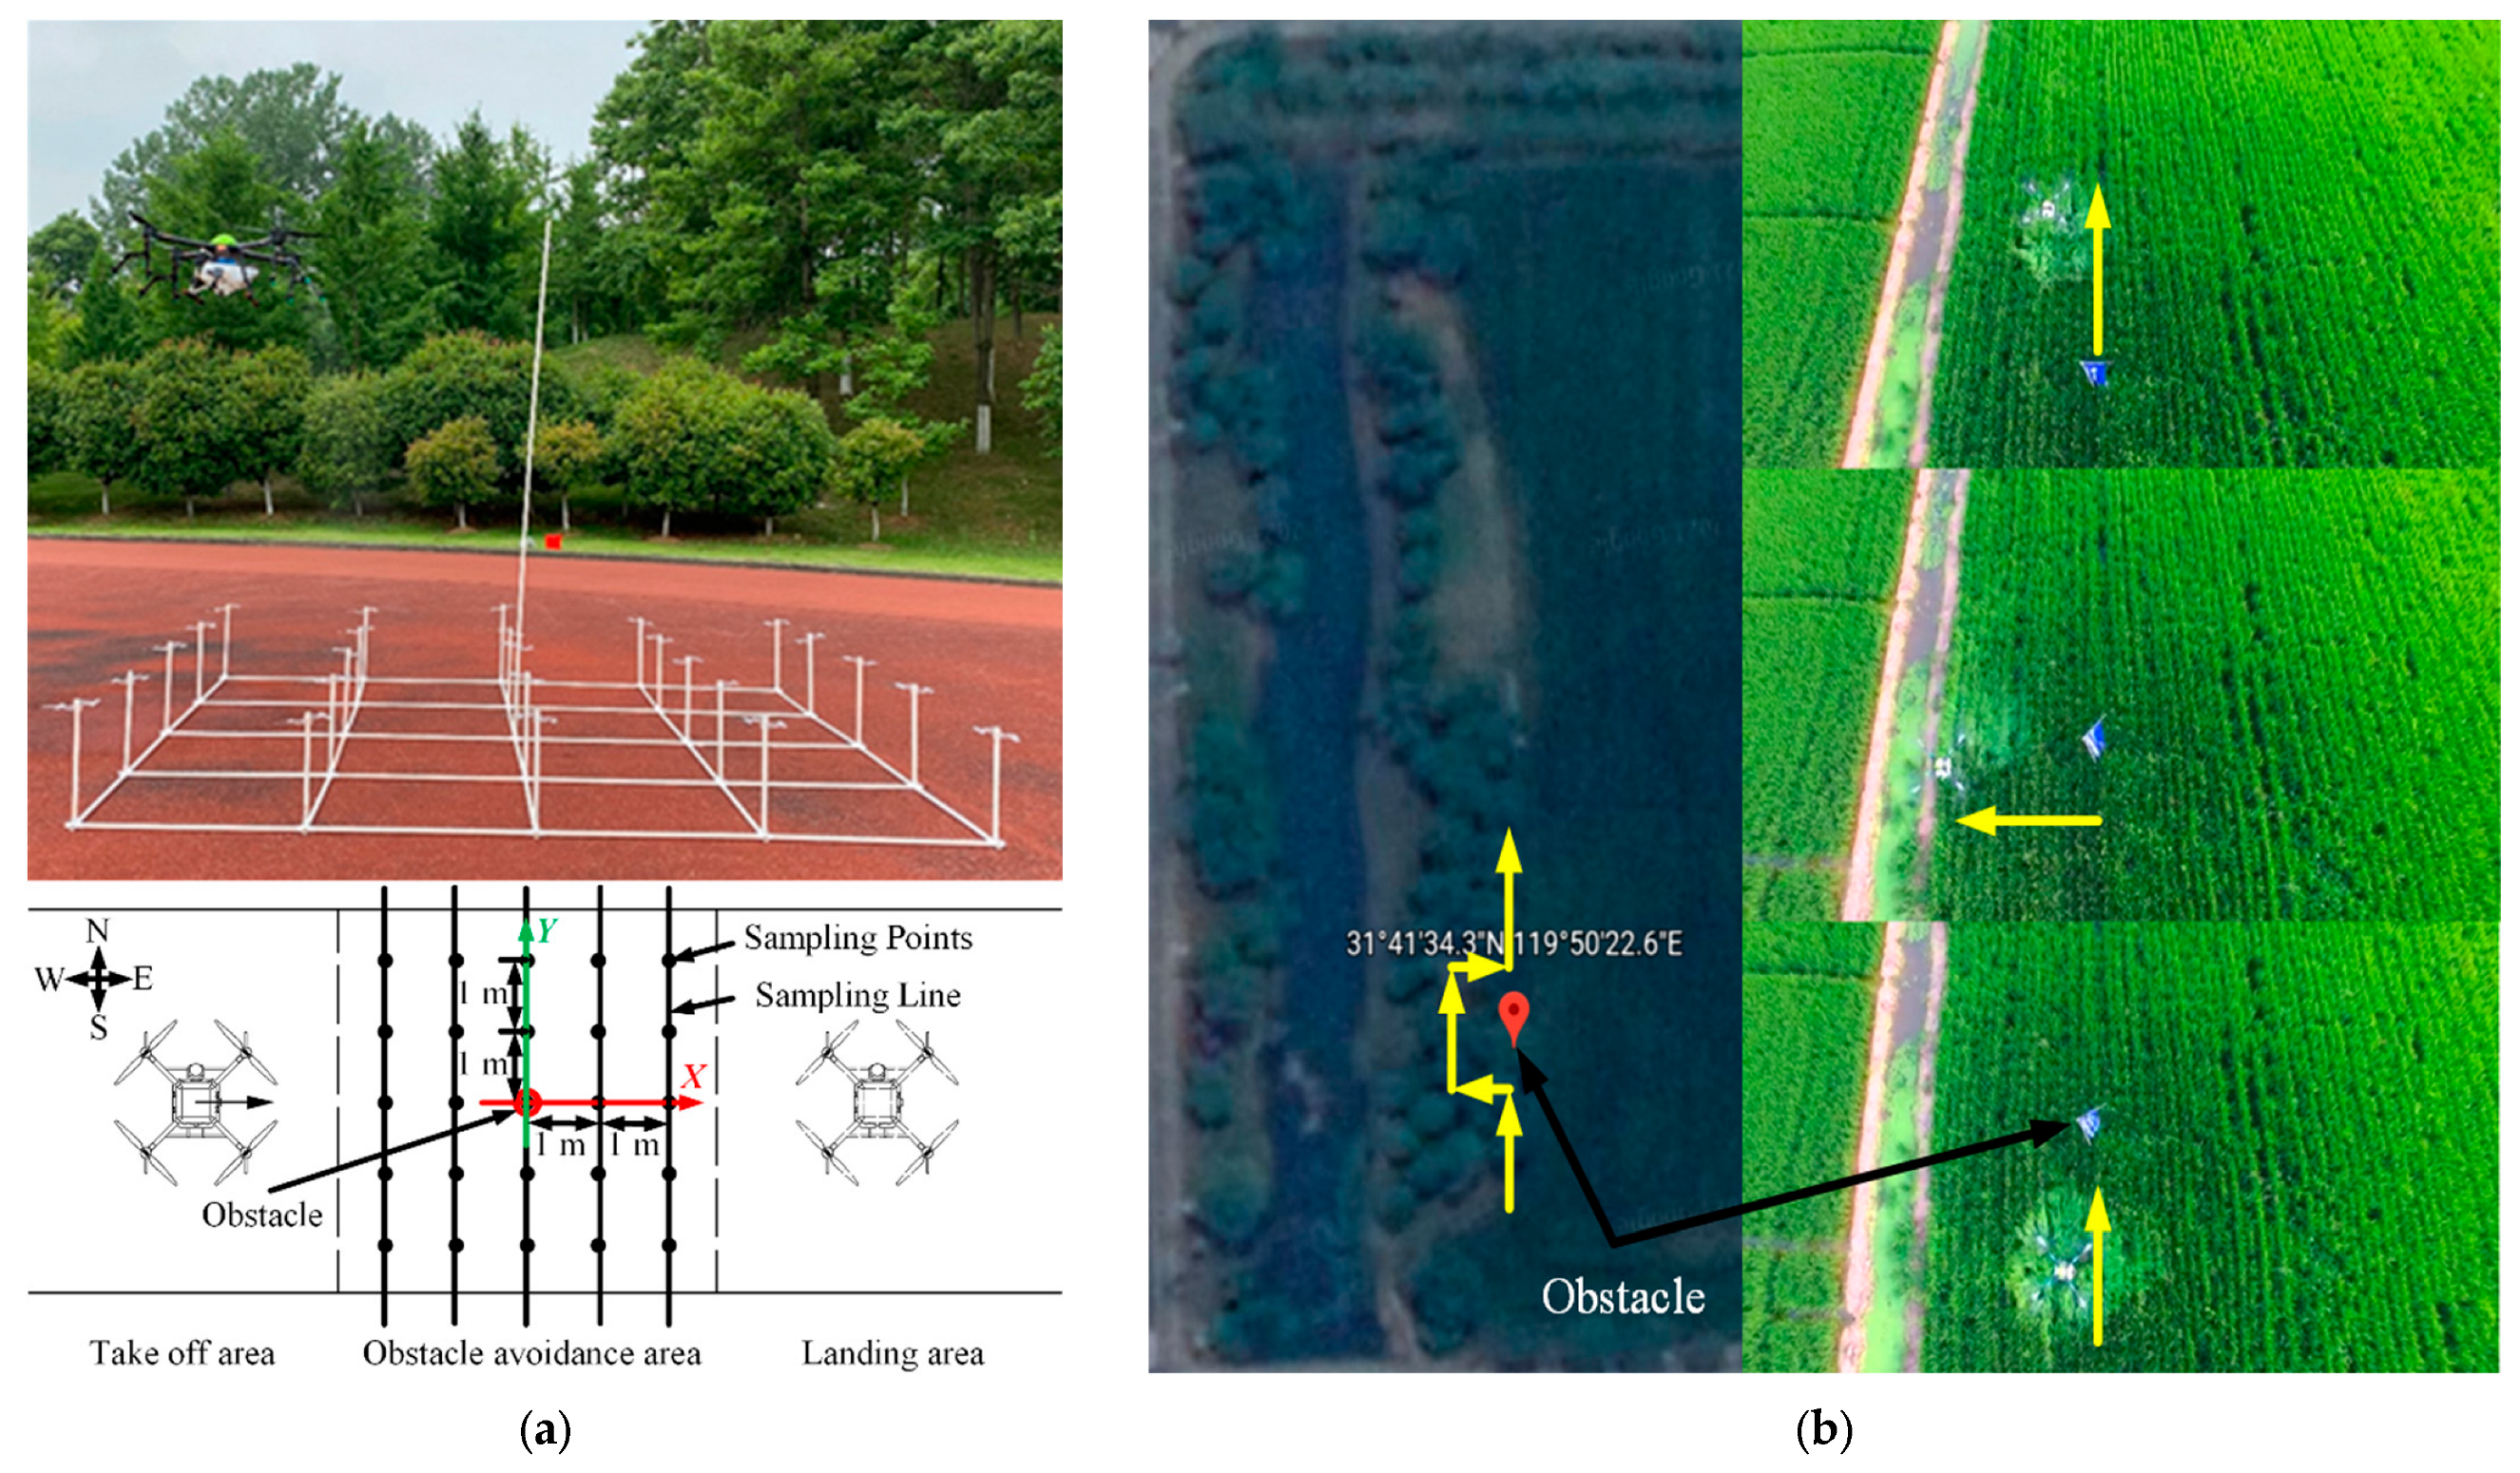
As shown in Figure 3, the relative position measurement experiment between the UAV and obstacle was conducted at Jiangsu University, Zhenjiang City, Jiangsu Province, China (32°12′25.1″ N, 119°30′53.8″ E). A rectangular area of 150 m × 10 m was selected in the east–west direction. Additionally, the area was divided into a takeoff area, a measurement area, and a landing area. The length of the measurement area was 120 m. A flat area of 25 m × 5 m in the measurement area was selected as the obstacle avoidance area. A cylindrical obstacle with a height of 5 m and diameter of 0.11 m was arranged in the center of the obstacle avoidance area.
(2)
The Leica AT960-LR laser tracker measurement system was placed on the east edge of the east–west central axis of the rectangular area. The top coordinate of the obstacle was measured using the single-point measurement mode of the laser tracker and repeating the measurement three times. The average coordinates (xob, yob, zob) were taken as the top coordinates of the obstacle.
(3)
The UAV was placed on the central axis of the rectangular area in the east–west direction, facing west and flying from east to west. The take-off point of the UAV was 1 m away from the laser tracker, and the Leica 38.1 mm target ball was installed on the tail of the UAV.
(4)
In order to avoid the measurement error caused by manual operation, this experiment adopts the UAV obstacle avoidance system researched by our team for autonomous flight [38]. The starting and ending points of the UAV autonomous flight route were set along the east–west central axis of the rectangular area. The distance between the two points was 150 m.
(5)
After the UAV had taken off and reached stabilized hover at the starting point, the UAV performed autonomous flight according to the flight parameter combinations in Table 3. At the same time, the Leica AT960 measurement system continuously recorded the coordinates of the UAV with a 1000 Hz sampling rate. After the UAV reached the ending point, the laser tracker stopped recording data. The laser light between the laser tracker and target ball must remain uninterrupted during the whole process. Otherwise, the UAV returns to the starting point and restarts the experiment.
(6)
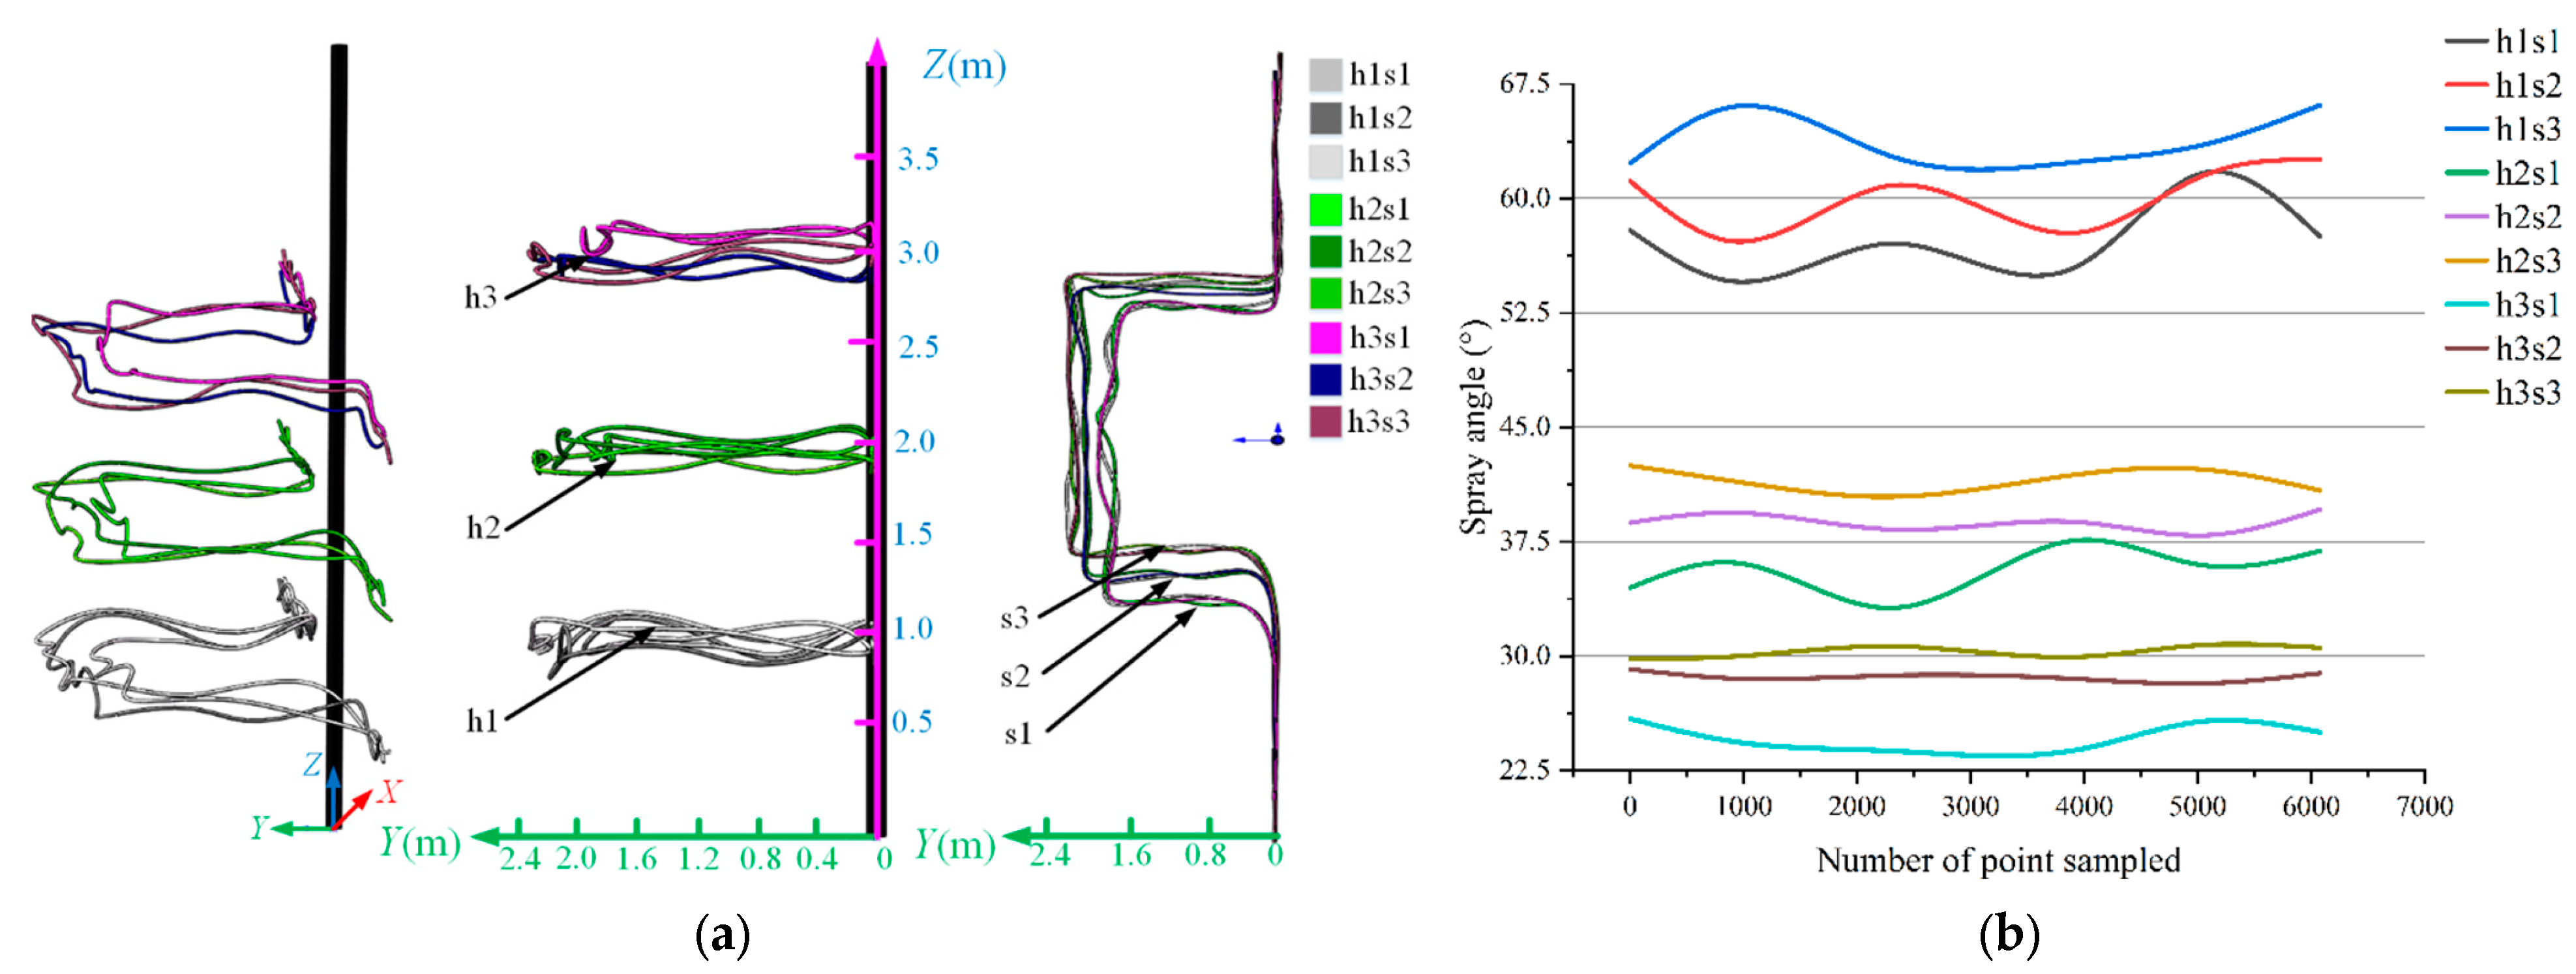
Each flight parameter combination was measured three times and the average coordinates (xu, yu, zu) were taken as the flight trajectory points of the UAV. The obstacle avoidance paths were drawn according to the coordinates (xob, yob, zob) and (xu, yu, zu) under different flight parameter combinations. The theoretical required spray angle of the side spray device can be calculated according to Equation (3).
θ = tan 1 D H D V D H = y o b y u L w b · cos 45 ° 2 D V = h o b z o b + z u
where Lwb is the diagonal wheelbase of the UAV in mm; and hob is the height of the cylindrical obstacle in mm.

2.3. Spatial Layout Method of Side Spray Device on UAV

Studies have shown that the rotor wind field perpendicular to the ground has a great influence on the spray performance of UAVs and has an inhibitory effect on droplet deposition [39,40,41]. The rotor wind field perpendicular to the ground directly promotes droplet deposition towards the target below, while the wind speed directly below the rotor is the highest, and thus, more droplets are deposited [42]. The horizontal-direction curling airflow of the rotor wind field makes the droplets spread laterally, and the closer to the wingtip, the more the airflow affects the lateral movement of droplets. This increases the swath width, but also increases the droplet drift risk [43].
In this article, the side spray device was mainly used to improve droplet coverage in the obstacle neighborhoods to the sides of the UAV, rather than the area directly below the UAV. Therefore, it was necessary to carry out the spatial layout design of the side spray device on the UAV. A reasonable spatial layout design can reduce the influence of the rotor wind field perpendicular to the ground on the side spray nozzle and increase the spreading effect of the rotor wind field in the horizontal direction on the droplets. The purpose is to obtain a reasonable increase in swath width to improve droplet coverage and deposition in the obstacle neighborhoods and to reduce the risk of re-spray and droplet drift.
Therefore, a rotor wind field simulation model of the UAV was established based on the LBM [18,44,45], and combined with Table 3 to simulate the rotor wind field for different flight parameter combinations. The simulation results were compared and analyzed with the indoor experiment results to evaluate the performance of the simulation model. Finally, the spatial layout design of the side spray device on the UAV was carried out by combining the simulation results of the validated rotor wind field simulation model.
The XFlow 2020 (Dassault Systèmes, Paris, France) used in this article can effectively perform numerical simulation of the UAV rotor wind field [18]. The simulation uses an AMD RYZEN R7-3700X CPU 3.6–4.4 GHz (Advanced Micro Devices, Inc., Santa Clara, CA, USA) server with 8 cores and 16 threads. The UAV rotor wind field is relatively complex, and a lot of irregular surfaces exist in the frame and rotor. In order to improve the computational efficiency, the numerical simulation model of the UAV rotor wind field makes the following assumptions. Air is an incompressible fluid; without considering air viscosity and temperature changes; assuming the UAV operation area as horizontal ground; and ignoring the effect of crops on the rotor wind field.
As shown in Figure 4, the UAV was modelled 1:1 with actual measurements using SolidWorks 2016 (Dassault Systèmes, Paris, France), and planes were used instead of curves to simplify the pesticide tank. For the rotors, reverse modeling was performed using an ATOS II/400 scanner (GOM GmbH, Braunschweig, Germany) with an accuracy of 0.1 mm·m−1 to reduce manual measurement errors.
The computational domain size for numerical simulation of the rotor wind field greatly affects the computational speed and results accuracy. Therefore, the computational domain size is set based on the measurement results of the relative position between the UAV and obstacle during obstacle avoidance in the following text. The height of the obstacle was 5 m, and the maximum distance between the UAV and the obstacle during obstacle avoidance was less than 2.4 m. This method only needs to focus on the rotor wind field spread in the obstacle neighborhoods. So, as shown in Figure 4, to ensure that the rotor wind field could spread to the obstacle neighborhoods and reduce the computational cost, the x, y, and z of the computational domain were set to 8 m, 5 m, and 8 m, respectively.
The X-axis and Z-axis of the UAV coincide with the X-axis and Z-axis of the computational domain. The distance between the origin of the UAV and the bottom of the computational domain was set to 3 m. The rotation direction of each rotor was defined separately as shown in Figure 1b. And, according to the flight parameters in Table 3, the rotor speed of the actual flight was imported into the simulation model from the flight log. The simulation boundary conditions are shown in Table 4 [34,46,47].
The computation speed and result accuracy are not only related to the computational domain size, but also to the computational domain mesh resolution. To accurately obtain the rotor wind field, the mesh resolution of the computational region needs to be refined. The discretization of the computational domain is shown in Figure 5; the resolution refinement focuses on the rotor, UAV frame, and rotor wind field. To save computational resources, the global mesh refinement resolution of the computational domain was set to 0.1 m, the UAV frame resolution to 0.025 m, and the rotor resolution to 0.0125 m. Adaptive mesh refinement (resolution of 0.00625 m) was used for wind field refinement.
In order to verify the accuracy of the numerical simulation of the UAV rotor wind field, the performance of the simulation model was evaluated by comparing the simulation results of the rotor wind speed perpendicular to the ground with the rotor wind field of the indoor experiment results.
As shown in Figure 6, to obtain the simulation results of the rotor wind speed perpendicular to the ground, the wind speed distribution in the Y-Z plane at X of 0.425 m was adopted. In the Y-Z plane, a total of 5 vertical sampling lines A, B, C, D, and E, were set up. The intersections of the sampling lines A, B, C, D, and E with the Y-axis were −0.85 m, −0.425 m, 0 m, 0.425 m, and 0.85 m, respectively. Six sampling points were set up on each sampling line. The vertical distance between each sampling point was 0.5 m and the vertical distance from the first sampling point to the rotor was 0.5 m.
For the indoor experiment of the rotor wind speed perpendicular to the ground, in order to avoid the influence of environmental wind, the indoor experiment platform of rotor wind speed was constructed according to Figure 7, including a bracket, UAV, control system, and Kestrel 4000 anemometer (Nielsen-Kellerman Company, Boothwyn, PA, USA).
The measurement method of the UAV rotor wind speed perpendicular to the ground is as follows.
(1)
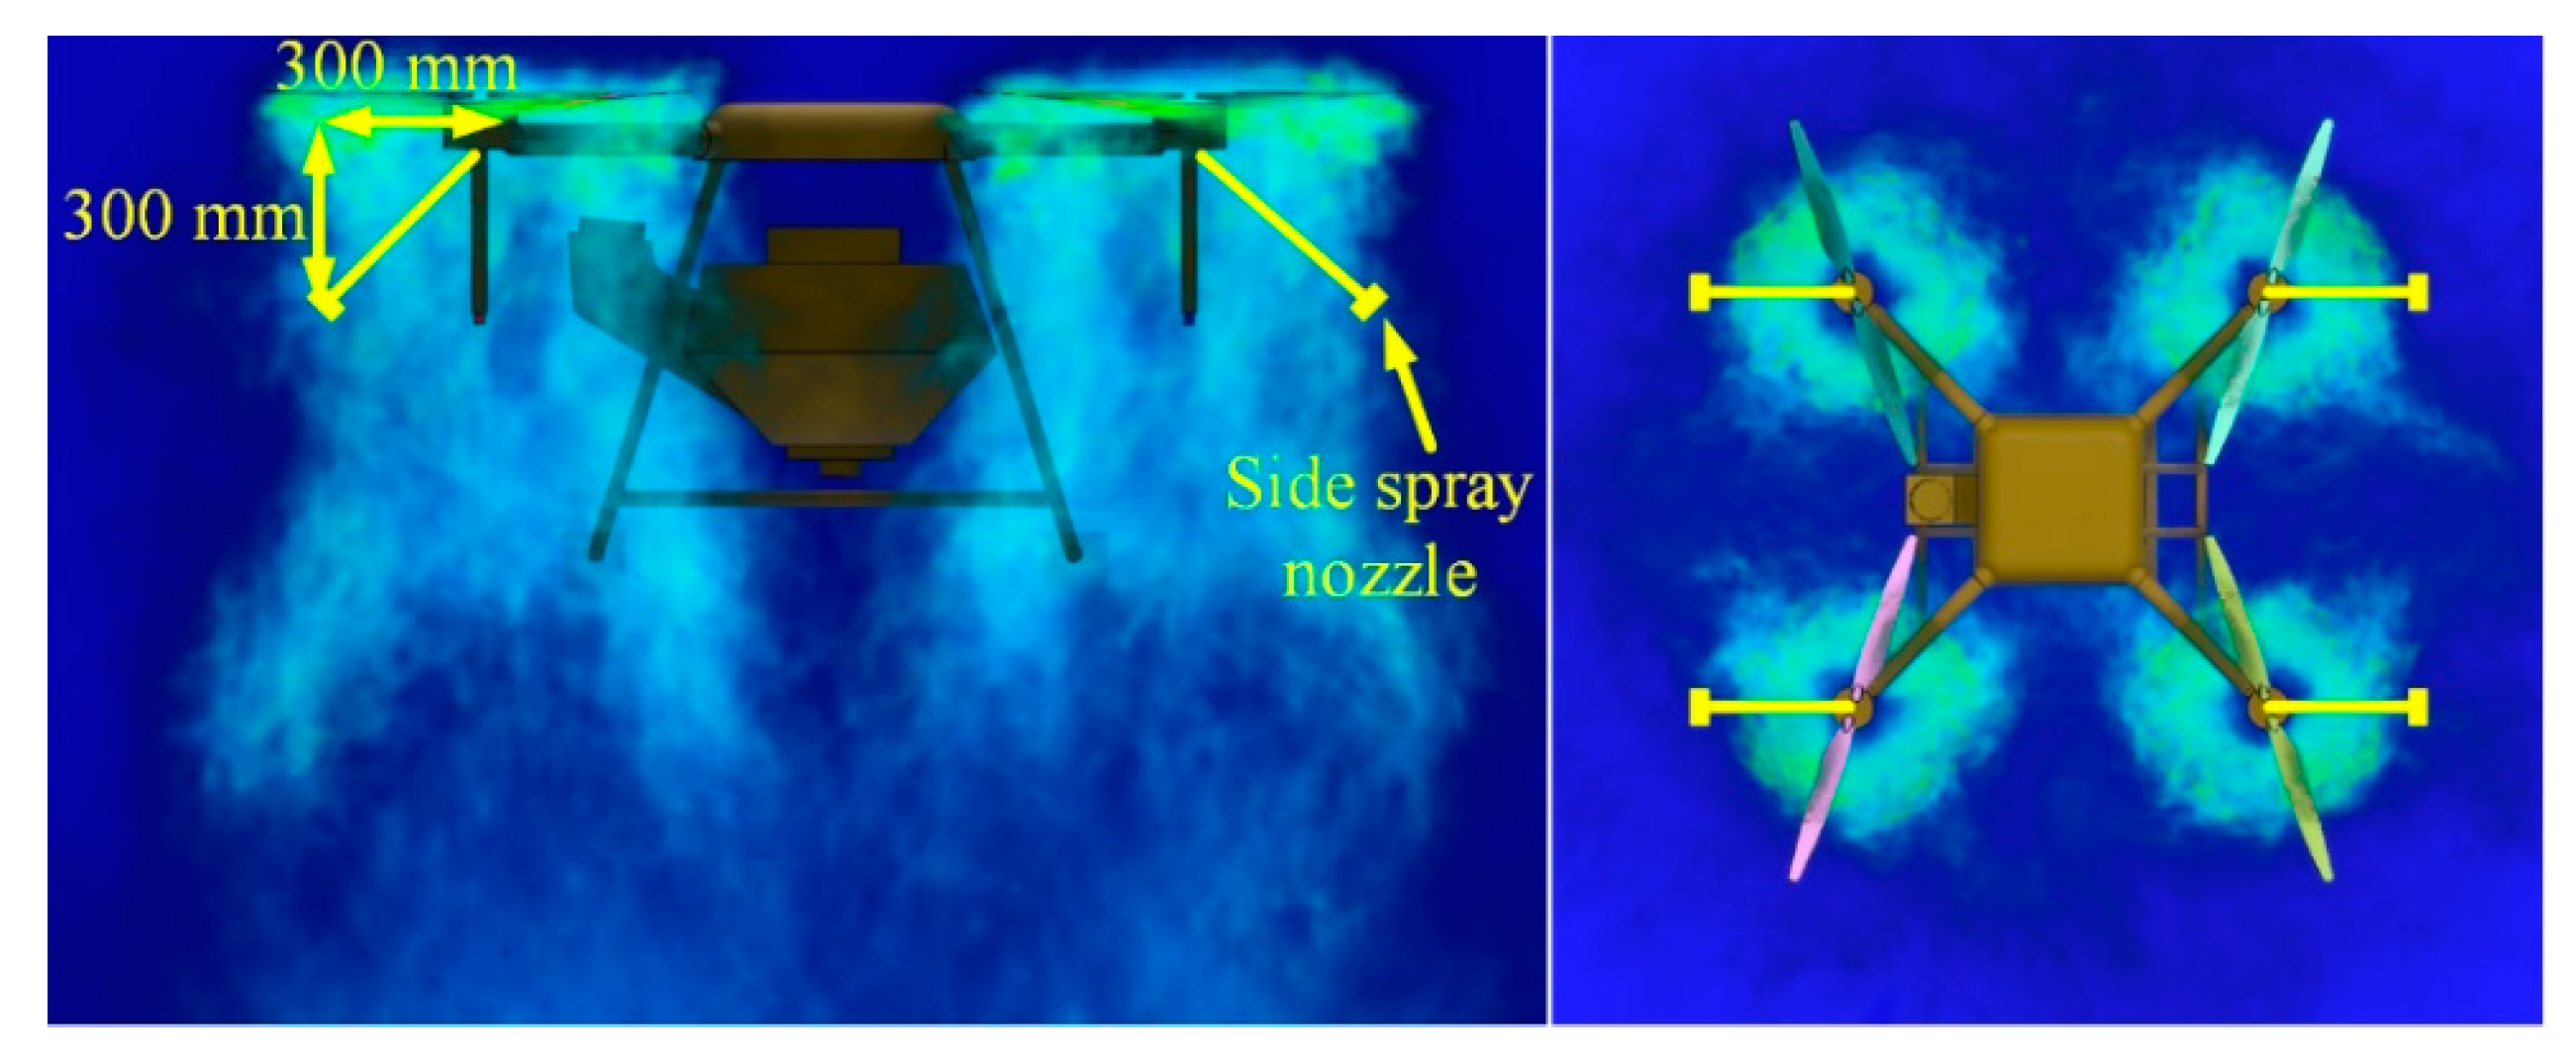
The rotor wind speed sampling points were arranged as shown in Figure 7a. The sampling points were set up in the form of 5 × 5 × 6 in the X, Y, and Z directions with 150 points. The horizontal distribution surface of the first sampling point was set 0.5 m vertically down from the rotor. Each two adjacent sampling points were spaced by 0.5 m vertically and 0.425 m horizontally.
(2)
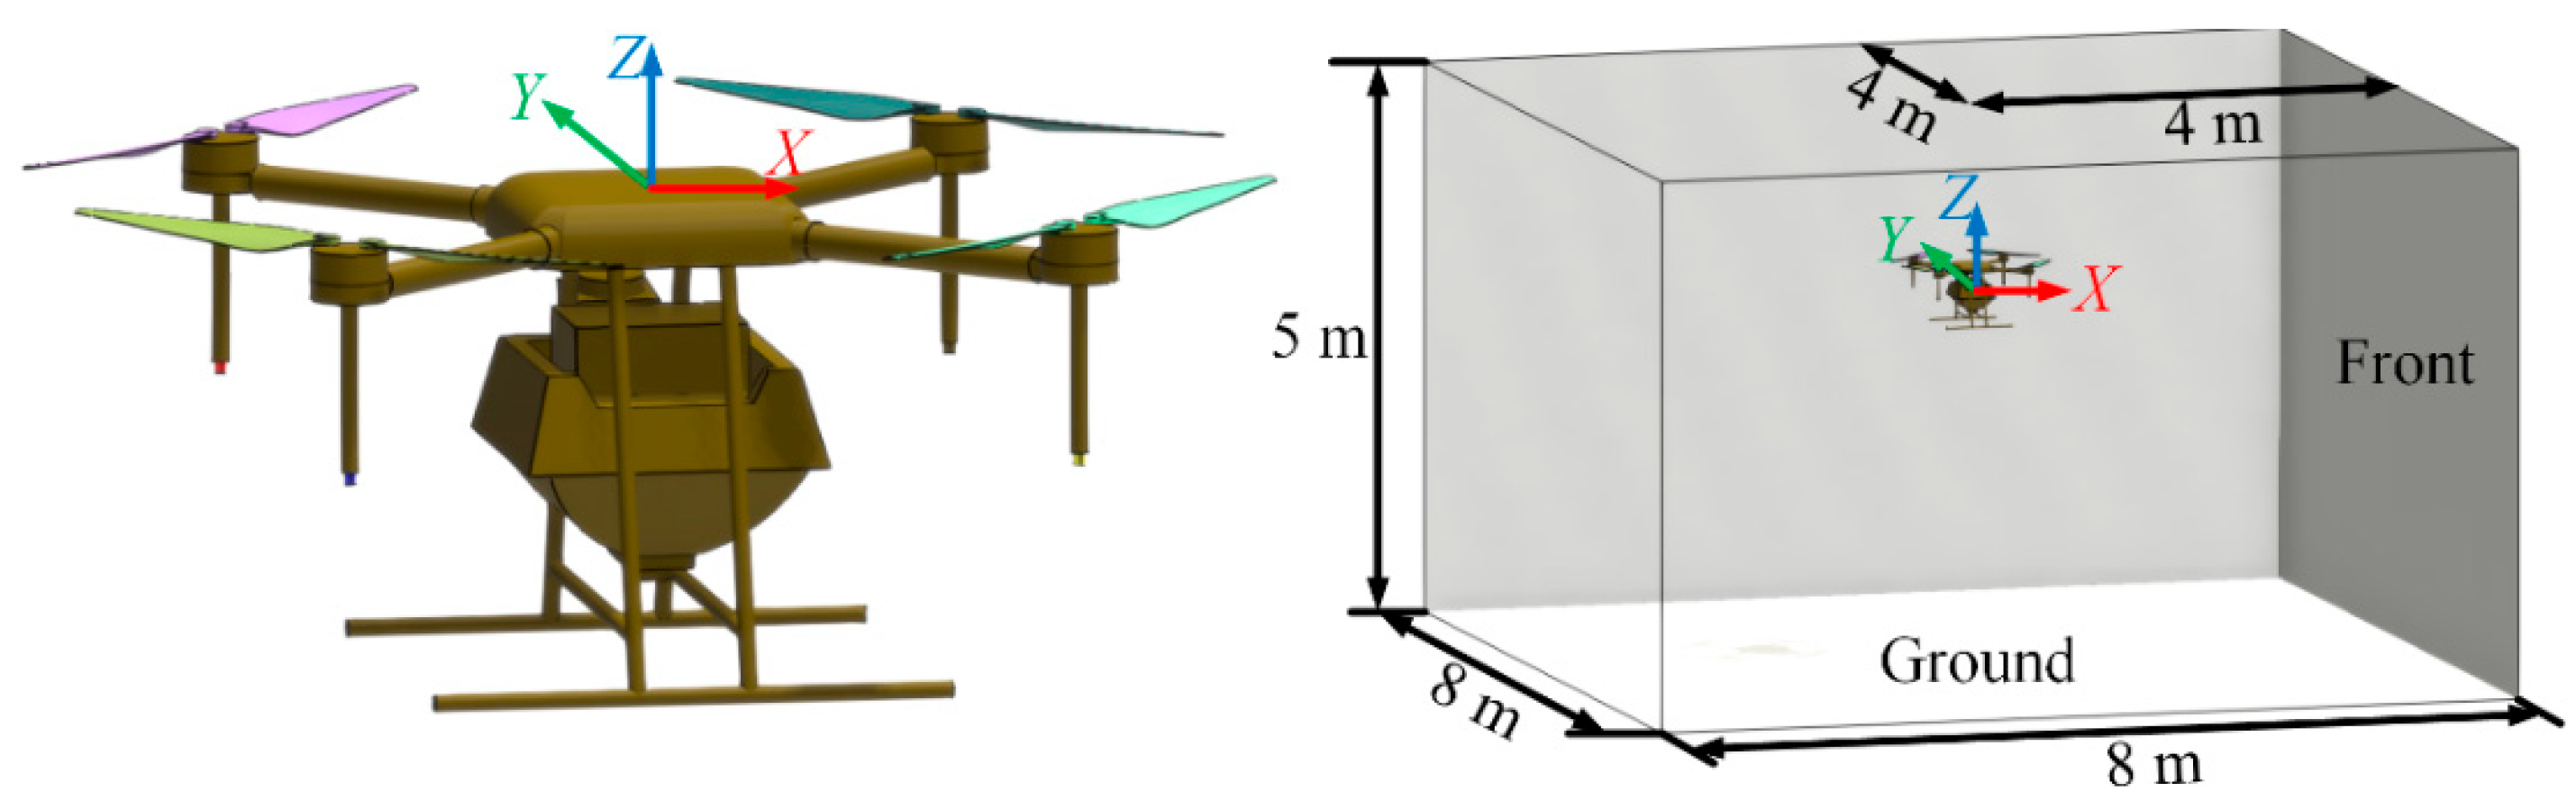
The Kestrel 4000 anemometer mounts on a retractable tripod bracket, with the impeller of the anemometer placed parallel to the ground to ensure the windward side faces vertically upwards. The UAV was placed on a bracket at 4 m above the ground using fixtures. At this point, the anemometer was 1 m above the ground when measuring the rotor wind speed at the lowermost sampling point. This prevented the anemometer being too close to the ground and affecting the measurement results.
(3)
The rotation direction of the rotor was set by the flight control system, as shown in Figure 1b, and the rotor speed was obtained from the flight log of an actual flight according to the flight parameters in Table 3. After the rotor speed had stabilized, the anemometer moved to the sampling point for measurement. Each sampling point was measured continuously for 30 s each time, and the sampling frequency set to 1 s. The average rotor wind speed was calculated after repeating the measurement three times for each sampling point.
(4)
The average wind speed of each sampling point was compared with the simulation results to verify the accuracy of the rotor wind field simulation model. The relative error between the simulation and experimental results is defined as Equation (4).
e = q e q s q e
where qe is the rotor wind speed perpendicular to the ground obtained from the indoor experiment and qs is the rotor wind speed perpendicular to the ground obtained from simulation.
(5)
According to the verified simulation model, the UAV wind field simulation was carried out. The UAV rotor wind field distribution was derived from the simulation results. The spatial layout design of the side spray device on the UAV airframe was guided according to the wind field distribution.

2.4. Spray Performance Experimental Method for Side Spray Device

2.4.1. Spray Pattern Screening Experiment of Side Spray Device

Research has shown that when spraying in real tasks, even using the same flight parameters, same environmental parameters, and same spray parameters, different types of crops and different growth stages of the same crop still have a significant impact on the UAV spray performance (droplet deposition, droplet distribution, etc.) [48,49,50]. There are many uncontrollable factors in the agricultural environment when conducting field experiments. However, evaluating the spray performance of a spray device (droplet size, deposition, drift, etc.) should be carried out in the most controllable environment [20,51]. Therefore, the spray experiment of the side spray device was conducted in both a non-crop simulation environment and an actual field environment.
When the UAV avoids obstacles with the path shown in Figure 1c, the spray pattern of the side spray device on obstacle avoidance paths 1, 2, and 3 affects the droplet coverage in the obstacle neighborhoods. To obtain a suitable spray pattern for the side spray device, an experiment for the side spray device with different spray patterns was firstly carried out in a non-crop simulation environment.
As shown in Figure 8, the side spray device spray pattern experiment was divided into four patterns. Pattern 1 shows the non-obstacle avoidance condition, with only the normal operation spray device spraying, from which the baseline droplet coverage during normal operation can be obtained. Pattern 2 for obstacle avoidance conditions has only the normal operation spray device spraying on obstacle avoidance paths 1, 2, and 3. And, this spray pattern is also the existing solution for quadrotor plant protection UAVs during obstacle avoidance. Pattern 3 for obstacle avoidance conditions has the side spray device and normal operation spray device spraying at the same time on obstacle avoidance paths 1, 2, and 3. In pattern 4 for obstacle avoidance conditions, the side spray device and normal operation spray device do not spray on obstacle avoidance paths 1 and 3. And, on obstacle avoidance path 2, the side spray device and normal operation spray device close to the obstacle side are automatically selected for spraying.
Referring to Figure 8, a rectangular area of 10 m × 20 m in the east–west direction was selected as the experimental site for different spray patterns of the side spray device in the non-crop simulation environment at Jiangsu University, Zhenjiang City, Jiangsu Province, China (32°12′35.1′′ N, 119°30′58.8′′ E). The experimental site was surrounded by windbreaks and protective nets on all sides to reduce the effects of environmental wind.
During the experiment, the outdoor temperature was 21 °C, ambient humidity was 32.2%, average environmental wind speed was 0.36 m·s−1, and the wind direction was southwest. In order to avoid the influence of different characteristics of pesticides such as viscosity, density, and additives on spraying, referring to the relevant standards [52,53,54], the spray medium was set as water, spray pressure was 0.3 MPa, and spray volume was 15 L·ha−1. The specific experiment methods and procedures were as follows.
(1)
The experimental site was divided into take-off area (length 2.5 m), obstacle avoidance area (length 15 m), and landing area (length 2.5 m). The UAV flew from west to east. A cylindrical obstacle with 5 m height and 0.11 m diameter was placed at the center of the obstacle avoidance area during obstacle avoidance, and the obstacle was removed during non-obstacle avoidance conditions.
(2)
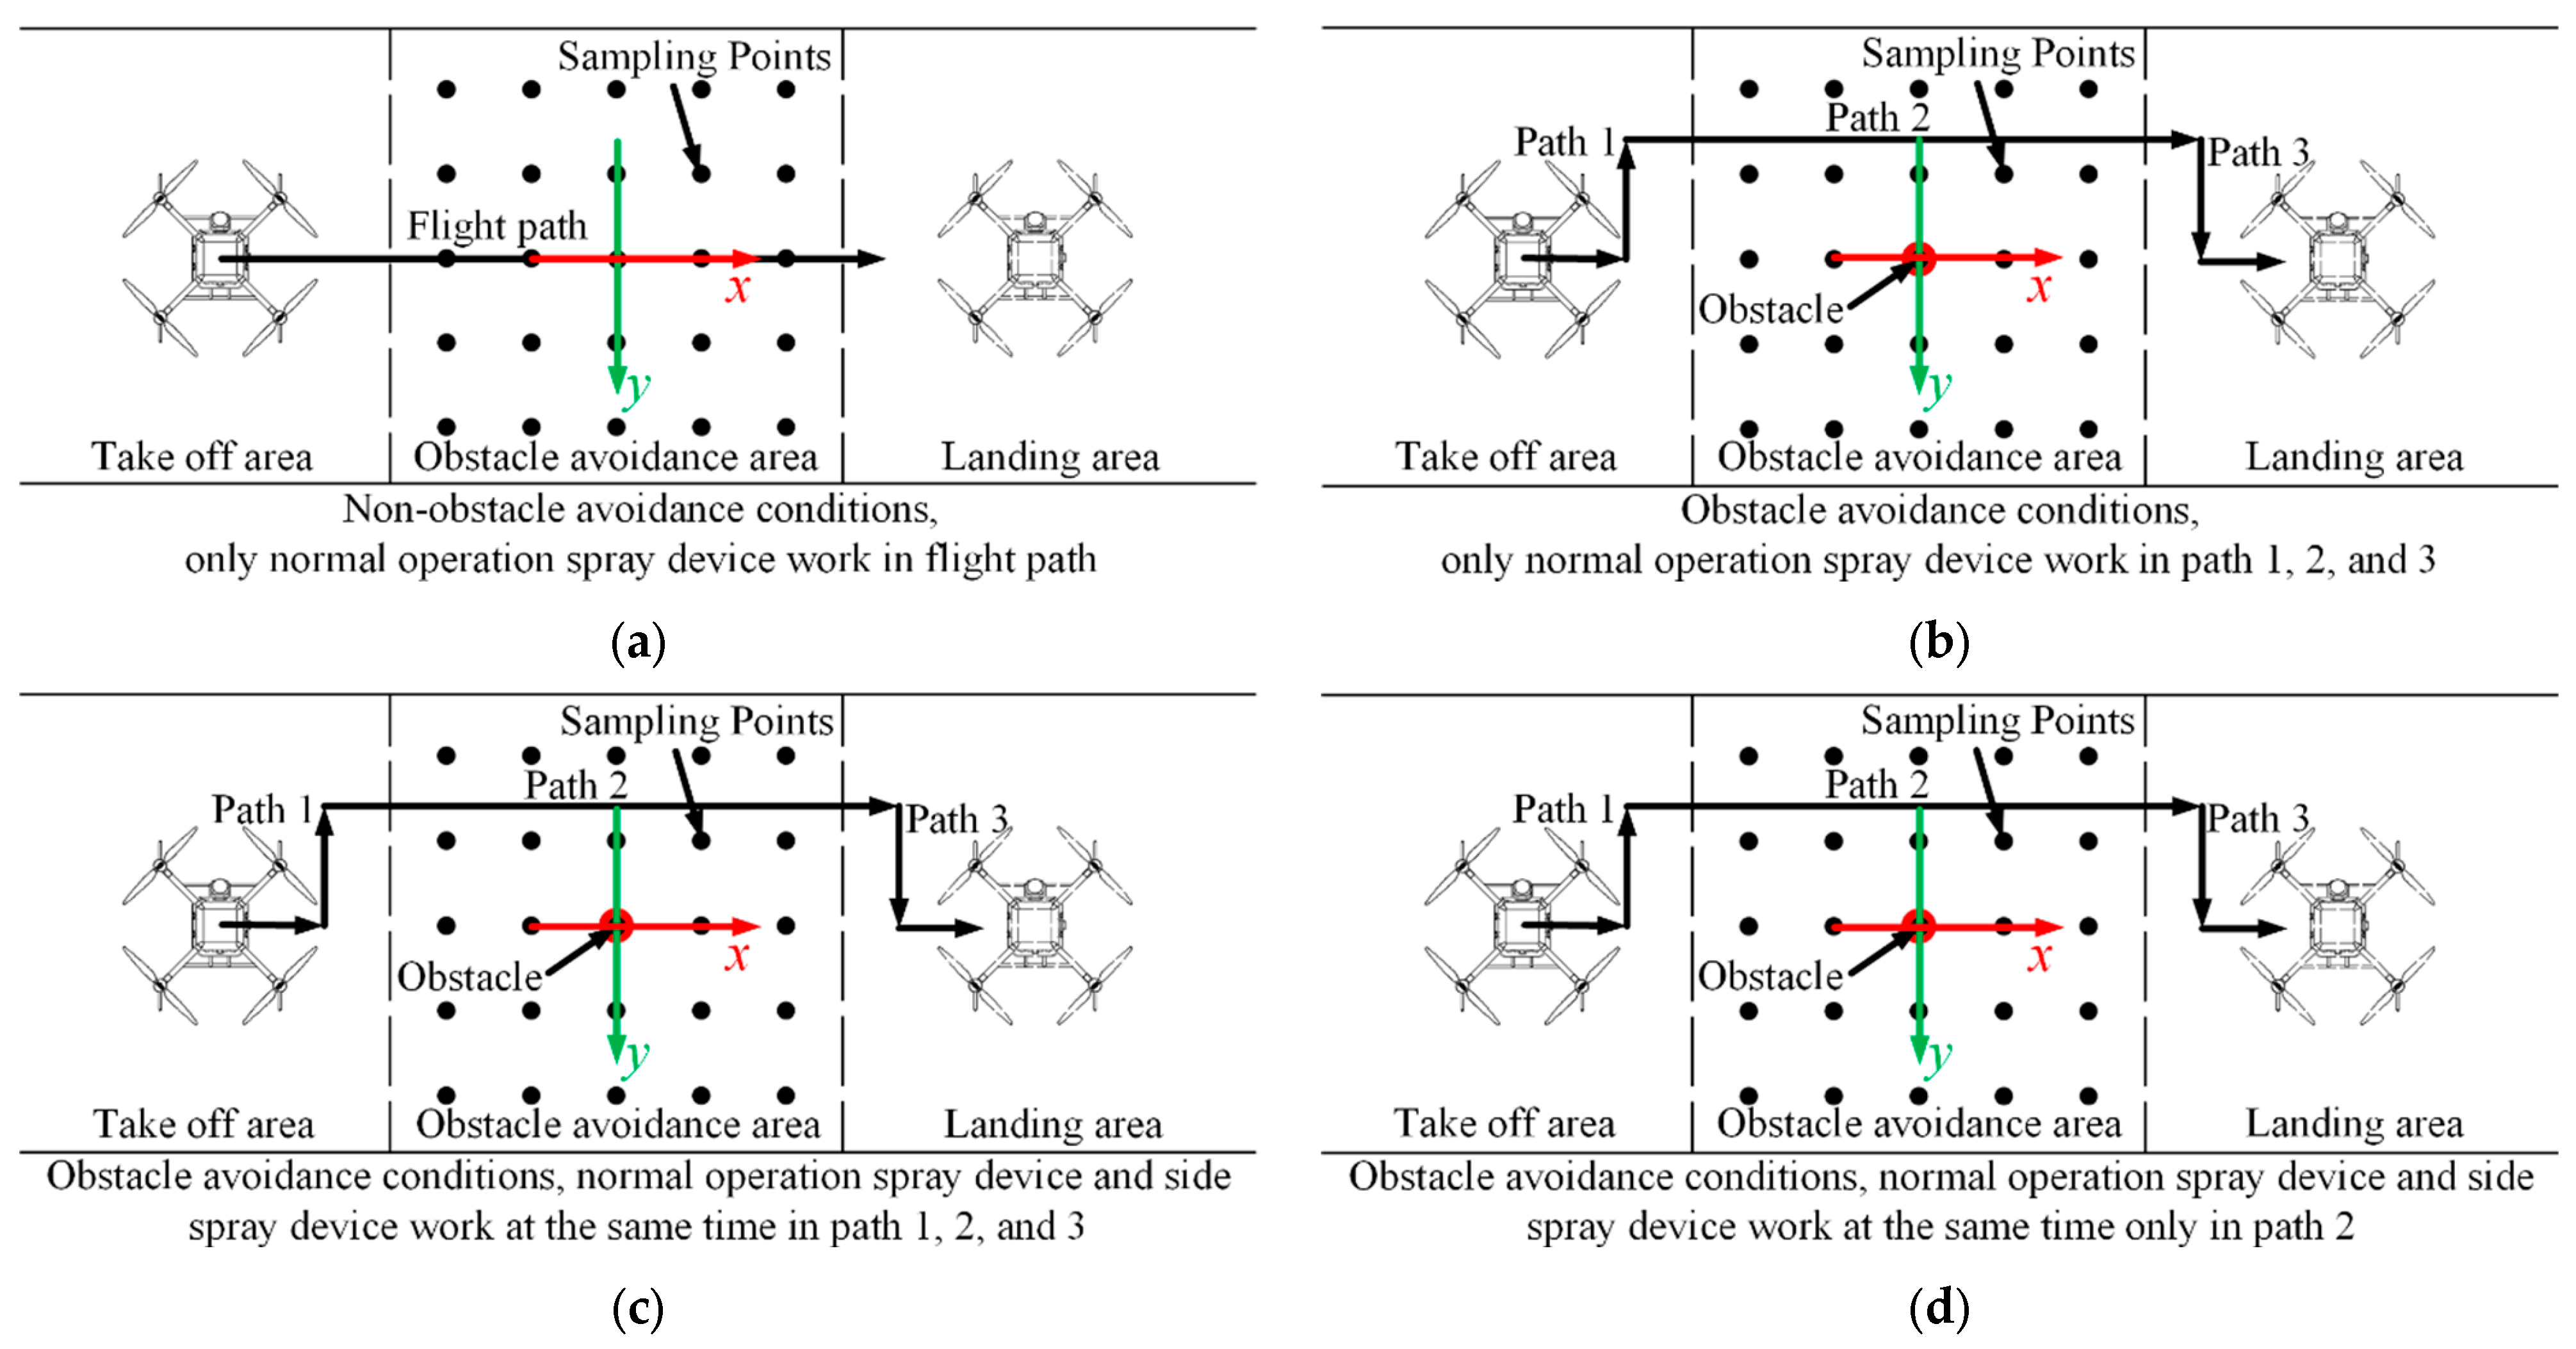
Referring to the relevant standards [52,53,54], a total of 25 droplet sampling points were arranged in a 5 × 5 matrix at 1 m intervals. The droplet sampling points parallel to the flight direction served as matrix rows, and the matrix center coincided with the obstacle avoidance area’s center. Water sensitive paper (WSP, Syngenta Group, Basel, Switzerland) was used for coverage assessment. And, to avoid the influence of the ground effect of the rotor wind field on the droplet distribution, the height of the water sensitive paper (WSP) from the ground was set to 0.5 m.
(3)
Once the UAV had taken off and was hovering stably in the take-off area, three sets of flight parameters were selected for obstacle avoidance flights from the flight parameter combinations in Table 3 (h1s1, h2s2, and h3s3). Three replicate experiments were conducted for each spray pattern of the side spray device for each flight parameter combination. For each experiment, the WSP was immediately scanned as a jpg image at 600 dpi by using an HP scanner (Laser NS MFP 1005, HP Inc., Palo Alto, United States) and saved.
(4)
Referring to the standard [55], the coverage densities of droplets (unit: drops·cm−2) for different spray patterns of the side spray device were obtained from the WSP images observed using a 10× hand-held magnifier. The coverage density of droplets was used to evaluate the spray effect of different spray patterns of the side spray device during obstacle avoidance, so as to obtain the suitable spray pattern for the side spray device.

2.4.2. Spray Experiment of Side Spray Device in a Non-Crop Simulation Environment and Field Environment

In order to further explore the influence of different flight parameters, and their interaction with the presence or absence of the side spray device, on the droplet coverage (uniformity and effective swath width) in the obstacle neighborhoods, the experiments were carried out using the suitable spray pattern for the side spray device (pattern 4), as obtained above. As shown in Figure 9, the spray experiment with the side spray device in pattern 4 was conducted in a non-crop simulation environment and field environment.
As shown in Figure 9a, the spray experiment in the non-crop simulation environment was first conducted. During the experiment, the outdoor temperature was 26 °C, ambient humidity was 35.8%, average environmental wind speed was 0.56 m·s−1, and the wind direction was east. The spray medium was water, spray pressure was 0.3 MPa, and spray volume was 15 L·ha−1. The experiment methods and procedures were as follows.
(1)
The experimental site, site division, circular obstacles, droplet sampling point arrangement, and sampler were the same as in the side spray device spray patterns experiment. Five 6 m long droplet sampling lines were added, which overlapped the columns of the sampling point matrix and were set at 0.5 m height from the ground.
(2)
In order to compare the droplet coverage in the obstacle neighborhoods between spraying with and without the side spray device, the spray experiment was divided into groups A and B. In group A, the side spray device sprayed according to pattern 4 during obstacle avoidance. In group B, the side spray device did not spray during obstacle avoidance.
(3)
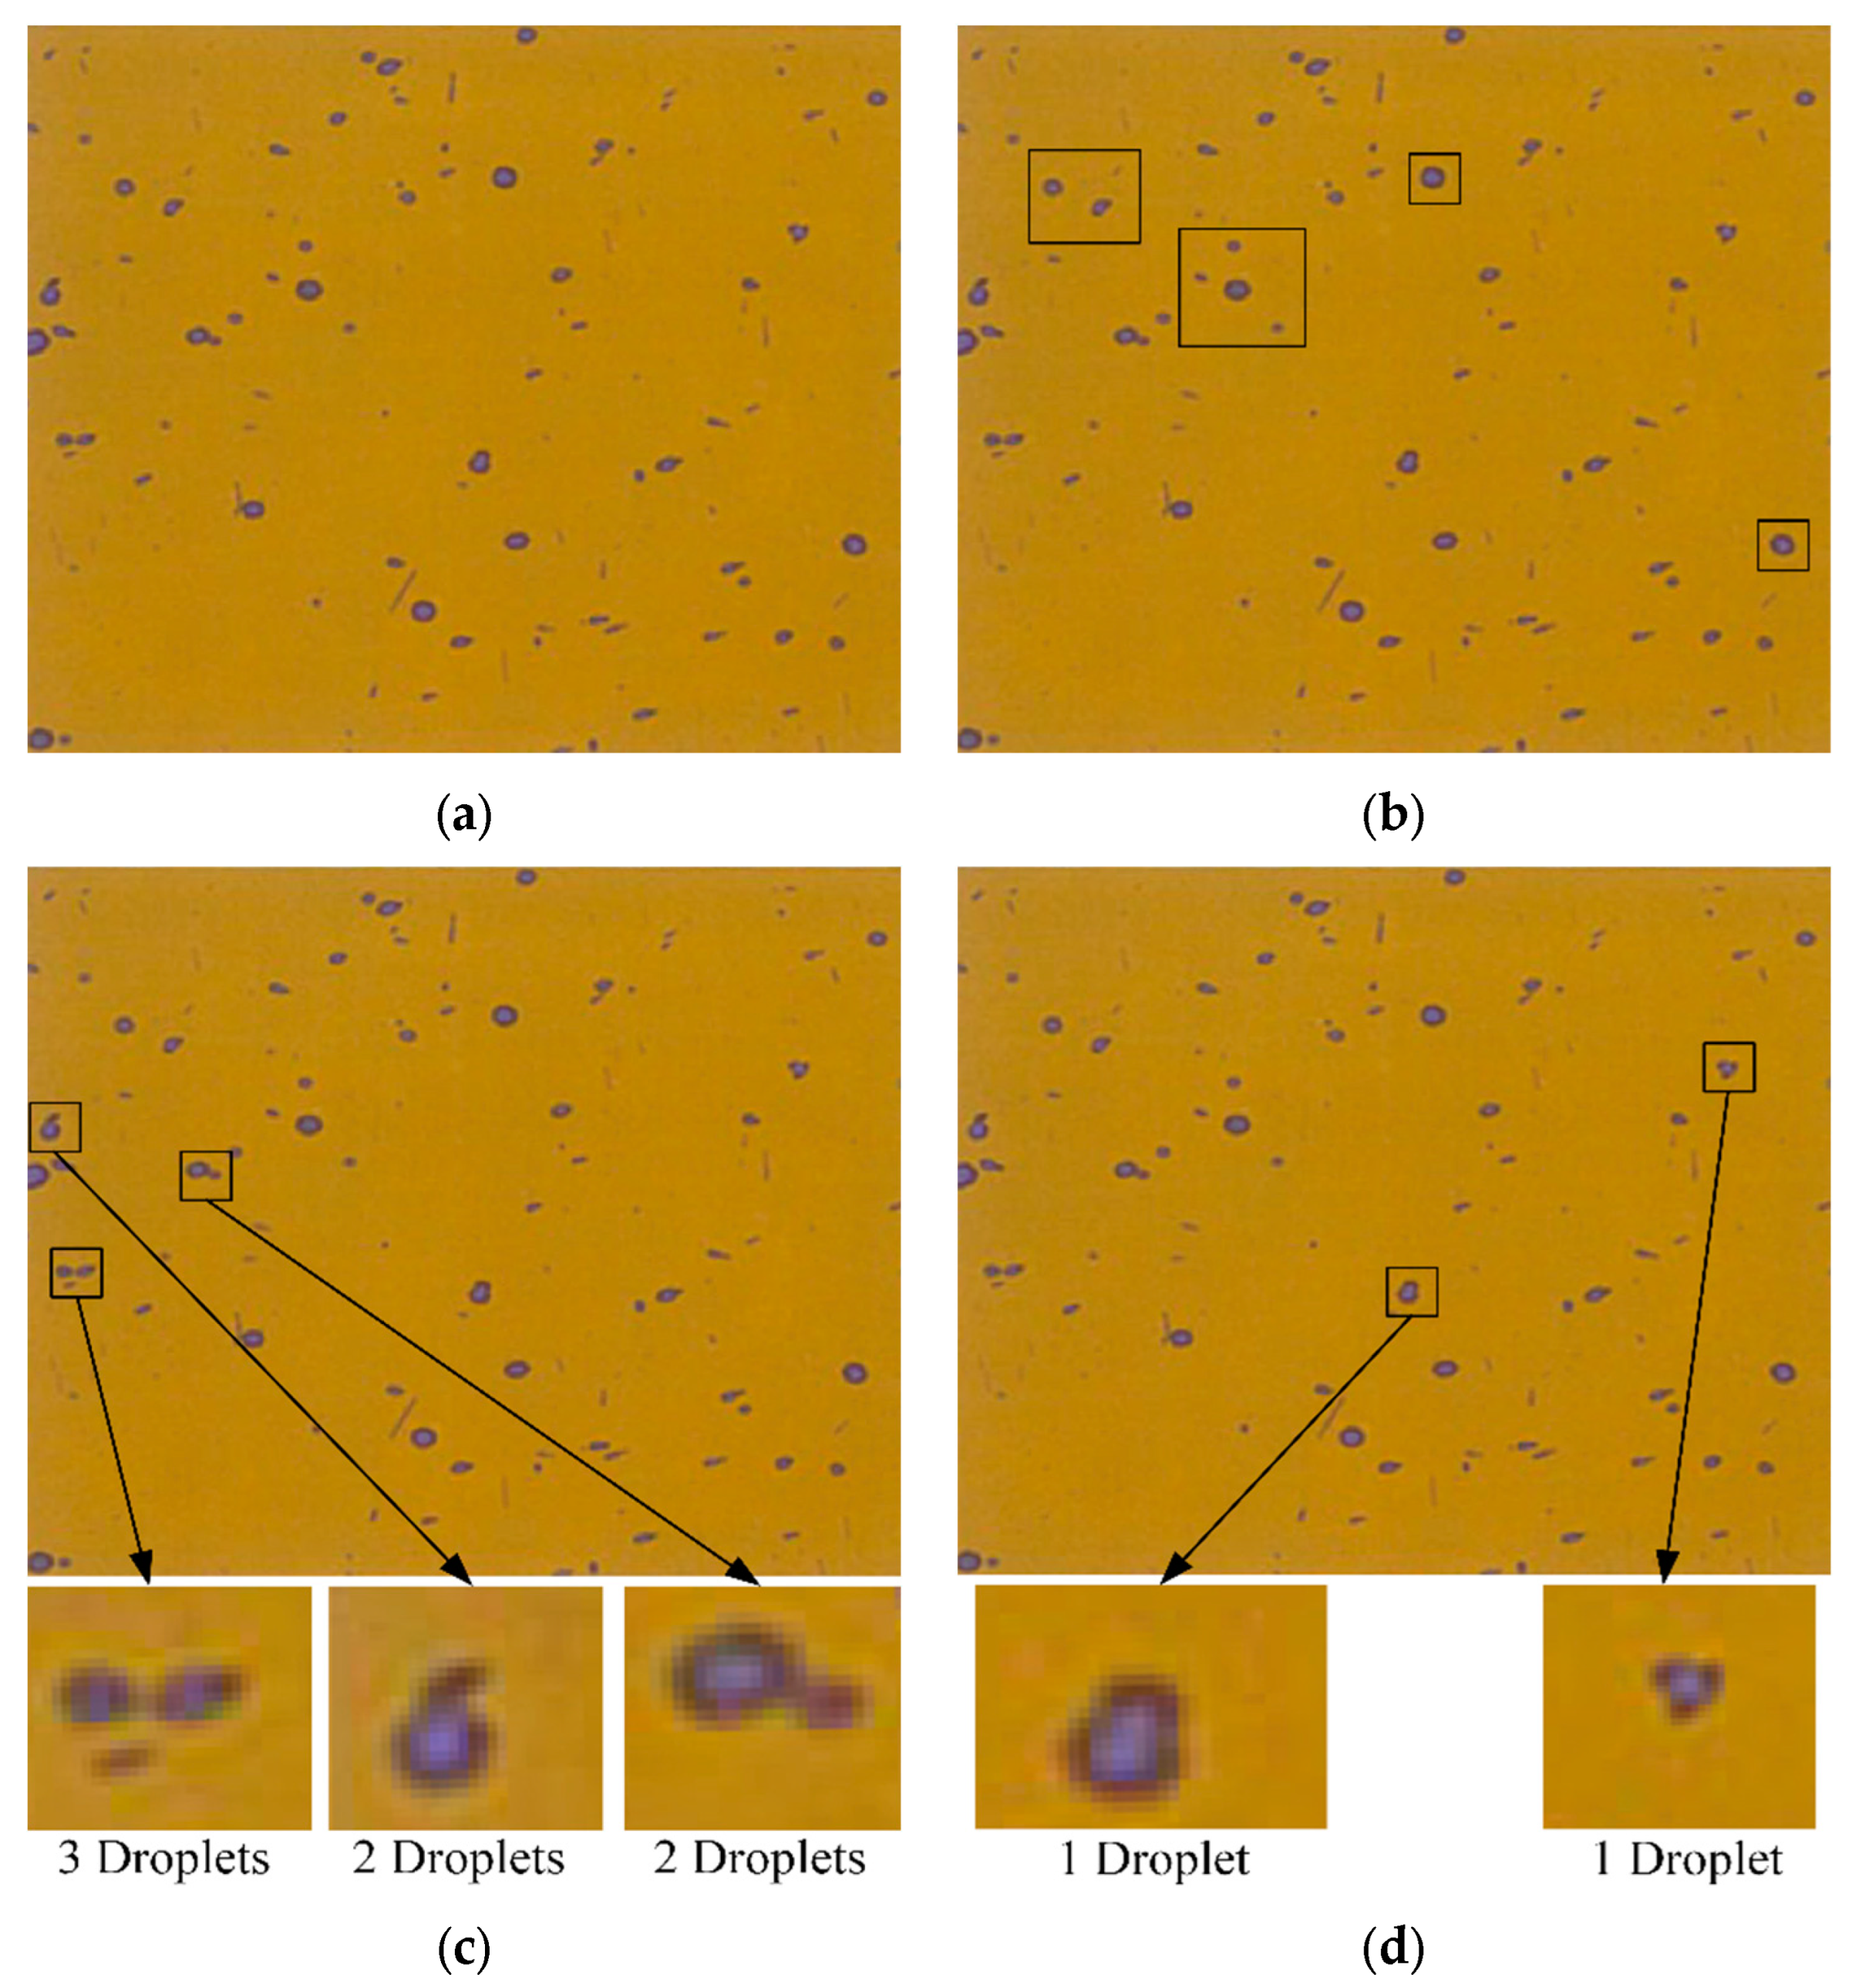
Once the UAV had taken off and was hovering stably in the take-off area, it used the flight parameter combinations shown in Table 3 for obstacle avoidance flight. Three replicate experiments were conducted for each flight parameter combination. And, for each experiment, the WSP was immediately scanned as a jpg image at 600 dpi using an HP scanner (Laser NS MFP 1005, HP Inc., Palo Alto, United States) and saved. Photoshop was used to segment a fixed size of 600 × 500 pixels from the jpg image of each WSP sample, then saved as the raw image and converted to an 8-bit grayscale image.
(4)
ImageJ 1.8.0 (https://imagej.net, accessed on 8 June 2024) was used to analyze and evaluate the spray deposition and coverage of the WSP [56,57,58]. The image processing procedure applied in this article was similar to that described by Martin et al. [57]., Zhu et al. [58]., and Cerruto et al. [59]. Based on our group’s previous research [60], the detailed steps are described below. All grayscale images were threshold-processed by Image J 1.8.0 in the MINIMUM auto threshold mode and manually corrected. Then, each binarized image was measured and analyzed by Image J. The droplet deposition information was calculated and saved as an Excel file, including droplet deposition coverage, spray coverage, etc.
(5)
The UAV spray performance of the two spraying methods (with side spray device and without side spray device) during obstacle avoidance was evaluated by taking the best droplet deposition for groups A and B. Referring to the standard [61], the effective swath width and distribution uniformity of droplets between sampling points are used as evaluation indexes for the spray performance of the side spray device. The distribution uniformity of droplets can be calculated as Equation (5), and the uniformity is inversely proportional to CV.
x ¯ = x 1 + x 2 + + x m m = x i n S = x i x ¯ 2 n 1 C V = S x ¯ × 100 %
where x1, x2, …, xn is the droplet deposition coverage of each sampling point; x ¯ is the average droplet deposition coverage of obstacle neighborhoods; S is the standard deviation of the droplet deposition coverage of obstacle neighborhoods; n is the number of sampling points; and CV is the coefficient of variation.
As shown in Figure 9b, in order to further explore the field spray performance of the side spray device, a field spray experiment during obstacle avoidance of the side spray device in spray pattern 4 was carried out in the Graphene Town, Changzhou City, Jiangsu Province, China (31°41′34.3′′ N, 119°50′22.6′′ E).
During the field experiment, the outdoor temperature was 31 °C, ambient humidity was 63.2%, average environmental wind speed was 2.68 m·s−1, and the wind direction was southeast. The spray medium was water, spray pressure was 0.3 MPa, and spray volume was 15 L·ha−1. The crop was rice, the variety was Wuyun Japonica 24, the planting density was 270,000 holes/ha and 3–4 seedlings/hole, the growing period was the flowering stage, and the average plant height was 0.68 m.
With reference to the spray experiment method for the side spray device in the non-crop simulation environment, the droplet sampling point matrix and sampling line for the side spray device field experiment were the same as above. In order to ensure that the WSP and sampling line could collect the droplets and to reduce the influence of rice leaves on droplet collection, the arrangement heights of the WSP and sampling line were adjusted from 0.5 m in the non-crop simulation environment to 0.8 m, so that the sampling height exceeded the rice plant height.

3. Results and Discussion

3.1. Relative Position of UAV and Obstacle

According to the method described above, the relative positions of the UAV and the obstacle were plotted from the measured coordinates of the obstacle (xob, yob, zob) and the UAV’s coordinates (xu, yu, zu) under different flight parameters to obtain Figure 10a. Based on the measurement results of the relative positions of the UAV and obstacle, the theoretical required spray angle of the side spray device nozzle can be calculated by combining Equation (3), as shown in Figure 10b.
Combining Figure 1c and Figure 10a, under the effect of inertia, the faster the UAV flight speed, the longer the horizontal adjustment distance of the UAV on obstacle avoidance path 1. According to Figure 2 and Equation (3), the longer horizontal adjustment distances increase DH and the lower flight altitudes decrease DV, both causing an increase in the required spray angle. Therefore, as shown in Figure 10b, the theoretical maximum spray angle required for the side spray device nozzle occurs at the fastest flight speed and the lowest flight altitude, which is 66°.
However, as shown in Figure 11a, the diffusion of the nozzle liquid film was also affected by the surface tension of the liquid. And, the liquid film boundary shrinks inward to form a curved boundary, making the actual spray boundary smaller than the theoretical spray boundary. Therefore, in order to ensure that the spray range of the side spray device completely covers the obstacle neighborhoods, the spray angle of the side spray device nozzle should be greater than 66°. As shown in Figure 11b, the nozzle of the side spray device was finally determined to be the Lechler TR 80 (Lechler GmbH, German) with a spray angle of 80°. The technical parameters of the Lechler TR 80 nozzle can be found in Table 5.

3.2. Side Spray Device Spatial Layout on UAV

3.2.1. Model Accuracy Assessment

Table 6 shows the simulation values, experimental values, and relative errors of the rotor wind field. As can be seen from Table 6, the experimental and simulation values maintain the same trend of variation. The relative error between the experimental and simulation value of the sampling points at a vertical distance of 0.5–2 m from the rotor was less than 10%, which is consistent with the research of Yang et al. [39]. For the sampling points at vertical distances of 2.5 m and 3 m from the rotor, the relative errors ranged from 15% to 25%. The reason for these relative errors can be attributed to the influence of the ground effect of the rotor wind field, which was similar to the research of Zhang et al. [62].
To further analyze the rotor wind field distribution, the simulation wind speed at different vertical distances from the rotor in the Y-Z plane at X of 0.425 m were explored. The results are shown in Figure 12. The rotor wind speed has two symmetrical peaks at 0.5 m from the rotor in the vertical ground direction. The peak appears directly under the rotor, and the wind speed gradually decreases along both sides of the rotor. As the distance from the rotor increases in the vertical ground direction, the wind speed gradually becomes smaller. The wind fields of the four rotors interact and spread, making the two symmetrical wind field peaks mentioned above gradually weaken. The closer it is to the ground, the more evenly distributed the wind speed. But the wind speed directly below the rotor is still greater than the wind speed on both sides. In addition, it can be found from Table 6 and Figure 12 that the experimental values were smaller than the simulation values. The possible reason is that, in the actual experiment, some environmental factors (wind pressure distribution, air characteristics, and ground effects, etc.) may cause rotor airflow loss and the simulation ignores these factors, making the simulation value larger than the experimental value [51,63].

3.2.2. Nozzle Position Design

According to the verified simulation model above, the simulation of the rotor wind field of the UAV was carried out. The rotor wind field distribution based on the simulation results is shown in Figure 13.
As can be seen from Figure 13, a clear wingtip vortex and vortex sheet are generated from the rotor when the UAV rotor starts to rotate. As the rotor continues to rotate, the wingtip vortex and vortex sheet spiral down from the rotor plane along the Z-axis of the UAV and gradually become unstable and disintegrate during the spiral down. Eventually, the rotor wind field of the UAV shows inward contraction, and then, outward diffusion in the vertical ground direction.
The airflow was first in a contracted state as it leaves the rotor and blows towards the ground. The contraction speed decreases with increasing distance from the rotor and stops at 0.2–0.7 m below the rotor. The minimum horizontal contraction range was 1.34 m, which occurs at 0.28 m below the rotor. Subsequently, due to the factors such as ground effects, air resistance, wind pressure, and ground effects [64,65], the rotor wind speed gradually decreases and the wind field gradually diffuses outwards. In the rotor wind field contraction area, the wind speed within the range of the two symmetrical rotor tips was much higher than that at the two sides, which is also reflected in Figure 12. As can be seen in Figure 12, the sampling points between −0.7 and 0.7 m have much higher wind speeds than the sampling points on both sides. Especially, the wind speeds at the sampling points at 0.5 m and 1.0 m directly below the rotor are more significant. The UAV in this article has a diagonal wheelbase of 1.2 m and single-blade size of 15 inches. The maximum distance between the two symmetrical rotor tips can be calculated as 1.6 m. Therefore, the wind field distribution and wind speed of the rotor are consistent with the physical structural dimensions of the UAV.
According to the simulation results of the rotor wind field, the rotor wind speed in the diffusion area was smaller, and closer to the ground the wind speed distribution was more uniform. When the rotor wind field was in the contraction area, the wind speed within the wingtip range of the two symmetrical rotors was higher, and the wind speed outside the wingtip range was lower. The wind speed was highest in the area directly below the rotor, which has the greatest ability to inhibit droplet drift and increase crop canopy deposition.
However, the side spray device is mainly used to improve the droplet coverage in the obstacle neighborhoods located to the side of the UAV during obstacle avoidance. Therefore, the spatial layout design of the side spray device on the UAV airframe should arrange the nozzle in the low-wind-speed area of the rotor wind field, aiming to reduce the influence of high-speed wind perpendicular to the ground on the nozzle of the side spray device. In addition, the side spray device should be as compact as possible on the UAV to maintain maneuverability.
Based on the above simulation results and analyses, the side spray device was arranged in the contraction area of the rotor wind field, and shared the mounting point with the normal operation spray device. The nozzle of the side spray device was located outside the range of the two symmetrical rotor tips in the contraction area. The specific spatial layout is shown in Figure 14.

3.3. Results of Side Spray Device Experiment

3.3.1. Spray Pattern Screening Results
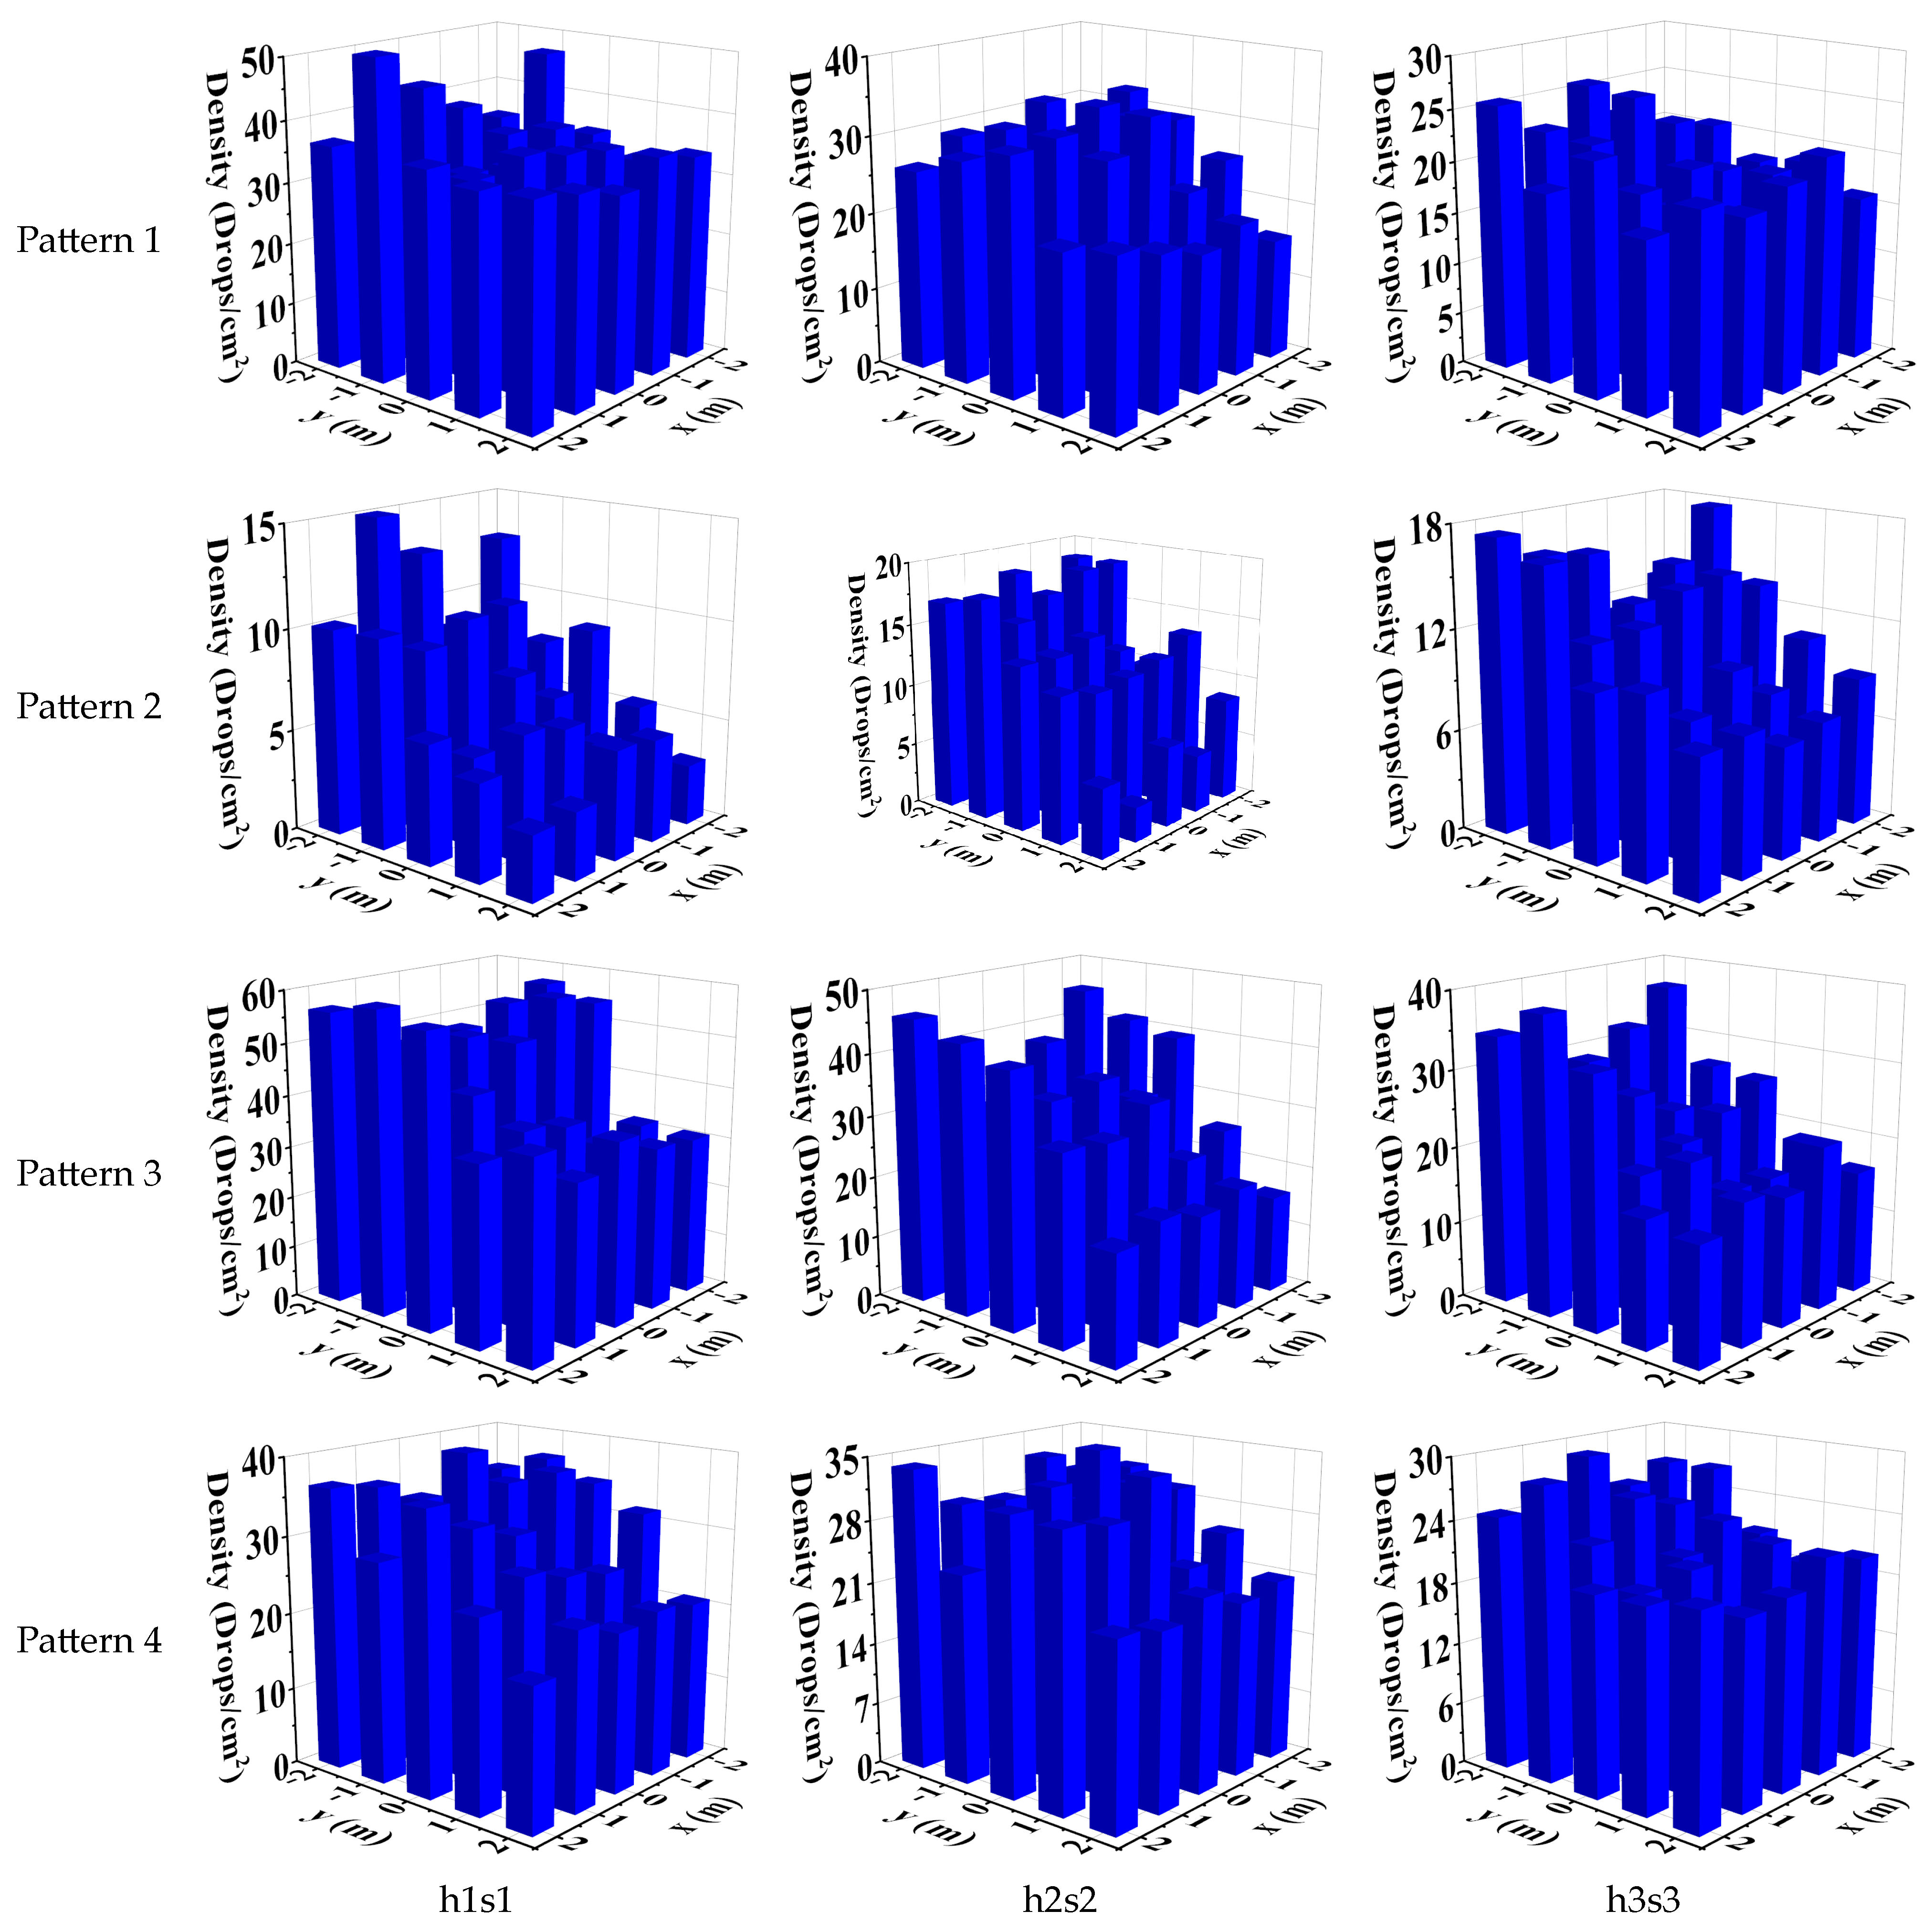
For the phenomenon of multiple droplets adhering together during droplet sampling in the experiment, manual judgment is needed to separate the adhesive droplets during observation and counting to avoid droplet counting errors. Numerous studies have shown that droplet adhesion on WSP generally consists of 2–3 droplets that form a connected domain [66]. An individual droplet has a circular or elliptical contour, whereas adhesive droplets have irregular contours. The circumference, area, and shape of the adherent droplet’s contours are significantly different from an individual droplet.
As shown in Figure 15, the counting of adhesive droplets separated by manual judgment was carried out by taking one of the WSPs as an example in the experiment. The droplets were classified into three categories according to the degree of adhesion: individual droplets with clear boundaries, weakly adherent droplets with clearer connectivity boundaries, and strongly adherent droplets with fuzzy connectivity boundaries. Individual droplets and weakly adherent droplets were separated and counted, while strongly adherent droplets were counted as one droplet.
The coverage density of droplets at each sampling point and the average for different spray patterns of the side spray device are shown in Figure 16 and Table 7, respectively. In Figure 16, the obstacle was located at (0, 0) in the X-O-Y plane.
Referring to Figure 16 and Table 7, the UAV has relatively uniform coverage density of droplets under different flight parameter combinations in the non-obstacle avoidance condition (pattern 1). The highest average coverage density of droplets was 36.03 drops·cm−2 and the lowest was 20.05 drops·cm−2, which meets the requirement of a minimum of 10.00 drops·cm−2 in the standard [55]. Based on the coverage density of droplets of pattern 1, the following results and discussion can be presented.
(1)
For spray pattern 2, the normal operation spray device spraying on obstacle avoidance paths 1, 2, and 3, the coverage density of droplets in the obstacle neighborhoods was significantly reduced, and more droplets were deposited near obstacle avoidance path 2. The highest average coverage density of droplets in pattern 2 was only 12.58 drops·cm−2 and the lowest was 7.42 drops·cm−2, making it difficult to meet the plant protection quality requirements in the standard [55].
(2)
For spray pattern 3, the side spray device and normal operation spray device spraying simultaneously on obstacle avoidance paths 1, 2, and 3, the coverage density of droplets in the obstacle neighborhoods was significantly higher than for pattern 2. The highest average coverage density of droplets in pattern 3 was 40.10 drops·cm−2 and the lowest was 23.49 drops·cm−2. According to the coverage density of droplets at each sampling point, the droplet deposition near the obstacle avoidance path increased significantly. On obstacle avoidance paths 1 and 3, the UAV was in the lateral movement stage without forward flight speed, leading to a sharp increase in droplet deposition. Compared to the same location in pattern 1, there was a tendency to re-spray.
(3)
For spray pattern 4, the side spray device and normal operation spray device spraying simultaneously only on obstacle avoidance path 2, the coverage density of droplets in obstacle neighborhoods was significantly higher than pattern 2, and was similar to the normal spray operation (pattern 1). The highest average coverage density of droplets in pattern 4 was 30.30 drops·cm−2 and the lowest was 22.17 drops·cm−2. Based on the coverage density of droplets at each sampling point, pattern 4 has a more uniform droplet distribution than pattern 3, with non-significant re-spray trends.
It can be seen that spray pattern 4 is suitable for the side spray device of the plant protection UAV in this article. This spray pattern ensures that the droplets deposit towards the obstacle neighborhoods. It also avoids the side spray device droplets impacting on the normal operation spray device’s droplet coverage to reduce re-spray.

3.3.2. Non-Crop Simulation and Field Environment Experiment Results

Spray pattern 4 was used to carry out a spray experiment in a non-crop simulation environment and field environment. The spray experiment in the non-crop simulation environment was carried out first. The average distribution uniformity of droplets and the effective swath width for each group under different flight parameter combinations are shown in Table 8.
As can be seen from Table 8:
(1)
The side spray device can significantly increase the effective swath width in obstacle neighborhoods during UAV obstacle avoidance. The minimum effective swath width with the side spray device was 1.53 m, the maximum was 4.90 m, and the average was 3.22 m. The minimum effective swath width without the side spray device was 1.30 m, the maximum was 4.51 m, and the average was 2.82 m. For the same flight parameters, using the side spray device can increase the effective swath width by a minimum of 6.35% and a maximum of 35.32%, with an average of 15.25%.
(2)
The distribution uniformity of droplets in the obstacle neighborhoods with the side spray device was worse than without the side spray device. But compared to insufficient droplet coverage, this degree of increased uniformity variation is still acceptable. The CV for the distribution uniformity of droplets with the side spray device was the lowest at 32.25% and the highest at 87.15%, with an average of 51.89%. The CV for the distribution uniformity of droplets without the side spray device was the lowest at 21.3% and the highest at 56.96%, with an average of 40.36%.
(3)
The distribution uniformity of droplets in the obstacle neighborhoods with the side spray device was worse than without the side spray device, perhaps due to the following reasons. Previous studies have shown that the droplet volume and diameter of the nozzle are not uniformly distributed, but show a normal distribution, which mean the nozzle itself has a nonuniform droplet distribution [67,68,69,70], resulting in a nonuniform droplet distribution of the side spray device in the obstacle neighborhoods. The droplet coverage in the obstacle neighborhoods without the side spray device mainly relies on the droplet drift caused by the rotor wind and environmental wind. And, the nonuniform droplet distribution of the nozzle has little effect on the droplet distribution in the obstacle neighborhoods. As a result, the distribution uniformity of droplets with the side spray device was worse than without the side spray device under different flight parameter combinations. However, this phenomenon also proves that the side spray device can target spraying and improve droplet coverage in obstacle neighborhoods during UAV obstacle avoidance.
To further explore the field spray performance of the side spray device, the field experiment of the side spray device was conducted by using pattern 4 as well. The distribution uniformity of droplets and the effective swath width of the side spray device in the field obstacle neighborhoods under different flight parameter combinations are shown in Table 9.
In order to find the influence relationship between flight speed, altitude, and the interaction of the two on the distribution uniformity of droplets and the effective swath width of the side spray device in obstacle neighborhoods, the analysis of variance (ANOVA) and establishment of a relationship model were carried out using the data in Table 9 with 95% confidence intervals; the results are shown in Table 10 and Table 11.
According to Table 10 and Table 11, a relationship model between the distribution uniformity of droplets and the effective swath width of the side spray device in obstacle neighborhoods with flight speed, altitude, and the interaction of the two can be established; see Equation (6). The coefficients of determination for the distribution uniformity of droplets (Rdu2) and effective swath width (Rsw2) in Equation (6) were 0.961 and 0.909, respectively. It can be considered that the established relationship model is satisfactory.
y d u = 183.315 61.77 a 44.015 s + 1.178 a · s + 9.84 a 2 + 7.396 s 2 y s w = 1.503 + 1.393 a + 1.549 s + 0.096 a · s 0.034 a 2 0.347 s 2 R d u 2 = 1 S r s d u C s s d u = 1 1.76 45.71 = 0.961 R s w 2 = 1 S r s s w C s s s w = 1 990.271 10883.135 = 0.909
where ydu is the regression model of the distribution uniformity of droplets; ysw is the regression model of the effective swath width; Rdu2 is the coefficient of determination for the regression model of the distribution uniformity of droplets; Rsw2 is the coefficient of determination for the regression model of the effective swath width; Srsdu is the residual sum of squares for the distribution uniformity of droplets; Cssdu is the post-correction sum of squares for the distribution uniformity of droplets; Srscv is the residual sum of squares for the effective swath width; and Csssw is the post-correction sum of squares for the effective swath width.
To verify the accuracy and credibility of the established regression analyses and relational model, the field experiment with four groups of the side spray device in spray pattern 4 was carried out again. The experimental parameters and results are shown in Table 12. It can be seen from Table 12 that the error between the predicted values of the established relational model and the field spray experiment results was less than 15%. This proves the accuracy and credibility of the relational model, and the relevant rules reflected in the model can guide the selection of spray parameters during obstacle avoidance and the optimization of the obstacle avoidance algorithm for the plant protection UAV.
In summary, it can be seen that compared with the existing spray solutions for electric multirotor plant protection UAVs, the design and development of a side spray device for UAVs to improve spray coverage in obstacle neighborhoods proposed in this article can improve the droplet coverage in obstacle neighborhoods during obstacle avoidance. Existing electric multirotor UAVs must avoid obstacles to ensure safety when operating in unstructured farmland (mountainous, hilly, terraced, and obstacle environments, etc.). However, there is no spraying of the obstacle neighborhoods during obstacle avoidance, resulting in poor droplet coverage, which affects the precision spray effect and plant protection quality. In this article, a side spray device dedicated to improving the droplet coverage in obstacle neighborhoods during obstacle avoidance was studied; it can improve the spray effect of UAVs in obstacle environments and expand the application environment. Furthermore, the proposed theories and methods can also provide a reference for precise plant protection of tree trunks and roots by UAVs in orchards, gardens, and forests.
There are still some shortcomings in this study that require continued research in the future. The side spray device can increase the swath width of UAVs, but the increased swath width also raises the risk of re-spray and droplet drift. The next step will be working on the risk of re-spray, droplet drift, and the possible impact on the environment. Meanwhile, due to the limitation of the crop growth cycle, the field experiment of the side spray device was only carried out in a rice field. In the future, the authors will carry out experiments on different crops and different growth cycles of the same crop. For the side spray device, the effects of factors such as the UAV model, nozzle type, pesticide solution, and pesticide adjuvant on droplets in the obstacle neighborhoods will also be further investigated, with the expectation of developing systematic conclusions and results.

4. Conclusions

(1)
This study was aimed at the problem of plant protection UAV spray systems not spraying obstacle neighborhoods during obstacle avoidance, resulting in insufficient droplet coverage in the area. To improve the droplet coverage in the obstacle neighborhoods, the design and development of a side spray device for UAVs to improve spray coverage in obstacle neighborhoods was proposed in this article. The main work was as follows. Firstly, a relative position measurement method to measure the distance between the UAV and obstacles during obstacle avoidance under different flight parameter combinations was investigated. Secondly, the nozzle spray angle and nozzle type of the side spray device were determined by combining the relative position. Thirdly, a rotor wind field simulation model of the UAV was proposed based on the LBM. And, the spatial layout design of the side spray device on the UAV airframe was carried out based on the simulation results. Fourthly, a relevant spray experiment was carried out to explore the suitable spray pattern of the side spray device. Finally, the influence relationship between flight speed, altitude, and the interaction of the two on the distribution uniformity of droplets and the effective swath width of the side spray device in obstacle neighborhoods was explored. And, a regression analysis was carried out and an influence relationship model was created.
(2)
The side spray device can effectively improve the droplet coverage in obstacle neighborhoods during obstacle avoidance. Compared to without the side spray device, the effective swath width in obstacle neighborhoods with the side spray device can be increased by a minimum of 6.35%, a maximum of 35.32%, and an average of 15.25% under the same flight parameters. The results verify the effectiveness and reasonableness of the design of the side spray device in this article. It can reduce blank dispersal, use fewer droplets, and provide supplementary spray in obstacle neighborhoods when the plant protection UAV operates in an environment with obstacles. It also can improve the spray deposition rate, application rate of pesticide, and operation quality. This article can provide theoretical and technical support to improve the use of plant protection UAVs and research on the same type of device.
(3)
The error between the predicted values of the established relational model and the field spray experiment results was less than 15%. This proves the accuracy and credibility of the relational model. And, the relevant rules reflected in the relational model can guide the selection of spray parameters during obstacle avoidance and the optimization of the obstacle avoidance algorithm for the plant protection UAV.

Author Contributions

Conceptualization: X.H., K.Y. and F.K.; methodology: X.H., Q.W. and F.K.; software: Q.W. and C.J.; validation: F.K., Q.W. and X.Z.; formal analysis: X.D., X.Z. and C.J.; investigation: X.H. and X.Z.; resources: F.K., X.D. and X.Z.; data curation: X.D., C.J. and X.Z.; writing—original draft preparation: F.K. and X.D.; writing—review and editing: B.Q., F.K. and X.H.; supervision: X.H. and K.Y.; funding acquisition: X.H. All authors have read and agreed to the published version of the manuscript.

Funding

This study was funded by the Talent Introduction Project of Anhui Science and Technology University (JXYJ202204), 2024 University Research Projects of Anhui Province (Study on the mechanism of plant protection UAV obstacle avoidance on droplet deposition in the obstacle neighborhoods in rice terraces).

Data Availability Statement

The data presented in this study are available on request from the corresponding author. The data are not publicly available due to privacy and permissions restrictions.

Conflicts of Interest

The authors declare no conflict of interest.

References

  1. Qin, W.C.; Qiu, B.J.; Xue, X.Y.; Chen, C.; Xu, Z.F.; Zhou, Q.Q. Droplet deposition and control effect of insecticides sprayed with an unmanned aerial vehicle against plant hoppers. Crop Prot. 2016, 85, 79–88. [Google Scholar] [CrossRef]
  2. He, X.K.; Bonds, J.; Herbst, A.; Langenakens, J. Recent development of unmanned aerial vehicle for plant protection in East Asia. Int. J. Agric. Biol. Eng. 2017, 10, 18–30. [Google Scholar] [CrossRef]
  3. Yang, S.L.; Yang, X.B.; Mo, J.Y. The application of unmanned aircraft systems to plant protection in China. Precis. Agric. 2017, 19, 278–292. [Google Scholar] [CrossRef]
  4. Lan, Y.B.; Chen, S.D.; Deng, J.Z.; Zhou, Z.Y.; Ouyang, F. Development situation and problem analysis of plant protection unmanned aerial vehicle in China. J. South China Agric. Univ. 2019, 40, 217–225. (In Chinese) [Google Scholar] [CrossRef]
  5. Wang, L.L.; Lan, Y.B.; Zhang, Y.L.; Zhang, H.H.; Tahir, M.N.; Ou, S.C.; Liu, X.T.; Chen, P.C. Applications and prospects of agricultural unmanned aerial vehicle obstacle avoidance technology in China. Sensors 2019, 19, 642. [Google Scholar] [CrossRef]
  6. Wang, D.S.; Li, W.; Liu, X.; Li, N.; Zhang, C.L. UAV environmental perception and autonomous obstacle avoidance: A deep learning and depth camera combined solution. Comput. Electron. Agric. 2020, 175, 105523. [Google Scholar] [CrossRef]
  7. Luo, X.W.; Hu, L.; He, J.; Zhang, Z.G.; Zhou, Z.Y.; Zhang, W.Y.; Liao, J.; Huang, P.K. Key technologies and practice of unmanned farm in China. Trans. Chin. Soc. Agric. Eng. 2024, 40, 1–16. (In Chinese) [Google Scholar] [CrossRef]
  8. Zhao, C.J.; Fan, B.B.; Li, J.; Feng, Q.C. Agricultural robots: Technology progress, challenges and trends. Smart Agric. 2023, 5, 1–15. (In Chinese) [Google Scholar] [CrossRef]
  9. Yang, R.; Wang, Y.K.; Wang, B.J. Progress and trend of agricultural robots based on WoS bibliometrics and knowledge graph. Trans. Chin. Soc. Agric. Eng. 2022, 38, 53–62. (In Chinese) [Google Scholar] [CrossRef]
  10. Park, J.; Cho, N. Collision avoidance of hexacopter UAV based on lidar data in dynamic environment. Remote Sens. 2020, 12, 975. [Google Scholar] [CrossRef]
  11. Rouveure, R.; Tourrette, T.; Jaud, M.; Faure, P.; Monod, M. Design of lightweight airborne MMW radar for DEM generation. Simulation results. Robot. Auton. Syst. 2017, 96, 26–40. [Google Scholar] [CrossRef]
  12. Minaeian, S.; Liu, J.; Son, Y.J. Effective and efficient detection of moving targets from a UAV’s camera. IEEE Trans. Intell. Transp. Syst. 2018, 19, 497–506. [Google Scholar] [CrossRef]
  13. LeCun, Y.; Bengio, Y.; Hinton, G. Deep learning. Nature 2015, 521, 436–444. [Google Scholar] [CrossRef] [PubMed]
  14. Singla, A.; Padakandla, S.; Bhatnagar, S. Memory-based deep reinforcement learning for obstacle avoidance in UAV with limited environment knowledge. IEEE Trans. Intell. Transp. Syst. 2019, 22, 107–118. [Google Scholar] [CrossRef]
  15. Yang, X.; Luo, H.C.; Wu, Y.H.; Gao, Y.; Liao, C.Y.; Cheng, K.T. Reactive obstacle avoidance of monocular quadrotors with online adapted depth prediction network. Neurocomputing 2019, 325, 142–158. [Google Scholar] [CrossRef]
  16. Zhang, S.; Cai, C.; Li, J.; Sun, T.; Liu, X.; Tian, Y.; Xue, X. The airflow field characteristics of the unmanned agricultural aerial system on oilseed rape (Brassica napus) canopy for supplementary pollination. Agronomy 2021, 11, 2035. [Google Scholar] [CrossRef]
  17. Tang, Q.; Zhang, R.; Chen, L.; Xu, G.; Deng, W.; Ding, C.; Xu, M.; Yi, T.; Wen, Y.; Li, L. High-accuracy, high-resolution downwash flow field measurements of an unmanned helicopter for precision agriculture. Comput. Electron. Agric. 2020, 173, 105390. [Google Scholar] [CrossRef]
  18. Tang, Q.; Zhang, R.; Chen, L.; Deng, W.; Xu, M.; Xu, G.; Li, L.; Hewitt, A. Numerical simulation of the downwash flow field and droplet movement from an unmanned helicopter for crop spraying. Comput. Electron. Agric. 2020, 174, 105468. [Google Scholar] [CrossRef]
  19. Xue, X.; Tu, K.; Qin, W.; Lan, Y.; Zhang, H. Drift and deposition of ultra-low altitude and low volume application in paddy field. Int. J. Agric. Biol. Eng. 2014, 7, 23. [Google Scholar] [CrossRef]
  20. Wang, C.; Zeng, A.; He, X.; Song, J.; Herbst, A.; Gao, W. Spray drift characteristics test of unmanned aerial vehicle spray unit under wind tunnel conditions. Int. J. Agric. Biol. Eng. 2020, 13, 13–21. [Google Scholar] [CrossRef]
  21. Liang, Z.; Fan, G.Q.; Wang, G.M.; Ding, H.; Zhang, X.H. Distribution model of wind-stressed droplet deposition based on bimodal distribution. Trans. Chin. Soc. Agric. Mach. 2020, 51, 28–37. (In Chinese) [Google Scholar] [CrossRef]
  22. Kharim, M.N.A.; Wayayok, A.; Mohamed Shariff, A.R.; Abdullah, A.F.; Husin, E.M. Droplet deposition density of organic liquid fertilizer at low altitude UAV aerial spraying in rice cultivation. Comput. Electron. Agric. 2019, 167, 105045. [Google Scholar] [CrossRef]
  23. Chen, S.D.; Lan, Y.B.; Li, J.Y.; Zhou, Z.Y.; Jin, J.; Liu, A.M. Effect of spray parameters of small unmanned helicopter on distribution regularity of droplet deposition in hybrid rice canopy. Trans. Chin. Soc. Agric. Eng. 2016, 32, 40–46. (In Chinese) [Google Scholar] [CrossRef]
  24. Pan, Z.; Lie, D.; Qiang, L.; Shaolan, H.; Shilai, Y.; Yande, L.; Yongxu, Y.; Haiyang, P. Effects of citrus tree-shape and spraying height of small unmanned aerial vehicle on droplet distribution. Int. J. Agric. Biol. Eng. 2016, 9, 45. [Google Scholar] [CrossRef]
  25. Zhang, Z.Y.; Cao, Y.F.; Ding, M.; Zhuang, L.K.; Tao, J. Monocular vision based obstacle avoidance trajectory planning for Unmanned Aerial Vehicle. Aerosp. Sci. Technol. 2020, 106, 106199. [Google Scholar] [CrossRef]
  26. Lan, Y.B.; Wang, L.L.; Zhang, Y.L. Application and prospect on obstacle avoidance technology for agricultural UAV. Trans. Chin. Soc. Agric. Eng. 2018, 34, 104–113. (In Chinese) [Google Scholar] [CrossRef]
  27. Shibbir, A.; Huang, X.; Faheem, M.; Qiu, B.J. Stability analysis of a sprayer UAV with a liquid tank with different outer shapes and inner structures. Agriculture 2022, 12, 379. [Google Scholar] [CrossRef]
  28. Shibbir, A.; Qiu, B.J.; Fiaz, A.; Kong, C.W.; Huang, X. A state-of-the-art analysis of obstacle avoidance methods from the perspective of an agricultural sprayer UAV’s operation scenario. Agronomy 2021, 11, 1069. [Google Scholar] [CrossRef]
  29. Yuan, J.; Zhao, X.X.; Li, M.; Yan, X.H.; Liu, X.M. Design and test of high clearance boom-tunnel type sprayer. Trans. Chin. Soc. Agric. Eng. 2015, 31, 60–68. (In Chinese) [Google Scholar] [CrossRef]
  30. Wang, B.; Zhang, D.X.; Yang, L.; Wang, L.J. Gate-type spray system of high-frame corn spayer. Trans. Chin. Soc. Agric. Mach. 2014, 45, 104–111. (In Chinese) [Google Scholar] [CrossRef]
  31. Huang, X.; Dong, X.Y.; Ma, J.; Liu, K.; Ahmed, S.; Lin, J.L.; Ahmad, F.; Qiu, B.J. Evaluation and experiment of flight parameter quality of the plant protection uav based on laser tracker. Agriculture 2021, 11, 628. [Google Scholar] [CrossRef]
  32. Jin, Y.K.; Xue, X.Y.; Qin, W.C.; Sun, Z. Performance test of electric powered single-rotor UAV for plant protection. J. Chin. Agric. Mech. 2019, 40, 56–61. (In Chinese) [Google Scholar] [CrossRef]
  33. NY/T 3213-2023; Technical Specification of Quality Evaluation for Crop Protection UAS. Ministry of Agriculture of the People’s Republic of China: Beijing, China, 2023.
  34. Wen, S.; Han, J.; Ning, Z.H.; Lan, Y.B.; Yin, X.C.; Zhang, J.T.; Ge, Y.F. Numerical analysis and validation of spray distributions disturbed by quad-rotor drone wake at different flight speeds. Comput. Electron. Agric. 2019, 166, 105036. [Google Scholar] [CrossRef]
  35. Zheng, Y.; Yang, S.; Liu, X.; Wang, J.; Norton, T.; Chen, J.; Tan, Y. The computational fluid dynamic modeling of downwash flow field for a six-rotor UAV. Front. Agric. Sci. Eng. 2018, 5, 159–167. [Google Scholar] [CrossRef]
  36. Faiçal, B.S.; Freitas, H.; Gomes, P.H.; Mano, L.Y.; Pessin, G.; de Carvalho, A.C.P.L.; Krishnamachari, B.; Ueyama, J. An adaptive approach for UAV-based pesticide spraying in dynamic environments. Comput. Electron. Agric. 2017, 138, 210–223. [Google Scholar] [CrossRef]
  37. Zhang, Z.H.; Zeng, R.H.; Lai, Q.H.; Yuan, S.; Shen, S.Y.; Yang, L. Investigation of effects of downwash airflow field on droplet motion characteristics of small plant protection unmanned aerial vehicles. Trans. Chin. Soc. Agric. Mach. 2023, 54, 208–216. (In Chinese) [Google Scholar] [CrossRef]
  38. Huang, X.; Dong, X.; Ma, J.; Liu, K.; Ahmed, S.; Lin, J.; Qiu, B. The Improved A* obstacle avoidance algorithm for the plant protection UAV with millimeter wave radar and monocular camera data fusion. Remote Sens. 2021, 13, 3364. [Google Scholar] [CrossRef]
  39. Yang, F.B.; Xue, X.Y.; Zhang, L.; Sun, Z. Numerical simulation and experimental verification on downwash air flow of six-rotor agricultural unmanned aerial vehicle in hover. Int. J. Agric. Biol. Eng. 2017, 10, 41–53. [Google Scholar] [CrossRef]
  40. Tang, Y.; Hou, C.J.; Luo, S.M.; Lin, J.T.; Yang, Z.; Huang, W.F. Effects of operation height and tree shape on droplet deposition in citrus trees using an unmanned aerial vehicle. Comput. Electron. Agric. 2018, 148, 1–7. [Google Scholar] [CrossRef]
  41. Hou, C.J.; Tang, Y.; Luo, S.M.; Lin, J.T.; He, Y.; Zhuang, J.J.; Huang, W.F. Optimization of control parameters of droplet density in citrus trees using UAVs and the Taguchi method. Int. J. Agric. Biol. Eng. 2019, 12, 1–9. [Google Scholar] [CrossRef]
  42. Wang, C.L.; He, X.K.; Bonds, J.; Qi, P.; Yang, Y.; Gao, W.L. Effect of downwash airflow field of 8-rotor unmanned aerial vehicle on spray deposition distribution characteristics under different flight parameters. Smart Agric. 2020, 2, 124–136. (In Chinese) [Google Scholar] [CrossRef]
  43. Yang, Z.L.; Ge, L.Z.; Qi, L.J.; Cheng, Y.F.; Wu, Y.L. Influence of UAV rotor down-wash airflow on spray width. Trans. Chin. Soc. Agric. Mach. 2018, 49, 116–122. (In Chinese) [Google Scholar] [CrossRef]
  44. Chen, S.Y.; Gary, D.D. Lattice boltzmann method for fluid flows. Annu. Rev. Fluid. Mech. 1998, 30, 329–364. [Google Scholar] [CrossRef]
  45. Yu, D.Z.; Mei, R.W.; Luo, L.S.; Shyy, W. Viscous flow computations with the method of lattice Boltzmann equation. Prog. Aerosp. Sci. 2003, 39, 329–367. [Google Scholar] [CrossRef]
  46. Wen, S.; Han, J.; Lan, Y.B.; Yin, X.C.; Lu, Y.H. Influence of wing tip vortex on drift of single rotor plant protection unmanned aerial vehicle. Trans. Chin. Soc. Agric. Mach. 2018, 49, 127–137. (In Chinese) [Google Scholar] [CrossRef]
  47. Huang, X.; Wang, W.; Li, Z.; Wang, Q.; Zhu, C.; Chen, L. Design method and experiment of machinery for combined application of seed, fertilizer and herbicide. Int. J. Agric. Biol. Eng. 2019, 12, 63–71. [Google Scholar] [CrossRef]
  48. Martinez-Guanter, J.; Agüera, P.; Agüera, J.; Pérez-Ruiz, M. Spray and economics assessment of a UAV-based ultra-low-volume application in olive and citrus orchards. Precis. Agric. 2020, 21, 226–243. [Google Scholar] [CrossRef]
  49. Appah, S.; Jia, W.; Ou, M.; Wang, P.; Asante, E.A. Analysis of potential impaction and phytotoxicity of surfactant-plant surface interaction in pesticide application. Crop Prot. 2020, 127, 104961. [Google Scholar] [CrossRef]
  50. Faiçal, B.S.; Pessin, G.; Filho, G.P.R.; Furquim, G.; de Carvalho, A.C.P.L.; Ueyama, J. Exploiting evolution on UAV control rules for spraying pesticides on crop fields. In International Conference on Engineering Applications of Neural Networks; Springer International Publishing: Cham, Switzerland, 2014; pp. 49–58. [Google Scholar] [CrossRef]
  51. Zhang, H.Y.; Lan, Y.B.; Wen, S.; Xu, T.Y.; Yu, F.H. Research progress in rotor airflow model of plant protection UAV and droplet motion mechanism. Trans. Chin. Soc. Agric. Eng. 2020, 36, 1–12. (In Chinese) [Google Scholar] [CrossRef]
  52. GB/T 20183.1-2024; Equipment for Crop Protection—Spraying Equipment—Part 1: Test Methods for Sprayer Nozzles. National Standards of People’s Republic of China: Beijing, China, 2024.
  53. GB/T 40331.1-2021; Crop Protection Equipment—Spray Deposition Test for Field Crop—Part 1: Measurement in a Horizontal Plane. Standards of People’s Republic of China: Beijing, China, 2021.
  54. GB/T 40331.2-2021; Crop Protection Equipment—Spray Deposition Test for Field Crop—Part 2: Measurement in a Crop. Standards of People’s Republic of China: Beijing, China, 2021.
  55. NY/T 4258-2022; Crop Protection UAS—Spraying Quality. Ministry of Agriculture and Rural Affairs: Beijing, China, 2022.
  56. Daniel, E.M. A fluorescent imaging technique for quantifying spray deposits on plant leaves. At. Spray. 2014, 24, 367–373. [Google Scholar] [CrossRef]
  57. Martin, D.E.; Latheef, M.A. Aerial electrostatic spray deposition and canopy penetration in cotton. J. Electrost. 2017, 90, 38–44. [Google Scholar] [CrossRef]
  58. Zhu, H.; Salyani, M.; Fox, R.D. A portable scanning system for evaluation of spray deposit distribution. Comput. Electron. Agric. 2011, 76, 38–43. [Google Scholar] [CrossRef]
  59. Cerruto, E.; Manetto, G.; Longo, D.; Failla, S.; Papa, R. A model to estimate the spray deposit by simulated water sensitive papers. Crop Prot. 2019, 124, 104861. [Google Scholar] [CrossRef]
  60. Lin, J.L.; Ma, J.; Liu, K.; Huang, X.; Xiao, L.P.; Ahmed, S.; Dong, X.Y.; Qiu, B.J. Development and test of an autonomous air-assisted sprayer based on single hanging track for solar greenhouse. Crop Prot. 2021, 142, 105502. [Google Scholar] [CrossRef]
  61. MH/T 1040-2011; Determining Application Rates and Distribution Patterns from Aerial Application Equipment. China Civil Aviation Science and Technology Research Institute: China, 2011.
  62. Zhang, S.; Xue, X.; Sun, Z.; Zhou, L.; Jin, Y. Downwash distribution of single-rotor unmanned agricultural helicopter on hovering state. Int. J. Agric. Biol. Eng. 2017, 10, 14–24. [Google Scholar] [CrossRef]
  63. Wang, L.; Zhang, Q.; Hou, Q.H.; Chen, D.; Wang, S.M. Vertical distribution law of six-rotor plant protection UAV based on multi-feature parameters. Trans. Chin. Soc. Agric. Eng. 2022, 53, 75–83. (In Chinese) [Google Scholar] [CrossRef]
  64. Kutz, B.M.; Keßler, M.; Krämer, E. Experimental and numerical examination of a helicopter hovering in ground effect. CEAS Aeronaut. J. 2013, 4, 397–408. [Google Scholar] [CrossRef]
  65. Mylapore, A.R.; Schmitz, F.H. An Experimental Investigation of Ground Effect on a Quad Tilt Rotor in Hover. J. Am. Helicopter Soc. 2015, 60, 1–14. [Google Scholar] [CrossRef]
  66. Li, M.Z.; Li, X.Z.; Yang, W.; Hao, Z.Y. Design and experiment of UAV spray quality detection system. Trans. Chin. Soc. Agric. Mach. 2021, 52, 36–42. (In Chinese) [Google Scholar] [CrossRef]
  67. Jensen, P.K.; Lund, I. Static and dynamic distribution of spray from single nozzles and the influence on biological efficacy of band applications of herbicides. Crop Prot. 2006, 25, 1201–1209. [Google Scholar] [CrossRef]
  68. Altieri, A.L.; Cryer, S.A. Break-up of sprayed emulsions from flat-fan nozzles using a hole kinematics model. Biosyst. Eng. 2018, 169, 104–114. [Google Scholar] [CrossRef]
  69. Musiu, E.M.; Qi, L.; Wu, Y. Evaluation of droplets size distribution and velocity pattern using Computational Fluid Dynamics modelling. Comput. Electron. Agric. 2019, 164, 104886. [Google Scholar] [CrossRef]
  70. Wu, C.D.; Du, Y.S.; Zhang, W.; Zhang, B.; Chen, Z.G. Study on the deposit distribution of the modulated variable rate spray system. Trans. Chin. Soc. Agric. Mach. 2007, 38, 70–73. (In Chinese) [Google Scholar] [CrossRef]
Figure 1. Diagram of the UAV structure and obstacle avoidance bypass area: (a) Sketch of UAV structure; (b) rotation direction of rotors; (c) obstacle avoidance path and bypass area.
Agronomy 14 02002 g001
Figure 2. Schematic diagram of relationship between spray angle and obstacle avoidance path.
Agronomy 14 02002 g002
Figure 3. Relative position measurement of the UAV and obstacles.
Agronomy 14 02002 g003
Figure 4. Simplified UAV model and computational domain.
Agronomy 14 02002 g004
Figure 5. Resolution discretization of computational domain.
Agronomy 14 02002 g005
Figure 6. Wind speed sampling point layout diagram.
Agronomy 14 02002 g006
Figure 7. Indoor experiment platform of rotor wind speed: (a) Experiment platform; (b) UAV; (c) Kestrel 4000.
Agronomy 14 02002 g007
Figure 8. Different spray patterns of side spray device: (a) Pattern 1; (b) pattern 2; (c) pattern 3; (d) pattern 4.
Agronomy 14 02002 g008
Figure 9. Side spray device experiment: (a) Non-crop simulation environment experiment; (b) field experiment.
Agronomy 14 02002 g009
Figure 10. Relative position measurement results: (a) Relative position; (b) spray angle required for side spray device nozzle.
Agronomy 14 02002 g010
Figure 11. Nozzle of the side spray device: (a) Spray boundary shrinkage; (b) nozzle object and structure.
Agronomy 14 02002 g011
Figure 12. Simulation value of wind speed at different vertical distance from the rotor.
Agronomy 14 02002 g012
Figure 13. Rotor wind field distribution of the UAV: (a) Tip vortex, spiral vortex, and discretization; (b) contraction and diffusion of rotor wind field.
Agronomy 14 02002 g013
Figure 14. Side spray device spatial layout diagram.
Agronomy 14 02002 g014
Figure 15. Separation and counting of droplets: (a) Original WSP; (b) individual droplet; (c) weakly adherent droplets; (d) strongly adherent droplets.
Agronomy 14 02002 g015
Figure 16. Coverage density of droplet at each sampling point for different spray patterns of the side spray device.
Agronomy 14 02002 g016
Table 1. Parameters of the UAV.
ParameterValue
PhysicalSelf-weight (kg)8
Diagonal wheelbase (mm)1200
Propeller (mm)736.6
FlightMaximum takeoff weight (kg)21.5
Flight altitude (m)0 to 20
Flight speed (m·s−1)1.0 to 8.0
Obstacle avoidanceObstacle avoidance modeHover; detour
Minimum obstacle diameter (mm)30
Maximum obstacle avoidance flight speed (m·s−1)3
SprayTank volume (L)10
Spraying volume (L·ha−1)12 to 18
Nozzle typeHollow-cone nozzle
NozzleNozzle modelLechler-TR60
Tip005–05
Spray angle (°)60
MaterialCeramic
Spraying pressure (MPa)0.2–2
Filter (mesh)60
Table 2. Parameters of Leica AT960-LR laser tracker measurement system.
ParameterValue (Work with Leica 38.1 mm Target Ball)
Maximum measuring distance (m)160
Distance accuracy (µm·m−1)0.5
Horizontal rotation angle (°)0 to 360
Vertical rotation angle (°)−145 to +145
Angle accuracy (µm·m−1)±15 + 6
Maximum sampling frequency (Hz)1000
Operating temperature (°C)0 to 40
Table 3. Flight altitude and speed combination.
CombinationAltitude (m)Speed (m·s−1)
h1s11.01.0
h1s21.02.0
h1s31.03.0
h2s12.01.0
h2s22.02.0
h2s32.03.0
h3s13.01.0
h3s23.02.0
h3s33.03.0
Table 4. Simulation environment parameters of wind field simulation.
ParameterValue
Pressure outlet of calculation domain (MPa)0
Turbulence modelLES+ wall function
Gravitational acceleration (m·s−2)9.81
Air density (kg·m−3)1.225
Air dynamic viscosity (Pa·s)1.7894 × 10⁻⁵
Air specific heat capacity (J·(kg·K)−1)1006.43
Air thermal conductivity (W·(m·K)−1)0.0243
Reference temperature (K)288.15
Table 5. Technical parameters of Lechler TR 80 nozzle.
ParametersValue
Nozzle tip005–05
Spray angle (°)80
MaterialCeramic
Pressure (MPa)0.3–2
Filter (mesh)60
Table 6. Wind speed of simulation and test in Y-Z plane at X of 0.425 m.
Distance from Rotor (m)Sampling Line ASampling Line BSampling Line CSampling Line DSampling Line E
Simulation (m·s−1)Test
(m·s−1)
Error
(%)
Simulation (m·s−1)Test
(m·s−1)
Error (%)Simulation (m·s−1)Test
(m·s−1)
Error (%)Simulation (m·s−1)Test
(m·s−1)
Error (%)Simulation (m·s−1)Test
(m·s−1)
Error (%)
0.532.87.16.568.32.42.29.17.77.26.91.21.19.1
1.02.22.14.85.65.19.86.96.64.54.94.58.91.31.26.8
1.51.41.37.75.2543.53.29.47.36.95.84.74.39.3
2.01.21.19.14.13.87.94.64.374.84.48.71.91.85.6
2.50.90.812.54.63.917.92.62.218.22.72.412.510.912.5
3.01.10.922.22.62.123.83.32.817.91.31.118.20.90.728.6
Table 7. Average coverage density of droplets for different spray patterns of the side spray device.
Flight Parameter CombinationsAverage Coverage Density of Droplets (Drops·cm−2)
Pattern 1Pattern 2Pattern 3Pattern 4
h1s136.037.4240.1030.30
h2s226.3512.5830.4727.67
h3s320.0511.8423.4922.17
Table 8. Spray experiment results of side spray device in non-crop simulation environment.
Flight Parameter CombinationDistribution Uniformity of Droplets (%)Effective Swath
Width (m)
Group AGroup BGroup AGroup B
h1s187.1543.991.531.30
h1s260.9147.481.701.55
h1s350.4321.301.821.58
h2s151.7228.192.952.18
h2s232.2545.903.353.15
h2s337.8230.793.653.05
h3s135.2152.274.303.90
h3s259.5056.964.754.15
h3s352.0036.364.904.51
Table 9. Field spray experiment data of the side spray device.
Flight Parameter CombinationRepeatFlight Altitude (m)Flight Speed (m·s−1)Distribution Uniformity of Droplets (%)Average Distribution Uniformity (%)Effective Swath Width (m)Average Effective Swath Width (m)
h1s110.981.1289.0590.251.211.31
21.050.9590.511.36
31.021.0391.201.35
h1s211.151.9880.1380.701.721.73
21.122.1683.351.66
30.892.0578.621.81
h1s311.082.9563.0960.852.011.86
21.143.1260.911.86
31.223.0858.561.71
h2s112.151.2258.6563.082.532.55
22.231.0870.772.72
31.981.1559.812.39
h2s212.101.8935.7537.944.113.72
22.211.9639.013.79
32.082.2139.153.26
h2s312.233.3334.7339.433.923.48
22.173.0840.113.20
32.092.9543.443.31
h3s113.220.8958.6955.923.993.97
23.160.9652.134.15
32.811.0256.953.76
h3s213.262.5130.2930.375.154.75
22.962.1138.154.78
32.881.8622.664.31
h3s313.412.7932.5135.615.255.08
23.193.2239.304.86
33.293.1835.025.12
Table 10. Regression analysis of distribution uniformity of droplets and effective swath width.
Variance SourceDistribution Uniformity of Droplets (%)Effective Swath
Width (m)
Regression CoefficientStandard ErrorRegression CoefficientStandard Error
Intercept183.31514.736−1.5030.621
Altitude a−61.77010.1771.3930.429
Speed s−44.01511.5161.5490.485
Altitude·Speed a·s1.1781.8590.0960.078
Altitude2 a29.8402.425−0.0340.102
Speed2 s27.3962.553−0.3470.108
Table 11. ANOVA results of the regression analysis.
Variance SourceDistribution Uniformity
of Droplets (%)
Effective Swath
Width (m)
Sum of SquaresDegrees of FreedomMean SquareSum of SquaresDegrees of FreedomMean Square
Regression313.372652.22991,297.489615,216.248
Residual1.760210.084990.2712147.156
Pre-correction315.13227-92,287.76027-
Post-correction45.71026-10,883.13526-
Table 12. Results of spray experiment and relational model prediction.
GroupFlight Altitude (m)Flight Speed (m·s−1)Distribution Uniformity
of Droplets (%)
Effective Swath
Width (m)
ExperimentPredictedError (%)ExperimentPredictedError (%)
11.51.557.5766.0714.762.512.279.56
22.51.549.0445.437.364.173.6711.99
31.52.547.2753.4112.992.412.576.64
42.52.536.1833.946.194.484.079.15
Disclaimer/Publisher’s Note: The statements, opinions and data contained in all publications are solely those of the individual author(s) and contributor(s) and not of MDPI and/or the editor(s). MDPI and/or the editor(s) disclaim responsibility for any injury to people or property resulting from any ideas, methods, instructions or products referred to in the content.

