Article

Influence of Climatic Parameters and Plant Morphological Characters on the Total Anthocyanin Content of Purple Maize (Zea mays L., PMV-581) Cob Core

by
Víctor Soto-Aquino
1,*,
Severo Ignacio-Cárdenas
2,
Anghelo Jhosepp Japa-Espinoza
2,
Ulda Campos-Félix
2,
Juanita Ciriaco-Poma
2,
Alex Campos-Félix
2,
Benancio Pantoja-Medina
3 and
Juan Z. Dávalos-Prado
4,*
1
Facultad de Ingeniería, Universidad Nacional Intercultural de la Selva Central Juan Santos Atahualpa, Chanachamayo T-123, Peru
2
Facultad de Ciencias Agrarias, Universidad Nacional Hermilio Valdizan, 850 Universitaria Avenue, Pillco Marca, Huánuco 10001, Peru
3
Facultad de Ciencias Agropecuarias, Universidad Nacional Daniel Alcides Carrión, Cerro de Pasco, Pasco 19001, Peru
4
Instituto de Química-Física “Blas Cabrera”-CSIC, Departamento Química Atmosférica y Clima, c/Serrano, 119-28006 Madrid, Spain
*
Authors to whom correspondence should be addressed.
Agronomy 2024, 14(9), 2021; https://doi.org/10.3390/agronomy14092021
Submission received: 7 August 2024 / Revised: 28 August 2024 / Accepted: 31 August 2024 / Published: 5 September 2024

Abstract

:
In this work, the inter-relationship among 10 morphological characters, 8 climatic parameters and the content of total anthocyanins in the cob core of PMV 581 purple maize, cultivated and produced in three different places in Huanuco–Peru region, has been reported. This study of morphological characters was carried out using standard descriptors, both for the plant and the cob. Data on climatic parameters were obtained from three meteorological stations near the test locations. The total anthocyanin content (Acy), expressed as the glucoside-3-cyanidin concentration, has been determined by the differential pH method. From the statistical treatment of the data obtained, the following descriptors were found to be the most representative, given that they are poorly correlated with each other, but in general, depending on the localities: i/ (morphological) grain weight per cob GWC, plant length PL and cob core weight CCW; ii/ (climatic) minimum temperature Tmin, wind speed v and relative humidity RH. Between both types of descriptors, the best correlations occur for (CCW vs. Tmin) and (GWC vs. v). On the other hand, the total anthocyanin content Acy correlates very well with the CCW and Tmin descriptors. So, the highest concentration of Acy (684.2 mg/100 g) and also the highest CCW (38.6 g/cob) have been obtained in cobs of Winchuspata (W-Q), the coldest (Tmin = 7.89 °C) of the considered localities. On the contrary, the lowest concentration of Acy (603.7 mg/100 g) and also the lowest CCW 25.4 g/cob) have been obtained in cobs of Pistaloli (P-SA), the warmest (Tmin = 19.96 °C) of the three locations. The highest GWC value (139.4 g/cob) has been obtained in cobs of Marabamba (M-Y) where the wind speed v (4.13 m/s) was the highest of the locations considered. On the contrary, the lowest value of GWC (79.6 g/cob) has been obtained for cobs of Pistaloli (P-SA) where v was the lowest (1.19 m/s). In this context, it is important to propose studies on climatic variations’ impact on different crop cycles, investigating how different agronomic management practices and the use of genetic identification/expression tools can optimize the anthocyanin production of purple maize, in order to facilitate the selection of new varieties for specific climatic conditions.

1. Introduction

Purple maize (Zea mays L. ssp. mays) is produced in several countries, for example, Peru, Bolivia, Ecuador and Mexico [1] on the American continent and China and India on the Asian continent. Peru is one of the main producing and exporting countries of this corn [2]. In 2021, Peruvian purple corn production reached ~20 Kton/ha and a cultivation area of ~4 Kha [3], which represents around 23% of the total corn production [2]. Its commercialization is in the form of grain, cob, flour, dye, among other products [4] and their export reached, in 2020, ~1.5 Kton compared to the ~1.1 Kton exported by Mexico [5], with the USA being the country with the highest demand.
Peruvian purple maize [6,7] was developed from the “k’culli” race [8,9,10], one of the 55 breeds that exist in the country [4,11]. Purple maize is part of the Peruvian Andean corn that belongs to the group of floury or starchy corns with a wide variety in color, shape and size [4]. The attractive and bright color tone of these corns, which vary from orange to purple [2,8,12,13], is mainly due to the content of anthocyanins and other compounds such as phenolics, other flavonoids, carotenoids, phytosterols, endosperm prolamin-zein, etc., [2,9,10,14].
Anthocyanins in purple maize are found in the form of acylated or simple anthocyanins and anthocyanidin glycosides that are formed by aglycones linked to sugars by β-glycosidic bonds [2,6,15]. Of the 27 identified anthocyanidins of plant origin [16], the most important are cyanidin, delphinidin, pelargonidin, peonidin, petunidin and malvidin [17,18], which in combination with different sugars, form around 700 types of anthocyanins [19]. In purple corn, they are found in a free or esterified form [2], mainly in the plant (up to 10 times more than in the rest [8]) and in the cob, although anthocyanins have also been found in flowers [2]. The cob includes core cobs (approx. 15% of the weight) and grains (approx. 85% of the weight). In both, the most important anthocyanin is cyanidin-3-glucoside [10,20] which is mainly concentrated in the aleurone layer [21]. In addition to this compound, cyanidin-3-dimalonylglucoside, pelargonidin-3-glucoside and peonidin-3-glucoside were also found. It is important to mention that both the accumulation and stability of anthocyanins are influenced by genetic, agronomic and environmental factors of the crop [2]. Particularly, climatic parameters influence the synthesis, accumulation and stability of both anthocyanins and other antioxidants. Thus, oxidative stress caused by tropospheric ozone increases the concentration of total phenols [22]. Low temperatures and UV radiation stimulate the biosynthesis and accumulation of anthocyanins [23] and these are more stable under acidic and low-temperature conditions [2]. As in all vegetable species, the response of purple corn to variations in climatic parameters is, therefore, unique [24].
Several studies report beneficial effects of anthocyanins. Thus, in plants themselves, they increase their resistance to thermal, water and salt stress [25]. They are sources of natural colorants [6,8,26]; used as dietary supplements, food additives [2,27], beverages [28] and bioactive compounds [29] with a wide variety of properties such as anti-inflammatory, anti-oxidant, antimutagenic, anticancer, anti-aging and antiangiogenesis; are neuro- and cardioprotective, nutraceutical, anti-obesity and antimicrobial; and contribute to hyperglycemia control and intestinal health improvement [15,18,30,31,32,33,34].
Despite the importance of purple maize consumption, synergistic studies that correlate the climatic factors of cultivation [35], morphological traits of plants and cobs and the content of bioactive compounds such as anthocyanins are rather scarce [2,36]. In addition, the literature also contains scarce systematic information on specific agronomic management practices that optimize anthocyanin production in purple maize. On the other hand, although it is known that anthocyanins act as effective antioxidants involved in abiotic/biotic stresses of plants (e.g., UV radiation, cold temperatures, etc.) and both biosynthetic and key regulatory genes have been isolated in many of them, including maize [22], understanding the corresponding mechanisms and also identifying genes related to anthocyanin biosynthesis under specific environmental conditions are still under investigation.
In this work, we hypothesized that climatic parameters and morphological traits are significantly related to the total anthocyanin content in PMV-581 purple corn. So, the aim of this work is to evaluate the relationships, effects, importance and representativeness among morphological descriptors (of plants and cobs), climatic descriptors and the total anthocyanin content (in cob cores) of PMV-581 purple maize, cultivated and produced in three locations (Pistaloli P-SA; Marabamba, M-Y; Winchuspata W-Q) with different and well-defined climatologies in Huánuco–Peru.
The results obtained will be used to analyze how different climatic parameters of a given location influence anthocyanin biosynthesis, which will allow us to identify morphological traits that best correlate with the anthocyanin content. In this way, we may be able to propose specific agronomic practices that optimize anthocyanin production in purple maize.

2. Materials and Methods

2.1. Location and Characteristics of the Localities

The experiments were carried out in three locations in the Huánuco–Peru region: Pistaloli (P-SA, Huamalíes province), Marabamba (M-Y, Huánuco province) and Winchuspata (W-Q, Pachitea province). Each location is located in a typical region of Peru [37]. Thus, P-SA (9°16′45″ S, 76°23′11″ W and 953 m a.s.l.) is located in the Selva Alta region, characterized by a humid climate with intense heat during the day and cool at night (typical of a tropical rainforest). M-Y (9°56′36″ S, 76°15′14″ W and 1994 m a.s.l.) is in the Yungas region, characterized by a hot–dry or hot semi-arid climate, with sunshine almost all year round and a varied natural and cultivated vegetation. W-Q (9°53′47″ S, 75°59′22″ W and 2498 m a.s.l.) is in the Quechua region, characterized by a temperate–dry or oceanic climate. Thus, the selection of the three locations is justified by the climatic diversity of the Huánuco region where each considered location presents unique characteristics with microclimates that allow evaluating their relationships with morphological traits and the anthocyanin content of PMV-58 purple maize.

2.2. Biological Materials

The biological material consisted of purple maize plants identified with the classic genetic improvement registration code PMV-581 [38], a cultivar improved by the National Agrarian University La Molina [39], recommended for sowing in edaphoclimatic conditions of the low-to-middle mountains and coast of Peru. The PMV-581 genotype was obtained from the “Morado de Caraz” variety, derived in turn from an ancestral line called k’culli (in the Quechua language), black in Spanish and purple corn in English, although according to Baker [40], there are considerations that the appropriate name would be purple maize due to the cultural roots of purple maize in Peru. In this work, the most representative morphological traits of agronomic and commercial importance of PMV-581 purple maize were select in terms of the plant architecture and its anthocyanin content. The advantages and disadvantages in the morphology and anthocyanin content of PMV-581, compared to other genotypes, are discussed in the Section 4.

2.3. Characteristics of the Cultivation Plots

The crops in the three locations considered were managed in agricultural plots under a completely random design. The crop cycle was six months (from May to October 2019). In each plot, a population of 160 plants was managed with a density of ~3 plants/m2. The plants were grouped into four test units, each formed by four furrows separated from each other at 0.90 m and a plant-to-plant distance of 0.40 m. Plant nutrition and agronomic management were standard in all test units. Figure 1 presents photographs of the test plot located in P-SA and the PMV-581 purple maize cobs from the three study locations.

2.4. Methodology

The relationships among the morphological traits, climatic parameters, and anthocyanin content (in cob cores) of PMV-581 purple maize, coming from three test sites, were analyzed. Ten morphological traits were considered. Four were plant traits: plant length (PL/cm), number of nodes per stem (NPS), node diameter (ND/cm) and cob insertion length (CIL/cm); and six were cob and grain traits: cob length (CL/cm), cob diameter (CD/cm), rachis diameter (RD/cm), total cob weight (TCW/g), grain weight per cob (GWC/g) and cob core weight (CCW/g). Morphological trait measurements were made on a random sample of eight plants from each test plot, following the procedures established by the International Board for Plant Genetic Resources and International Maize and Wheat Improvement Center [41]. The plant length was measured with a 4 m telescopic scope (precision ± 0.5 mm) from the ground to the base of the spike, after the milky stage of the plants; the cob insertion length was measured from the ground to the base of the first cob using the same telescopic scope and at the same stage of development of the plants. Cob traits were measured on one cob per plant, chosen at random, using a Vernier caliper with a precision of ±0.05 mm and an electronic balance with a precision of ±0.05 g.
Eight climatic parameters were measured: the minimum temperature (Tmin/°C), maximum temperature (Tmax/°C), average temperature (Tm/°C), maximum precipitation (pmax/mm), accumulated precipitation (pac/mm), average relative humidity per month (RH/%), wind speed [v/(m/s)] and hours of sunlight per day (Lsun/W/m2). These measurements were carried out, for the crop cycle, at three stations of the National Meteorology and Hydrology Service of Peru (SENAMHI): Aucayacu, Huánuco and Chaglla, respectively very close to the P-SA, M-Y and W-Q plots. The climatic parameters considered here were those usually reported in the literature, several of which are closely related to conditions that produce stress in the plant. See the discussion in the Section 4.
To study the total anthocyanin content, a simple random sampling of 10 cobs from each plot was carried out [42]. The cobs, without pest or disease attacks, were dried under diffuse light until the grains reached a 14% average moisture content, measured with a TwistGrain pro digital hygrometer. A sample of 100 g of cob core, from dried cobs, was ground and sieved (1 mm sieve), according to the recommendations of Corona-Terán et al. [43]. The powdered sample was dissolved in 20% ethanol at a sample–solvent ratio of 2:100 for 2 h at 50 °C. The extracts obtained were again diluted in distilled water at 3500 RPM for 10 min. The supernatant was separated and aliquots were taken to be stored, under darkness, in buffered solutions at pHs 1 and 4.5, for 10 min. The evaluation of the total anthocyanin content, Acy, was carried out using the differential pH method according to the recommendations of Lee et al. [44] and Giusti et al. [45], using a UV visible spectrophotometer (UVmini-1240 230V CE) in the range of 190 to 1100 nm. This method is considered one of the most reliable for quantifying the total monomeric anthocyanins [15]. Since cyanidin-3-glucoside is the most abundant anthocyanin in purple maize [18], the total monomeric anthocyanin content was expressed in milligrams of cyanidin-3-glucoside per 100 g of cob core (mg/100 g).

2.5. Statistical Methods

The statistical treatment of the morphological traits of PVM-581 purple maize and the climatic parameters of the locality was carried out through an analysis of variance (ANOVA). A linear correlation analysis was performed for the morphological traits and climatic factors (from the locations considered), which were significant for ANOVA. The corresponding Pearson correlation coefficients allowed us to establish the importance of the analyzed variables. Then, a multiple linear regression analysis [46,47] was carried out, between the morphological descriptors and the most significant climatic parameters. Finally, the linear regression analysis was performed for the anthocyanin content, both with the morphological and climatic descriptors. It is important to mention that the principal component analysis (PCA) was excluded, since although it allows reducing the dimensionality of the data and identifying patterns, it does not provide direct information on the causal relationships among the variables. The use of non-linear models was also excluded; these models can describe more complex relationships, but require a larger amount of data and are more difficult to interpret.
All the considered analyses in this work were performed using the statistical software R version 4.3.1 from the R Foundation for Statistical Computing and the GGally package version 2.2.0 [48].

3. Results

3.1. Morphological Characteristics of the Plant and Cob of PMV-581 Purple Maize

Table 1 and Figure S1 of the Supplementary Material show the statistics of the morphological characters of PVM-581 purple maize in the three locations considered. We can see that, taking into account the asymmetry values and Kurtosis coefficients, the data of the morphological characters present normal distributions, although with slight biases to the left (negative asymmetry) or to the right (positive asymmetry). Regarding the highest averages of the 10 morphological characters, i/ two of them (RD and CCW) were obtained in W-Q, ii/ the remaining 8 in M-Y and iii/ none in P-SA.
From the variance analysis, two morphological characters were non-significant: LIM and ND with p values equal to 0.1849 and 0.0768, respectively. On the other hand, and according to the considerations of [49], five characters, PL, CD, CL, TCW and GWC, varied with a high dependence on the locality factor ( adjusted   R 2 ≥ 0.60), while three characters, RD, NPS and CCW, varied with less dependence ( adjusted   R 2 ≤ 0.50).
Table 2 shows Pearson correlation coefficients for the six most significant morphological characters and, except for CCW, they are strongly dependent on the three considered localities. We can appreciate low values of the Pearson coefficients (corrtot| ≤ 0.459) in the correlations involving PL and CCW, so both behave practically as independent morphological characters. On the contrary, the four remaining morphological characters are well correlated (corrtot| ≥ 0.881) in the three locations: CD, CL, TCW and GWC.
Consequently, it can be considered of GWC and PL as representative characters or morphological descriptors, poorly correlated with each other, but with strong dependence on the considered locations. However, since the evaluation of anthocyanins concerns the cob core, we consider GWC, PL and CCW as the most representative morphological characters or simply morphological descriptors of PM-581 purple maize.

3.2. Climatic Parameters of the PMV-581 Purple Maize Growing Locations

Table 3 and Figure S2 of the Supplementary Material show the statistics of eight climatic parameters in the three locations considered. Taking into account asymmetry coefficients, we can see that the data of these parameters present normal distributions with biases to both the left and the right, except the Tmax, which presents a platykurtic distribution. According to the coefficients of variation (CV), those that presented the highest values, with respect to their averages, were pmax and pac precipitations.
Regarding the highest averages of the eight climatic parameters, i/ five of them (Tmin, Tmax, Tm, pmax and pac) are obtained in P-SA, ii/ two parameters (v and Lsun) in M-Y and iii/ RH in W-P. In this last location, the lowest values of the temperatures, Tmin, Tmax and Tm, also occur.
The results of the variance analysis (a model similar to that used for morphological characters) showed that the Lsun parameter was not significant for the three meteorological stations (p = 0.226), while the Tmax and pac parameters were significant (p ≈ 0.0004), but their locality dependence coefficients were low ( adjusted   R 2 ≤ 0.5). On the contrary, the other parameters (Tmin and Tm, RH, v and pmax) were significant (p < 0.001) and strongly dependent on the locality ( adjusted   R 2 > 0.5) [49]. On the other hand, and according to Pearson’s linear correlation coefficients (see Table 4), there is a good correlation between Tmin and Tm (corrtot = 0.878) and between v and pmax (corrtot = −0.776). RH behaved more like an independent variable. Consequently, it can be considered that Tmin, v and RH are the most representative climatic parameters (or simply climatic descriptors) given that they are the poorly correlated parameters and strongly dependent on the study locations.

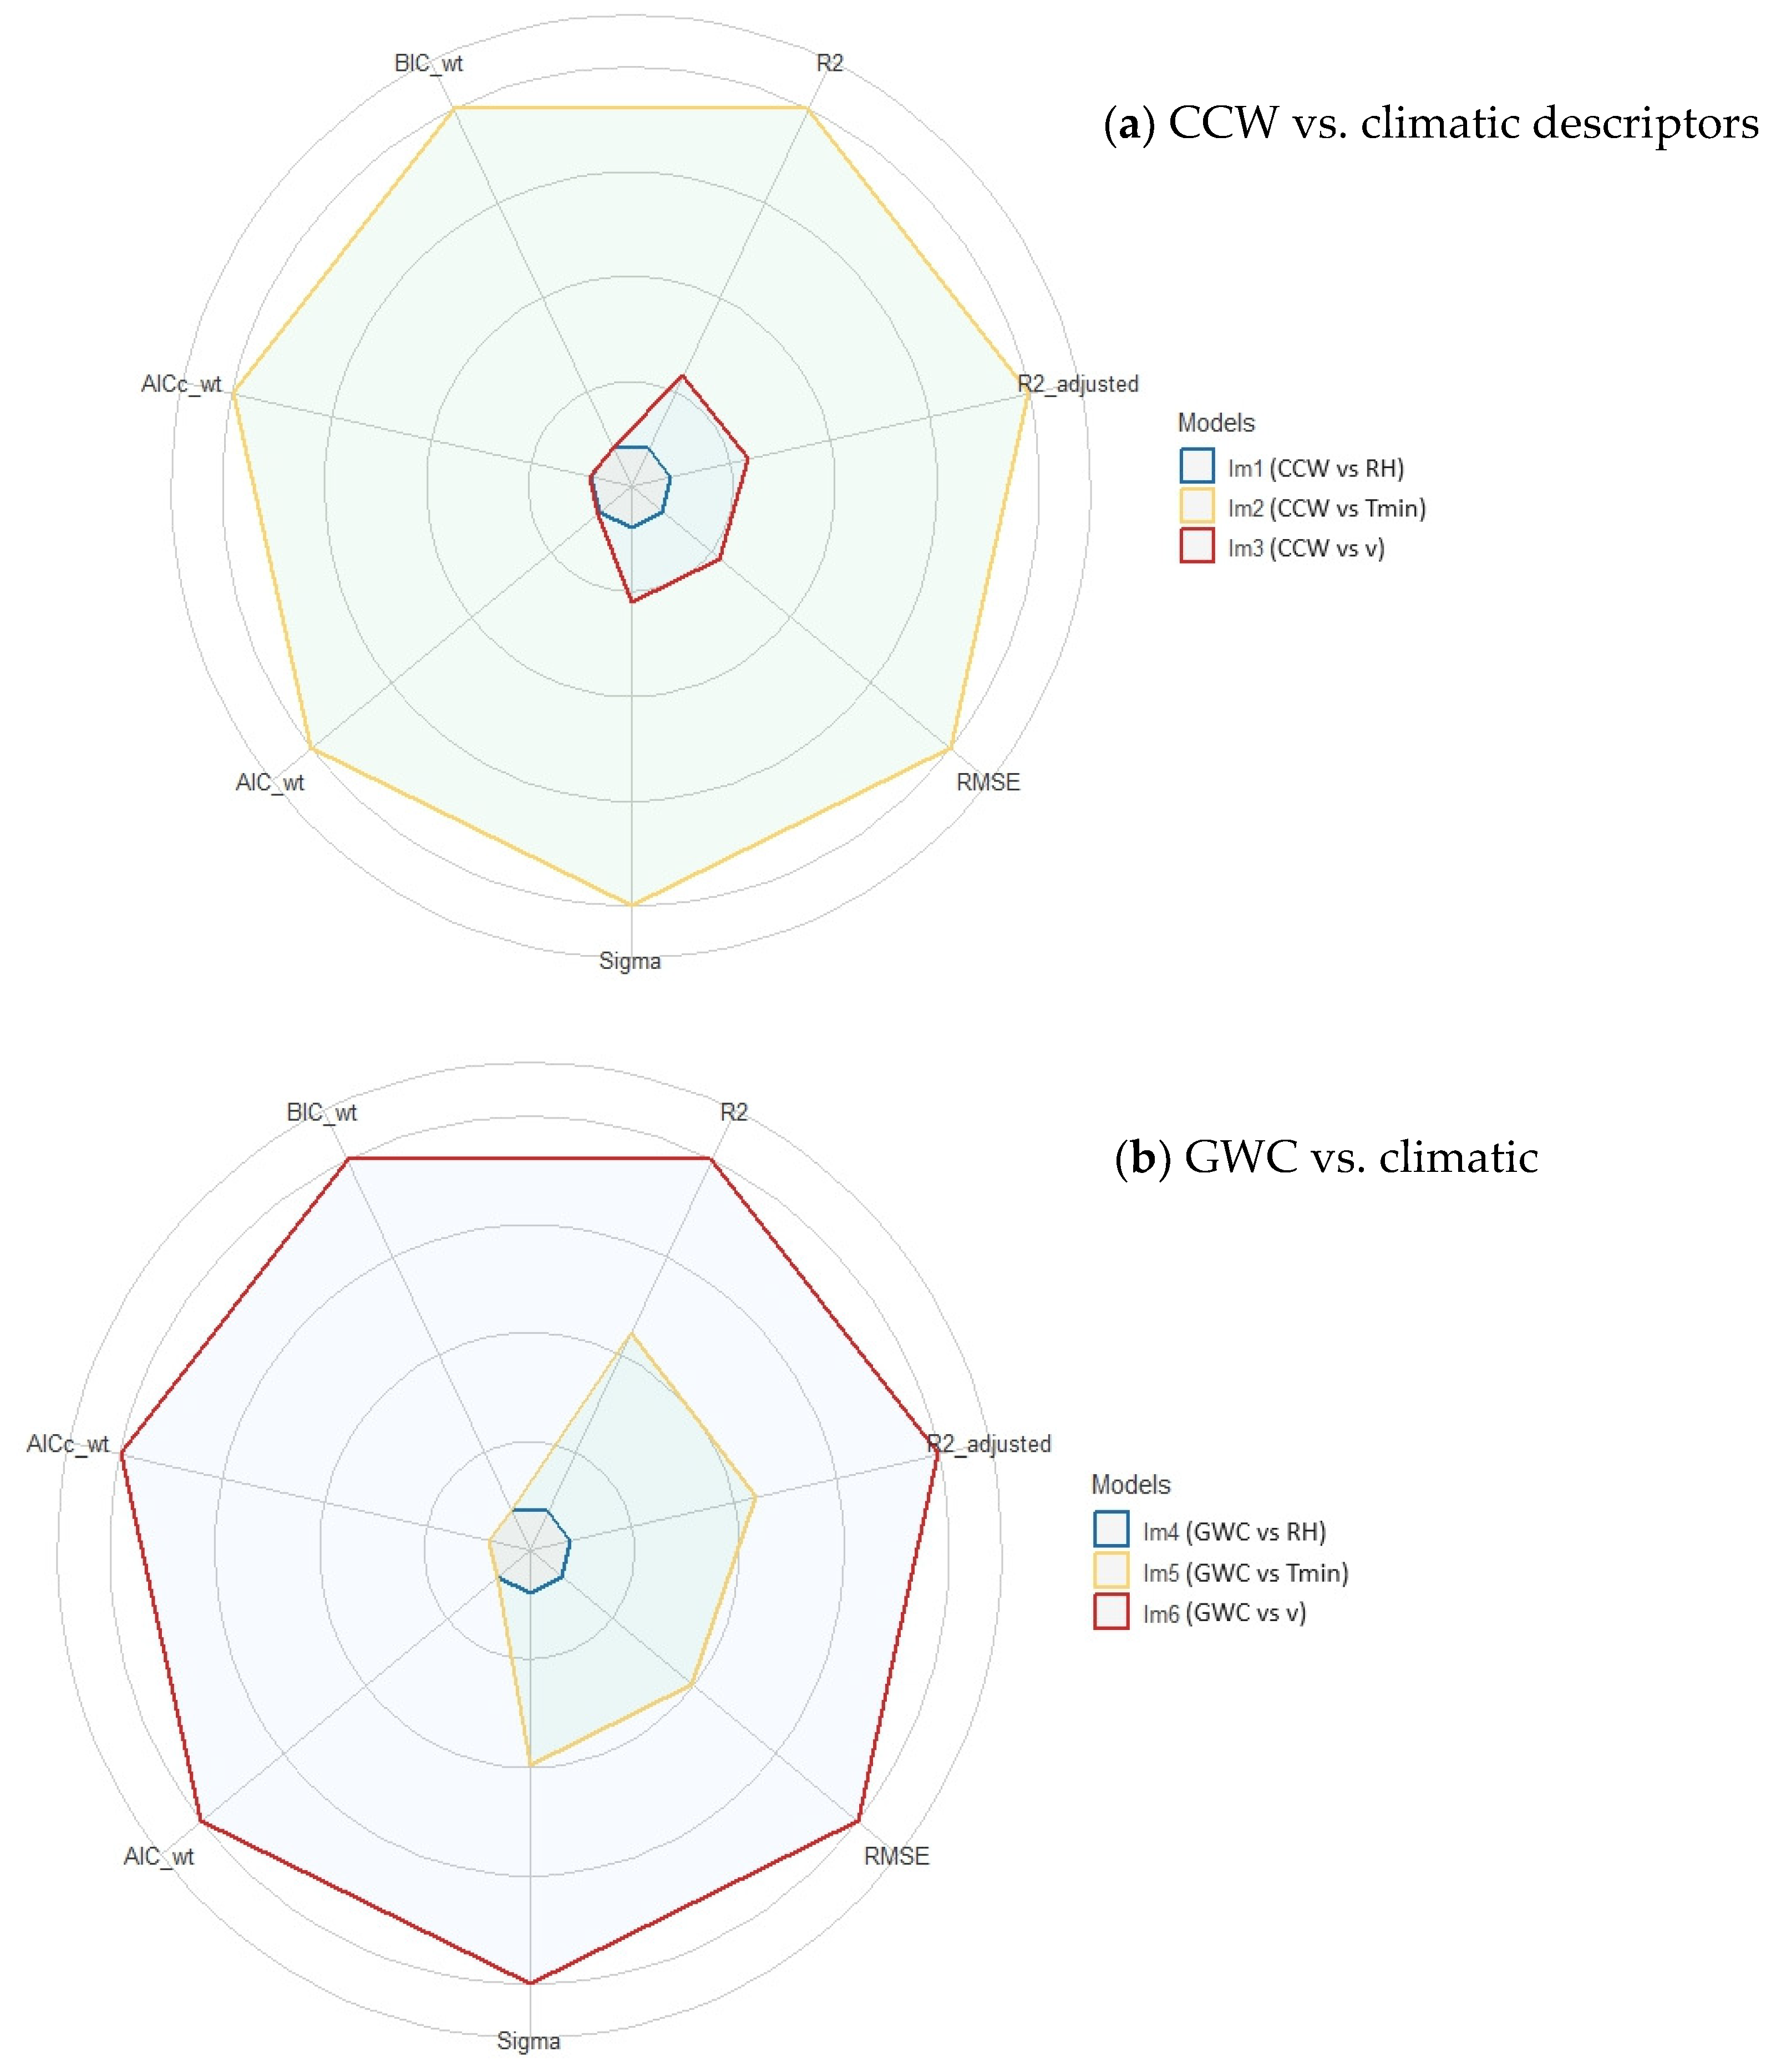
3.3. Multiple Linear Correlation between Morphological (CCW, GWC and PL) and Climatic Descriptors (Tmin, RH and v)

The interdependence analysis between the climatic parameters and morphological characters was based on their most representative descriptors; that is (Tmin, v and RH) and (GWC, CCW and PL), respectively. CCW has been included as a representative morphological descriptor because the anthocyanin content Acy was determined in the cob cores.
Taking into account the previous results, for each morphological descriptor (GWC, CCW and PL) linear regression models were generated with each of the three climatic descriptors (Tmin, RH and v). Figure 2 shows the corresponding radar graphs which were built based on adjustment parameters in multiple linear correlation models [50], such as the coefficient of determination (R2), adjusted coefficient of determination (R2_adjusted), root mean square error (RMSE), residual error (Sigma) and information criteria of Akaike (AIC_wt), corrected Akaike (AICc_wt) and Bayesian (BIC_wt). Figure S3 includes the radar chart for the morphological descriptor PL, along with each of the three climatic descriptors (Tmin, v and RH).
In Figure 2a, it can be appreciated, for CCW, that the model with the highest performance (100% score) was lm2 (CCW vs. Tmin) while the other models, lm3 (CCW vs. v) and lm1 (CCW vs. RH), represented performances with scores of 12% and ~0%, respectively. On the other hand, for GWC (Figure 2b), the highest performing model was lm6 (GWC vs. v) and the others, lm5 (CCW vs. Tmin) and lm4 (CCW vs. RH), had a lower performance with scores of 24% and ~0%, respectively. Finally, for PL (Figure S3), the model with the highest performance was lm12 (PL vs. RH) and the others, lm13 (CCW vs. Tmin) and lm14 (CCW vs. v), had performances lower than 23% and ~0%, respectively.
Based on these results, (CCW vs. Tmin) and (GWC vs. v) and (PL vs. RH) regression lines, depicted in Figure 3, Figure 4 and Figure S4, respectively, have been constructed. The excellent linear correlations (R2 > 0.94) can be noted for the first two but not for the 3rd (PL vs. RH), whose R2 = 0.70 indicates that it is a non-significant correlation and, therefore, we consider it of little relevance in this work.
Figure 3 shows the excellent negative linear correlation (R2 = 0.998) of CCW with Tmin, where the highest CCW (38.6 g/cob) was obtained for the lowest Tmin (7.89 °C) registered in W-Q. On the contrary, the lowest CCW (25.4 g/cob) was obtained for the highest Tmin (19.96 °C), registered in P-SA. Figure 4 shows the good positive linear correlation of GWC vs. v (R2 = 0.943), for which the highest GWC value (139.4 g/cob) was obtained in M-Y cobs, where the wind speed v (4.13 m/s) was the highest of the three locations considered. On the contrary, the lowest GWC was obtained in cobs of P-SA where v (1.19 m/s) was the lowest.

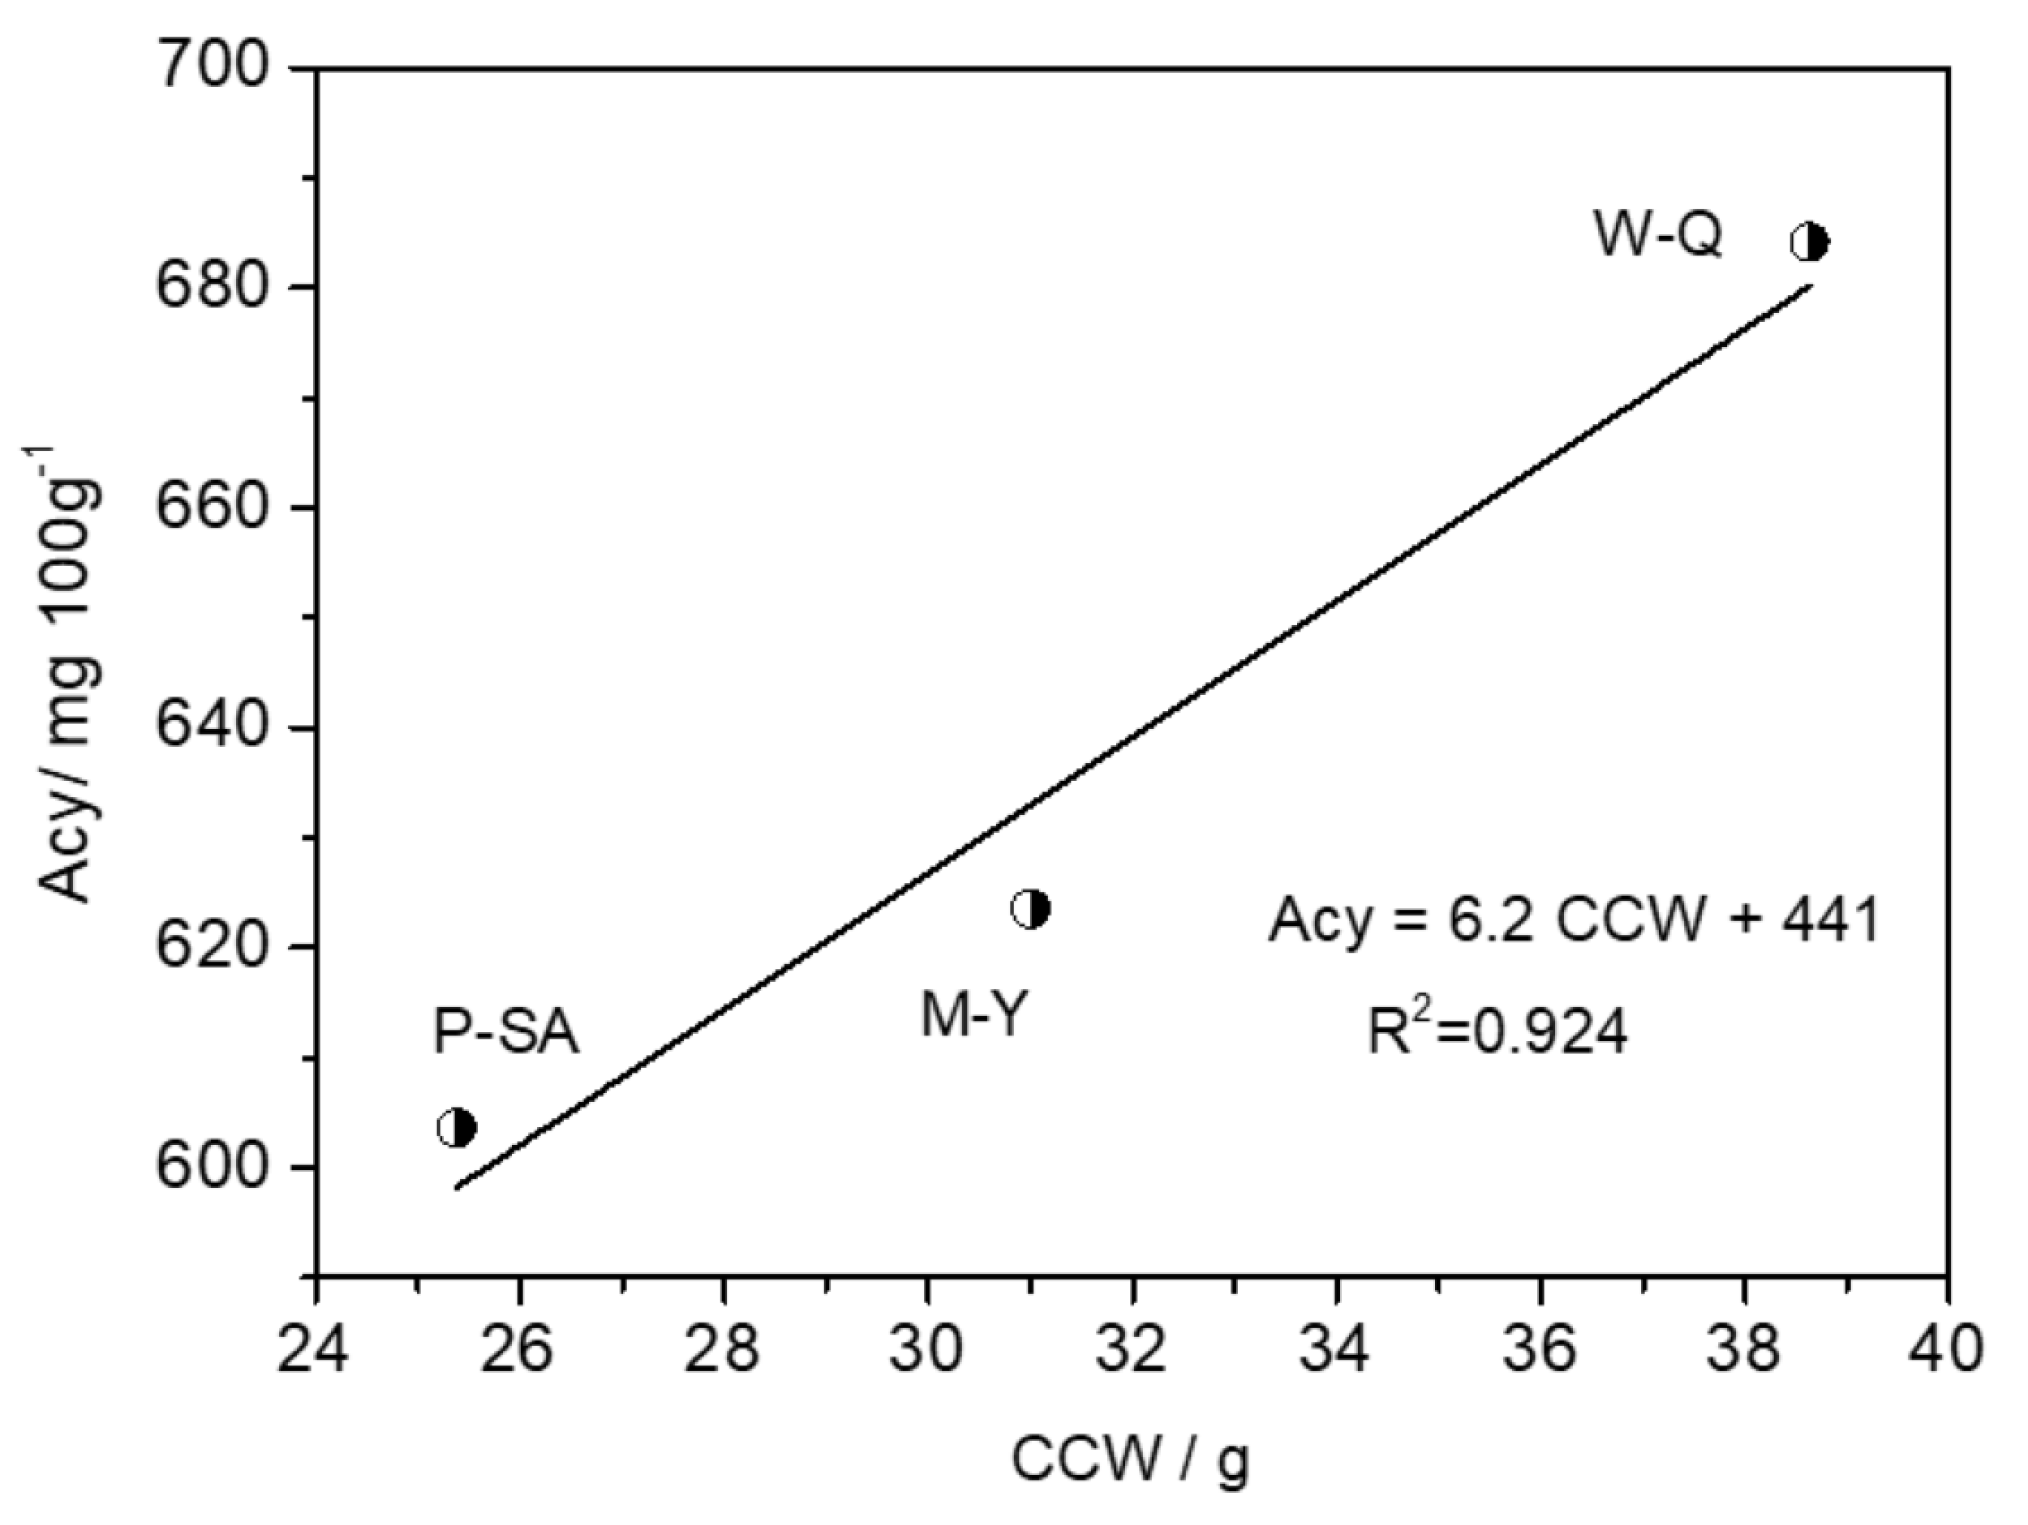
3.4. Anthocyanin Content Acy in Cob Core of PVM-581 Purple Maize: Relationship between Morphological and Climatic Descriptors

In Table 5, the results of Acy (mg of cyanidin-3-glucoside/100 g of dry crown) as well as the average values of the most representative morphological and climatic descriptors of PMV-581 purple maize are consigned. Taking into account these results, linear regression models of Acy were generated, both with the morphological (GWC and PV) and climatic (Tmin, RH and v) descriptors. The corresponding radar graphs are depicted in Figure 5, which were constructed in a similar way to the graphs correlating the morphological and climatic descriptors (Figure 2).
It can be noted in Figure 5a, that the model with the highest performance score (100%) corresponds to lm8 (Acy vs. CCW) while the lm7 model (ACy vs. GWC) has a performance score of ~0%. In Figure 5b the model with the highest performance score (100%) corresponds to lm10 (GWC vs. Tmin); the others, lm9 (Acy vs. RH) and lm11 (Acy vs. v), have performance scores of 2.5% and ~0%, respectively. Based on these results, the regression lines (Acy vs. CCW) and (Acy vs. Tmin) depicted in Figure 6 and Figure 7, respectively, have been constructed. Both present good correlations (R2 ≥ 0.90) where the highest concentration of anthocyanins (Acy = 684.2 mg/100 g) has been obtained in W-Q cobs, the coldest place (Tmin = 7.89 °C) and where the highest CCW value (38.6 g/cob) has been reported. On the contrary, the lowest concentration of anthocyanin (Acy = 603.7 mg/100 g) has been obtained in cobs of P-SA, a locality with the highest (Tmin = 19.96 °C) and where the lowest values of CCW (25.4 g/cob) and also of GWC (79.6 g/cob) and v (1.19 m/s) have been reported (See Table 3).

4. Discussion

The literature collects diverse information on the interdependence of the morphological characters of purple maize. In this context, our results show:
i/ Concordance with those reported by [51], who found good correlations between the four morphological characters (CD, CL, TCW and GWC) of native and foreign corn cobs grown in Cuba. It is important to mention that these characters, among others, are those that are taken into account in the evaluation of the final yield of the harvestable biomass of the corn crop [52]. Also, [53] found a good correlation between the CL and TCW traits in the BTP1-X families of sweet purple corn.
ii/ The independence of PL from the rest of the morphological characters, which was also reported by [54] who did not find good correlations between PL and GWC, or CL and the stalk diameter of Cabo Roxo corn.
iii/ Significant differences, particularly in the representative descriptor, PGM, according to the growing location. Thus, that obtained in M-Y was almost double that in P-SA and, in turn, this was almost 1.6 times more than that reported, for example, by [55] for the same variety of purple corn (PMV-581), but obtained in the coastal city of La Joya-Arequipa (Peru).
iv/ Consistency with those obtained by [56] who reported considerable differences in the CL of purple “reventon” corn coming from two different areas.
The importance of the climatic interaction of the cultivation site with morphological parameters is reflected in the works of [35,57], who studied the climatic effects on corn cultivation, providing backgrounds to develop genetic improvement strategies, planting adaptation calendars and the evaluation of cropping models. In this regard, our results indicate that:
i/ The most representative climate descriptors (Tmin, v and HR) are consistent, for example, with the results of [58], who found that fertilization in cross-pollinated plants, such as corn, is determined by climatic factors such as temperature, precipitation and wind speed. The importance of the latter, as one of the main pollinating agents, is known [59], given that it can transport pollinating insects long distances [60], thus becoming a factor that influences directly in the pollination of flowers, where the greater the fertilization, the greater the number of grains that produce a genotype.
ii/ The lowest value of the morphological production descriptor, GWC (79.6 g/cob), obtained in P-SA would be due to the wind speed v, the lowest of the three locations considered, and also to abiotic stress, caused by the highest temperatures (Tmin, Tm and Tmax) recorded in this location. High temperatures during flowering are known to be one of the many conditions that reduce the corn yield [61].
In addition to the genetic nature of purple maize, it has been shown that environmental factors, such as radiation, temperature and water stress, induce the anthocyanin biosynthetic pathway. Thus, ref. [24] reported that pre-exposure to a low-red/far-red light ratio reduced Acy by 60% in the maize leaf sheath. However, this decrease did not affect the responses to subsequent exposure to enhanced UV-B radiation. Ref. [2] mentioned that: i/ The environmental factors selected during extraction have an impact on the final Acy because it is more stable in acidic and low-temperature conditions. ii/ The soil environment can significantly affect the accumulation of anthocyanins, such as the application of nitrogen, phosphorus, potassium and humic acid fertilizers. iii/ Temperature also affects anthocyanin accumulation in purple maize. Low temperatures (10 °C) induced the expression of regulatory and structural genes. High temperatures (32 °C) induced the expression of a gene (MYB16) that caused the lower synthesis and accumulation of anthocyanins in grains and cobs. Furthermore, at higher temperatures, due to enhanced superoxide dismutase activity and a higher malondialdehyde content, anthocyanins were degraded due to the increased H2O2 concentration. iv/ Finally, under strong light conditions, the leaf-color gene transcription factor can promote and induce the production of anthocyanins in vegetative and reproductive tissues.
It is important to emphasize that anthocyanin biosynthesis has been extensively studied, but the scarcity of genomic data on its regulatory mechanism in purple maize has hindered the variety selection process. However, the use of molecular biology and bioinformatics tools has revealed the complexity of the molecular regulatory mechanisms of the anthocyanin biosynthesis pathway and its large differences among different plants. For the purple maize case, the anthocyanin biosynthesis genes are mainly regulated by several families of transcription factors at the mRNA level [62].
Regarding the content of monomeric anthocyanins Acy reported in this work, we can affirm that it is:
-
Within the range of values reported by [2], between 290 and 1333 mg/100 g of dry matter, depending on the tissues, varieties and country of cultivation. These authors also highlight that variations in the climatic parameters of the growing areas have an impact on the final Acy, with those that develop at low temperatures and in acidic conditions being more stable. Ref. [63] reported a range between 93 and 851 mg/100 g of whole grain for the pigmented phenotypes, which are the highest values among the Mexican corn phenotypes studied.
-
Higher than those reported by i/ [43] for Mexican purple corn varieties, which are between 9.35 and 27.04 mg/100 g of cob; ii/ Medina-Hoyos [9] for Peruvian varieties (including PMV-581), which are between 4.14 and 6.12 mg/100 g of cob core; iii/ [12] also for Peruvian varieties, between 54 and 115 mg/100 g of grain; and iv/ [64,65,66] with 43.02 (for Commercial variety, Korea), 141.58 (for KGW1, Thailand) and 304.5 (for Hybrid, China) mg/100 g of grain, respectively.
-
Lower than those reported by i/ [55] for the Peruvian varieties Canta, Joya and PMV-581, which are between 1336 and 2060 mg/100 g of cob core; ii/ [63] for a commercial Peruvian variety, with a very high value of 125.76 mg/g of cob core; and iii/ [7], also for Peruvian commercial varieties, determined by HPLC between 26 and 38 mg per gram of cob core extract.
Finally, it is necessary to point out some limitations of this work: i/ Although we have considered three locations with different orography and climates, these are within a relatively small region (~37,000 km2) such as Huánuco. ii/ The total Acy has been determined by a classical differential pH method. High performance liquid chromatography and spectrophotometry should be used for a more complete and detailed identification of anthocyanins. iii/ Acy were evaluated for the cob core. In the next pieces of work, other parts of purple maize should be analyzed.

5. Conclusions

The interrelationship between 10 morphological characters, 8 climatic parameters and the content of total anthocyanins in the cob core of PMV 581 purple maize, cultivated (for 8 months) and produced in plots of three locations, with particular climatic characteristics in the Huánuco–Peru region, P-SA, M-Y and W-Q, has been studied.
Regarding the morphological characters with higher average values, we found i/ eight characters in the M-Y crop (PL, NPS, ND, CIL, CL, CD, TCW and GWC); ii/ two characters in the W-Q crop (RD and CCW) and iii/ no characters in the P-SA crop. On the other hand, in P-SA, five of the eight climatic parameters were recorded with higher average values (Tmin, Tmax, Tm, pmax and pac), while in M-Y, there were two (v and Lsun) and in W-Q, only RH. In this last location, the lowest average values of the temperatures Tmin, Tmax and Tm were also recorded.
By using an analysis of variance, Pearson coefficients and multilinear adjustment factors, it has been determined that the most representative morphological characters (morphological descriptors) were GWC, PL and CCW, while the most representative climatic parameters (climatic descriptors) were Tmin, v and RH. Between both types of descriptors, for the three locations considered, excellent linear correlations, CCW vs. Tmin (negative, R2 = 0.998) and GWC vs. v (positive, R2 = 0.943), were found. On the contrary, worse correlations (R2 ≤ 0.70) were found for PL. From the 1st correlation, it was deduced that the highest CCW (38.6 g/cob) was obtained for the lowest Tmin (7.89 °C) recorded in W-Q, while the lowest CCW (25.4 g/cob) was obtained for the highest Tmin (19.96 °C) recorded in P-SA. From the 2nd correlation it is deduced that the highest GWC (139.4 g/cob) was obtained for cobs of M-Y where v (4.13 m/s) was the highest of the three localities. On the contrary, the lowest GWC (79.6 g/cob) was obtained in cobs of P-SA where v (1.19 m/s) was the lowest.
The Acy (mg of cyanidin-3-glucoside/100 g of dry crown) correlates very well with CCW (positive, R2 = 0.924) and also Tmin (negative, R2 = 0.90) descriptors in such a way that the highest Acy (684.2 mg/100 g) was obtained in cobs of W-Q, the coldest of the three locations considered. On the contrary, the lowest Acy (603.7 mg/100 g) was obtained in cobs of P-SA, the most disadvantaged location not only in the production of anthocyanins, but also in that of the grains and cob core of PMV 581 purple maize.
Our results show that morphological and climatic descriptors and Acy are well correlated, indicating that it is possible to i/ select and develop new purple maize varieties generating high Acy under specific climatic conditions, ii/ optimize agronomic practices, such as the nutrition of purple maize plants, and iii/ carry out gene expression studies under specific conditions in order to elucidate the regulatory genetic mechanisms and produce purple maize with a high anthocyanin content.

Supplementary Materials

The following supporting information can be downloaded at: https://www.mdpi.com/article/10.3390/agronomy14092021/s1, Figure S1. Bar graph of the morphological characteristics of PMV-581 purple-maize. Figure S2. Density curves of climatic factors from three locations: (a) Marabamba, (b) Pistalolo y (c) Panao. Figure S3. Radar plot involving multicorrelational models of Plant length PL with Climatic descriptors (Tmin, HR y v). Figure S4. Linear correlation of plant length PL vs Relative humidity RH at M-V, P-SA and W-Q locations.

Author Contributions

Conceptualization, investigation, data curation, project administration, V.S.-A.; software, formal analysis, data curation, writing—original draft, visualization, S.I.-C.; software, formal analysis, writing—original draft, A.J.J.-E.; methodology, writing—original draft, U.C.-F.; investigation, software, J.C.-P.; resources, project administration, A.C.-F.; resources, visualization, B.P.-M.; methodology, validation, writing—review and editing, supervision, J.Z.D.-P. All authors have read and agreed to the published version of the manuscript.

Funding

We received no external funding for this study.

Data Availability Statement

The original contributions presented in the study are included in the article/Supplementary Material; further inquiries can be directed to the corresponding author/s.

Conflicts of Interest

The authors declare not to have any conflicting interests.

References

  1. Pedraza, M.; Idogro, G.; Pedraza, S. Densidad de siembra y comportamiento agronómico de tres variedades de maíz morado (Zea mayz L.). Rev. ECIPeru 2017, 14, 20–40. [Google Scholar] [CrossRef]
  2. Cai, T.; Ge-Zhang, S.; Song, M. Anthocyanins in Metabolites of Purple Corn. Front. Plant Sci. 2023, 14, 1154535. [Google Scholar] [CrossRef] [PubMed]
  3. MIDAGRI. Compendio Anual de “PRODUCCIÓN AGRÍCOLA”. Available online: https://www.gob.pe/institucion/midagri/informes-publicaciones/2730325-compendio-anual-de-produccion-agricola (accessed on 10 June 2024).
  4. Salvador-Reyes, R.; Silva, M.T.P. Peruvian Andean Maize: General Characteristics, Nutritional Properties, Bioactive Compounds, and Culinary Uses. Food Res. Int. 2020, 130, 108934. [Google Scholar] [CrossRef] [PubMed]
  5. MIDAGRI. Análisis de Mercado—Maíz Morado 2015–2021. Available online: https://www.gob.pe/institucion/sse/informes-publicaciones/2624383-analisis-de-mercado-maiz-morado-2015-2021 (accessed on 10 June 2024).
  6. Guillén-Sánchez, J.; Mori-Arismendi, S.; Paucar-Menacho, L.M. Características y propiedades funcionales del maíz morado (Zea mayz L.) var. subnigroviolaceo. Sci. Agropecu. 2010, 5, 211–217. [Google Scholar] [CrossRef]
  7. Monroy, Y.M.; Rodrigues, R.A.F.; Sartoratto, A.; Cabral, F.A. Purple Corn (Zea mayz L.) Pericarp Hydroalcoholic Extracts Obtained by Conventional Processes at Atmospheric Pressure and by Processes at High Pressure. Braz. J. Chem. Eng. 2020, 37, 237–248. [Google Scholar] [CrossRef]
  8. Kim, H.Y.; Lee, K.Y.; Kim, M.; Hong, M.; Deepa, P.; Kim, S. A Review of the Biological Properties of Purple Corn (Zea mayz L.). Sci. Pharm. 2023, 91, 6. [Google Scholar] [CrossRef]
  9. Medina-Hoyos, A.; Narro-León, L.; Chávez-Cabrera, A. Cultivo de maíz morado (Zea mayz L.) en zona altoandina de Perú: Adaptación e identificación de cultivares de alto rendimiento y contenido de antocianina. Sci. Agropecu. 2020, 11, 291–299. [Google Scholar] [CrossRef]
  10. Rabanal-Atalaya, M.; Medina-Hoyos, A. Evaluación del rendimiento, características morfológicas y químicas de variedades del maíz morado (Zea mayz L.) en la región Cajamarca-Perú. Rev. TERRA Latinoam. 2021, 39, e829. [Google Scholar] [CrossRef]
  11. Grobman, A. Races of Maize in Peru: Their Origins, Evolution and Classification; National Academy of Sciences-National Research Council: Washington, DC, USA, 1961. [Google Scholar]
  12. Salinas Moreno, Y.; Sanchez, G.S.; Hernandez, D.R.; Lobato, N.R. Characterization of Anthocyanin Extracts from Maize Kernels. J. Chromatogr. Sci. 2005, 43, 483–487. [Google Scholar] [CrossRef]
  13. Salinas-Moreno, Y.; Pérez-Alonso, J.J.; Vázquez-Carrillo, G.; Aragón-Cuevas, F.; Velázquez-Cardelas, G.A. Antocianinas y actividad antioxidante en maíces (Zea mayz L.) de las razas chalqueño, elotes cónicos y bolita. Agrociencia 2012, 46, 693–706. [Google Scholar]
  14. Rouf Shah, T.; Prasad, K.; Kumar, P. Maize—A Potential Source of Human Nutrition and Health: A Review. Cogent Food Agric. 2016, 2, 1166995. [Google Scholar] [CrossRef]
  15. Mattioli, R.; Francioso, A.; Mosca, L.; Silva, P. Anthocyanins: A Comprehensive Review of Their Chemical Properties and Health Effects on Cardiovascular and Neurodegenerative Diseases. Molecules 2020, 25, 3809. [Google Scholar] [CrossRef]
  16. Houghton, A.; Appelhagen, I.; Martin, C. Natural Blues: Structure Meets Function in Anthocyanins. Plants 2021, 10, 726. [Google Scholar] [CrossRef]
  17. Kamiloglu, S.; Akgun, B. Petunidin: Advances on Resources, Biosynthesis Pathway, Bioavailability, Bioactivity, and Pharmacology. In Handbook of Dietary Flavonoids; Springer International Publishing: Cham, Switzerland, 2023; pp. 1–34. ISBN 978-3-030-94753-8. [Google Scholar]
  18. Khoo, H.E.; Azlan, A.; Tang, S.T.; Lim, S.M. Anthocyanidins and Anthocyanins: Colored Pigments as Food, Pharmaceutical Ingredients, and the Potential Health Benefits. Food Nutr. Res. 2017, 61, 1361779. [Google Scholar] [CrossRef]
  19. Yoojin, L.; Ji-Young, L. Protective Actions of Polyphenols in the Development of Nonalcoholic Fatty Liver Disease. In Dietary Interventions in Liver Disease; Academic Press: Cambridge, MA, USA, 2019; pp. 91–99. [Google Scholar]
  20. Thapphasaraphong, S.; Rimdusit, T.; Priprem, A.; Puthongking, P. Crops of Waxy Purple Corn: A Valuable Source of Antioxidative Phytochemicals. Int. J. Adv. Agric. Environ. Eng. 2016, 3, 73–77. [Google Scholar] [CrossRef]
  21. Razgonova, M.; Zinchenko, Y.; Pikula, K.; Tekutyeva, L.; Son, O.; Zakharenko, A.; Kalenik, T.; Golokhvast, K. Spatial Distribution of Polyphenolic Compounds in Corn Grains (Zea mayz L. var. Pioneer) Studied by Laser Confocal Microscopy and High-Resolution Mass Spectrometry. Plants 2022, 11, 630. [Google Scholar] [CrossRef]
  22. Singh, A.A.; Agrawal, S.B.; Shahi, J.P.; Agrawal, M. Investigating the Response of Tropical Maize (Zea mayz L.) Cultivars against Elevated Levels of O3 at Two Developmental Stages. Ecotoxicology 2014, 23, 1447–1463. [Google Scholar] [CrossRef] [PubMed]
  23. Cappellini, F.; Marinelli, A.; Toccaceli, M.; Tonelli, C.; Petroni, K. Anthocyanins: From Mechanisms of Regulation in Plants to Health Benefits in Foods. Front. Plant Sci. 2021, 12, 748049. [Google Scholar] [CrossRef] [PubMed]
  24. Ma, L.; Upadhyaya, M.K. Influence of R/FR Ratio on Response of Maize, Lettuce, and Amaranthus retroflexus L. to UV-B Radiation. Weed Res. 2023, 63, 165–174. [Google Scholar] [CrossRef]
  25. Magaña-Cerino, J.M.; Peniche-Pavía, H.A.; Tiessen, A.; Gurrola-Díaz, C.M. Pigmented Maize (Zea mayz L.) Contains Anthocyanins with Potential Therapeutic Action Against Oxidative Stress—A Review. Pol. J. Food Nutr. Sci. 2020, 70, 85–99. [Google Scholar] [CrossRef]
  26. Aguilar-Hernández, Á.D.; Salinas-Moreno, Y.; Ramírez-Díaz, J.L.; Alemán-De la Torre, I.; Bautista-Ramírez, E.; Flores-López, H.E. Anthocyanins and Color in Grain and Cob of Peruvian Purple Corn Grown in Jalisco, Mexico. Rev. Mex. Cienc. Agrícolas 2019, 10, 1071–1082. [Google Scholar]
  27. Aguilera, M.; Reza, M.d.C.; Chew, R.G.; Meza, J.A. Propiedades funcionales de las antocianinas. Biotecnia 2011, 13, 16–22. [Google Scholar] [CrossRef]
  28. Paulsmeyer, M.; Chatham, L.; Becker, T.; West, M.; West, L.; Juvik, J. Survey of Anthocyanin Composition and Concentration in Diverse Maize Germplasms. J. Agric. Food Chem. 2017, 65, 4341–4350. [Google Scholar] [CrossRef] [PubMed]
  29. Jayaprakash, S.; Raja, S.; He, J.; Paramannil, M. Functional Relevance of Bioactive Compounds in Purple Maize: A Contemporary Extraction Progressions and Prospective Applications. Cereal Res. Commun. 2023, 51, 263–282. [Google Scholar] [CrossRef]
  30. Bae, H.-H.; Yi, G.; Go, Y.S.; Ha, J.Y.; Choi, Y.; Son, J.-H.; Shin, S.; Jung, T.-W.; Lee, S. Measuring Antioxidant Activity in Yellow Corn (Zea mayz L.) Inbreds from Three Different Geographic Regions. Appl. Biol. Chem. 2021, 64, 56. [Google Scholar] [CrossRef]
  31. Mutlu, C.; Arslan-Tontul, S.; Candal, C.; Kilic, O.; Erbas, M. Physicochemical, Thermal, and Sensory Properties of Blue Corn (Zea mayz L.). J. Food Sci. 2018, 83, 53–59. [Google Scholar] [CrossRef]
  32. Ramos-Escudero, F.; Muñoz, A.M.; Alvarado-Ortíz, C.; Alvarado, Á.; Yáñez, J.A. Purple Corn (Zea mayz L.) Phenolic Compounds Profile and Its Assessment as an Agent Against Oxidative Stress in Isolated Mouse Organs. J. Med. Food 2012, 15, 206–215. [Google Scholar] [CrossRef]
  33. Vargas-Yana, D.; Aguilar-Morón, B.; Pezo-Torres, N.; Shetty, K.; Ranilla, L.G. Ancestral Peruvian Ethnic Fermented Beverage “Chicha” Based on Purple Corn (Zea mayz L.): Unraveling the Health-Relevant Functional Benefits. J. Ethn. Foods 2020, 7, 35. [Google Scholar] [CrossRef]
  34. Gálvez, L.; Christopher, A.; Sarkar, D.; Shetty, K.; Chirinos, R.; Campos, D. Phenolic Composition and Evaluation of the Antimicrobial Activity of Free and Bound Phenolic Fractions from a Peruvian Purple Corn (Zea mayz L.) Accession. J. Food Sci. 2017, 82, 2968–2976. [Google Scholar] [CrossRef]
  35. Jiang, L.; Wang, M.; Chu, Z.; Gao, Y.; Guo, L.; Ji, S.; Jiang, L.; Gong, L. Effects of Temperature on Growth and Grain Maturity of Spring Maize in Northeast China: A Study of Different Sowing Dates. Atmosphere 2023, 14, 1755. [Google Scholar] [CrossRef]
  36. Fuentes-Cardenas, I.S.; Cuba-Puma, R.; Marcilla-Truyenque, S.; Begazo-Gutiérrez, H.; Zolla, G.; Fuentealba, C.; Shetty, K.; Galvez, L. Diversity of the Peruvian Andean Maize (Zea mayz L.) Race Cabanita: Polyphenols, Carotenoids, in Vitro Antioxidant Capacity, and Physical Characteristics. Front. Nutr. 2022, 9, 983208. [Google Scholar] [CrossRef]
  37. Vidal, J.P. Las ocho regiones naturales del Perú. Terra Bras. Rev. Rede Bras. História Geogr. E Geogr. Histórica 2014, 3, 1–21. [Google Scholar] [CrossRef]
  38. Kuti, C.; Láng, L.; Bedő, Z. Pedigree Records in Plant Breeding: From Independent Data to Interdependent Data Structures. Cereal Res. Commun. 2006, 34, 911–918. [Google Scholar] [CrossRef]
  39. MIDAGRI. El Maíz Morado Peruano: Un Producto con Alto Contenido de Antocianina, Poderoso Antioxidante Natural; MIDAGRI: Santiago, Chile, 2021. [Google Scholar]
  40. Baker, L. Corn Meets Maize: Food Movements and Markets in Mexico; Rowman & Littlefield: Lanham, MD, USA, 2013; ISBN 978-1-4422-0651-9. [Google Scholar]
  41. IBPGR. Descriptors for Maize/Descriptores Para Maiz/Descripteurs Pour Le Maïs; International Board for Plant Genetic Resources: Rome, Italy, 1991; ISBN 978-92-9043-189-3. [Google Scholar]
  42. Argimon, J.M.; Jiménez, J. Métodos de Investigacion Clinica y Epidemiologica 4 Ed. Josep Argimon Pallás | Aurelio Velasco—Academia.Edu. Available online: https://www.academia.edu/24421999/M%C3%A9todos_de_investigacion_clinica_y_epidemiologica_4_ed_Josep_Argimon_Pall%C3%A1s (accessed on 11 June 2024).
  43. Corona-Terán, J.; López-Orona, C.A.; Romero-Gómez, S.d.J.; Martínez-Campos, A.R. Caracterización física, contenido de fenoles y capacidad antioxidante de maíces nativos (Zea mayz L.) del Estado de México. ITEA Inf. Téc. Económica Agrar. Rev. Asoc. Interprofesional Para El Desarro. Agrar. AIDA 2017, 113, 5–19. [Google Scholar]
  44. Lee, J.; Durst, R.; Wrolstad, R. AOAC 2005.02: Total Monomeric Anthocyanin Pigment Content of Fruit Juices, Beverages, Natural Colorants, and Wines-pH Differential Method. In Official Methods of Analysis of AOAC International; AOAC International: Rockville, MD, USA, 2005; pp. 37–39. [Google Scholar]
  45. Giusti, M.M.; Wrolstad, R.E. Characterization and Measurement of Anthocyanins by UV-Visible Spectroscopy. Curr. Protoc. Food Anal. Chem. 2001, 1, F1.2.1–F1.2.13. [Google Scholar] [CrossRef]
  46. Di Rienzo, J.A.; Casanoves, F. Estadística para las Ciencias Agropecuarias, 7th ed.; Editoria Brujas: Cordoba, Argentina, 2009; ISBN 978-987-591-112-3. [Google Scholar]
  47. Balzarini, M.; Di Rienzo, J.; Tablada, M.; Gonzalez, L.; Bruno, C.; Córdoba, M.; Robledo, W.; Casanoves, F. Estadística y Biometría Ilustraciones Del Uso de InfoStat En Problemas de Agronomía; InfoStat: Córdoba, Argentina, 2015; ISBN 978-987-591-646-3. [Google Scholar]
  48. Schloerke, B.; Cook, D.; Larmarange, J.; Briatte, F.; Marbach, M.; Thoen, E.; Elberg, A.; Crowley, J. Extension to Ggplot2. Available online: https://ggobi.github.io/ggally/ (accessed on 11 June 2024).
  49. Valérie, D. Understanding a Structure; Elsevier: Amsterdam, The Netherlands, 2017; pp. 95–153. ISBN 978-1-78548-239-7. [Google Scholar]
  50. Shimizu, G.D.; Azeredo, L.S. AgroReg: Main Regression Models in Agricultural Sciences Implemented as an R Package. Sci. Agric. 2023, 80, e20220041. [Google Scholar] [CrossRef]
  51. Martínez, M.; Ortiz, R.; Ríos, H.; Acosta, R. Análisis de las correlaciones en poblaciones cubanas de maíz. Cultiv. Trop. 2010, 31, 82–91. [Google Scholar]
  52. Omar, S.; Abd, R.; Khalid, N.; Jolánkai, M.; Tarnawa, Á.; Percze, A.; Mikó, P.P.; Kende, Z. Effects of Seed Quality and Hybrid Type on Maize Germination and Yield in Hungary. Agriculture 2023, 13, 1836. [Google Scholar] [CrossRef]
  53. Arsyad, F.; Basunanda, P. Identification of Agronomic Characters Effecting Cob Weight of the Families BTP1-X Purple Sweet Corn (Zea mayz L. Saccharata Sturt) Using Path Analysis. IOP Conf. Ser. Earth Environ. Sci. 2020, 484, 012011. [Google Scholar] [CrossRef]
  54. Barreto, G.; Petry, C.; Silveira, D.C.; Silva, I.C.; Frizon, P. Phenotypic Characterization and Productivity of Local Varieties of Zea mayz L. in Agroecological No-Tillage Method. Rev. Em. Agronegocio. Meio Ambiente 2023, 16, e10147. [Google Scholar] [CrossRef]
  55. Quispe, F.; Arroyo, K.; Gorriti, A. Cultivares de maiz morado (Zea mayz L.). Rev. Soc. Quím. Perú 2011, 77, 205–217. [Google Scholar]
  56. Huanuqueño, H.; Zolla, G.; Jimenez, J. Selección de Líneas Estables y de Alto Rendimiento de Maíz Morado (Zea mayz L.) Var. Reventón Usando El Índice de Estabilidad de Múltiples Caracteres (MTSI). Sci. Agropecu. 2022, 13, 125–133. [Google Scholar] [CrossRef]
  57. Xu, H.; Ming, B.; Wang, K.; Xue, J.; Hou, P.; Li, S.; Xie, R. The Effects of Photoperiod and Temperature-Related Factors on Maize Leaf Number and Leaf Positional Distribution in the Field. Front. Plant Sci. 2023, 14, 1006245. [Google Scholar] [CrossRef]
  58. Austin, M.W.; Cole, P.O.; Olsen, K.M.; Smith, A.B. Climate Change Is Associated with Increased Allocation to Potential Outcrossing in a Common Mixed Mating Species. Am. J. Bot. 2022, 109, 1085–1096. [Google Scholar] [CrossRef] [PubMed]
  59. Maccagnani, B.; Sgolastra, F. Solitary Bees As Pollinators. In Entomovectoring for Precision Biocontrol and Enhanced Pollination of Crops; Smagghe, G., Boecking, O., Maccagnani, B., Mänd, M., Kevan, P.G., Eds.; Springer International Publishing: Cham, Switzerland, 2020; pp. 63–79. ISBN 978-3-030-18917-4. [Google Scholar]
  60. Jauharlina, J.; Quinnell, R.J.; Robertson, H.G.; Compton, S.G. The effects of seasonal changes on the dynamics of a fig tree’s pollination. Acta Oecologica 2023, 120, 103918. [Google Scholar] [CrossRef]
  61. Hongping, L.; Kui, L.; Zhibin, L.; Moubiao, Z.; Yongen, Z.; Shuyan, L.; Xiuling, W.; Jinlong, Z.; Yali, Z.; Tianxue, L.; et al. Mixing trait-based corn (Zea mayz L.) cultivars increases yield through pollination synchronization and increased cross-fertilization. Crop J. 2023, 11, 291–300. [Google Scholar] [CrossRef]
  62. López-Martínez, L.X.; Oliart-Ros, R.M.; Valerio-Alfaro, G.; Chen-Hsien, L.; Parkin, K.L.; García, H.S. Antioxidant activity, phenolic compounds and anthocyanins content of eighteen strains of Mexican maize. LWT-Food Sci. Technol. 2009, 42, 1187–1192. [Google Scholar] [CrossRef]
  63. Hwang, S.H.; Kwon, S.H.; Wang, Z.; Kim, T.H.; Kang, Y.-H.; Lee, J.-Y.; Lim, S.S. Optimization of Extraction Parameters of PTP1β (Protein Tyrosine Phosphatase 1β), Inhibitory Polyphenols, and Anthocyanins from Zea mayz L. Using Response Surface Methodology (RSM). BMC Complement. Altern. Med. 2016, 16, 317. [Google Scholar] [CrossRef] [PubMed]
  64. Tangwongchai, R.; Lertrat, K.; Saikaew, K. Influence of Variety and Maturity on Bioactive Compounds and Antioxidant Activity of Purple Waxy Corn (Zea mayz L. var. Ceratina). Int. Food Res. J. 2018, 25, 1985–1995. [Google Scholar]
  65. Zhao, X.; Corrales, M.; Zhang, C.; Hu, X.; Ma, Y.; Tauscher, B. Composition and Thermal Stability of Anthocyanins from Chinese Purple Corn (Zea mayz L.). J. Agric. Food Chem. 2008, 56, 10761–10766. [Google Scholar] [CrossRef]
  66. Napan, L.E.; Vietti-Guzmán, F.F.; Alvarez-Yanamango, E.; Huayta, F. Evaluation of Some Functional Properties of Purple Corn (Zea mayz L.) Dye, during Its Processing at Pilot Scale. In Proceedings of the 16th LACCEI International Multi-Conference for Engineering, Education, and Technology: “Innovation in Education and Inclusion”, Lima, Peru, 19–21 July 2018. [Google Scholar]
Figure 1. (a) PMV-581 purple maize crop in P-SA test plot. Cobs coming from (b) P-SA, (c) M-Y and (d) W-Q.
Agronomy 14 02021 g001
Figure 2. Radar plots involving multiple-correlation models of (a) cob core weight CCW and (b) grain weight per cob GWC, with climate descriptors (Tmin, RH and v). Adjustment parameters: coefficient of determination (R2), adjusted coefficient of determination (R2_adjusted), root mean square error (RMSE), residual error (Sigma) and weight factors in information criteria of Akaike (AIC_wt), corrected Akaike (AICc_wt) and Bayesian (BIC_wt).
Agronomy 14 02021 g002
Figure 3. Linear correlation of the cob core weight CCW with the minimum temperature Tmin in M-V, P-SA and W-Q locations.
Agronomy 14 02021 g003
Figure 4. Linear correlation of the cob grains weight GWC with the wind speed v in M-V, P-SA and W-Q locations.
Agronomy 14 02021 g004
Figure 5. Radar plots involving multiple-correlation models of anthocyanin content Acy versus (a) morphological and (b) climatic descriptors. Adjustment parameters similar to those described in Figure 2.
Agronomy 14 02021 g005
Figure 6. Correlation of anthocyanin concentration vs. cob core weight (Acy vs. CCW) in M-V, P-SA and W-Q locations.
Agronomy 14 02021 g006
Figure 7. Correlation of anthocyanin concentration vs. minimum temperature (Acy vs. Tmin) in M-V, P-SA and W-Q locations.
Agronomy 14 02021 g007
Table 1. Descriptive statistics of the biometric characterization of PMV-581 purple maize.
Test LocationVariableAverageSDEECVMínMaxAK
Marabamba
(M-Y)
NPS7.631.410.5018.465.009.00−1.16−0.44
CIL/cm105.1311.283.9910.7380.00115.00−1.851.22
PL/cm266.8829.3910.3911.01220.00300.00−0.62−1.08
ND/cm9.830.840.308.558.5010.50−1.23−0.80
CD/cm5.310.470.178.804.606.00−0.09−1.12
RD/cm2.730.680.2424.792.004.000.85−0.43
CL/cm16.031.330.478.3214.0018.00−0.02−1.08
TCW/g170.3815.525.499.11150.00200.000.71−0.16
GWC/g139.3814.725.2010.56121.00168.001.00−0.16
CCW/g31.007.692.7224.8117.0042.00−0.30−0.21
Pistaloli
(P-SA)
NPS6.250.460.167.416.007.001.44−0.67
CIL/cm97.636.482.296.6489.00107.00−0.20−1.31
PL/cm238.389.473.353.97220.00250.00−1.02−0.10
ND/cm9.251.340.4714.457.5012.001.200.46
CD/cm3.230.650.2320.012.004.00−0.77−0.32
RD/cm1.810.440.1624.221.002.50−0.50−0.04
CL/cm10.262.480.8824.207.8014.000.28−1.60
TCW/g105.006.992.476.6698.00118.000.86−0.61
GWC/g79.637.132.528.9570.0090.000.15−1.17
CCW/g25.383.781.3414.8920.0030.00−0.52−1.12
Winchuspata
(W-Q)
NPS6.130.640.2310.465.007.00−0.07−0.31
CIL/cm99.385.712.025.7492.00110.000.90−0.36
PL/cm199.6322.838.0711.44160.00240.00−0.010.15
ND/cm8.630.690.258.058.0010.001.12−0.14
CD/cm4.880.690.2514.243.805.70−0.56−1.16
RD/cm2.790.610.2221.982.003.50−0.28−1.44
CL/cm14.781.640.5811.1013.0018.001.19−0.22
TCW/g169.3812.654.477.47159.00195.001.400.02
GWC/g130.7518.526.5514.17105.00158.000.41−1.08
CCW/g38.6311.253.9829.1322.0054.00−0.65−0.82
SD = standard deviation, CV = coefficient of variation, Min = minimum value of the data set. Max = maximum value of the data set, A = Asymmetry, K = Kurtosis. NSP = Number of nodes per stem, CIL = Cob insertion length, PL = Plant length, ND = Node diameter, CD = Cob diameter, RD = Raquis diameter, CL = Cob length, TCW = Total cob weight, GWC = Grain weight per cob, CCW = Cob core weight.
Table 2. Pearson correlation coefficients of significant morphological descriptors of PMV-581 purple maize grown in M-V, P-SA and W-Q localities.
Pearson Coefficients1. PL2. CD3. CL4. TCW5. GWC
1. PL/cm
2. CD/cmCorrtotal
M-V
P-SA
W-Q
0.151
−0.272
0.676
0.575
3. CL/cmCorrtotal
M-V
P-SA
W-Q
0.114
−0.399
0.413
0.505
0.938 ***
0.931 ***
0.849 **
0.729 *
4. TCW/gCorrtotal
M-V
P-SA
W-Q
−0.075
−0.335
0.261
0.209
0.904 ***
0.862 **
0.709 *
0.649
0.888 ***
0.856 **
0.806 *
0.752 *
5. GWC/gCorrtotal
M-V
P-SA
W-Q
−0.010
−0.504
0.138
0.140
0.908 ***
0.539
0.698
0.774 *
0.881 ***
0.605
0.801 *
0.719 *
0.960 ***
0.872 **
0.857 **
0.804 *
6. CCW/gCorrtotal
M-V
P-SA
W-Q
−0.231
0.288
0.223
0.005
0.287
0.708 *
−0.004
−0.545
0.316
0.569
−0.021
−0.338
0.459 *
0.350
0.233
−0.199
0.190
−0.154
−0.302
−0.743 *
CD = cob diameter, CL = cob length, TCW = total cob weight, GWC = grain weight per cob and CCW = cob core weight. Significance level of, * 0.05, ** 0.01 and *** 0.001. M-V = Marabamba, P-SA = Pistaloli, W-Q = Winchuspata.
Table 3. Descriptive statistics of climatic parameters of PMV-581 purple maize planting locations.
Test LocationVariableAverageSDEE.CVMínMáxAK
Marabamba
(M-Y)
Tmax/°C24.318.913.1536.642.3028.50−2.813.11
Tmin/°C14.491.560.5510.7711.9016.30−0.48−1.05
Tm/°C19.404.221.4921.769.2022.40−2.562.62
pmax/mm5.316.692.36125.860.1014.200.65−1.71
pac/mm18.2526.339.31144.250.2070.201.30−0.30
RH/%60.132.800.994.6657.0066.001.440.51
v/m/s4.130.400.149.683.404.50−0.84−0.81
Lsun/W/m2204.1140.4214.2919.80144.50259.80−0.14−1.37
Pistaloli
(P-SA)
Tmax/°C31.121.050.373.3629.2032.80−0.37−0.02
Tmin/°C19.960.500.182.5019.2020.60−0.04−1.09
Tm/°C25.540.610.212.3824.5526.700.460.35
pmax/mm 56.1833.3511.7959.3717.20110.400.90−0.87
pac/mm237.09155.1454.8565.4350.10527.801.01−0.42
RH/%88.251.910.672.1684.0090.00−1.791.25
v/m/s1.190.140.0511.420.901.30−1.540.56
Lsun/W/m2164.9442.7115.1025.8979.50215.20−1.060.12
Winchuspata
(W-Q)
Tmax/°C18.710.380.142.0518.2019.200.20−1.43
Tmin/°C7.890.710.259.056.308.50−1.821.17
Tm/°C13.300.260.091.9312.7513.55−1.600.71
pmax/mm 15.056.492.2943.107.4024.600.50−1.17
pac/mm63.0559.2120.9393.9014.80196.601.951.37
RH/%96.250.710.250.7395.0097.00−0.40−0.78
v/m/s3.230.280.108.572.703.50−0.99−0.45
Lsun/W/m2172.5454.9619.4331.8583.40249.80−0.25−1.06
SD = standard deviation, CV = coefficient of variation, Min = minimum value of the data set, Max = maximum value of the data set, A = Asymmetry, K = Kurtosis, Tmax = Maximun temperatura, Tmin = Minimum temperature, Tm = Average temperature, pmax = Maximum precipitation, pac = Accumulated precipitation, RH = Average relative humidity per month, v = Wind speed, Lsun = Hours of sunlight per day.
Table 4. Pearson correlation coefficients of the significant and dependent climatic parameters of the M-V, P-SA and W-Q localities (Corrtot = total correlation).
Climatic Parameters1. Tmin2. Tm3. pmax4. RH
1. Tmin
2. TmCorrtotal
M-V
P-SA
W-Q
0.878 ***
−0.213
0.522
0.855 **
3. pmaxCorrtotal
M-V
P-SA
W-Q
0.578 **
0.831 *
0.344
0.621
0.510 *
−0.375
−0.001
0.538
4. RHCorrtotal
M-V
P-SA
W-Q
−0.249
0.448
−0.169
0.431
−0.224
−0.814 *
−0.785 *
−0.039
0.349
0.396
−0.343
0.053
5. vCorrtotal
M-V
P-SA
W-Q
−0.612 **
0.085
0.140
−0.519
−0.542 **
0.808 *
0.756 *
−0.191
−0.776 ***
−0.016
−0.538
−0.484
−0.576 **
−0.796 *
−0.483
−0.694
Significance level of * 0.05, ** 0.01 and *** 0.001. Tmin = Minimum Temperature, Tm = Average temperature, pmax = Maximum precipitation, RH = Average relative humidity per month, v = Wind speed. M-V = Marabamba, P-SA = Pistaloli, W-Q = Winchuspata.
Table 5. Anthocyanin content in cob core (Acy) and average values of the most representative morphological and climatic descriptors for PMV-581 purple maize in three typical locations of Huánuco region, Peru.
LocationTmin a/°CRH b/%v c/(m/s)GWC d/gCCW e/gAcy f/(mg/100 g)
P-SA
(953 m a.s.l.)
19.9688.31.1979.625.4603.7
M-Y
(1994 m m a.s.l.)
14.4960.14.13139.431.0623.5
W-Q
(2498 m m a.s.l.)
7.8996.33.23130.838.6684.2
a Minimum temperature, b Average relative humidity, c wind speed, d cob grains weight, e cob core weight, f anthocyanin content Acy = mg of cyanidin-3-glucoside per 100 g of cob core. P-SA = Pistaloli, M-Y = Marabamba, W-Q = Winchuspata.
Disclaimer/Publisher’s Note: The statements, opinions and data contained in all publications are solely those of the individual author(s) and contributor(s) and not of MDPI and/or the editor(s). MDPI and/or the editor(s) disclaim responsibility for any injury to people or property resulting from any ideas, methods, instructions or products referred to in the content.

