Article

Microplastics Can Inhibit Organic Carbon Mineralization by Influencing Soil Aggregate Distribution and Microbial Community Structure in Cultivated Soil: Evidence from a One-Year Pot Experiment

College of Natural Resources and Environment Department of Soil Science, South China Agricultural University, Guangzhou 510642, China
*
Author to whom correspondence should be addressed.
Agronomy 2024, 14(9), 2114; https://doi.org/10.3390/agronomy14092114 (registering DOI)
Submission received: 8 August 2024 / Revised: 10 September 2024 / Accepted: 15 September 2024 / Published: 17 September 2024

Abstract

:
Microplastics (MPs) pollution has become a global pollution problem, potentially affecting soil carbon cycling and structure stability in agricultural systems. However, the effects of MPs pollution on soil organic carbon fractions/transformation and soil aggregate stability remain unknown. Thus, a combination of one-year pot and short-term mineralized incubation experiments that involved a reference (CK, with no MPs), different concentrations (0.1, 1, and 2 w/w % polyethylene (PE)), and types (0.1 w/w % PE, polypropylene (PP), and polyvinyl chloride (PVC)) of MPs were carried out to investigate the effects on the soil aggregate stability and organic carbon mineralization after one year of adding MPs. The results showed that the size distribution of the soil partial aggregates varied significantly as affected by the MP concentration and type (p ˂ 0.05). Compared with 0.1% PE, significant increases in the MWD (mean weight diameter) and GMD (geometric mean diameter) of 2% PE of 27.22% and 32.73%, respectively, were detected. In addition, high concentrations (>1%) of PE significantly decreased the dissolved organic carbon (DOC) (p ˂ 0.05), whereas they significantly increased the stable carbon fractions including the particulate organic carbon (POC) and mineral-bound organic carbon (MOC) (p ˂ 0.01). Meanwhile, compared with the CK, both MP types and doses significantly decreased the soil organic carbon mineralization rate (SOCMR) and cumulative mineralization amount (CM) (p ˂ 0.001). Moreover, the MPs significantly increased the total PLFA (phospholipid fatty acid) by 261.9–438.8% (p ˂ 0.01), and the soil pH and total PLFA were the dominant factors that affected the SOCMR as affected by MPs. Thus, a high concentration (>1%) of PE significantly decreased the SOCMR by influencing the soil pH, TN, and macroaggregate (R>0.25) content and microbial community composition. This study provided evidence of the feedback of MPs pollution on soil C dynamic and aggregates in cultivated soil in South China.

1. Introduction

Microplastics (<5 mm), persistent pollutants with limited reversibility, are accumulating in the environment due to improper waste management practices [1]. MP pollution has been reported in several ecosystems and become a global environmental issue [1,2]. Agricultural soils have been shown to be a major reservoir for MPs, receiving a steady stream of MPs from plastics mulching, sewage irrigation, composting, and garbage [3,4,5]. Recently, it has been reported that the average abundance of MPs was as high as 4817.9 items kg−1 in agricultural fields in southern China, which was mainly attributed to agricultural plastic films and compost [6]. Several studies have confirmed a significant linear relationship between the MP concentration in soil and the duration of mulching [5,7], suggesting that MP concentrations in agricultural soils will continue to increase in the future. Moreover, given their difficult degradation, MPs may act as a concealed carbon source in soils, altering soil physicochemical and microbial properties, which affect soil structure ability and carbon cycling processes [2,8,9].
Soil aggregates are reservoirs of soil organic carbon (SOC), and their distributions and stability directly affected soil carbon sequestration and transformation processes in agricultural soil [10]. Soil mineral particles form microaggregates (<0.25 mm) that gradually constitute the macroscopic soil structure through formation and turnover processes under the cementing action of organic matter [11]. In addition, the fragmentation of soil aggregates resulted in the decomposition of organic matter [12]. Conversely, the soil aggregate structure physically protects organic carbon from microbial and enzymatic decomposition and reduces carbon loss [13]. Agricultural soils served as an important sink for MPs, and different concentrations and types of MPs affected the soil aggregation process [14]. The main reason may be that MPs promoted the soil aggregation process by altering the aggregate-related SOC content or microbial processes [15]. However, there is currently a lack of information on how and to what extent MPs pollution affects soil aggregates and SOC in agricultural systems.
MPs are carbon-rich polymers that may affect SOC and the stability of soil aggregates by acting as an additional source of soil carbon [16]. Recent studies have highlighted the effects of MP addition on various soil carbon fractions, including the promotion of SOC and dissolved organic carbon (DOC) content and increased soil microbial biomass carbon [17]. Machado et al. [18] studied the effect of different types of MPs on the stability of soil aggregates and found that the presence of PE-MPs significantly increased the content of soil water-stable aggregates, while the addition of PET-MPs decreased the content of water-stable aggregates. In terms of the MP concentration, Zhang et al. [19] found that when polyester fiber was added to the soil at 0.3% (w/w), it resulted in a significant increase of 44% in the water-stable macroaggregate content. In addition, MPs have been found to indirectly affect the stability of soil aggregates by affecting the abundance of keystone taxa of soil bacteria such as Bacteroidetes, Chloroflexi, and Actinobacteria [20], thus providing feedback on the soil carbon cycle and influencing SOC mineralization and CO2 emissions. However, these studies mainly focused on the effects of MPs on the soil aggregate structure, organic carbon mineralization, and microorganisms in short-term controlled experiments [20,21]. How MP contamination affects soil organic carbon in long-term experiments is not clear.
South China is located in a typical tropical as well as subtropical transition area, and because of its high-temperature weather, soil desilication and iron-rich alienization are intense, and there exists a low soil structure ability and different soil organic carbon fractions/transformations [22,23], and in laterite soils, the sticky heavy particles in this area prevent MPs from moving and thus they accumulate in the soil layer [24], which may further affect the soil structure and organic carbon transformation. Therefore, we established both pot experiments and indoor incubation to disentangle the impact of different MP concentrations and types on the soil aggregate stability and organic carbon mineralization in vegetable fields in South China. We hypothesized that (i) MPs can increase the soil aggregate stability, with the effect varying depending on the microplastic concentration and type; and (ii) MPs can affect soil organic carbon mineralization by affecting the stability of soil aggregates and the microbial community structure.

2. Materials and Methods

2.1. Site Description

The pot experiment was conducted from October 2021 to October 2022 under natural light and ambient temperature in the greenhouse at South China Agricultural University. The soil samples were from the 0–20 cm soil layer of a multi-year intensive vegetable field without mulching in Huadu District, Guangzhou City China (23°4′N, 113°4′E). The climate was subtropical monsoon with an average annual temperature of 21.4–21.9°C, an average relative humidity of 68–77%, and an average annual rainfall of 1689–1886 mm. The test soil was clay loam soil, classified as grey tidal loam with 27% clay, 39.8% silt, and 33.2% sand. The basic soil properties included a pH of 6.23, total nitrogen (TN) of 1.66 g kg−1, soil organic carbon (SOC) of 18.36 g kg−1, and maximum field water-holding capacity of 524.30 mg kg−1. After removing visible plant residues, the collecting soil was air-dried and then stored by sieving through a sieve with a 5 mm pore size for the set-up of the pot experiment.

2.2. Material Preparation and Experimental Design

Previous studies have found that the most common plastic types in soil are mainly polyethylene (PE), polypropylene (PP), and polyvinyl chloride (PVC) (Zhang et al., 2021), so these three types of plastic granule with 0.6 mm diameter were used as our MP materials (obtained from Qingtian Plastic Co., DongGuan, China). Six treatments were set up, including two experiments for concentration and type. The concentration experiment was divided into different concentrations (0.1%, 1%, and 2% PE of soil dry weight) and without microplastic treatment (CK), while the type experiment was the same concentration (0.1% PE, PP, and PVC of soil dry weight). Each treatment was replicated three times and presented a total of 18 experimental units. The concentration of MP treatment was selected based on its actual content in agriculture soil [25,26]. As reported, the abundance of soil MPs ranged from 0.34 to 410958.9 items kg−1 and the concentration ranged from 0.002 to 67,500 mg kg−1 across sites [26]. At the same time, the extensive use of PE agricultural films has led to the accumulation of PE-MPs. Therefore, 0.1%, 1%, and 2% PE and 0.1% PP and PVC were designed to reflect multiple types of plastic contamination of soils in southern China, as well as future trends of plastic contamination in agricultural soils [6].
At the time of pot filling in September 2021, MPs were first sterilized with UV light for 30 min to reduce microbial contamination, and then soil fractions and MPs were thoroughly mixed according to the pot experimental design. Finally, the 12 kg (dry weight equivalent) of tested soils for each treatment was filled into a PVC pot with 40 cm height and 18 cm diameter, and each pot was set up with a plastic base to prevent excessive water loss. Vegetable plants were grown for three seasons in total, namely, two consecutive seasons of Brassica parachinensis L. H. Bailey (Flowering Chinese Cabbage) and one season of Ipomoea aquatica Forsk (Water spinach), and there was a fallow period between two seasons’ harvest. Before the start of vegetable planting, all soils had been maintained at a field capacity of 60% soil moisture content for 30 days to improve initial soil aggregation. Then, vegetable seedlings were germinated and grown for 2 weeks and transplanted into test pots of seedlings. During the pot experimental period, the position of the pots was adjusted from time to time to balance the light, and soil moisture was kept constant with 60% water-holding capacity based on the gravimetric method with 2–3-day intervals. The experiment was conducted using 168 kg N ha−1 urea as basal fertilizer, which was applied as a single application before transplanting, dissolved in distilled water and applied uniformly on the soil surface. The details are shown in Table 1.

2.3. Soil Sample Collection

At the end of the pot experiment, 5 soil cores (0–20 cm) were randomly sampled in each pot and mixed as a composite sample. After that, the soil sample was divided into three parts: the first part was sieved to determine the soil chemical properties, the second part was stored at 4 °C to determine soil microbial community and soil organic carbon-degrading enzymes, and the last part was used to study soil organic carbon mineralization characteristics in laboratory incubation experiments.

2.4. Measurement Methods

2.4.1. Soil Chemical Properties

Soil pH (soil:water = 1:2.5 (v/v)) was measured using a PHS-3C mv/pH electrode (Shanghai, China). SOC content was measured by oxidation with K2Cr2O7 and concentrated H2SO4, followed by titration of the extracts with FeSO4 [27]. Soil total nitrogen (TN) was determined by the semi-micro Kjeldahl method. Soil available nitrogen (AN) was determined by the diffusion method after incubation with 1 M NaOH for 24 h [28]. Soil cation-exchange capacity (CEC) was determined using the 1M Ammonium acetate exchange method [29]. Soil available phosphorus (AP) was determined by the molybdenum antimony anti-colorimetric method after leaching in a sodium bicarbonate solution [30].
Soil dissolved organic carbon (DOC) was determined using a TOC analyzer (LIQUIC TOCII, Hanau, Germany). Soil easily oxidizable carbon (EOC) was determined by the potassium permanganate oxidation method [31]. Soil hot water-soluble organic carbon (HWOC) was determined by the distilled water extraction method [32]. Soil particulate organic carbon (POC) was determined by the sodium hexametaphosphate method [33]. The mineral-bound organic carbon (MOC) content was the difference between the total organic carbon content and the content of the organic state in the particulate state. Microbial biomass carbon (MBC) was measured following the chloroform fumigation–extraction method [34].

2.4.2. Composition and Stability Indices of Soil Aggregates

Soil aggregates were determined by the wet sieve method modified from Tang et al. [35]. Specifically, the air-dried soil was sieved through 5 mm and 2 mm sieves, respectively, and after mixing, 50 g of soil samples with particle sizes of 2–5 mm was weighed and placed on the sieve set (the apertures of the sieve set were 2 mm, 0.25 mm, and 0.053 mm from top to bottom), and then the sieve set was placed in the agglomerates’ automatic analyzer to be moistened with pure water for 10 min, and sieved for 2 min at a frequency of 30 times/min and an amplitude of 5 cm from top to bottom. After sieving, large macroaggregates (>2 mm), small macroaggregates (0.25~2 mm), microaggregates (0.053~0.25 mm), and silt and clay (<0.053 mm) were obtained, respectively. The samples were dried in an oven at 55 °C until constant weight, and then weighed after 24 h at room temperature.
Aggregate stability indices were denoted by water-stable macroaggregates (R > 0.25, %), mean weight diameter (MWD, mm), geometric mean diameter (GMD, mm), and fractal dimension (FD), which were calculated as follows:
R > 0.25 = M > 0.25 / M 0 × 100 %
where R>0.25 is the content of water-stable macroaggregates (%); M>0.25 is the mass of aggregates > 0.25 mm (g); M0 is the sum of the masses (g) of all grain sizes of soil particles.
MWD = i n x i w i / i n w i
G M D = exp ( i n w i ln   x i / i n w i )
where xi is the average diameter of the water-stable aggregates of each particle size (mm). wi is the percentage content of water-stable aggregates of each particle size (%).
( 3 F D ) lg ( d i / d max ) = lg ( W ( δ d i ) / W )
where di indicates the average diameter of each particle size (mm), dmax indicates the diameter of soil particles with a particle size of 2 mm, W (δ ≤ di) indicates the sum of soil weights with size ≤ di, and W refers to the sum of the weights of the soils.

2.4.3. Soil Microbial Community Composition and Enzyme Activities

According to a modified method by Frostegård et al. [36], PLFAs were extracted from 2 g of freeze-dried sieved soil samples. Briefly, the soil samples were extracted from phospholipids using a phosphate buffer–chloroform–methanol mixture in a volumetric ratio (0.8:1:2), and the phospholipids were isolated from a 3 mL silica column (ANPEL Laboratory Technologies Inc., Shanghai, China). Finally, PLFAs were collected and detected using gas chromatography (GC) on a GC flame ionization detector system (Agilent Technologies 7890A GC system) and a specialized MIDI Sherlock Microbial Identification System. The individual PLFA concentrations (nmol g−1) were calculated according to the internal standard 19:0. The sum of all bacteria, fungi, and actinomycetal PLFA biomarkers was used to calculate the total PLFA. The key ratios of the following specific fatty acids were calculated: Gram-positive bacteria/Gram-negative bacteria (G+/G−) and fungi/bacteria. The PLFAs that are used as biomarkers for specific microbiota are listed in Table S1 and more details were described in Liu et al. [37].
The activities of enzymes related to soil carbon turnover, including polyphenol oxidase and β-glucosidase, were determined using a soil enzyme activity assay kit (Solarbio, Beijing, China). About 0.02–0.05 g of fresh soil samples was sequentially added, incubated, centrifuged, and finally analyzed with a UV-1780 spectrophotometer (Shimadzu, Suzhou, China) according to the instructions of the Soil Enzyme Activity Assay Kit. All measurements were repeated three times [38].

2.4.4. Soil Organic Carbon Mineralization

Soil organic carbon mineralization rate was determined by using the alkali absorption method [39]. Briefly, fresh soil samples were sieved through a 2 mm sieve, and the moisture content was adjusted to 60% of the field capacity using ultrapure water. The soil samples were pre-incubated at 25 °C in a thermostatic incubator (LRH-250-II, Guangdong, China) for one week; then, fresh soil, equivalent to 20 g dry weight, was weighed and placed uniformly in 250 mL flasks, followed by the addition of 5 mL of NaOH solution (0.2 mol L−1) into a 10 mL beaker, and then the cap seal was installed and they were placed in a 25 °C thermostatic incubator (LRH-250-II, Guangdong, China). Under the condition of keeping the soil humidity, they were incubated in the dark for one month, then slowly taken out of the small beaker containing NaOH solution in the incubation bottle and replaced with a new beaker on days 1, 3, 8, 20, 25, and 30 after incubation and titrated with standard hydrochloric acid solution (0.05 mol L−1). Based on the CO2 emissions absorbed by the NaOH solution during soil incubation, the SOC mineralization rate (MR) and cumulative mineralization amount (CM) were calculated as determined by the method of Bai et al. [40].

2.5. Statistical Analysis

Statistical analyses were performed using SPSS 21.00 (SPSS Inc., Chicago, IL, USA). Following the one-way ANOVA, Duncan’s multiple comparison was carried out to find the difference among treatments at a significance level of p = 0.05. Redundancy analysis (RDA) with the Monte Carlo permutation test (a method for testing the significance of the variables by automatic selection) was used to determine which environmental variables best explained the variation in the soil aggregate stability and soil carbon mineralization after removing the variables with significant commonality. The analysis was performed with Canoco5.0 software (Biometry, Wageningen, The Netherlands). The figures were plotted by using Origin 2021 (Origin Lab, Northampton, MA, USA).

3. Results

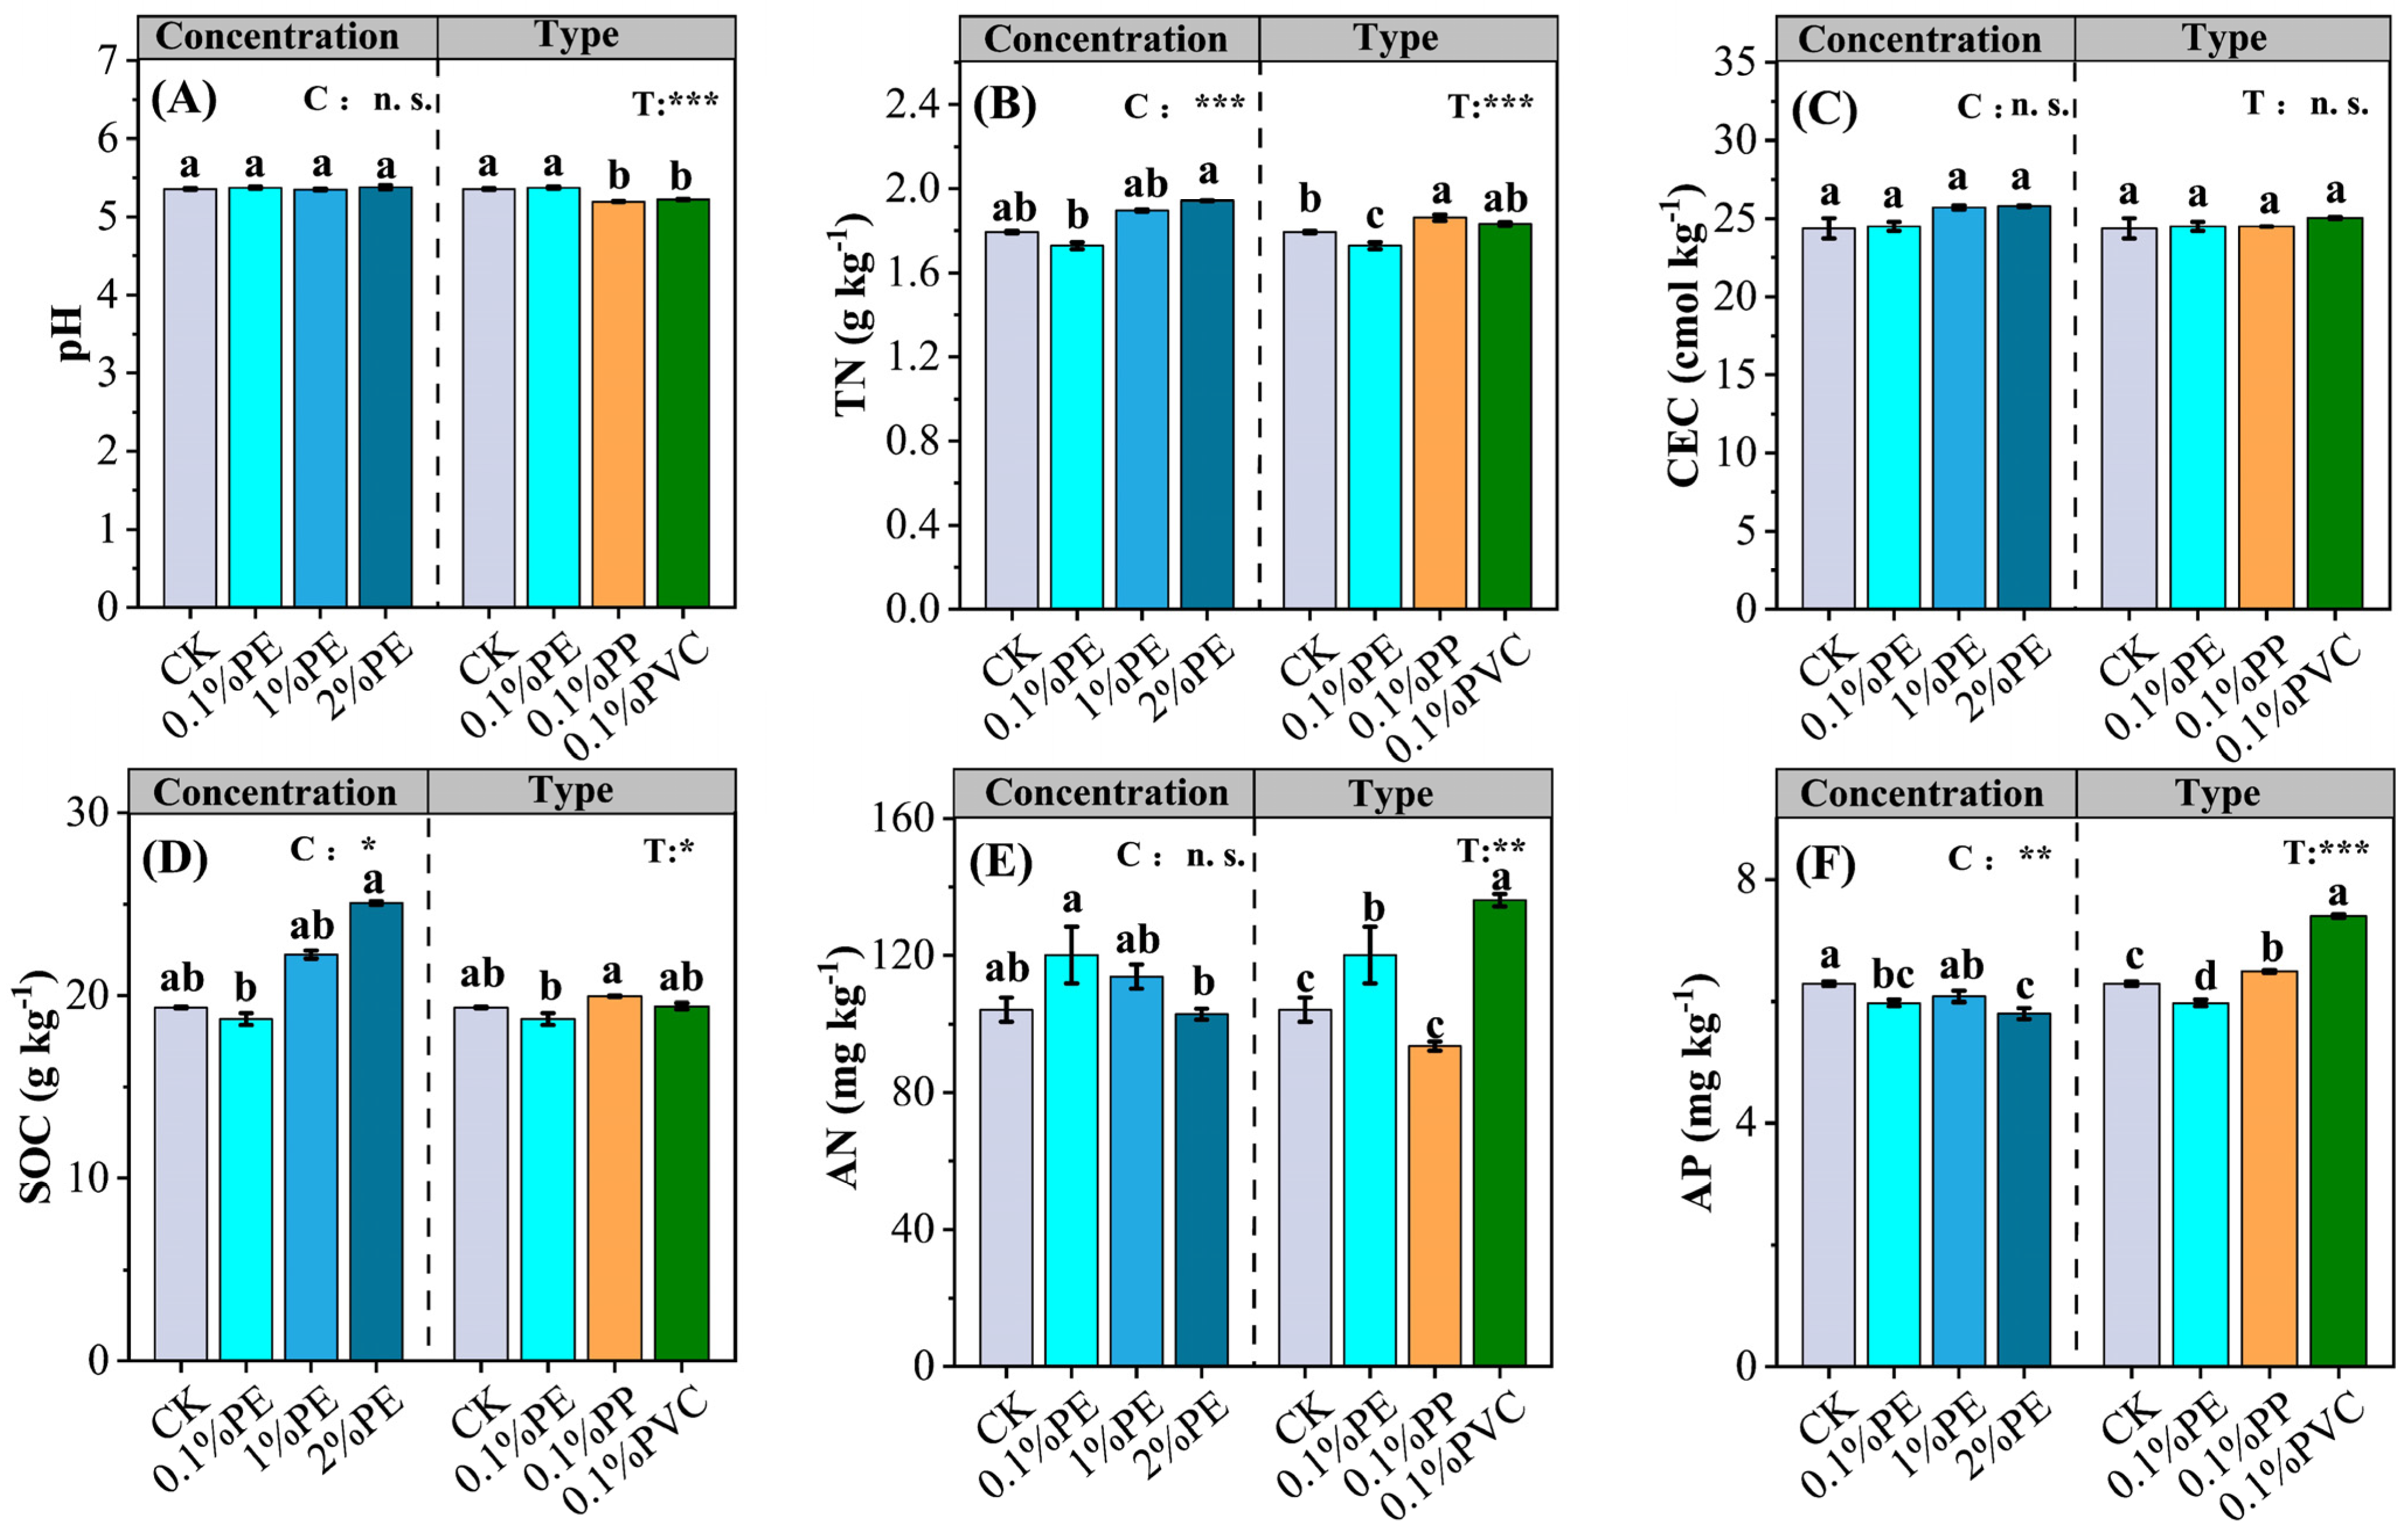
3.1. Soil Properties

The soil properties responded differently to both the MP concentrations and types (Figure 1). Compared with the CK, the concentration of PE had no effect on the soil pH, while the presence of PP and PVC significantly decreased the soil pH (Figure 1A, p < 0.05). In addition, compared to 0.1% PE, 2% PE significantly increased the soil TN (Figure 1B). However, none of the PE, PP, or PVC significantly affected the CEC content (Figure 1C, p < 0.05). Overall, with the accumulation of PE, the soil SOC was first decreased and then promoted, in which 0.1% PE decreased by 3.30% and 2% PE increased by 29.43% in relation to the treatments without MPs (Figure 1D, p < 0.001). In contrast, the soil AN content was first increased and then decreased with the increasing PE concentration, varying with the type of MPs (Figure 1E). Compared to the CK, the soil AP was significantly reduced by 5.0% with PE, increased significantly by 3.2% with PP, and increased significantly by 17.6% with PVC at the same MP addition (0.1%) (Figure 1F, p < 0.05).

3.2. Particle Size Distribution and Stability Characteristic Indicators of Soil Aggregate

Table 2 depicts the effect of microplastics on the particle size distribution of soil water-stable aggregates. MPs significantly affected some of the soil water-stable aggregates’ particle sizes, with the effect varying with the concentration and type. Specifically, 0.1% PE decreased the soil macroaggregate content and increased the microaggregates and silt and clay content, without a significant impact. However, PE changed the distribution of soil aggregates with increasing concentrations, promoting the transformation of microaggregates and silt and clay to small macroaggregates and macroaggregates. In addition, compared to the CK, 0.1% PE significantly reduced the large macroaggregate fraction, while 0.1% PP significantly increased the large macroaggregate fraction (Table 2, p < 0.01), which demonstrated that various MP types can affect the soil aggregate stability differently.
The effect of MPs on the stability of soil water-stable aggregates are shown in Figure 2. Different concentrations and different types of MPs significantly affected the R>0.25 (Figure 2A, p < 0.05). Specifically, the variation in the content of the water-stable aggregates R>0.25 with a microplastic concentration was 0.1% PE < CK < 1% PE < 2% PE, which indicated that the R>0.25 were significantly affected by the PE concentration (p < 0.05). In addition, different concentrations of PE had no significant effect on either the MWD or GMD (Figure 2B,C; p > 0.05). However, the MWD and GMD in the 2% PE were significantly increased by 27.22% and 32.73%, respectively, compared with the 0.1% PE (Figure 2B,C; p < 0.05). In addition, different concentrations and types of MPs had no significant effects on the FD (Figure 2D, p > 0.05). Specifically, the FD values were first increased and then decreased with the increasing PE concentration, in which 2% PE reduced the FD values compared with the CK (Figure 2D). The correlation analysis showed that the GMD and MWD were significantly positively correlated with the macroaggregate content (Table 3, p < 0.01), whereas the FD was significantly negatively correlated with the small macroaggregate content (Table 3, p < 0.05).

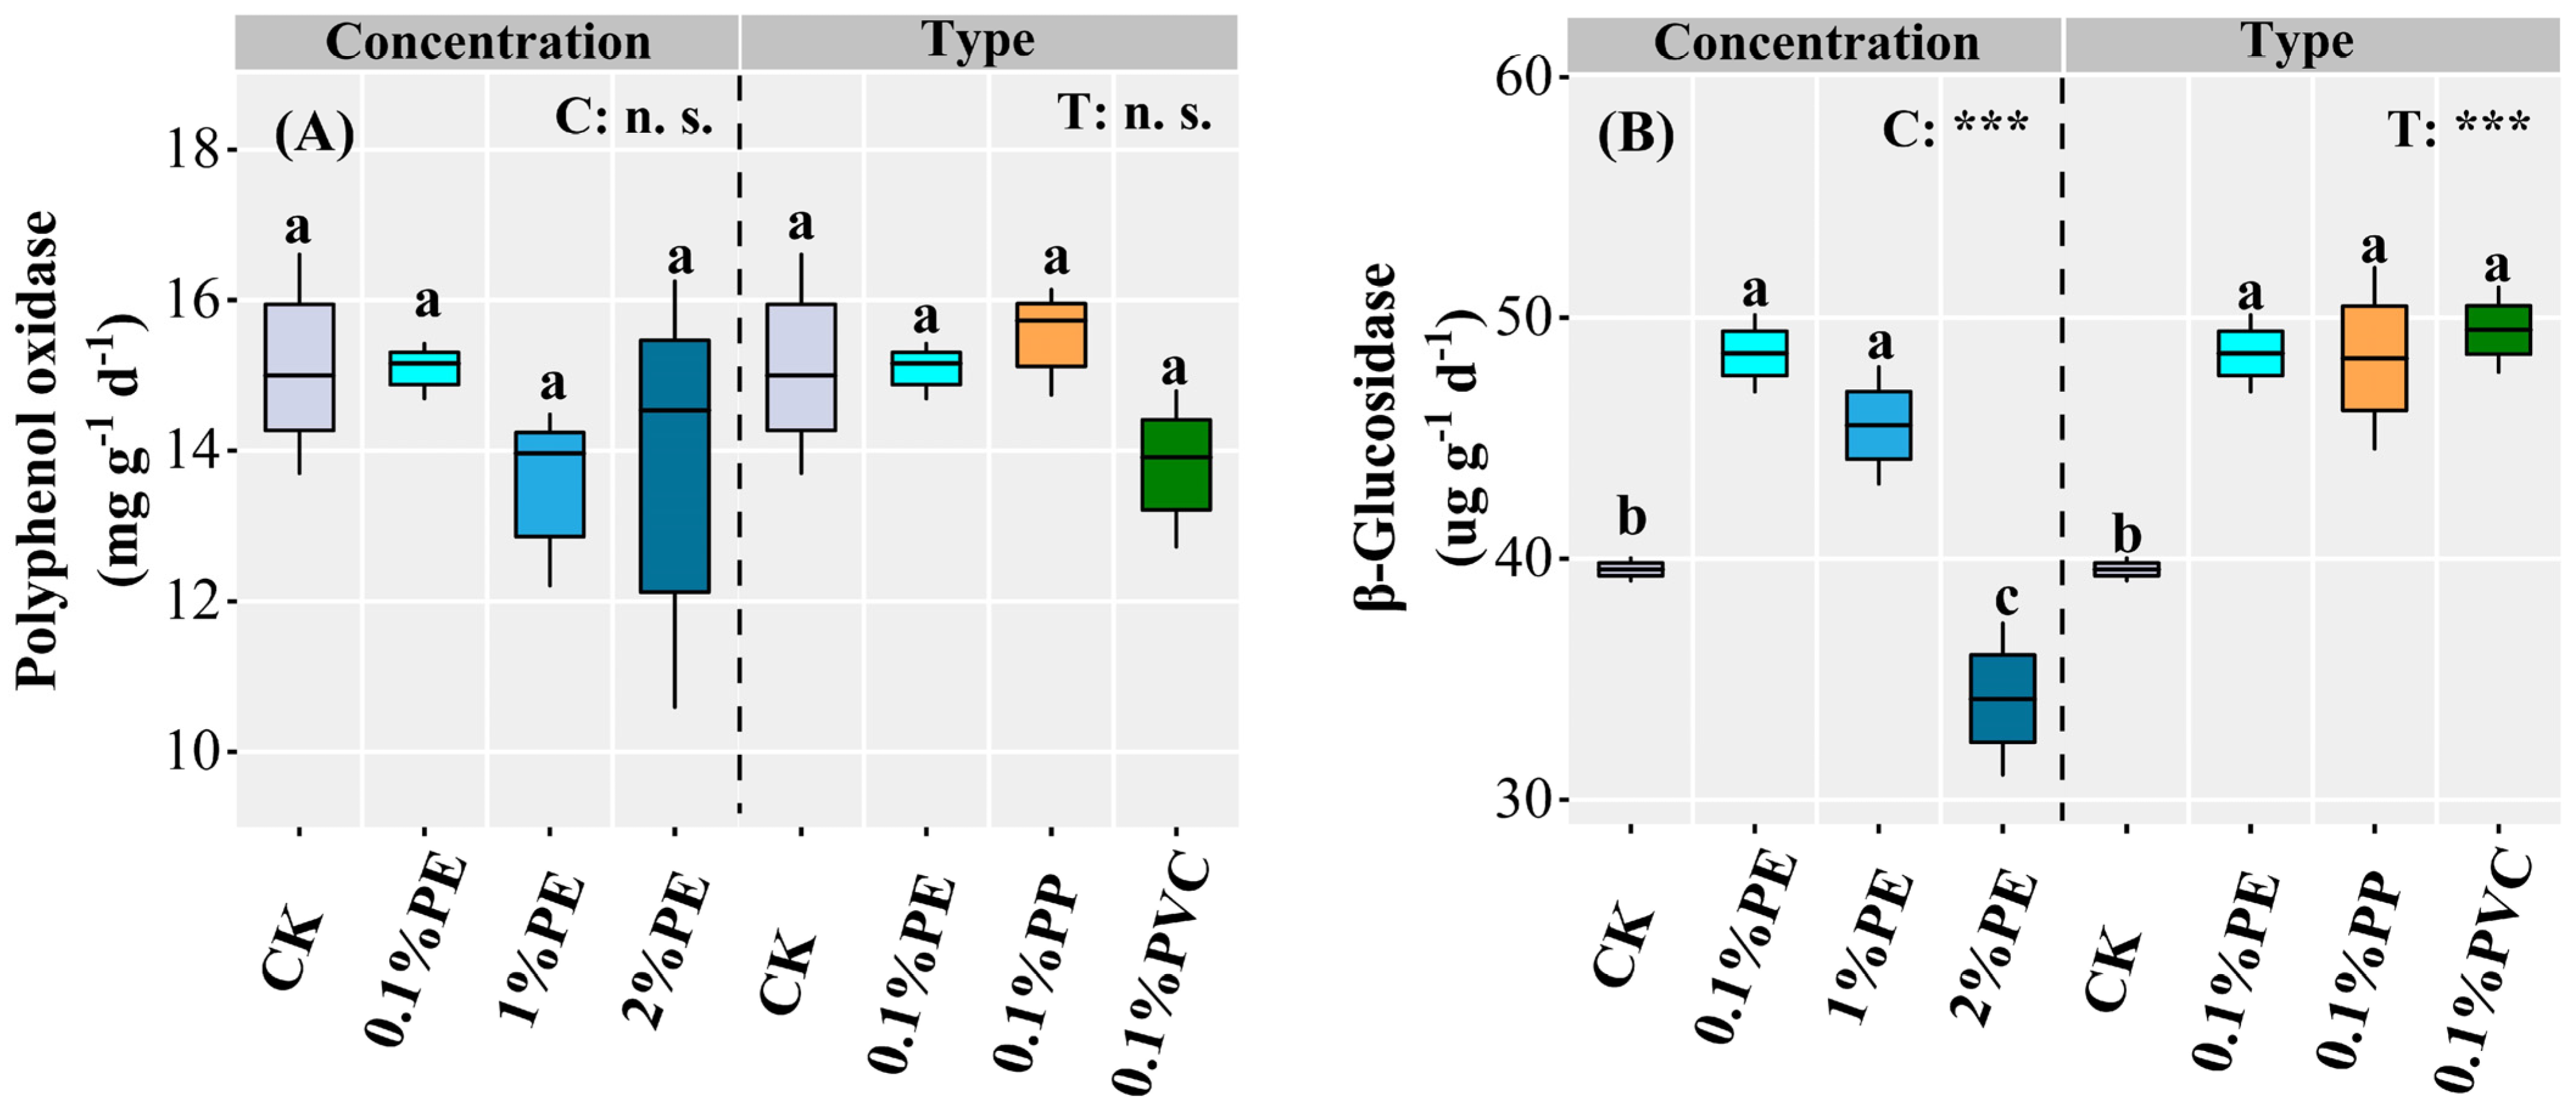
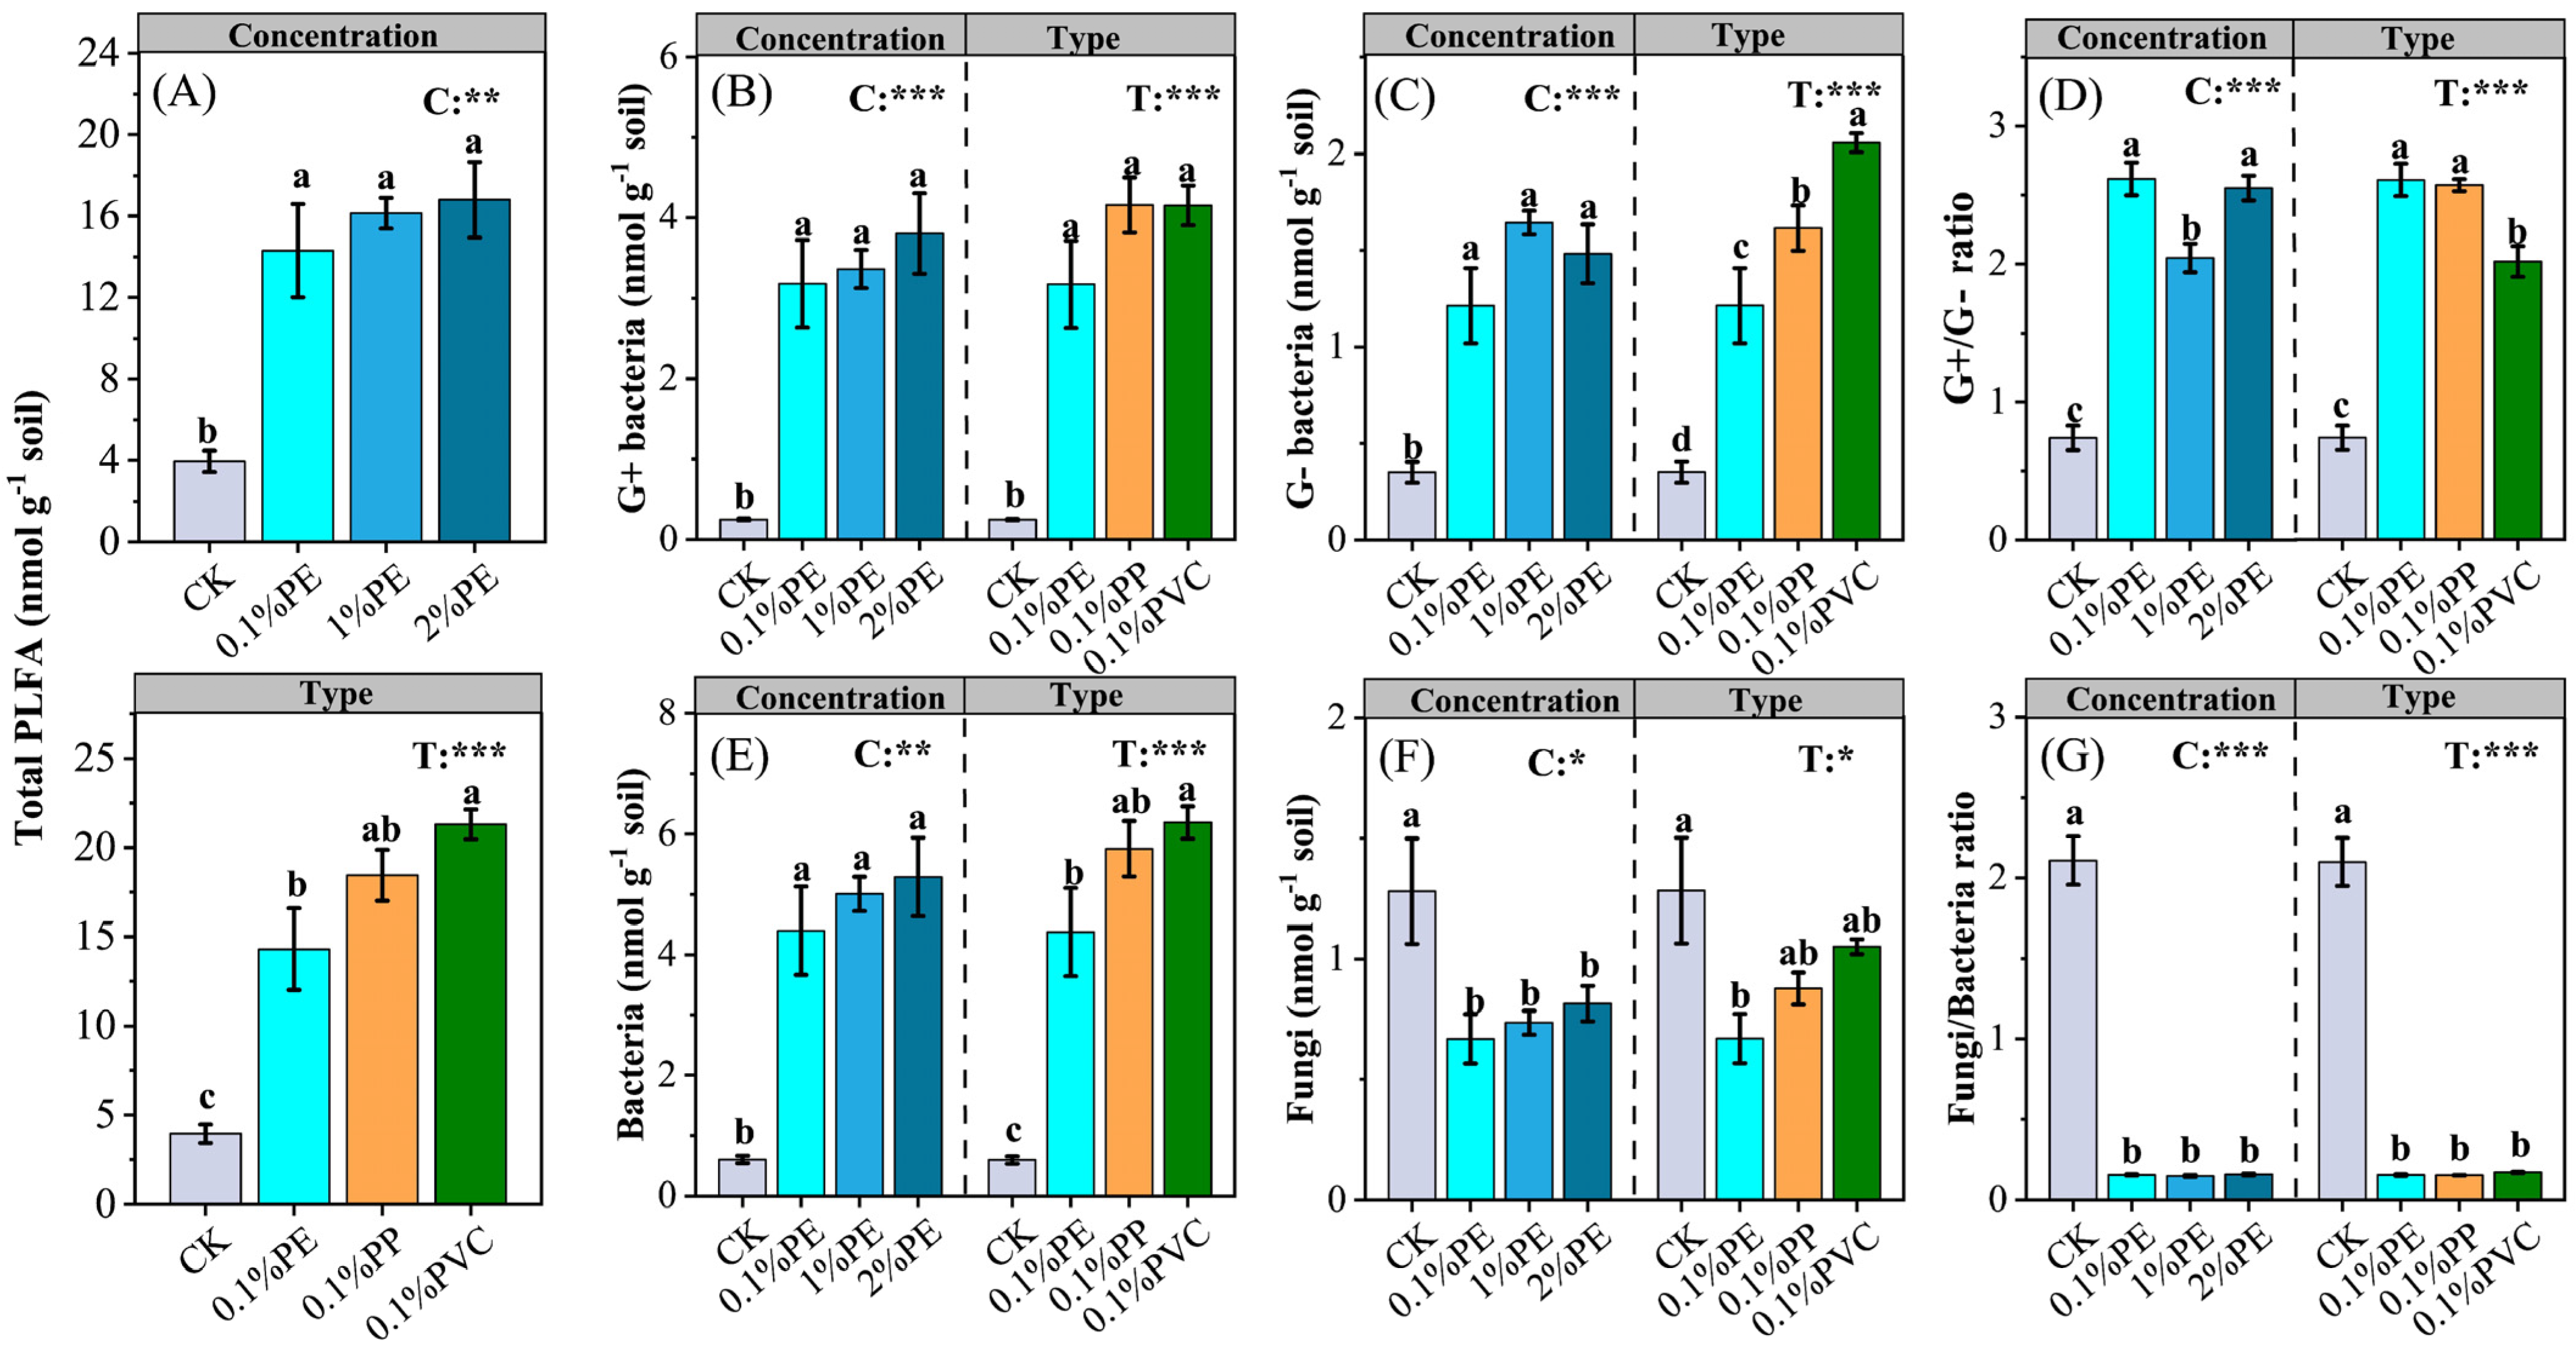
3.3. Soil Microbial Communities and Enzyme Activities

Different concentrations and types of MPs had no significant effect on the soil polyphenol oxidase, but significantly affected β-glucosidase (Figure 3, p < 0.01). Compared with the CK, the PE addition decreased the polyphenol oxidase activity, whereas different types of MPs had inconsistent effects on the soil polyphenol oxidase activity (Figure 3A). In addition, compared with the CK, the β-glucosidase activity was significantly increased in 0.1% PE and 1% PE, but significantly decreased in 2% PE (Figure 3B, p < 0.01).
MP addition significantly altered the microbial community structure in the soil, with the magnitude of change strongly dependent on the MP concentrations and types (Figure 4 and Figure S1; p < 0.05). Compared to the CK, the total PLFA was enhanced significantly with the addition of PE by 261.9–325.3% (p < 0.01), but different types of MPs affected the total PLFA differently (Figure 4A). Compared to the CK, PE significantly increased the Gram-positive (G+) and Gram-negative (G−) bacteria by 117.2–142.1% and 246.5–369.3%, respectively (Figure 4B,C; p < 0.001). Similarly, bacteria significantly increased by 632.3–780.7% with the increasing PE concentration compared to the CK (Figure 4E, p < 0.01). In contrast, compared to the CK, PE significantly reduced fungi, which led to a shift in the dominant soil flora from fungi to bacteria (Figure 4F,G; p < 0.05).

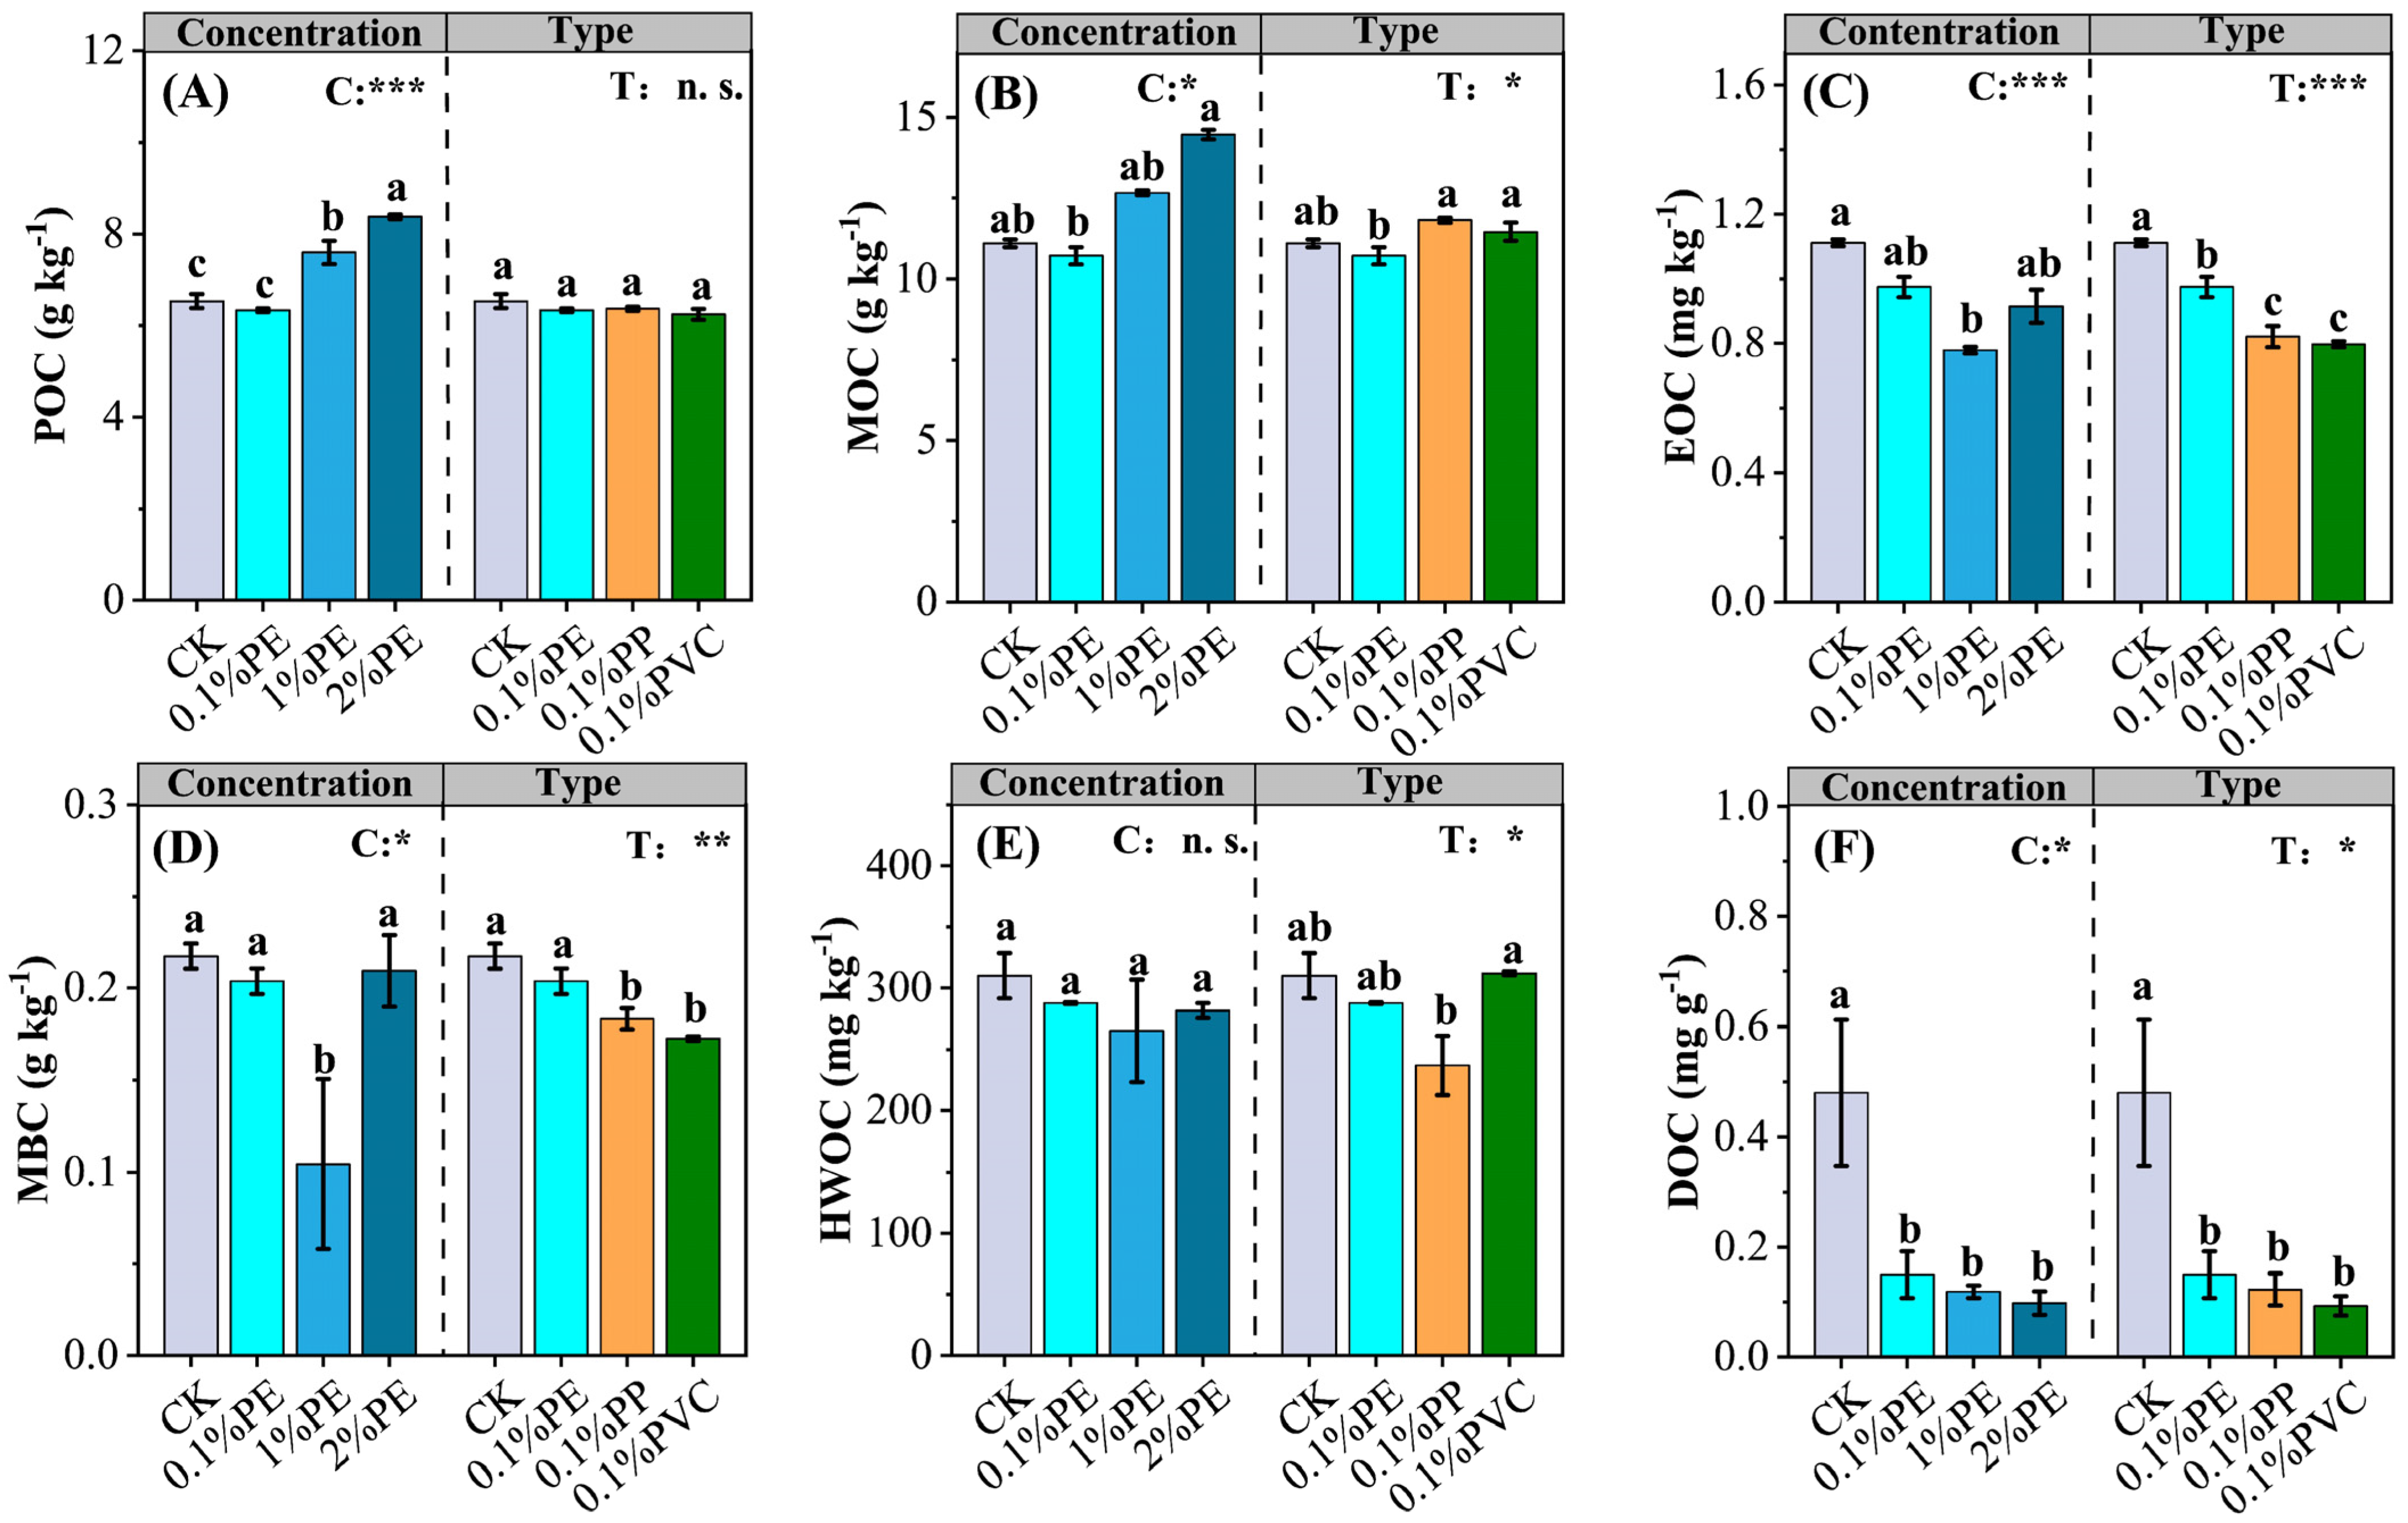
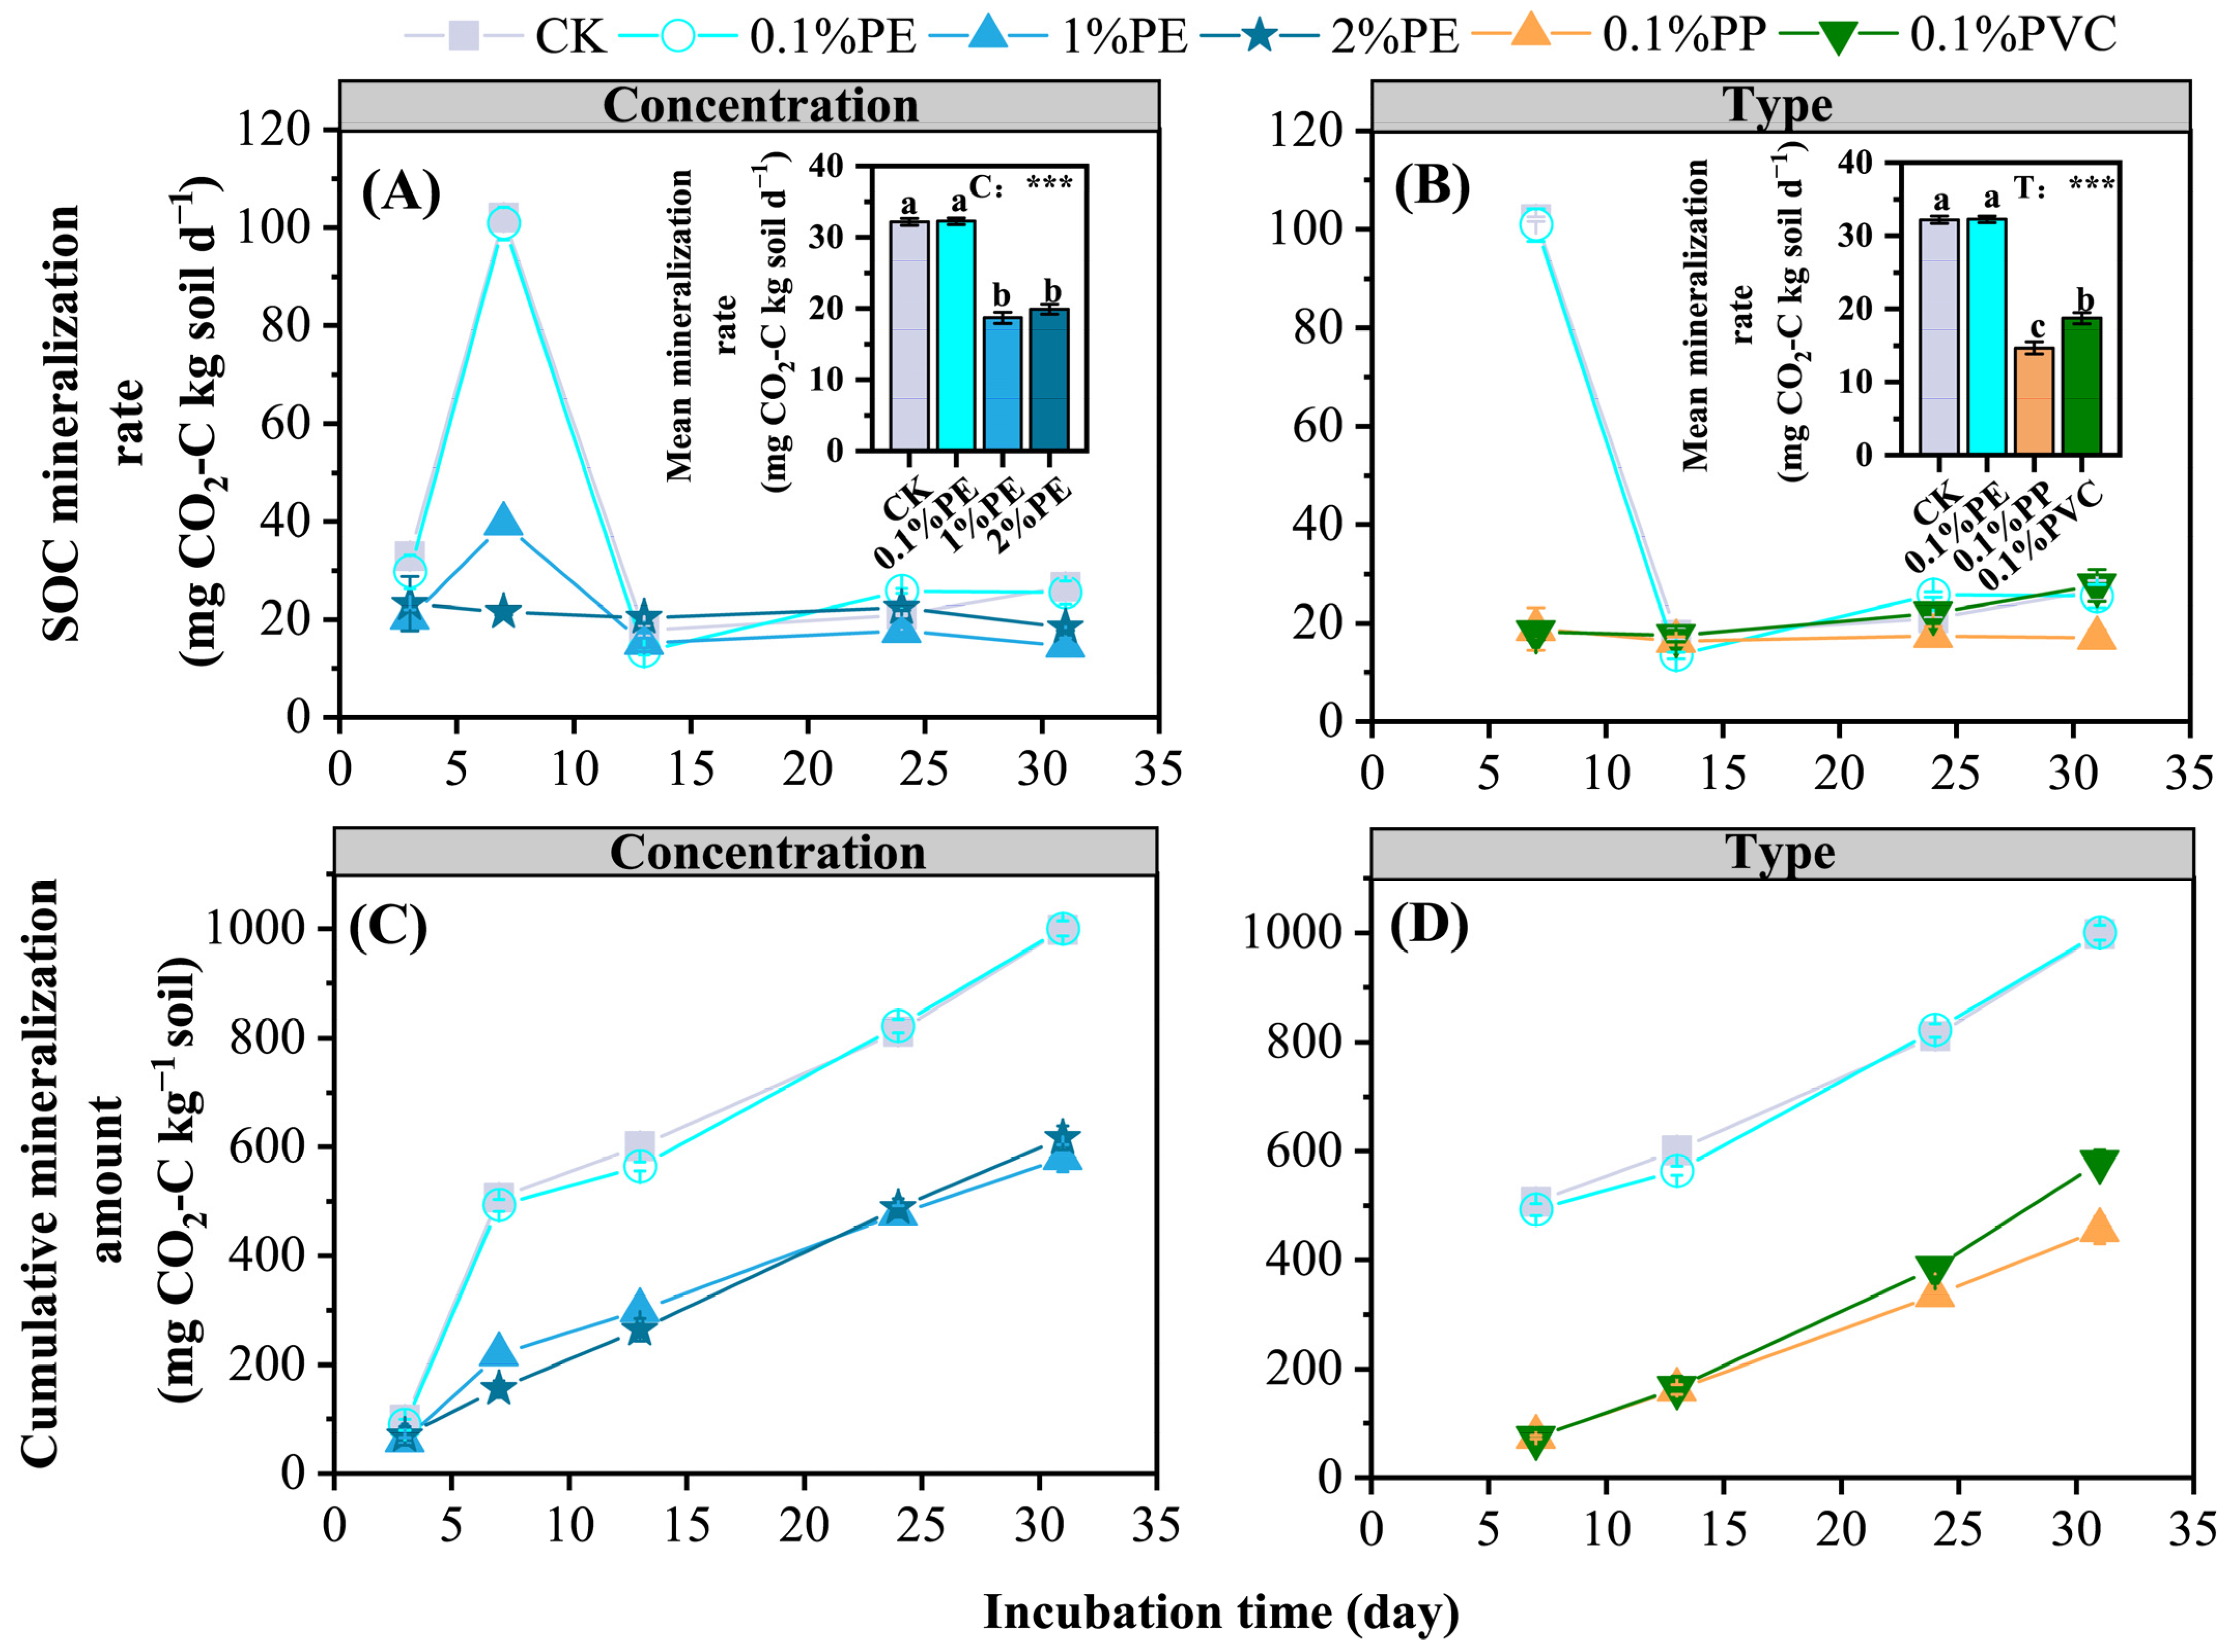
3.4. SOC Transformations
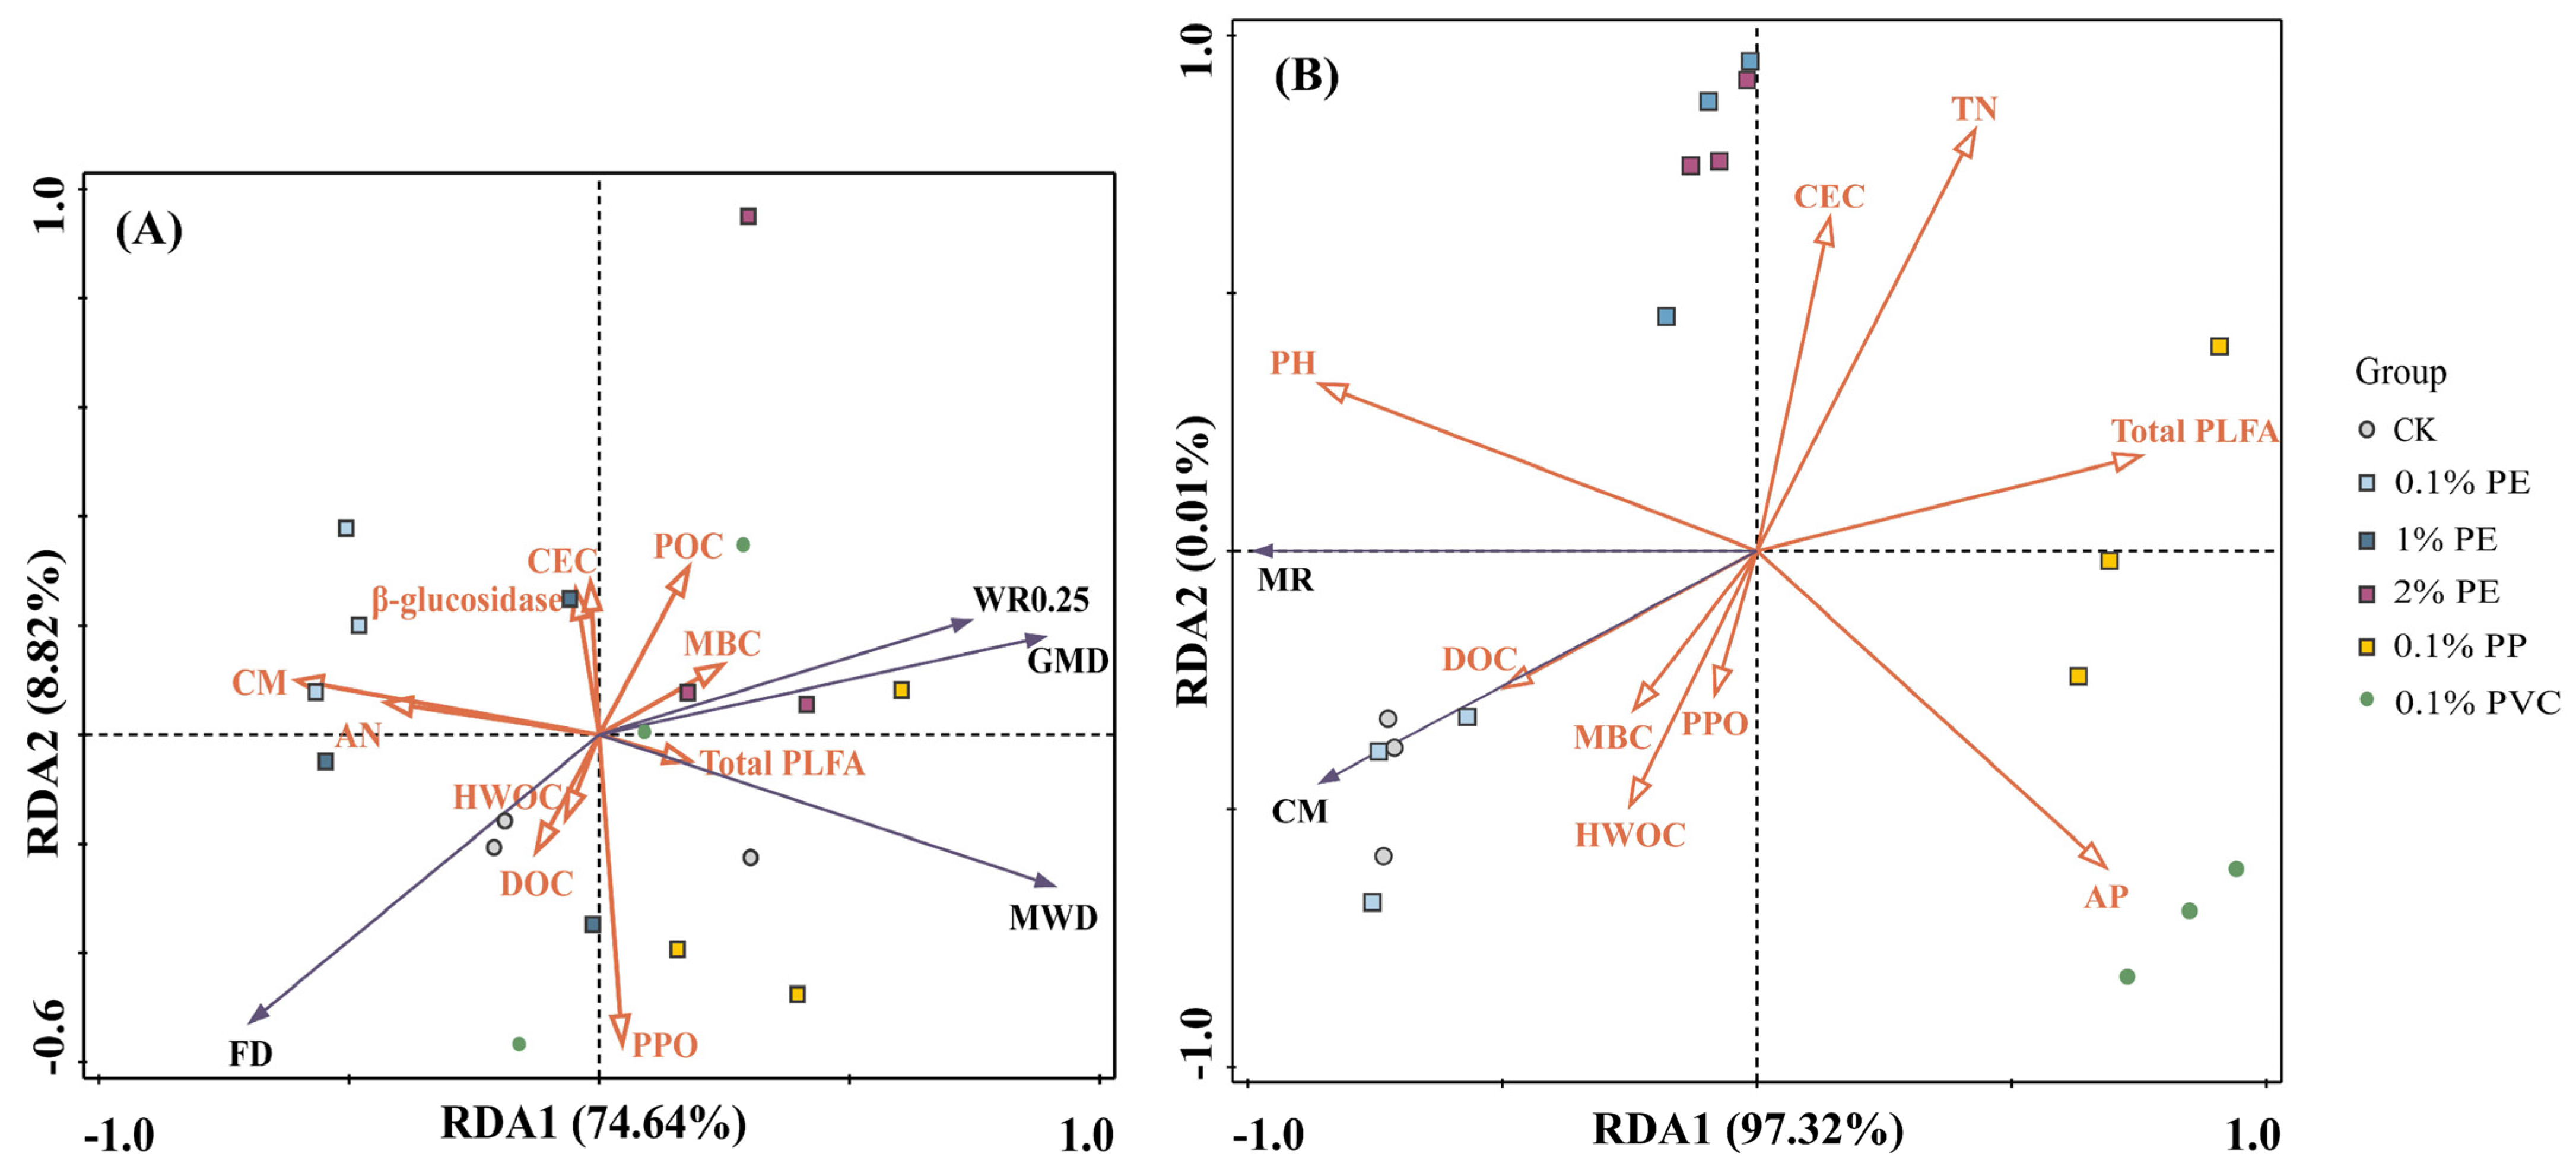
The presence of PE significantly affected the soil stable carbon fraction content including the POC and MOC (Figure 5A,B; p < 0.001). The soil POC and MOC was slightly reduced by 0.1% PE, while 1% PE and 2% PE increased the soil POC and MOC (Figure 5A,B; p < 0.001). However, compared to the CK, there was no significant difference in the POC and MOC contents with different types of MPs. Overall, the addition of MPs reduced the soil labile carbon fractions including the EOC, MBC, and DOC (Figure 5C–F). Compared with the CK, the EOC in PP and PVC was significantly reduced by 26.21% and 28.34%, respectively (Figure 5C, p < 0.05). Moreover, compared to the CK, 1% PE significantly reduced the MBC by 51.99% (Figure 5D, p < 0.05). Compared to the CK, different types of MPs significantly reduced the soil DOC by 68.75–80.61% (Figure 5F, p < 0.05).
As shown in Figure 6A,B, the MRs of 1% PE and 2% PE were overall lower than the CK, and significantly decreased by 61.29% and 78.92%, on the seventh day of incubation, respectively. Also, 1% PE had the lowest mean mineralization rate of 18.68 mg kg−1 d−1 and was significantly lower than the CK (Figure 6A, p < 0.05). Overall, except for the 0.1% PE, different concentrations and types of MPs led to a decrease in the SOC MR (Figure 6A,B), which was consistent with the changes in the content of the soil labile carbon fractions (Figure 5C–F). The trend of the CM changes in different concentrations of PE was similar to that of the MR (Figure 6C,D). At the end of incubation, 1% PE and 2% PE significantly reduced the CM by 41.94% and 38.2%, respectively, compared with the CK (Figure 6C, p < 0.01). However, compared to the CK, the CM was significantly reduced by 54.39% and 41.86% when 0.1% PP and 0.1% PVC were added (Figure 6D, p < 0.01). There was a significant correlation between the organic carbon fractions and mineralization (Table 4). Specifically, the MR was significantly negatively correlated with the POC and EOC (p < 0.05), while the CM was significantly positively correlated with the EOC and DOC (p < 0.05) and significantly negatively correlated with the MOC (p < 0.05).

3.5. RDA Analysis

The ordination diagram produced by RDA can be used to summarize the factors that influence the variation in the soil aggregate stability and SOC mineralization, reflecting that the first two RDA components explained 84.46% and 97.33% of the total variation, respectively (Figure 7). We used a partial Monte Carlo permutation test to evaluate the contributions of each environmental variable (Table 5). The soil aggregate stability was significantly negatively correlated with the CM and HWOC, but positively correlated with the MBC and total PLFA (p < 0.05). The SOC mineralization was significantly negatively correlated with the TN, AP, and total PLFA (p < 0.05), but positively correlated with the pH (p < 0.01). Among them, the CM, MBC, and total PLFA were the main factors controlling the stability of the soil aggregates, explaining 68% of the total variation. The pH and total PLFA explained the most variation in the SOC mineralization with 71.6% and 17.5%, respectively, and they were the most important factors influencing the soil SOC mineralization.

4. Discussion

4.1. Effects of MP Addition on Soil Aggregate Distribution and Stability in Vegetable Soils

According to one-way ANOVA, the addition of MPs effectively changed the soil water-stable aggregate distribution (Figure 2, p < 0.05). However, the effects showed a different trend among different MP types. PE decreased the large macroaggregate content in the soil, which is consistent with previous results [41,42]. This is probably because PE applied with a particle size of 0.6 mm can easily be incorporated into >2 mm macroaggregates, and thus affect their stability [43]. However, the R>0.25 showed an upward trend with the increasing concentration of PE compared to the 0.1% PE treatment, which implied that a high concentration of PE addition may enhance soil aggregation. Our data showed that PE effectively increased the SOC and total PLFA as compared to the CK, and 1% PE and 2% PE reached a significant level among all the treatments (Figure 1D and Figure 4A). The functional groups on the MPs’ surface may enhance their adsorption capacity after the aging process in soil, and thus facilitate the accumulation of organic matter and microorganisms. These effects may create an “accumulation area” for soil organic material transformation, and ultimately lead to the formation of organic cementing material [8,44]. Therefore, organic cementing material will further be generated and formed with the increase in the PE addition concentrations, which may offset the effects of MP particles on soil macroaggregate disintegration, and thus promote the formation of soil aggregates.
The mean weight diameter (MWD), geometric mean diameter (GMD), and fractal dimension (FD) of soil aggregates are vital indicators for assessing the aggregate stability [45]. In our results, low concentrations of PE (0.1%) slightly decreased the R>0.25, GMD, and MWD, and increased the FD. In contrast, high concentrations of PE (2%) increased the R>0.25 and GMD, and decreased the FD. The results showed that the soil aggregate stability substantially increased with the PE addition concentrations (Figure 2). Machado et al. [21] found that a high PE concentration (2% w/w) resulted in the highest content of soil water-stable aggregates, and similar results were obtained in our results. The main reason may be that 2% PE produced more organic cementing material by increasing the microbial activity and SOC (Figure 1D and Figure 3B), and thus facilitated the formation of aggregates. Our results did not completely confirm hypothesis (i), only high concentrations of MPs increased the soil aggregate stability, promoting the transformation of microaggregates to small macroaggregates and macroaggregates. Although PP did not affect the overall water-stable aggregate stability, it reduced the smaller aggregates and thus increased the proportion of large macroaggregates in the pot experiment (Figure 2, Table 2). Similarly, Yu et al. [8] found that PP did not affect the overall aggregate stability, but the percentage of large agglomerates increased, which partly provided the evidence that MPs may facilitate the soil aggregates’ formation.

4.2. Effects of MP Addition on Soil Carbon Fractions in Vegetable Soils

Soil organic carbon is one of the most important indicators of soil quality, and the changes in its fractions can provide further evidence of how MPs will affect soil carbon cycling in agricultural systems. Our results showed a significant decrease trend in the soil DOC as affected by different MP types and concentrations (Figure 5E). This is consistent with Liu et al. [46], which identified that different concentrations (0–6.0 g kg−1) of PE consistently reduced the soil DOC content. Similarly, a long-term field experiment (3 years) with PE granules showed that MPs reduced the DOC content by 12.5% as compared to the control [47]. These results indicated that MPs may increase the active potential SOC loss in soil [48]. In addition, both the MP type and concentration significantly reduced the MBC and EOC during the experimental period (Figure 5D), which may be due to MPs entering the vegetable soil, so the “priming effect” was greater than the “entombing effect”, resulting in the reduction in the associated SOC [49].
As an important component of SOC, the soil MOC plays an important role in SOC accumulation and sequestration due to its relatively high content, stable nature, and slow turnover rate [50,51]. The current findings indicated that the MOC content positively correlated with the PE concentration (Figure 5B, p < 0.01). This could be attributed to functional groups on the MPs’ surface being an electron donor–acceptor in soil microbial metabolism, and thus promoting the degradation of labile SOC and inducing microbes to transform it to stable SOC [21,52]. Previous studies have found that the contribution of microplastic C to the soil organic carbon pool is about 1.59% [53]. However, it is hard to determine whether the increased SOC came from the conversion of active carbon or microplastic C based on our current work. Therefore, further mechanistic studies are needed to determine the contribution of the MPs’ source C to the soil organic carbon pool.

4.3. Effects of MP Addition on Soil Organic Carbon Mineralization in Vegetable Soils

The incubation results showed that a low concentration (0.1%) of PE slightly increased the SOC mineralization, whereas high concentrations (1% and 2%) of PE significantly reduced the SOC mineralization (Figure 6, p < 0.001). Firstly, variations in the R>0.25 induced by different concentrations of PE may explain this difference (Figure 2A). Macroaggregates not only physically protected the SOC from microbial and enzymatic decomposition, but also the changes in pore space induced by MPs weaken the SOC decomposition and mineralization [54,55]. The significantly negative correlation between the CM and R>0.25 also further support the idea (Figure S2). Thus, a high concentration (1% and 2%) of PE significantly decreased the SOC mineralization by increasing the R>0.25 and suppressing the microbial and enzymatic breakdown of the SOC. In contrast, the CM was higher with low concentrations (0.1%) of PE compared to the CK (Figure 6C). Secondly, MPs also inhibited CO2 emission from soils by reducing the contents of mineralized substrates (EOC, MBC, and DOC) (Table 4, p < 0.01). In addition, a low concentration (0.1%) of PP and PVC significantly reduced the CM as compared to PE (Figure 6, p < 0.001), and the mechanisms affecting soil CO2 emissions may be multifaceted and varied with the soil and MP type and experimental conditions [56,57]. RDA and correlation analysis showed that the CM was positively correlated with the pH and negatively correlated with the TN (Figure 7 and Figure S2, p < 0.01). As one of the substrates for carbon mineralization, changes in the soil N content directly affect soil organic carbon mineralization [58,59]. In this study, a high concentration of MPs increased the soil TN content, and the soil N content increased with the increase in the MP concentration, which was similar to that of Ya et al. [60]. It is possible that MPs alter soil porosity and aggregates, thereby inhibiting soil denitrification and leading to an increase in the TN content by promoting the growth of nitrogen-fixing bacteria. In this case, high concentrations (1% and 2%) of MPs increased the soil TN content as well as decreased active carbon (Figure 1 and Figure 4), which may lead to the decrease in the soil C/N ratio and exacerbated soil carbon limitation, and thus inhibited soil organic carbon mineralization. In addition, as carbon-rich polymers, MPs degraded faster in acidic soils, and their leachates can be taken up by soil microorganisms, which contribute to increasing soil microbiota [2,17].
Normally, soil organic carbon mineralization is positively correlated with soil microbial activity [61]. However, there was a significant negative correlation between the CM and total PLFA and a significant positive correlation with the F/B under the addition of MPs (Figure S2, p < 0.01). Given that PE increased the microbial biomass (supported by PLFA) but decreased the SOC mineralization, we have attributed the main reason to shifts in the microbial community structure rather than biomass (Figure 4 and Figure 6). This is evidenced by the difference between the fungal and bacterial ratio (Figure 4). Specifically, the PE addition significantly reduced the fungal PLFA but increased the bacterial PLFA, thereby reducing the fungal-to-bacterial PLFAs (Figure 4E,F). Bacteria have lower C utilization efficiency than fungi, and lower C utilization efficiency means a lower activity of enzymes that promote organic matter decomposition [61,62]. Similarly, a significant reduction in the soil β-glucosidase activity by a high concentration (2%) of PE supported this view (Figure 3B, p < 0.01). Thus, a 2% PE addition limits soil organic carbon mineralization through reducing the ratio of fungal-to-bacterial PLFAs and β-glucosidase activity. Overall, MPs can affect soil carbon turnover by influencing the soil aggregate structural stability, microbial community composition, and enzyme activity.

5. Conclusions

Microplastics, after a one-year pot experiment, had positive effects on soil organic carbon (SOC), total nitrogen (TN), and microbial diversity, whereas they decreased the contents of labile C fractions, except for 0.1% PE. A high concentration (>1%) of PE changed the distribution of soil aggregates with increasing concentrations, promoting the transformation of microaggregates and silt and clay to small macroaggregates and macroaggregates. Furthermore, RDA and correlation analysis showed that the soil pH was the main factor affecting soil organic carbon mineralization under MP exposure, and the CM was negatively correlated with the TN and R>0.25, but positively correlated with the F/B. Therefore, high-concentration PE significantly decreased the soil organic carbon mineralization by changing the soil pH, increasing the soil TN and R>0.25, and changing the microbial community composition. Although the mechanisms behind our proposed findings need to be further explored, including the implicit contribution of microplastic C and its appropriate concentration thresholds, our results can provide a valuable reference for the management of soil microplastics pollution and soil health protection in vegetable fields in South China.

Supplementary Materials

The following supporting information can be downloaded at: https://www.mdpi.com/article/10.3390/agronomy14092114/s1, Figure S1: PLFAs for specific microbiota biomarkers in MP treatments.; Figure S2: Correlation of organic carbon mineralization with soil physico-chemical properties in MP treatments; Table S1: Phospholipid fatty acid biomarkers used for microbial community analysis [63,64,65,66].

Author Contributions

Conceptualization, Q.W., P.Z., and H.L.; methodology, Z.C.; software, Z.C., Q.W., P.Z., H.L., and Y.L. (Yige Liu); formal analysis, Bo Li; investigation, P.Z.; resources, Y.L. (Ying Lu); data curation, Z.C.; writing—original draft, Z.C.; writing—review and editing, Z.C. and B.L.; visualization, Z.C. and Q.W.; supervision, Y.L. (Yige Liu) and B.L.; project administration, Y.L. (Ying Lu) and B.L.; funding acquisition, Y.L. (Ying Lu) and B.L. All authors have read and agreed to the published version of the manuscript.

Funding

This work was supported by the National Natural Science Foundation of China (42277290,41807021) and Guangzhou Basic and Applied Basic Research Foundation (202201010416).

Data Availability Statement

The raw data supporting the conclusions of this article will be made available by the authors on request.

Acknowledgments

We thank the anonymous reviewers for their constructive comments.

Conflicts of Interest

The authors declare no conflicts of interest.

References

  1. MacLeo, M.; Arp, H.P.H.; Tekman, M.B.; Jahnke, A. The global threat from plastic pollution. Science 2021, 373, 61–65. [Google Scholar] [CrossRef]
  2. Rillig, M.C.; Lehmann, A. Microplastic in terrestrial ecosystems. Science 2020, 368, 1430–1431. [Google Scholar] [CrossRef] [PubMed]
  3. Corradini, F.; Meza, P.; Eguiluz, R.; Casado, F.; Huerta-Lwanga, E.; Geissen, V. Evidence of microplastic accumulation in agricultural soils from sewage sludge disposal. Sci. Total Environ. 2019, 671, 411–420. [Google Scholar] [CrossRef] [PubMed]
  4. Godoy, V.; Blázquez, G.; Calero, M.; Quesada, L.; Martín-Lara, M.A. The potential of microplastics as carriers of metals. Environ. Pollut. 2019, 255, 113363. [Google Scholar] [CrossRef] [PubMed]
  5. Huang, Y.; Liu, Q.; Jia, W.; Yan, C.; Wang, J. Agricultural plastic mulching as a source of microplastics in the terrestrial environment. Environ. Pollut. 2020, 260, 114096. [Google Scholar] [CrossRef]
  6. Ren, S.; Kai, W.; Jinrui, Z.; Jingjing, L.; Hanyue, Z.; Ruimin, Q.; Wen, X.; Changrong, Y.; Xuejun, L.; Fusuo, Z.; et al. Potential sources and occurrence of macro-plastics and microplastics pollution in farmland soils: A typical case of China. Crit. Rev. Environ. Sci. Technol. 2024, 54, 533–556. [Google Scholar] [CrossRef]
  7. Li, W.; Wufuer, R.; Duo, J.; Wang, S.; Luo, Y.; Zhang, D.; Pan, X. Microplastics in agricultural soils: Extraction and characterization after different periods of polythene film mulching in an arid region. Sci. Total Environ. 2020, 749, 141420. [Google Scholar] [CrossRef]
  8. Yu, Y.; Battu, A.K.; Varga, T.; Denny, A.C.; Zahid, T.M.; Chowdhury, I.; Flury, M. Minimal Impacts of Microplastics on Soil Physical Properties under Environmentally Relevant Concentrations. Environ. Sci. Technol. 2023, 57, 5296–5304. [Google Scholar] [CrossRef]
  9. Zhou, Z.; Hua, J.; Xue, J. Polyethylene microplastic and soil nitrogen dynamics: Unraveling the links between functional genes, microbial communities, and transformation processes. J. Hazard. Mater. 2023, 458, 131857. [Google Scholar] [CrossRef]
  10. Balabane, M.; Plante, A.F. Aggregation and carbon storage in silty soil using physical fractionation techniques. Eur. J. Soil Sci. 2004, 55, 415–427. [Google Scholar] [CrossRef]
  11. Amézketa, E. Soil Aggregate Stability: A Review. J. Sustain. Agric. 1999, 14, 83–151. [Google Scholar] [CrossRef]
  12. Liu, R.; Zhou, X.; Wang, J.; Shao, J.; Fu, Y.; Liang, C.; Yan, E.; Chen, X.; Wang, X.; Bai, S.H. Differential magnitude of rhizosphere effects on soil aggregation at three stages of subtropical secondary forest successions. Plant Soil. 2019, 436, 365–380. [Google Scholar] [CrossRef]
  13. Six, J.; Bossuyt, H.; Degryze, S.; Denef, K. A history of research on the link between (micro)aggregates, soil biota, and soil organic matter dynamics. Soil Tillage Res. 2004, 79, 7–31. [Google Scholar] [CrossRef]
  14. Ju, T.; Yang, K.; Chang, L.; Zhang, K.; Wang, X.; Zhang, J.; Xu, B.; Li, Y. Microplastics sequestered in the soil affect the turnover and stability of soil aggregates: A review. Sci. Total Environ. 2023, 904, 166776. [Google Scholar] [CrossRef]
  15. Zhao, Z.-Y.; Wang, P.-Y.; Wang, Y.-B.; Zhou, R.; Koskei, K.; Munyasya, A.N.; Liu, S.-T.; Wang, W.; Su, Y.-Z.; Xiong, Y.-C. Fate of plastic film residues in agro-ecosystem and its effects on aggregate-associated soil carbon and nitrogen stocks. J. Hazard. Mater. 2021, 416, 125954. [Google Scholar] [CrossRef]
  16. Zhang, G.S.; Liu, Y.F. The distribution of microplastics in soil aggregate fractions in southwestern China. Sci. Total Environ. 2018, 642, 12–20. [Google Scholar] [CrossRef]
  17. Xiang, Y.; Rillig, M.C.; Peñuelas, J.; Sardans, J.; Liu, Y.; Yao, B.; Li, Y. Global Responses of Soil Carbon Dynamics to Microplastic Exposure: A Data Synthesis of Laboratory Studies. Environ. Sci. Technol. 2024, 58, 5821–5831. [Google Scholar] [CrossRef]
  18. Machado, A.A.d.S.; Lau, C.W.; Till, J.; Kloas, W.; Lehmann, A.; Becker, R.; Rillig, M.C. Impacts of Microplastics on the Soil Biophysical Environment. Environ. Sci. Technol. 2018, 52, 9656–9665. [Google Scholar] [CrossRef]
  19. Zhang, G.S.; Zhang, F.X.; Li, X.T. Effects of polyester microfibers on soil physical properties: Perception from a field and a pot experiment. Sci. Total Environ. 2019, 670, 1–7. [Google Scholar] [CrossRef]
  20. Han, L.; Chen, L.; Feng, Y.; Kuzyakov, Y.; Chen, Q.a.; Zhang, S.; Chao, L.; Cai, Y.; Ma, C.; Sun, K.; et al. Microplastics alter soil structure and microbial community composition. Environ. Int. 2024, 185, 108508. [Google Scholar] [CrossRef]
  21. Machado, A.A.d.S.; Lau, C.W.; Kloas, W.; Bergmann, J.; Bachelier, J.B.; Faltin, E.; Becker, R.; Görlich, A.S.; Rillig, M.C. Microplastics can change soil properties and affect plant performance. Environ. Sci. Technol. 2019, 53, 6044–6052. [Google Scholar] [CrossRef]
  22. Jiang, S.; Liu, X.; Lu, Y.; Wu, J.; Zhang, L.; Wang, J.; Wu, W. Profile and nano-scale distribution of soil organic carbon for upland and paddy soils from an alluvial plain in South China. Chem. Geol. 2023, 640, 121740. [Google Scholar] [CrossRef]
  23. Lu, X.; Hou, E.; Guo, J.; Gilliam, F.S.; Li, J.; Tang, S.; Kuang, Y. Nitrogen addition stimulates soil aggregation and enhances carbon storage in terrestrial ecosystems of China: A meta-analysis. Global Change Biol. 2021, 27, 2780–2792. [Google Scholar] [CrossRef]
  24. Cao, L.; Wu, D.; Liu, P.; Hu, W.; Xu, L.; Sun, Y.; Wu, Q.; Tian, K.; Huang, B.; Yoon, S.J.; et al. Occurrence, distribution and affecting factors of microplastics in agricultural soils along the lower reaches of Yangtze River, China. Sci. Total Environ. 2021, 794, 148694. [Google Scholar] [CrossRef] [PubMed]
  25. Rillig, M.C. Microplastic Disguising As Soil Carbon Storage. Environ. Sci. Technol. 2018, 52, 6079–6080. [Google Scholar] [CrossRef]
  26. Wei, H.; Wu, L.; Liu, Z.; Saleem, M.; Chen, X.; Xie, J.; Zhang, J. Meta-analysis reveals differential impacts of microplastics on soil biota. Ecotoxicol. Environ. Saf. 2022, 230, 113150. [Google Scholar] [CrossRef]
  27. Yeomans, J.C.; Bremner, J.M. A rapid and precise method for routine determination of organic carbon in soil. Commun. Soil Sci. Plant Anal. 1988, 19, 1467–1476. [Google Scholar] [CrossRef]
  28. Lu, R. Soil Agricultural Chemistry Analytical Method; Chinese Agricultural Science and Technology Press: Beijing, China, 2000. [Google Scholar]
  29. Li, K.-w.; Lu, H.-l.; Nkoh, J.N.; Hong, Z.-n.; Xu, R.-k. Aluminum mobilization as influenced by soil organic matter during soil and mineral acidification: A constant pH study. Geoderma 2022, 418, 115853. [Google Scholar] [CrossRef]
  30. Mitran, T.; Mani, P.K.; Basak, N.; Mazumder, D.; Roy, M. Long-term manuring and fertilization influence soil inorganic phosphorus transformation vis-a-vis rice yield in a rice–wheat cropping system. Arch. Agron. Soil Sci. 2016, 62, 1–18. [Google Scholar] [CrossRef]
  31. Blair, G.; Lefroy, R.; Lisle, L. Soil Carbon Fractions Based on Their Degree of Oxidation, and the Development of a Carbon Management Index for Agricultural Systems. Aust. J. Agric. Res. 1995, 46, 1459–1466. [Google Scholar] [CrossRef]
  32. Ghani, A.; Dexter, M.; Perrott, K.W. Hot-water extractable carbon in soils: A sensitive measurement for determining impacts of fertilisation, grazing and cultivation. Soil Biol. Biochem. 2003, 35, 1231–1243. [Google Scholar] [CrossRef]
  33. Cambardella, C.A.; Elliott, E.T. Particulate Soil Organic-Matter Changes across a Grassland Cultivation Sequence. Soil Sci. Soc. Am. J. 1992, 56, 777–783. [Google Scholar] [CrossRef]
  34. Vance, E. An extraction method for measuring soil microbial biomass C. Soil Biol. Biochem. 1987, 19, 703–707. [Google Scholar]
  35. Tang, X.; Huang, W.; Lu, Y.; Li, B.; Wang, C.; Dong, Y. Characteristics and Stability of Organic Carbon and Ferric Oxidein in Soil Aggregates and Aggregate Stability in Lateritic Red Soil Region, Guangdong Province. J. Soil Water Conserv. 2021, 35, 200–209. (In Chinese) [Google Scholar] [CrossRef]
  36. Frostegård, Å.; Tunlid, A.; Bååth, E. Phospholipid Fatty Acid Composition, Biomass, and Activity of Microbial Communities from Two Soil Types Experimentally Exposed to Different Heavy Metals. Appl. Environ. Microbiol. 1993, 59, 3605–3617. [Google Scholar] [CrossRef]
  37. Liu, Y.; Shi, M.; Chen, Z.; Tang, Z.; Tan, J.; Tian, J.; Elsgaard, L.; Lu, Y.; Li, B. Nonlinear effects of biochar on greenhouse gas emissions and soil microbial community composition under intensive vegetable production in South China. Appl. Soil Ecol. 2023, 189, 104975. [Google Scholar] [CrossRef]
  38. Guo, Q.Q.; Xiao, M.R.; Ma, Y.; Niu, H.; Zhang, G.S. Polyester microfiber and natural organic matter impact microbial communities, carbon-degraded enzymes, and carbon accumulation in a clayey soil. J. Hazard. Mater. 2021, 405, 124701. [Google Scholar] [CrossRef]
  39. Núñez, S.; Martínez-Yrízar, A.; Búrquez, A.; García-Oliva, F. Carbon mineralization in the southern Sonoran Desert. Acta Oecologica. 2001, 22, 269–276. [Google Scholar] [CrossRef]
  40. Bai, Y.; Ma, L.; Degen, A.A.; Rafiq, M.K.; Kuzyakov, Y.; Zhao, J.; Zhang, R.; Zhang, T.; Wang, W.; Li, X.; et al. Long-term active restoration of extremely degraded alpine grassland accelerated turnover and increased stability of soil carbon. Global Change Biol. 2020, 26, 7217–7228. [Google Scholar] [CrossRef]
  41. Fang, Z.; Sallach, J.B.; Hodson, M.E. Size- and concentration-dependent effects of microplastics on soil aggregate formation and properties. J. Hazard. Mater. 2024, 465, 133395. [Google Scholar] [CrossRef]
  42. Lehmann, A.; Leifheit, E.F.; Gerdawischke, M.; Rillig, M.C. Microplastics have shape- and polymer-dependent effects on soil aggregation and organic matter loss—An experimental and meta-analytical approach. Microplast. Nanoplast. 2021, 1, 7. [Google Scholar] [CrossRef]
  43. Lozano Yudi, M.; Lehnert, T.; Linck, L.T.; Lehmann, A.; Rillig, M.C. Microplastic Shape, Polymer Type, and Concentration Affect Soil Properties and Plant Biomass. Front. Plant Sci. 2021, 12, 714541. [Google Scholar] [CrossRef]
  44. Huang, Y.; Zhao, Y.; Wang, J.; Zhang, M.; Jia, W.; Qin, X. LDPE microplastic films alter microbial community composition and enzymatic activities in soil. Environ. Pollut. 2019, 254, 112983. [Google Scholar] [CrossRef] [PubMed]
  45. Padbhushan, R.; Rakshit, R.; Das, A.; Sharma, R.P. Effects of various organic amendments on organic carbon pools and water stable aggregates under a scented rice-potato-onion cropping system. Paddy Water Environ. 2016, 14, 481–489. [Google Scholar] [CrossRef]
  46. Liu, Y.; Hu, W.; Huang, Q.; Qin, J.; Zheng, Y.; Wang, J.; Li, X.; Wang, Q.; Guo, G.; Hu, S. Plastic mulch debris in rhizosphere: Interactions with soil-microbe-plant systems. Sci. Total Environ. 2022, 807, 151435. [Google Scholar] [CrossRef]
  47. Sun, Y.; Ji, J.; Tao, J.; Yang, Y.; Wu, D.; Han, L.; Li, S.; Wang, J. Current advances in interactions between microplastics and dissolved organic matters in aquatic and terrestrial ecosystems. Trac-Trends Anal. Chem. 2023, 158, 116882. [Google Scholar] [CrossRef]
  48. Maie, N.; Watanabe, A.; Kimura, M. Chemical characteristics and potential source of fulvic acids leached from the plow layer of paddy soil. Geoderma 2004, 120, 309–323. [Google Scholar] [CrossRef]
  49. Zhang, H.; Huang, Y.; Shen, J.; Xu, F.; Hou, H.; Xie, C.; Wang, B.; An, S. Mechanism of polyethylene and biodegradable microplastic aging effects on soil organic carbon fractions in different land-use types. Sci. Total Environ. 2024, 912, 168961. [Google Scholar] [CrossRef]
  50. Hassink, J. The capacity of soils to preserve organic C and N by their association with clay and silt particles. Plant Soil. 1997, 191, 77–87. [Google Scholar] [CrossRef]
  51. Zhao, L.; Sun, Y.; Zhang, X.; Yang, X.; Drury, C. Soil organic carbon in clay and silt sized particles in Chinese mollisols: Relationship to the predicted capacity. Geoderma 2006, 132, 315–323. [Google Scholar] [CrossRef]
  52. Shi, J.; Sun, Y.; Wang, X.; Wang, J. Microplastics reduce soil microbial network complexity and ecological deterministic selection. Environ. Microbiol. 2022, 24, 2157–2169. [Google Scholar] [CrossRef] [PubMed]
  53. Yu, Y.; Zhang, Z.; Zhang, Y.; Jia, H.; Li, Y.; Yao, H. Abundances of agricultural microplastics and their contribution to the soil organic carbon pool in plastic film mulching fields of Xinjiang, China. Chemosphere 2023, 316, 137837. [Google Scholar] [CrossRef] [PubMed]
  54. Han, L.; Sun, K.; Jin, J.; Xing, B. Some concepts of soil organic carbon characteristics and mineral interaction from a review of literature. Soil Biol. Biochem. 2016, 94, 107–121. [Google Scholar] [CrossRef]
  55. Krull, E.S.; Baldock, J.A.; Skjemstad, J.O. Importance of mechanisms and processes of the stabilisation of soil organic matter for modelling carbon turnover. Funct. Plant Biol. FPB 2003, 30, 207–222. [Google Scholar] [CrossRef] [PubMed]
  56. Hong, Y.; Zheng, Z.; Ying, Z.; Qidao, S.; Ping, F.; Beidou, X.; Wenbing, T. Effects of microplastics on soil organic carbon and greenhouse gas emissions in the context of straw incorporation: A comparison with different types of soil. Environ. Pollut. 2021, 288, 117733. [Google Scholar] [CrossRef]
  57. Shi, J.; Wang, Z.; Peng, Y.; Fan, Z.; Zhang, Z.; Wang, X.; Zhu, K.; Shang, J.; Wang, J. Effects of Microplastics on Soil Carbon Mineralization: The Crucial Role of Oxygen Dynamics and Electron Transfer. Environ. Sci. Technol. 2023, 57, 13588–13600. [Google Scholar] [CrossRef]
  58. Gao, W.; Ma, T.; Shi, B.; Yang, Z.; Li, Y.; Zhu, J.; He, J.-S. Effects of nitrogen and phosphorus addition on the mineralization potential of soil organic carbon and the corresponding regulations in the Tibetan alpine grassland. Appl. Soil Ecol. 2024, 196, 105314. [Google Scholar] [CrossRef]
  59. Li, J.; Han, G.; Wang, G.; Liu, X.; Zhang, Q.; Chen, Y.; Song, W.; Qu, W.; Chu, X.; Li, P. Imbalanced nitrogen-phosphorus input alters soil organic carbon storage and mineralisation in a salt marsh. Catena 2022, 208, 105720. [Google Scholar] [CrossRef]
  60. Ya, H.; Xing, Y.; Zhang, T.; Lv, M.; Jiang, B. LDPE microplastics affect soil microbial community and form a unique plastisphere on microplastics. Appl. Soil Ecol. 2022, 180, 104623. [Google Scholar] [CrossRef]
  61. Crowther, T.W.; Van den Hoogen, J.; Wan, J.; Mayes, M.A.; Keiser, A.D.; Mo, L.; Averill, C.; Maynard, D.S. The global soil community and its influence on biogeochemistry. Science 2019, 365, eaav0550. [Google Scholar] [CrossRef]
  62. Tao, F.; Huang, Y.; Hungate, B.A.; Manzoni, S.; Frey, S.D.; Schmidt, M.W.I.; Reichstein, M.; Carvalhais, N.; Ciais, P.; Jiang, L.; et al. Microbial carbon use efficiency promotes global soil carbon storage. Nature 2023, 618, 981–985. [Google Scholar] [CrossRef] [PubMed]
  63. Bai, Z.; Ma, Q.; Wu, X.; Zhang, Y.; Yu, W. Temperature sensitivity of a PLFA-distinguishable microbial community differs between varying and constant temperature regimes. Geoderma 2017, 308, 54–59. [Google Scholar] [CrossRef]
  64. Fraterrigo, J.M.; Balser, T.C.; Turner, M.G. Microbial community variation and its relationship with nitrogen mineralization in historically altered forests. Ecology 2006, 87(3), 570–579. [Google Scholar] [CrossRef]
  65. Turpeinen, R.; Kairesalo, T.; Häggblom, M.M. Microbial community structure and activity in arsenic-, chromium- and copper-contaminated soils. FEMS Microbiol. Ecol. 2004, 47, 39–50. [Google Scholar] [CrossRef]
  66. Hamman, S.T.; Burke, I.C.; Stromberger, M.E. Relationships between microbial community structure and soil environmental conditions in a recently burned system. Soil Biol. Biochem. 2007, 39, 1703–1711. [Google Scholar] [CrossRef]
Figure 1. Soil physicochemical properties in different MP treatments. Note: (A) represents the pH; (B) represents the content of total nitrogen (TN); (C) represents the content of cation exchange (CEC); (D) represents the content of soil organic carbon (SOC); (E) represents the content of alkaline dissolved nitrogen (AN); (F) represents the content of soil effective phosphorus (AP); CK: treatment without MPs; C: concentration; T: type. MPs’ effects on soil physicochemical properties were analyzed using one-way ANOVA analysis. Different lowercase letters indicate significant differences between different treatments (Duncan’s test, p < 0.05). *: p < 0.05; **: p < 0.01; ***: p < 0.001; n. s.: indicates no significant difference.
Agronomy 14 02114 g001
Figure 2. Soil water-stable aggregate stability in different MP treatments. Note: (A) represents the content of large aggregate (R > 0.25); (B) represents the mean weight diameter (MWD); (C) represents the geometric mean diameter (GMD); (D) represents the fractal dimension (FD). Different lowercase letters indicate significant differences between different treatments (Duncan’s test, p < 0.05). C: concentration; T: type. *: p < 0.05; **: p < 0.01; n. s.: indicates no significant difference.
Agronomy 14 02114 g002
Figure 3. Soil enzyme activities in different MP treatments. Note: (A) represents the activity of polyphenol oxidase; (B) represents the activity of β-glucosidase; Different lowercase letters indicate significant differences between different treatments (Duncan’s test, p < 0.05). ***: p < 0.001; n. s. indicated no significant.
Agronomy 14 02114 g003
Figure 4. Total phospholipid fatty acid (PLFA) contents (A), Gram-positive bacteria PLFA contents (B), Gram-negative bacteria PLFA contents (C) and their PLFA ratios (D), bacteria PLFA contents (E), fungal PLFA contents (F) and their PLFA ratios (G) in different MP treatments. Note: G+: Gram-positive bacteria; G-: Gram-negative bacteria; G+/G−: Gram-positive/Gram-negative bacteria ratio; C: concentration; T: type. Different lowercase letters indicate significant differences between different treatments (Duncan’s test, p < 0.05). *: p < 0.05; **: p < 0.01; ***: p < 0.001.
Agronomy 14 02114 g004
Figure 5. Soil organic carbon fractions in different MP treatments. Note: (A) represents the content of particulate organic carbon (POC); (B) represents the content of mineral-associated organic carbon (MOC); (C) represents the content of easily oxidized organic carbon (EOC); (D) represents the content of microbial biomass carbon (MBC); (E) represents the content of hot water-soluble carbon (HWOC); (F) represents the content of dissolved organic carbon (DOC). CK: treatment without MPs. Different lowercase letters indicate significant differences between different treatments (Duncan’s test, p < 0.05). C: concentration; T: type. *: p < 0.05; **: p < 0.01; ***: p < 0.001; n. s.: indicates no significant difference.
Agronomy 14 02114 g005
Figure 6. The SOC mineralization rate (A,B) and cumulative mineralization amount (C,D) in different MP treatments. Different lowercase letters indicate significant differences between different treatments (Duncan’s test, p < 0.05). ***: p < 0.001.
Agronomy 14 02114 g006
Figure 7. Redundancy analysis (RDA) of the relationships between soil aggregate stability (A), SOC mineralization (B), and soil environment factor in MP treatments.
Agronomy 14 02114 g007
Table 1. Details of the three consecutive vegetable crops during the pot experimental period.
Vegetable CropsSpeciesCrop SeasonFertilization PeriodNitrogen Fertilization a (kg N ha−1)
1stFlowering Chinese Cabbage (Brassica parachinensis L. H. Bailey)26 December 2021–16 February 202221 December 2021168
2ndFlowering Chinese Cabbage (Brassica parachinensis L. H. Bailey)9 March 2022–24 April 202212 March 2022168
3rdWater spinach (Ipomoea aquatica Forsk)21 August 2022–29 September 202214 August 2022168
a: N fertilization rate represented the conventional N rate in this study.
Table 2. Composition of water-stable agglomerates of different MP treatments.
VariantTreatPercentage of Different Particles (%)
2–5 mm0.25–2 mm0.053–0.25 mm<0.053 mm
MP concentrationCK12.86 ± 1.91 a60.07 ± 0.93 a17.71 ± 0.76 ab9.37 ± 1.52 ab
0.1%PE6.99 ± 0.91 a60.71 ± 1.93 a20.64 ± 2.82 a11.66 ± 3.84 a
1%PE9.15 ± 3.07 a66.59 ± 3.08 a13.58 ± 1.7 b10.68 ± 1.68 ab
2%PE12.17 ± 3.18 a69.02 ± 5.47 a13.11 ± 2.04 b5.7 ± 0.53 ab
One-way ANOVA n. s.n. s.*n. s.
MP typeCK12.86 ± 1.91 b60.07 ± 0.93 a17.71 ± 0.76 ab9.37 ± 1.52 a
0.1%PE6.99 ± 0.91 c60.71 ± 1.93 a20.64 ± 2.82 a11.66 ± 3.84 a
0.1%PP18.44 ± 1.75 a59.23 ± 3.22 a14.1 ± 1.13 b8.23 ± 2.03 a
0.1%PVC12.87 ± 0.71 b62.44 ± 1.5 a16.37 ± 1.94 ab8.33 ± 2.48 a
One-way ANOVA **n. s.n. s.n. s.
Note: Different lowercase letters indicate significant differences between different treatments (Duncan’s test, p < 0.05). *: p < 0.05; **: p < 0.01; n. s.: indicates no significant difference.
Table 3. Correlation analysis between water stability characteristics of soil aggregates and different particle sizes.
ParameterMWD (mm)GMD (mm)FDDifferent Particle Sizes of Soil Water-Stable Aggregates (mm)
2–5 mm0.25–2 mm0.053–0.25 mm<0.053 mm
MWD10.824 **−0.3640.934 **−0.156−0.498 *−0.538 *
GMD 1−0.817 **0.661 **0.15−0.275−0.910 **
FD 1−0.132−0.483 *0.0520.964 **
Note: MWD, mean weight diameter; GMD, geometric mean diameter; FD: fractal dimension. *, ** indicated the significant correlation at the 0.05 and 0.01 level, respectively.
Table 4. Correlations between soil carbon fractions and mineralization.
Indicators SOC Mineralization
MRCM
Soil carbon fractionsPOC−0.526 *−0.251
MOC−0.231−0.503 *
EOC−0.511 *0.798 **
MBC−0.050.344
HWOC−0.1430.434
DOC−0.2990.543 *
Note: MR: mineralization rate; CM: cumulative mineralization amount; POC: particulate organic carbon; MOC: mineral-associated organic carbon; EOC: easily oxidized organic carbon; MBC: microbial biomass carbon; HWOC: hot water-soluble carbon; DOC: dissolved organic carbon. *, ** indicated the significant correlation at the 0.05 and 0.01 level, respectively.
Table 5. Simple term effects of environmental variables based on Monte Carlo permutation tests from the redundancy analysis, including the explanatory rate and the significance test results for the influence factors.
ResponseFactorsExplains (%)Pseudo-FpResponseFactorsExplains (%)Pseudo-Fp
Soil aggregate stabilityCM27.76.10.008 **Soil organic carbon mineralizationpH71.640.40.002 **
MBC17.64.80.038 *Total PLFA17.524.20.004 **
Total PLFA12.44.10.04 *TN5.212.80.004 **
HWOC10.34.20.016 *AP1.96.70.028 *
CEC4.41.90.142MBC0.31.10.292
DOC3.61.60.21CEC0.20.60.496
β-glucosidase2.51.10.332PPO0.30.80.4
PPO2.110.424HWOC0.20.50.51
AN3.920.18DOC0.20.50.43
POC0.40.20.882
*, ** indicated a significant correlation at the 0.05 and 0.01 level, respectively.
Disclaimer/Publisher’s Note: The statements, opinions and data contained in all publications are solely those of the individual author(s) and contributor(s) and not of MDPI and/or the editor(s). MDPI and/or the editor(s) disclaim responsibility for any injury to people or property resulting from any ideas, methods, instructions or products referred to in the content.

