Article

Effects of High-Voltage Discharge Plasma on Drying Properties, Microstructure, and Nutrients of Oat Grass

1
College of Science, Inner Mongolia University of Technology, Hohhot 010051, China
2
College of Electric Power, Inner Mongolia University of Technology, Hohhot 010080, China
*
Author to whom correspondence should be addressed.
Agronomy 2025, 15(2), 408; https://doi.org/10.3390/agronomy15020408
Submission received: 4 January 2025 / Revised: 4 February 2025 / Accepted: 4 February 2025 / Published: 6 February 2025
(This article belongs to the Special Issue High-Voltage Plasma Applications in Agriculture)

Abstract

:
In this study, the drying properties of new-mown oat grass were investigated using three methods: high-voltage discharge plasma drying (HVDP), hot-air drying (HAD), and natural air drying (AD). The HVDP process mainly generates discharge plasma between needle electrodes and a dielectric plate by changing the discharge voltage. HVDP, which is a new type of non-thermal drying technology, uses the energy exchange associated with the action of plasma and the non-uniform electric field force to accelerate the evaporation of water. The results show that HVDP has obvious advantages in terms of the drying rate and drying time, as well as reducing energy consumption while retaining nutrients. In particular, under the condition of 35 kV, HVDP not only effectively shortened the drying time and reduced the energy consumption but also selectively degraded the nutrient-reducing substances (e.g., lignin) and retained the substances positively correlated with the nutrient quality, significantly improving the nutrient content of the treated oat grass. In conclusion, as an innovative non-thermal drying technology, HVDP has great potential to improve the drying efficiency and reduce nutrient degradation in oat grass, providing an innovative solution to improve its quality and utilisation.

1. Introduction

Oat grass is an annual plant of the grass family Oataceae, which has properties such as high yield, high stress tolerance, and the ability to improve the soil [1] and has become a high-quality source of forage for herbivores, as it has a sweet taste, has good palatability, and is rich in water-soluble carbohydrates [2,3]. Due to the insufficient supply of high-quality feed in some regions, the milk yield of livestock has decreased [4]. Therefore, with the development of agriculture and animal husbandry, China’s demand for high-quality forage hay has gradually increased. In this context, hay-making is carried out in some developing countries as an important method of preserving forage and is favourable for improving the quality of milk production [5,6]. Although investigations on livestock production performance and economic benefits have been conducted, the conventional drying method of oat grass leads to very low protein and nutrient contents, mainly due to the use of improper drying methods, resulting in a serious loss of nutrients [7]. Existing methods for drying oat grass primarily include natural air drying (AD) and hot-air drying (HAD) [8]. Natural drying is time-consuming due to factors such as high humidity and low temperatures, leading to nutrient losses and reduced quality. While HAD offers a faster drying time, the oven’s air temperature and humidity significantly impact the quality of oat grass, hindering nutrient preservation [9]. Various drying methods have been shown to markedly influence the nutrient composition, rehydration rate, and electrical conductivity of the feed [10]. Therefore, it is necessary to select a drying method that enables good nutrient preservation and a controllable drying speed in the drying process [11,12,13,14].
High-voltage discharge plasma (HVDP) drying—also known as electrohydrodynamic drying or high-voltage electric field drying—is a cutting-edge non-thermal drying technology with great potential. This method facilitates the removal of moisture through generating an uneven electric field between a needle electrode and a dielectric plate, coupled with the action of ionic wind. In comparison to conventional drying techniques, HVDP is effective in retaining bioactive compounds while maintaining the colour integrity of the material, ultimately improving the quality of the dried product [15]. Sriariyakul et al. [16] demonstrated that the application of HVDP significantly shortened the drying duration and enhanced the drying efficiency in the processing of aloe vera. Similarly, Esehaghbeygi et al. [17] demonstrated its suitability for drying heat-sensitive materials, such as tomato slices. Yang et al. [18] observed that HVDP improved the drying efficiency and reduced energy consumption for Lycium barbarum fruits while minimising cell damage under lower discharge gaps and voltages. Additionally, Guo et al. [19] showed that adjusting the air gap spacing under a constant voltage optimised both the drying rate and energy efficiency when processing alfalfa. Collectively, these findings highlight the advantages of HVDP in enhancing drying speed, reducing energy consumption, minimising cell damage, and preserving nutrients. Despite these benefits, research on its application to oat grass for improved drying efficiency and nutrient retention remains scarce.
In this research, the AD, HAD, and HVDP drying methods were utilised to investigate their impacts on the drying behaviour, nutritional composition, and structural modifications of oat grass. A Fourier transform infrared (FTIR) spectrometer was employed to examine the chemical composition, while scanning electron microscopy (SEM) and transmission electron microscopy (TEM) were used to observe the surface morphology and cellular ultrastructure, respectively, under different drying conditions. The drying efficiency and energy consumption under HVDP were compared to those of HAD, and the influence of different discharge voltages in HVDP was systematically analysed. Based on the importance of oat grass as a high-quality feed and the shortcomings of current drying methods in terms of nutrient retention and efficiency, this study aimed to determine an efficient and nutrient-retaining drying method to address the limitations of traditional natural and hot-air drying methods in terms of drying time and nutrient loss.

2. Materials and Methods

2.1. Experimental Material

The experiment was conducted at the Experimental Building of the Inner Mongolia University of Technology (111°40′ E, 40°50′ N). The oat grass used in the study was cultivated in June 2024 under natural environmental conditions on the university campus, with an average temperature of around 25 °C and good air quality during the cultivation period. The soil used was a one-to-four ratio of floral soil and compost purchased at a nearby flower market. The oat grass was harvested at full bloom, with a stubble height of about 5 cm. Samples were divided into three parts: stems, leaves, and spikes. Damaged or denuded samples were removed by hand. In order to minimise variation due to the different properties of the oat components, each part was uniformly cut into small sections of about 5 cm, thoroughly mixed and immediately dried for the experiment.

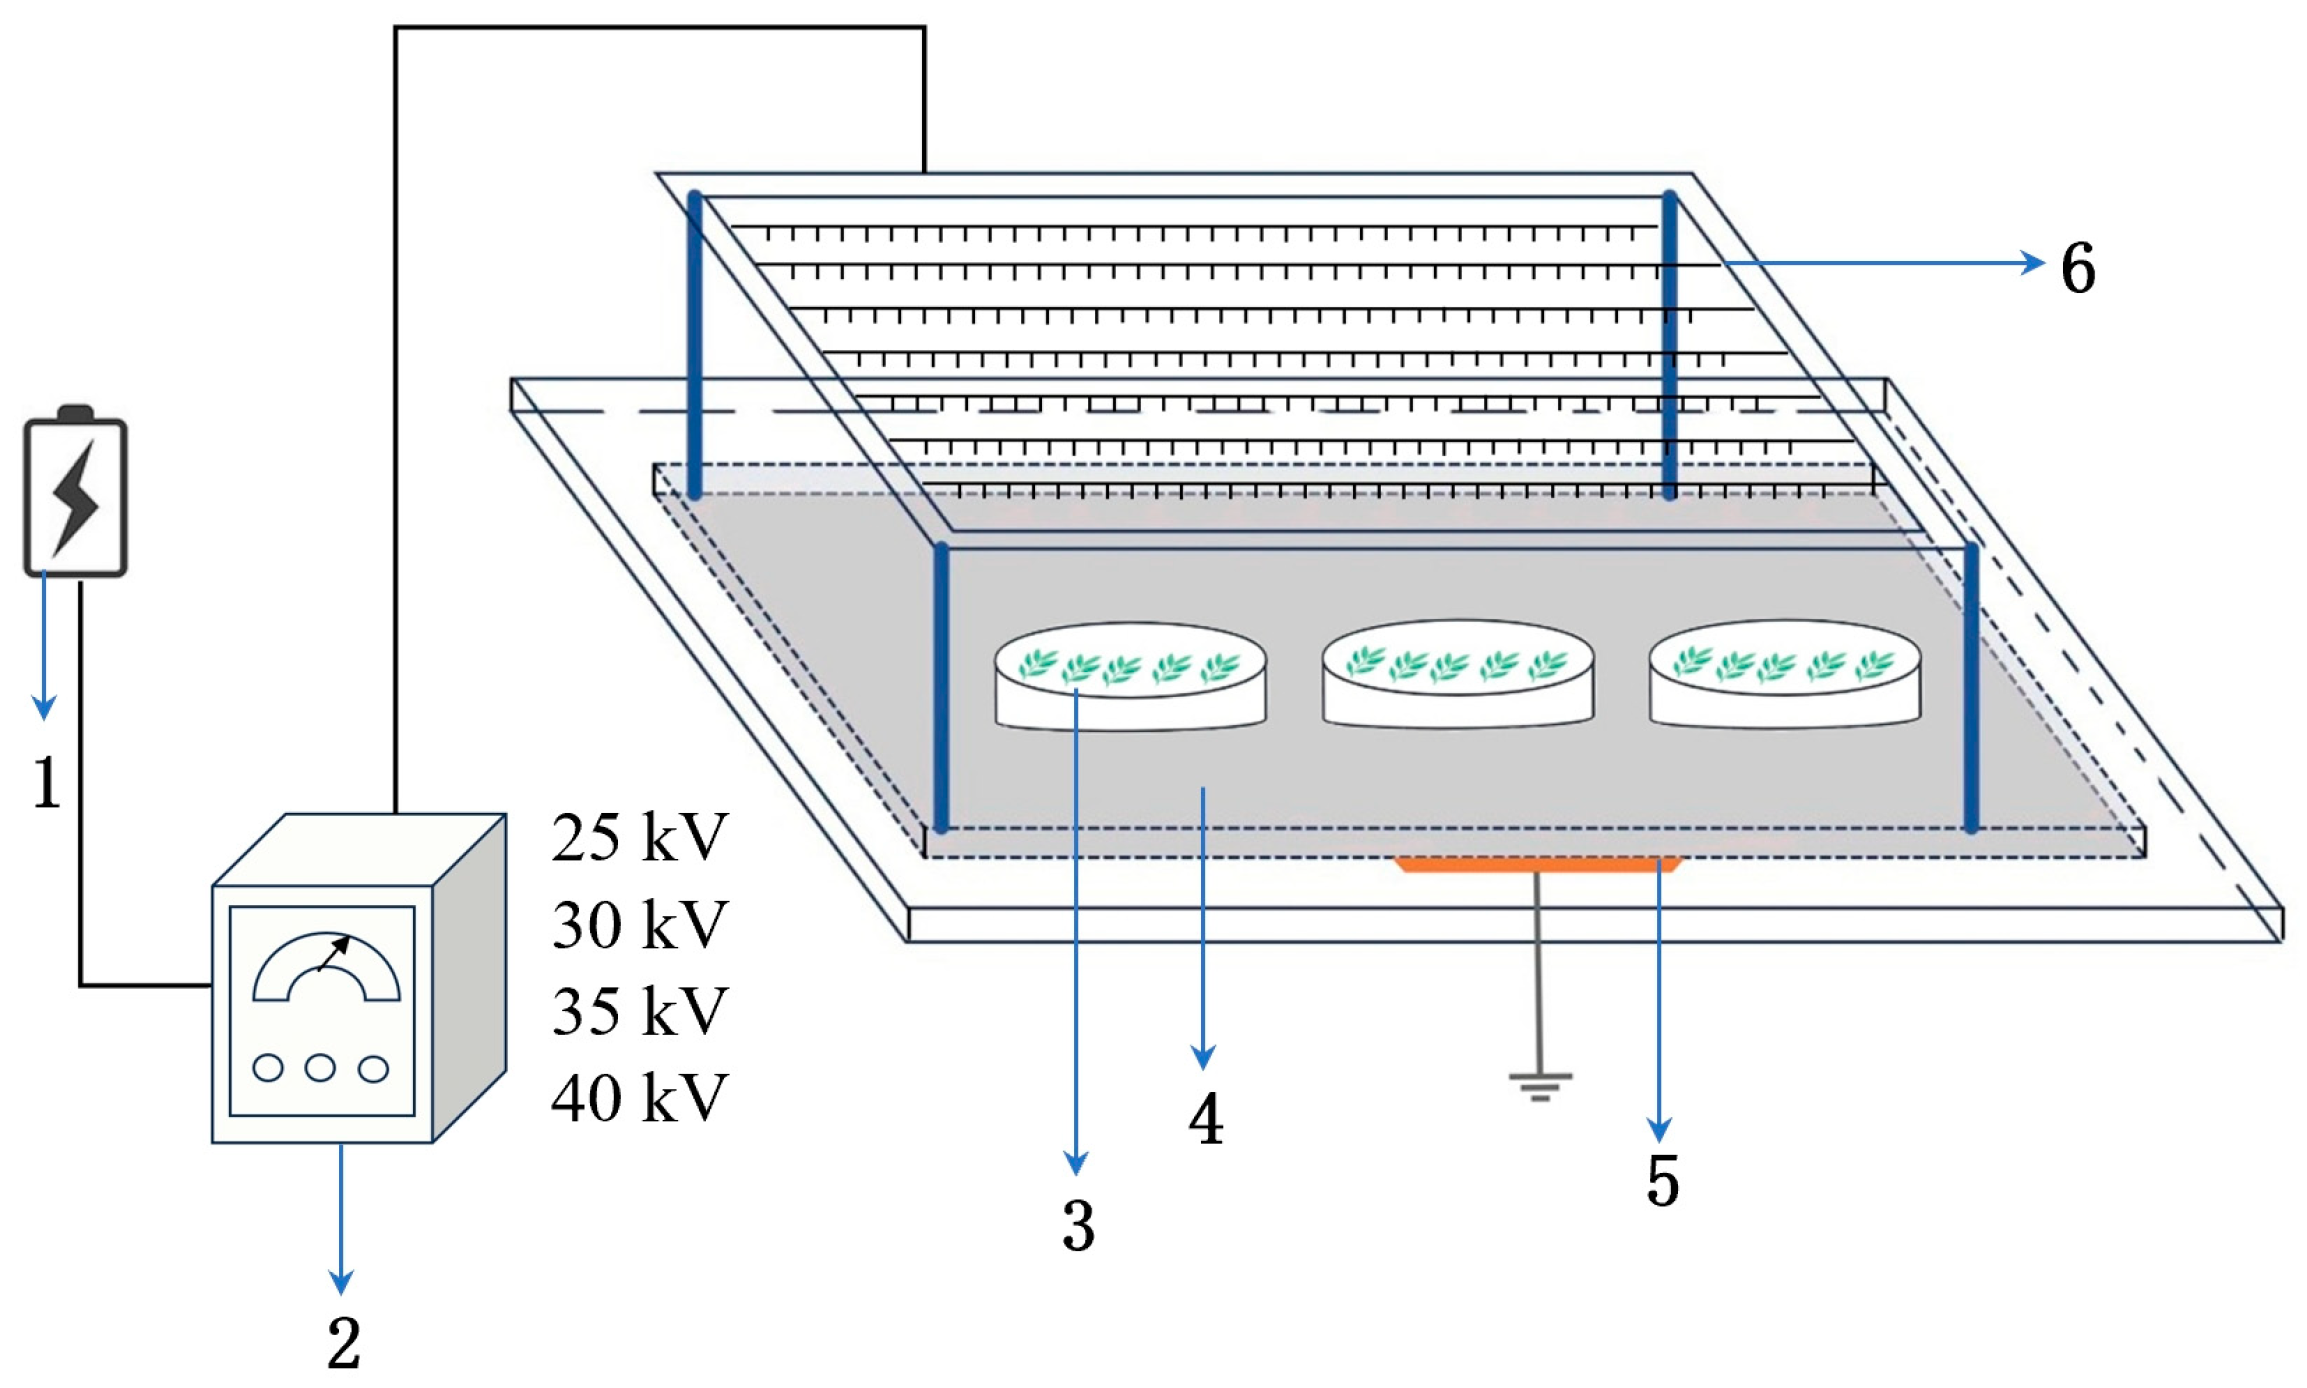
2.2. Instrument and Equipment

The experimental setup, as illustrated in Figure 1, included an electrode system configured in a needle array–plate design. This system featured a dielectric plate with a thickness of 6 mm and was equipped with a high-voltage power supply control unit (model YD(JZ)-1.5/50) manufactured by Wuhan Boyu Electric Power Equipment Co., Ltd. (Wuhan, China). This high-voltage power supply is capable of delivering alternating current (AC) voltage, with an adjustable output range spanning from 0 to 50 kV. For the hot-air-drying (HAD) process, a DGX-9053 hot-air-drying oven, produced by Shanghai Fangyuan Experimental Instrument Co. (Shanghai, China), was employed. This oven offers a temperature range between 10 °C and 250 °C, which can be finely tuned in 0.5 °C increments to meet specific drying requirements. The natural air drying (AD) process was performed indoors, where the ambient room temperature was maintained at 25 ± 3 °C to ensure stable drying conditions.

2.3. Experimental Methods

We prepared the oat grass samples and distributed them evenly into plastic dishes measuring 160 mm × 110 mm × 50 mm, with each group weighing 27.5 ± 0.5 g. Then, the samples were immediately subjected to the different drying treatments. The natural drying group (AD) was carried out indoors under conditions of 25 ± 3 °C temperature and 28% ± 5% relative humidity; hot-air drying (HAD) was performed in an oven at 55 °C with a hot air speed of 2 m/s [20], and high-voltage discharge plasma (HVDP) drying was conducted under a consistent air gap spacing of 8 cm, using different voltage conditions (25 kV, 30 kV, 35 kV, 40 kV). In the drying experiments, the experimental environmental conditions were kept the same as those used for the AD group. An electronic scale (BS124S, Shanghai Guanglu Electronic Technology Co., Ltd., Shanghai, China) was used to measure the mass of the oat grass samples every two hours, and the data were recorded.

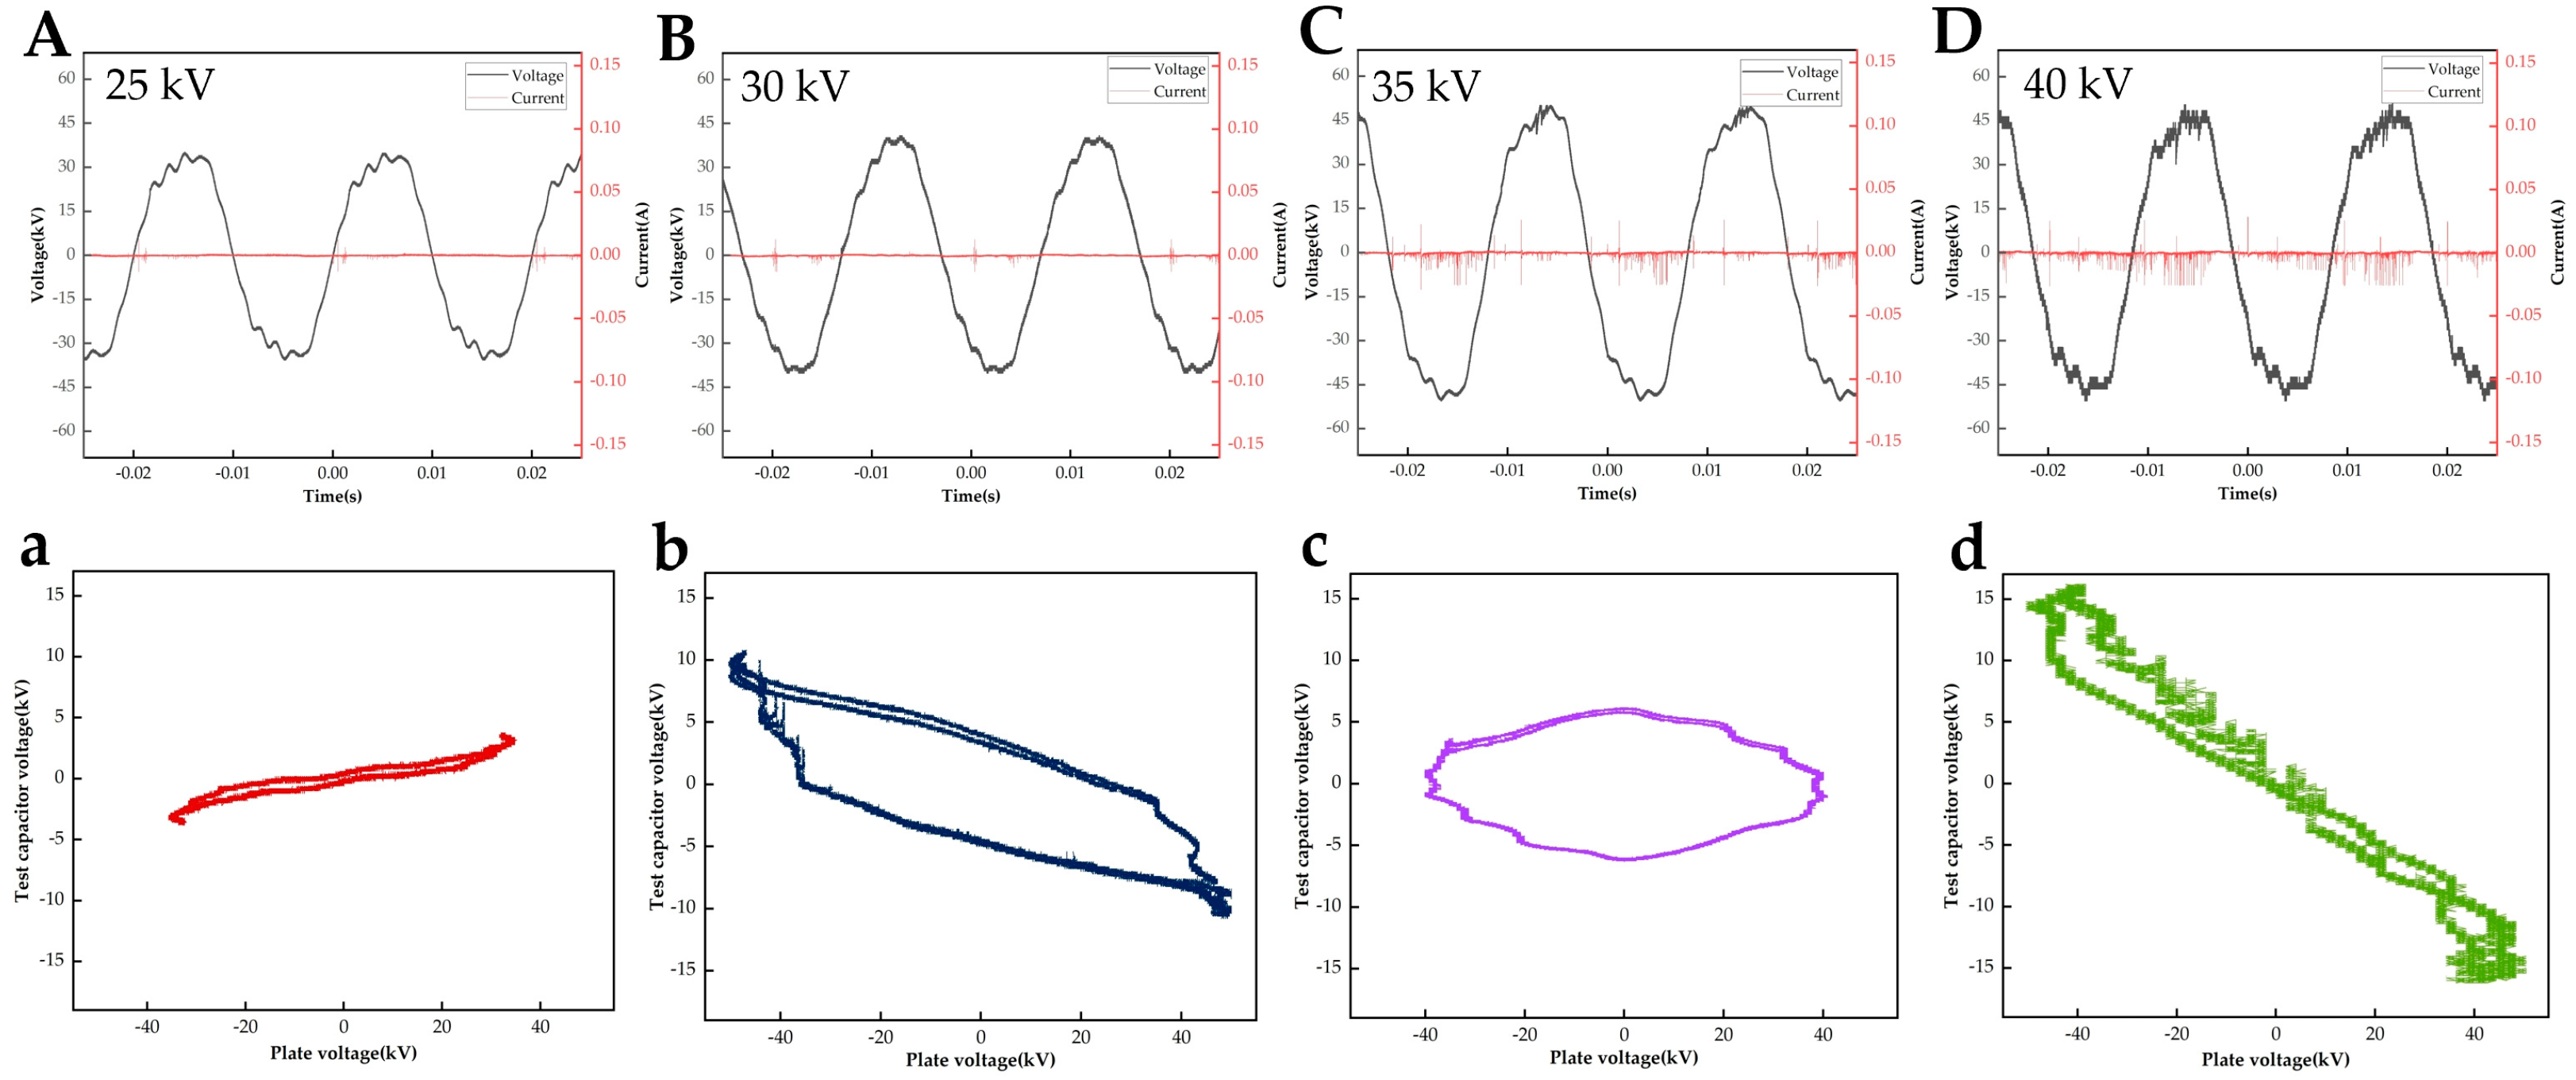
2.4. Voltage, Current and Power Parameters

The voltage, current, and power output of the high-voltage discharge plasma system were monitored using a high-voltage probe (Tektronix P6015A, 75 MHz; manufactured by Tektronix Technologies, Beaverton, OR, USA), a current probe (PEARSON 6877, 120 MHz; produced by Pearson Electronics Corporation, Palo Alto, CA, USA), and an oscilloscope (RIGOL MSO5204, Suzhou Puyuan Precision Technology Co., Ltd., Suzhou, China). The system’s discharge power is graphically represented by the area enclosed within the Lissajous figure. The average discharge power of the plasma device was determined using the following formula:
P = 1 T 0 T U t I t d t = f × C M × 0 T U d U M = f × C M × S
where C M (F) represents the sampling capacitance, with a value of 1.00 ± 0.05 nF. f (Hz) denotes the discharge frequency, and S (V2) corresponds to the area of the Lissajous figure.
The energy consumption during the drying process is calculated as the product of the effective drying power and the duration of the drying process. The formula is expressed as follows:
W = P × t
where P (W) is the working power, and t (h) is the average drying time.
Specific energy consumption (SEC) is a parameter used in industrial and agricultural production to assess the energy efficiency of a particular product or process and measure the efficiency of energy use in the production process [21]; its formula is as follows:
S E C = W m 0 m t = 1 T 0 T U t I t d t × t m 0 m t = f × C M × S m 0 m t × t
where m 0 (g) represents the mass of oat grass before drying, and m t (g) is the mass of oat grass after drying. As AD is a passive drying method that does not rely on external energy inputs, its energy consumption is almost negligible; therefore, we only evaluated the energy consumption of the HVDP and HAD processes.

2.5. Moisture Content Measurement

Drying characteristics of oatgrass can be derived with reference to the research programme of Guo et al. [19]. The dry basis moisture content of oat grass at a given point in the drying process is measured using the following formula:
M i = m i m g m g
where m i (g) represents the real-time mass of the oat-grass-drying process, while m g (g) is the quality of oat hay. The moisture content ratio is expressed as follows:
M R = M i M e M 0 M e
where M e (g) represents the moisture level at equilibrium, M 0 (g) represents the initial moisture level present in the oat grass, and M i   g represents the moisture content on a dry basis at a given point in time. The drying rate of oat grass can be expressed as follows:
D R = M t M t + Δ t Δ t
where M t is the dry basis moisture content of oat grass at time t, while M t + Δ t represents the moisture content on a dry basis after an elapsed time Δ t . VR denotes the average drying rate, representing the amount of water evaporated per unit mass of oat grass per unit time, which can be expressed as follows:
  V R = m 0 m t m 0 T
where m 0 (g) represents the mass of oat grass before drying, m t (g) is the mass of oat grass after drying, and T represents the drying time. The average drying time for HAD was about 10 h, that for AD was about 74 h, and those for HVDP at 25, 30, 35, and 40 kV were about 14, 18, 22, and 24 h, respectively.

2.6. Rehydration Rate

The rehydration rate is an essential indicator for evaluating the extent to which dried materials recover their original state after absorbing moisture, serving as a measure of product quality. In this experiment, a 5.00 ± 0.05 g sample of dried oat grass was submerged in 50 mL of distilled water and maintained in a thermostatic water bath at 37 °C until its weight reached equilibrium. After removal, excess surface water was carefully blotted using absorbent paper, and the sample’s weight was determined using a precision electronic balance (BS124S, produced by Shanghai Guanglu Electronic Technology Co., Ltd., Shanghai, China). The rehydration rate was then computed using the formula provided below [22]:
R R = m b m a
where m b is the mass after soaking in the water bath, and m a is the mass before rehydration.

2.7. Electrical Conductivity

Oat grass dried using different methods was placed in a water bath at a constant temperature of 37 °C for 12 h, and the conductivity was measured after removal. It was then placed in a water bath at 95 °C for half an hour, removed, and allowed to cool before the conductivity was measured again; the formula is as follows:
σ = G 2 G 1
where G 1 is the conductivity value after 12 h of holding, and G 2 indicates the conductivity value after half an hour of holding at 95 °C.

2.8. Scanning Electron Microscopy (SEM)

Fresh oat leaves were arranged in a Petri dish with the lower epidermis oriented upward, placed directly beneath the needle tip for the drying test. Following the drying process, the leaves were mounted on a sample holder using conductive tape, coated with a thin layer of gold using a sputter coater (HITACHI MC1000, Hitachi, Ltd., Tokyo, Japan), and examined with a scanning electron microscope (SU8020, Hitachi High-Tech, Tokyo, Japan). The surface morphology of the oat grass was observed consistently at the same location for each sample. The microscope was operated at an accelerating voltage of 5 kV with a resolution of 50 nm [23].

2.9. Transmission Electron Microscopy (TEM)

Referring to the test method of Dumančić et al. [24], the oat grass samples were prepared using the ultrathin sectioning technique involving the following steps: sampling, fixation, rinsing, dehydration, infiltration, embedding, correction of localisation, and ultrathin sectioning. To reduce the error of the test results, the samples were put into a pre-configured glutaraldehyde fixation solution immediately after the completion of the sampling, and, after fixation, they were rinsed with 0.1 mol/L of a phosphate buffer. The embedding agent was diluted using a dehydrating agent, and the embedding agent was used instead of the dehydrating agent to realise the penetration of the sample. Next, the samples were embedded in epoxy resin and then sectioned using an ultrathin sectioning machine after being well-positioned. Finally, the samples were observed via TEM, allowing the ultrastructure of the oat grass to be observed.

2.10. Infrared Spectrum

The prepared samples were blended with potassium bromide at a ratio of 1:100, crushed into a fine powder, and moulded into discs using a compression device. These discs were examined with a Fourier-transform infrared spectrometer (FTIR) (Thermo Scientific, Nicolet 6700, Waltham, MA, USA) over a wavenumber range of 400 to 4000 cm−1 with a spectral resolution of 4 cm−1. The device offered a high signal-to-noise ratio of 50,000:1, providing reliable measurement accuracy. Data obtained from the spectrometer were analysed and refined using OMNIC Thermo Fisher, Waltham, MA, USA and PeakFit (Seasolve Software Inc., San Jose, CA, USA) software tools.

2.11. Determination of Nutrient Composition

Near-infrared spectroscopy has the advantages of high efficiency, rapidity, and the ability to assess multiple components simultaneously compared with traditional techniques, which improves the reliability and accuracy of test results, and is widely used for the detection of nutrients in feed [25]. The samples were initially ground into fine particles, sieved to achieve a uniform size of 1 mm, thoroughly homogenised, and subsequently scanned using a near-infrared spectroscopy analyser (FOSS 2500, FOSS NIR Systems, Inc., Laurel, MD, USA)). This method was employed to determine the composition of crude protein (CP), non-fibrous carbohydrates (NFCs), neutral detergent fibre (NDF), acid detergent fibre (ADF), lignin, and hay milk yield (HM). Based on the obtained NFC and NDF values, the NFC/NDF values were measured, and, through adjusting this ratio, feed formulations can be optimised to meet the nutritional requirements of livestock at different production stages [19]. In addition, in vitro dry matter digestibility (IVDMD) is a common method for assessing the nutritional value of feeds, which is obtained by simulating the rumen environment of ruminants (which use rumen fluid to ferment feed samples in vitro) and then determining the dry matter content of the post-fermentation residue, thus providing a basis for assessing the nutritional value of feeds and optimising feed formulations. The scanning process enabled precise analysis of the chemical and nutritional components, providing key data for evaluating the quality and nutritional value of the oat grass under different drying methods.

2.12. Statistical Analysis

The experimental data were obtained through three independent trials, ensuring the reliability and reproducibility of the results. The outcomes are presented as the mean ± standard deviation, reflecting the central tendency and variability of the measurements. Microsoft Excel 2016 was utilised for organising, pre-processing, and managing the raw data, while the Origin 2021 software was employed to create detailed graphical representations, enabling clear visualisation of trends and differences between experimental groups. Correlation heatmaps were plotted directly using Origin, and the Pearson correlation coefficient matrices were plotted based on the existing data using the Correlation Plot plug-in. Statistical analyses were conducted using SPSS version 22.0 to evaluate the significance of the observed differences. A one-way analysis of variance (ANOVA) was performed to compare the groups, with the significance level set at p < 0.05. This threshold was applied to identify statistically meaningful variations, providing a robust basis for interpreting the experimental findings and drawing valid conclusions.

3. Results and Discussion

3.1. HVDP Drying Characterisation

HVDP drying technology has great potential for improving product quality while reducing energy consumption. Figure 2A–D show the voltage and current waveforms during drying at different drying voltages. The voltage waveforms are all sinusoidal, and the peak value increased as the voltage increased. Corona discharge occurs under a high-voltage electric field, which causes dielectric breakdown and leads to the release of electrons from molecules, increasing the generation of ions. As the electric field strength increases, the generated positive ions and electrons are more easily separated, resulting in a gradual increase in the current [26], making the voltage waveform at 40 kV extremely unstable. The current waveform shows high and dense current filaments as the voltage increases. This is mainly because the current waveform is the superposition of many pulses, each of which may represent one or more discharges. This is shown in the waveform diagram as a large amplitude and short duration [27]. Through testing the voltage across the capacitor and plotting the Lissajous figures at different voltages, as shown in Figure 2a–d, integration of the curves under 25 kV, 30 kV, 35 kV, and 40 kV conditions correspond to areas within the Lissajous figures of 8.23 × 10⁸ V2, 1.57 × 10⁹ V2, 1.64 × 10⁹ V2, and 4.04 × 10⁸ V2, respectively. From Equation (1), it can be seen that the area of the Lissajous figure is positively correlated with the power, and, so, the power was greatest at 35 kV. Early experiments with high-voltage discharge plasma showed that increasing the external voltage leads to increases in the drying rate and discharge power, thereby increasing energy consumption [28].
In this study, the SEC was calculated using the average power and average drying time, which allowed for an assessment of the average energy consumption under different drying methods [27]. Figure 3 depicts the specific energy consumption of the various drying methods. The energy consumption of HAD was 3.5 to 19 times that of HVDP, indicating that HVDP drying consumed significantly less energy than HAD, and there were significant differences among the groups.

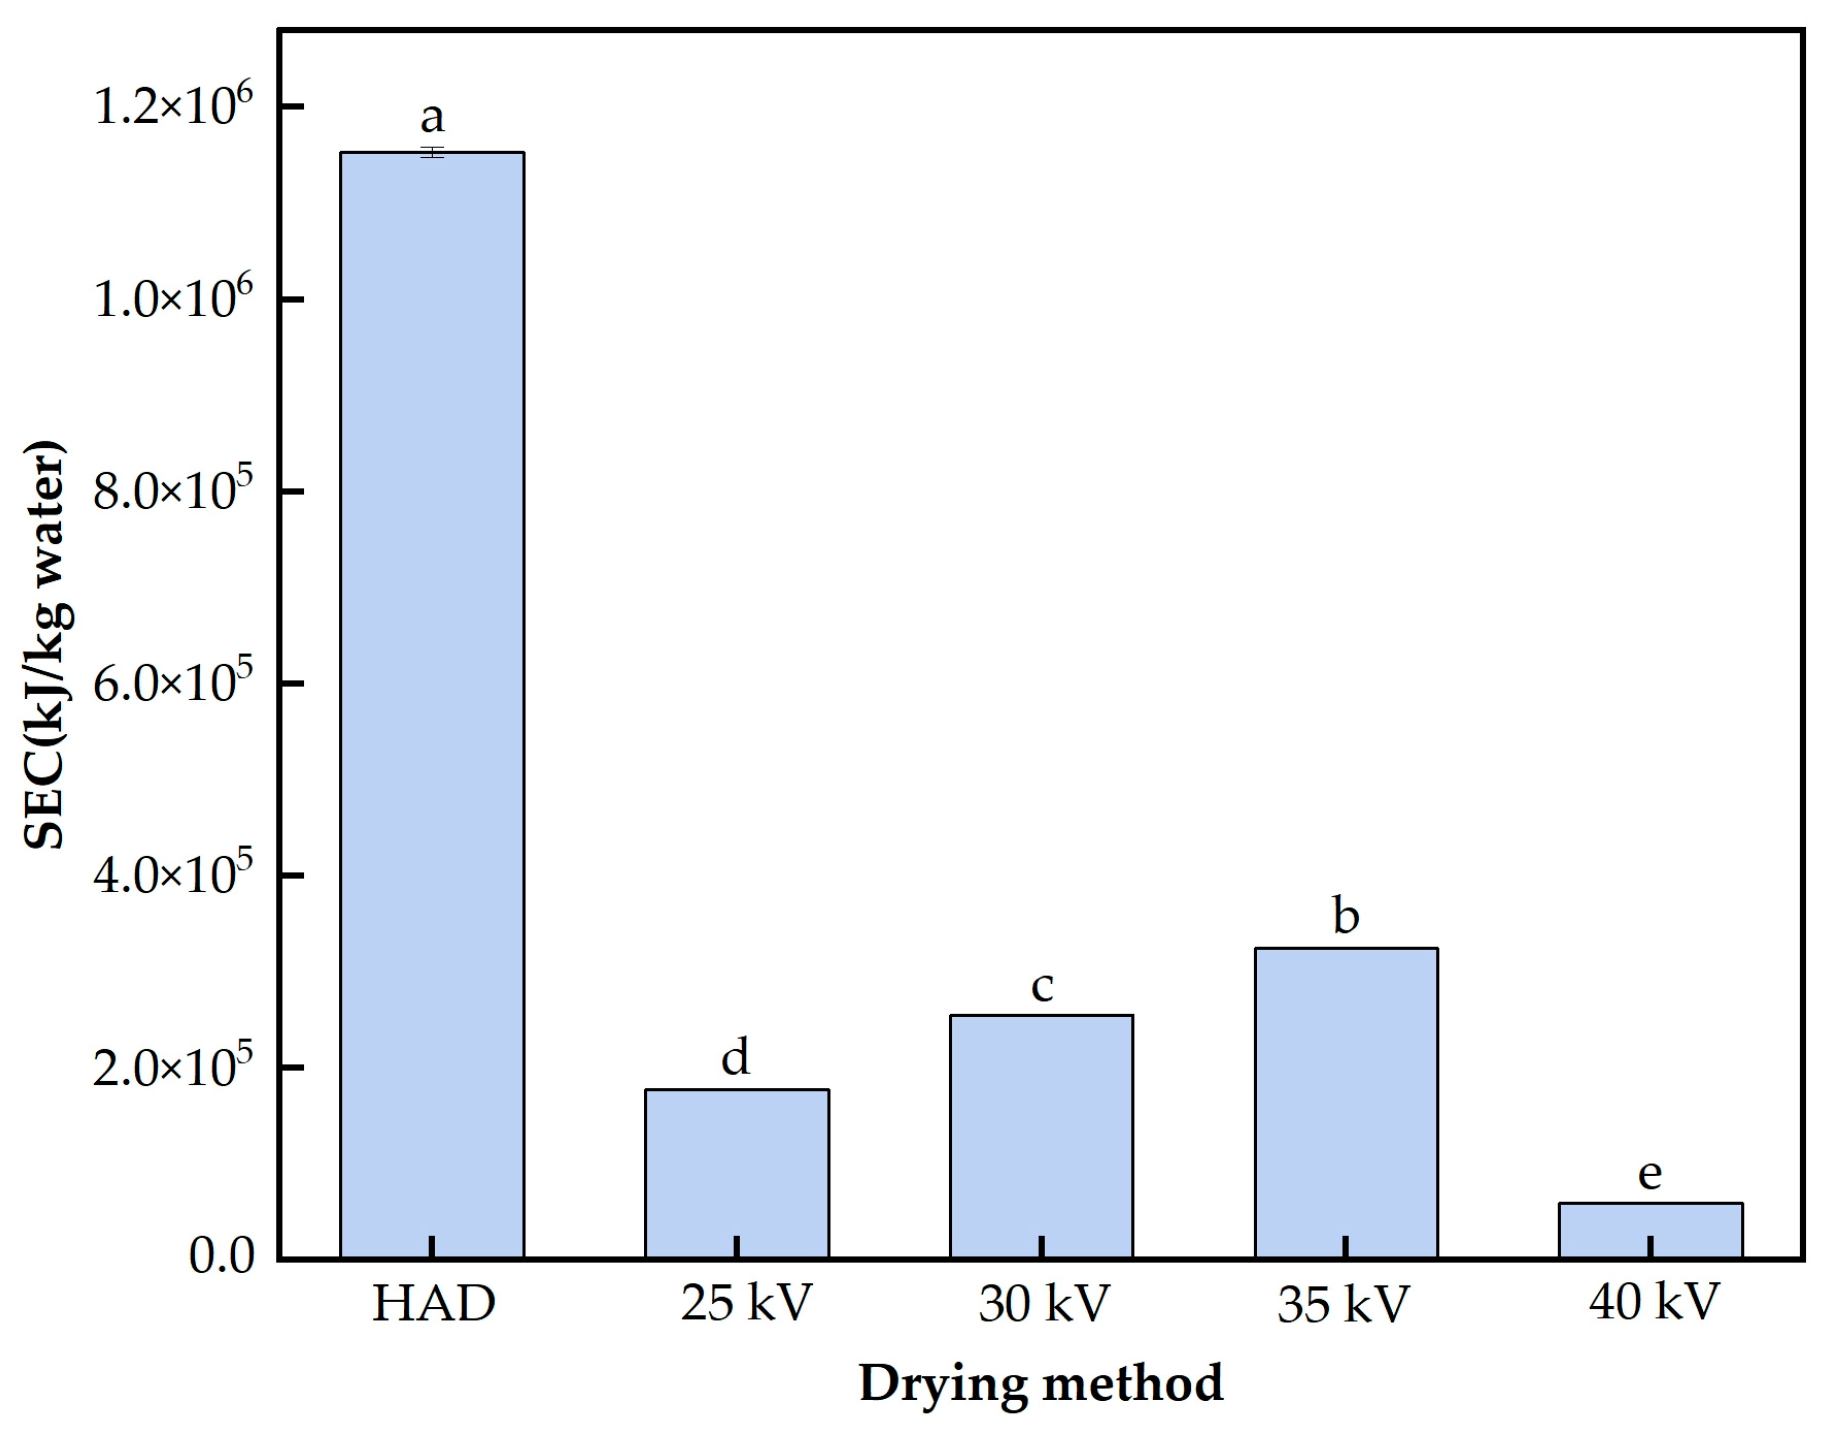
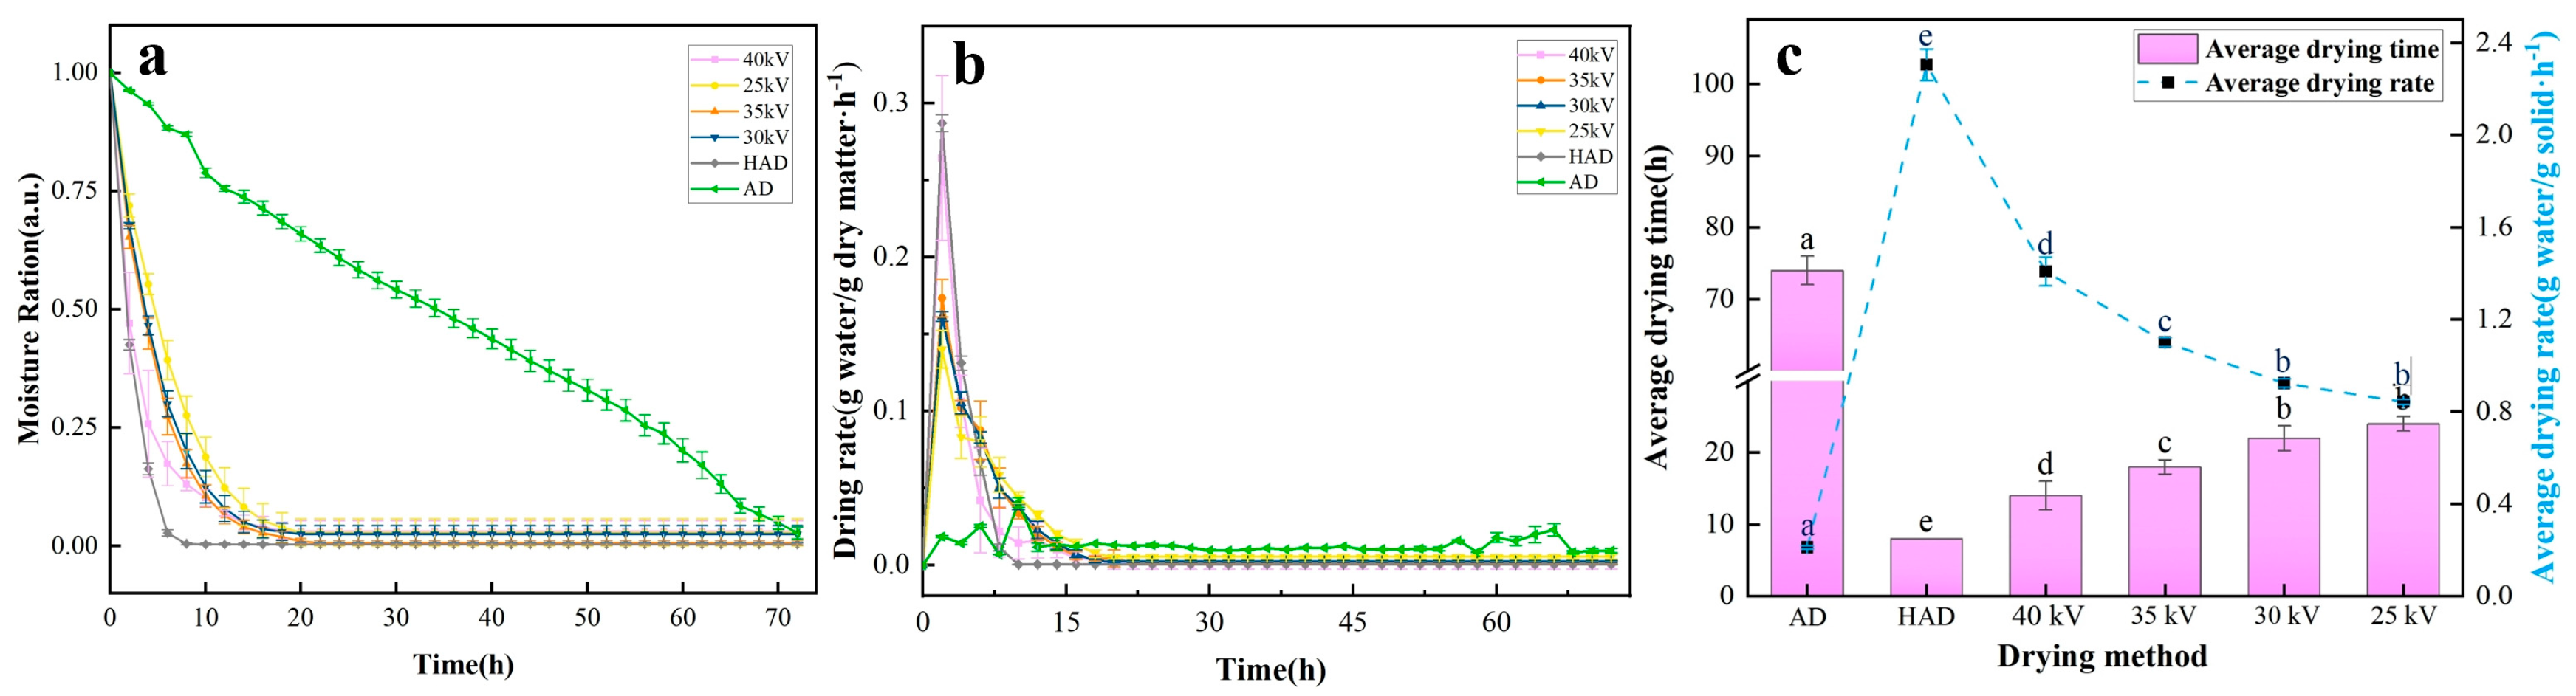
3.2. Drying Properties

The trends in oat moisture content and drying rate over time for various drying techniques are depicted in Figure 4a,b. The AD method demonstrated the slowest and most consistent drying rate, producing a nearly horizontal curve and an extended drying duration. Conversely, the HAD method achieved the quickest reduction in moisture content and drying rate, characterised by a sharp initial rise followed by a rapid decrease. This behaviour is attributed to the heated air used in HAD, where the high convective heat transfer coefficient and fast airflow enhance the drying rate [29]. The subsequent decline in drying rate is due to reduced moisture content and water activity within the sample, slowing water diffusion to the surface. Structural changes in the sample during drying further impact the water transfer efficiency, contributing to this decline [30]. For the HVDP group, the drying rate initially increased rapidly with voltage, then decreased over time as water content dropped sharply. The elevated moisture content in freshly cut oat grass facilitates rapid evaporation from the surface when subjected to high voltage and ionic wind effects [31], aligning with the observations made by Guo et al. [19] and Hu et al. [23] for alfalfa. Figure 4c illustrates the average drying time and rate across the various drying techniques. Compared to AD, the average drying rate under HAD and HVDP treatments (at voltages of 25 kV, 30 kV, 35 kV, and 40 kV) demonstrated a significant increase (p < 0.05), reaching 3.99, 4.37, 5.22, 6.67, and 10.92 times higher, respectively. Concurrently, the average drying duration was reduced by 68%, 70%, 75%, 81%, and 89%, respectively. These findings suggest that the drying rate is influenced not only by environmental factors but also by the intensity of the electric field and the inherent properties of the material being dried [32].

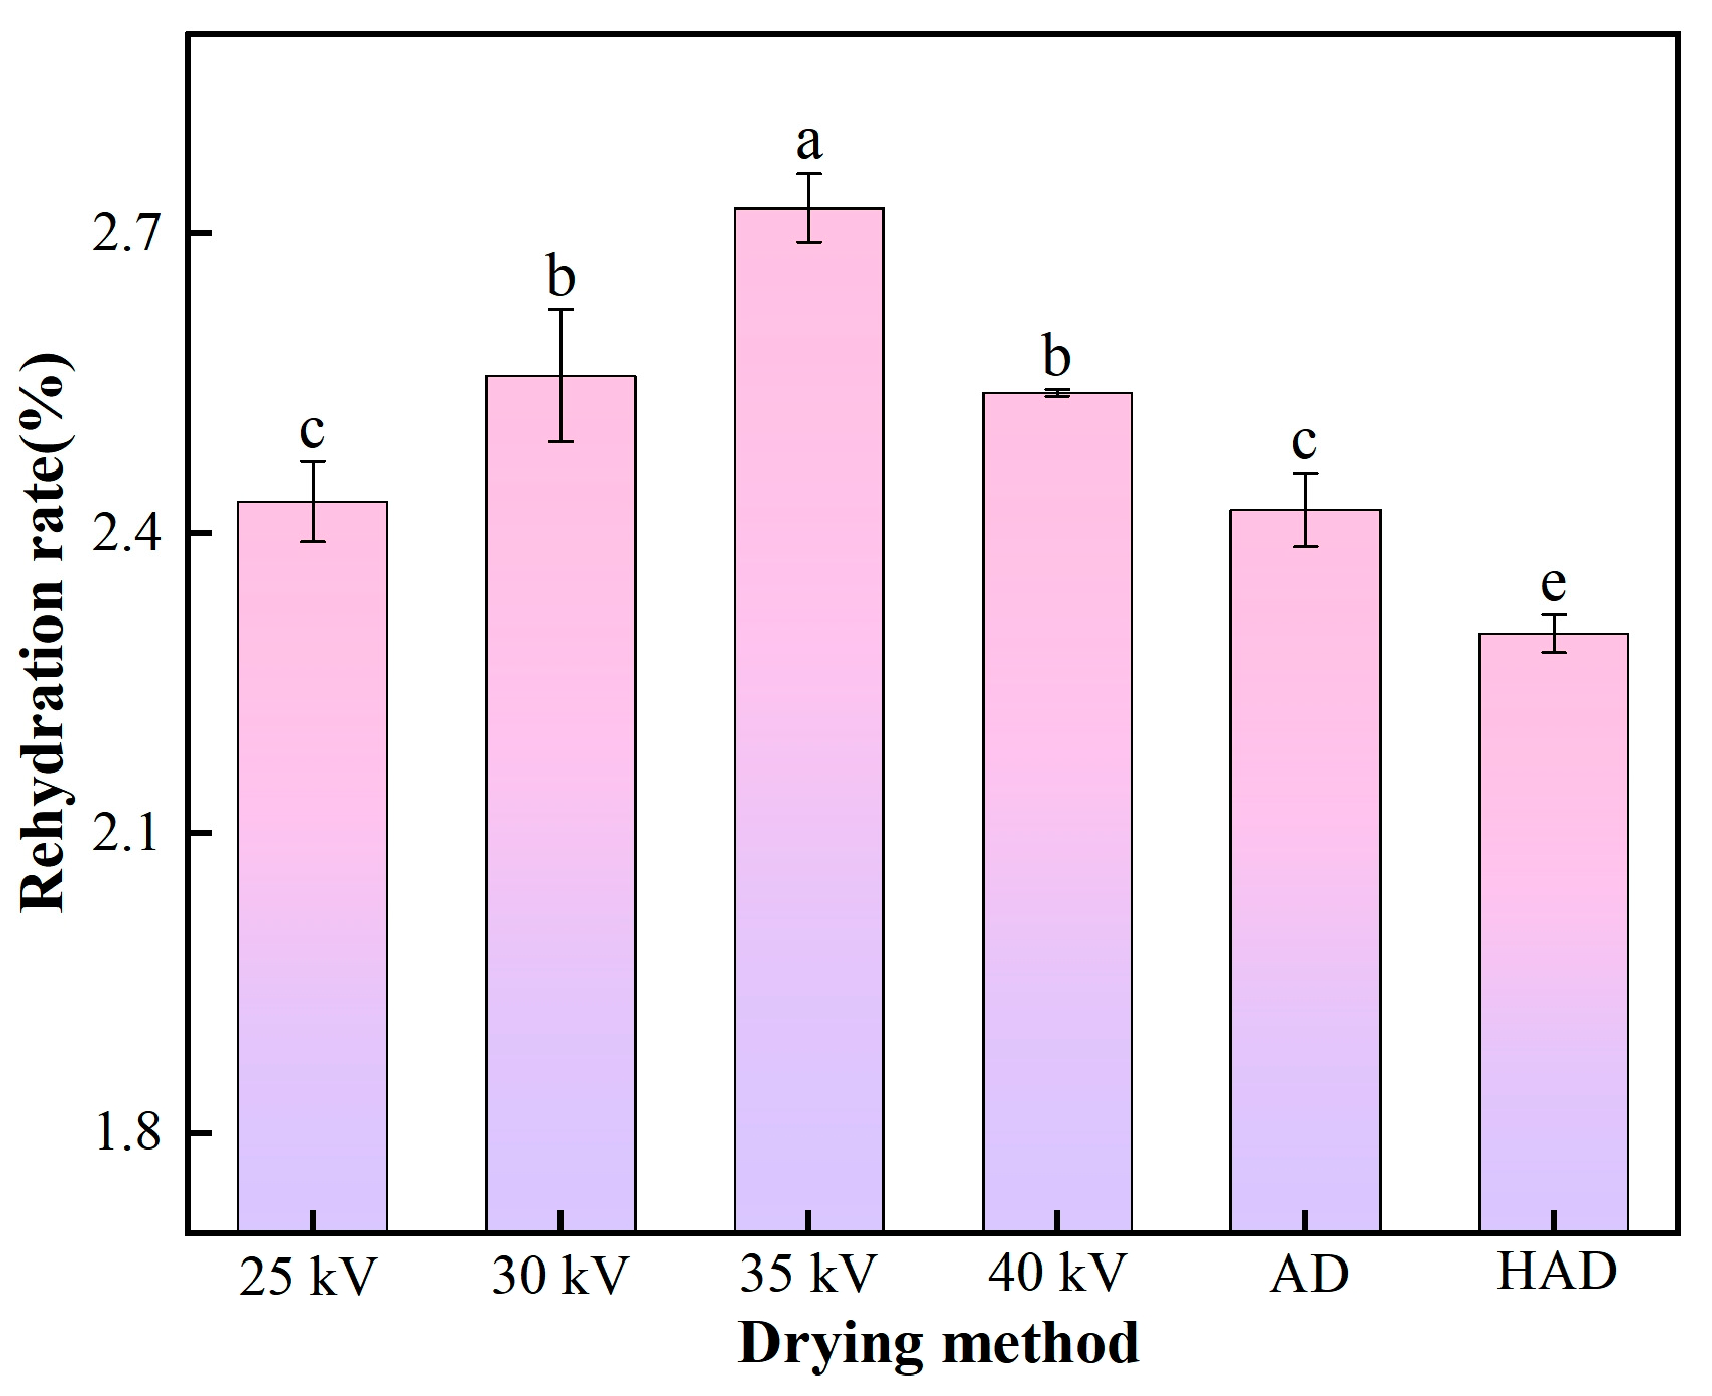
3.3. Rehydration Rate Analysis

The rehydration rate serves as an essential measure of the material’s ability to regain its original state after drying, offering insight into the extent of structural disruption during the drying process. The higher the rehydration rate, the better the quality of the material and the less damage to the internal structure [33]. As shown in Figure 5, the analysis showed that the rehydration performance of dried oat grass exhibited no statistically significant difference between the 25 kV and AD groups (p > 0.05) or between the 30 kV and 40 kV groups. These results highlight the influence of specific drying conditions on the structural properties of the material. Notably, the 35 kV group exhibited a significantly higher rehydration rate than the other groups. In contrast, the HAD group showed the lowest rehydration rate. This is due to the 55 °C drying temperature used in HAD, which exceeds the thermal tolerance of cells, thus causing irreversible changes in the internal pore structure, damage to cell membranes and reduced pore permeability, ultimately impairing rehydration performance [34,35]. Overall, the HVDP groups demonstrated superior rehydration performance, compared to the HAD and AD groups. This can be attributed to HVDP being a non-thermal drying technology, where ionic wind primarily affects the material’s surface, preserving the internal tissue structure [36].

3.4. Microstructure

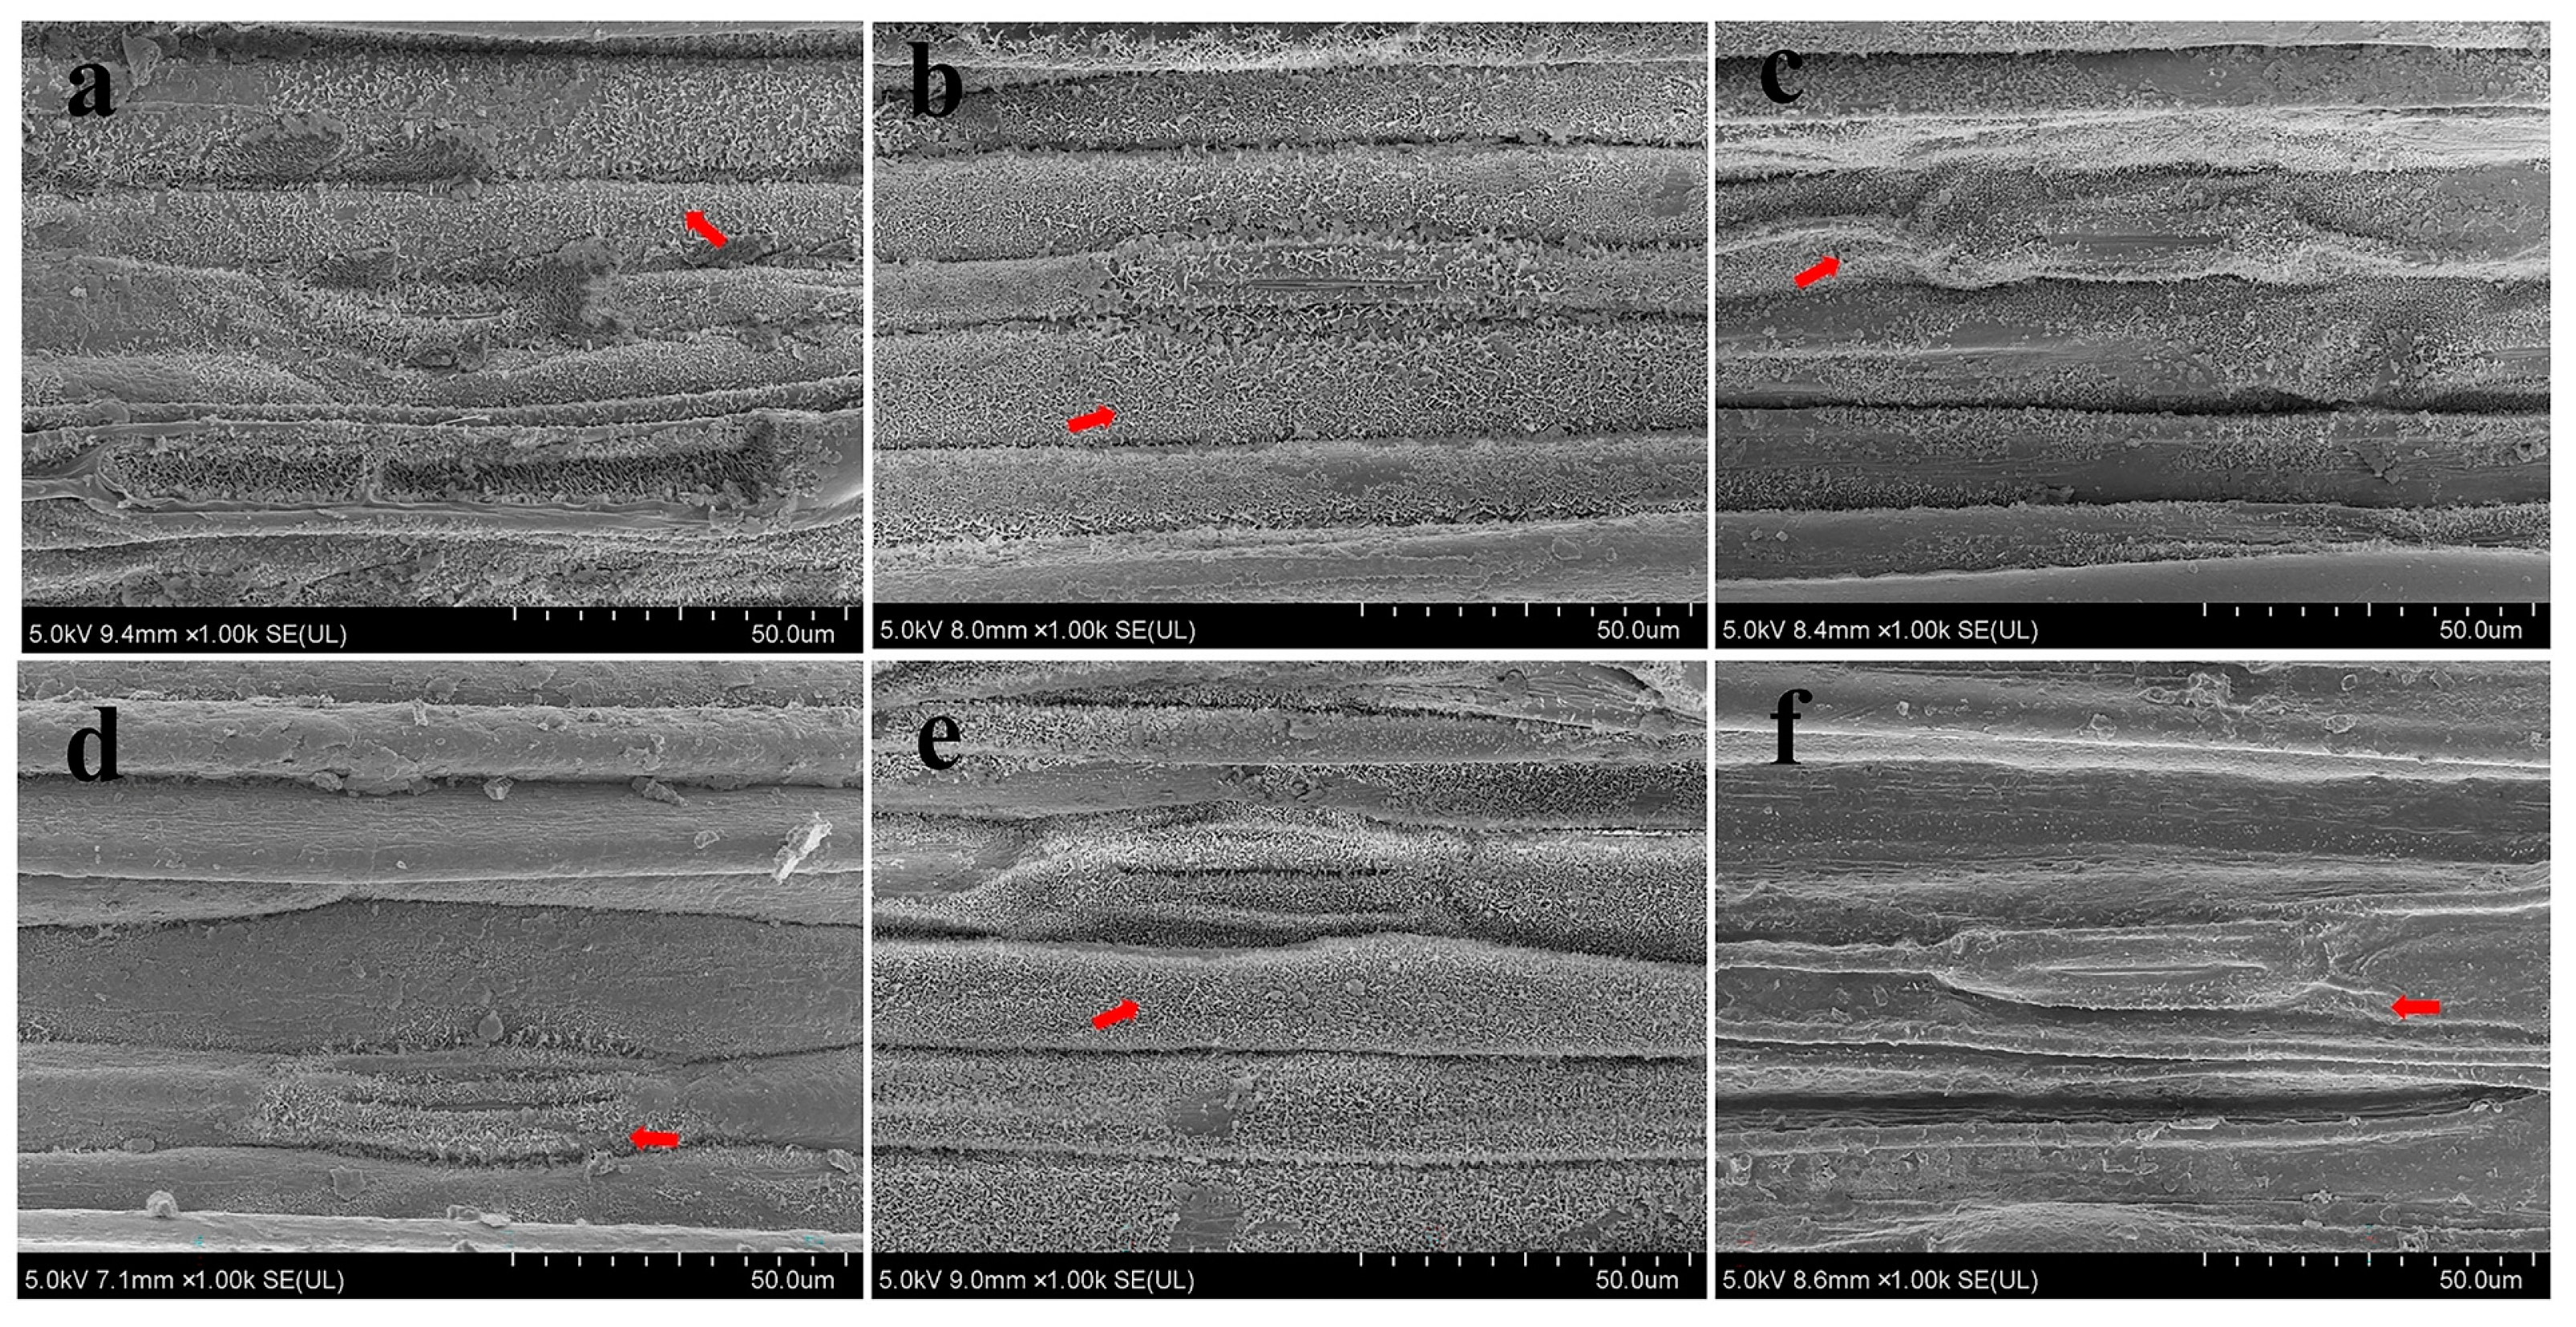
3.4.1. Scanning Electron Microscope Analysis

Figure 6 shows the scanning electron microscope images of oat leaves dried using the different drying methods, revealing differences in the structural integrity of the waxy layer; in particular, the density of the waxy layer underwent varying degrees of alteration, depending on the drying technique employed. In the HVDP-treated groups, the density of the waxy layer progressively decreased with increasing voltage levels of 25 kV, 30 kV, 35 kV, and 40 kV. Additionally, distinct physicochemical etching marks were observed, which can be attributed to the impact of ionised wind during the drying process. In contrast, the waxy layer in the AD group exhibited a relatively uniform distribution, reflecting a natural degradation process over time. Meanwhile, the HAD treatment caused severe cellular damage, which was attributed to the high temperatures used during the treatment disrupting the organisation of the waxy layer. These observations highlight the varying effects of drying conditions on the microstructural properties of oat leaves and the importance of optimising parameters to minimise structural damage. The presence of the wax layer decreases the transpiration rate and reduces water evaporation [37], and, so, water evaporation is accelerated with increasing voltage. At 40 kV, the wax layer was seriously damaged; as the wax layer can play the role of a physical barrier to prevent the plant from viruses, such damage can affect the palatability of the dried material. At 35 kV, the density of the wax layer was optimal, and the fastest water evaporation was observed during HVDP drying. HVDP enhances the drying rate by modifying the surface microstructure through the action of ionised wind, resulting in a significantly higher drying rate compared to the AD group. This finding aligns with the results of the drying properties analysis.

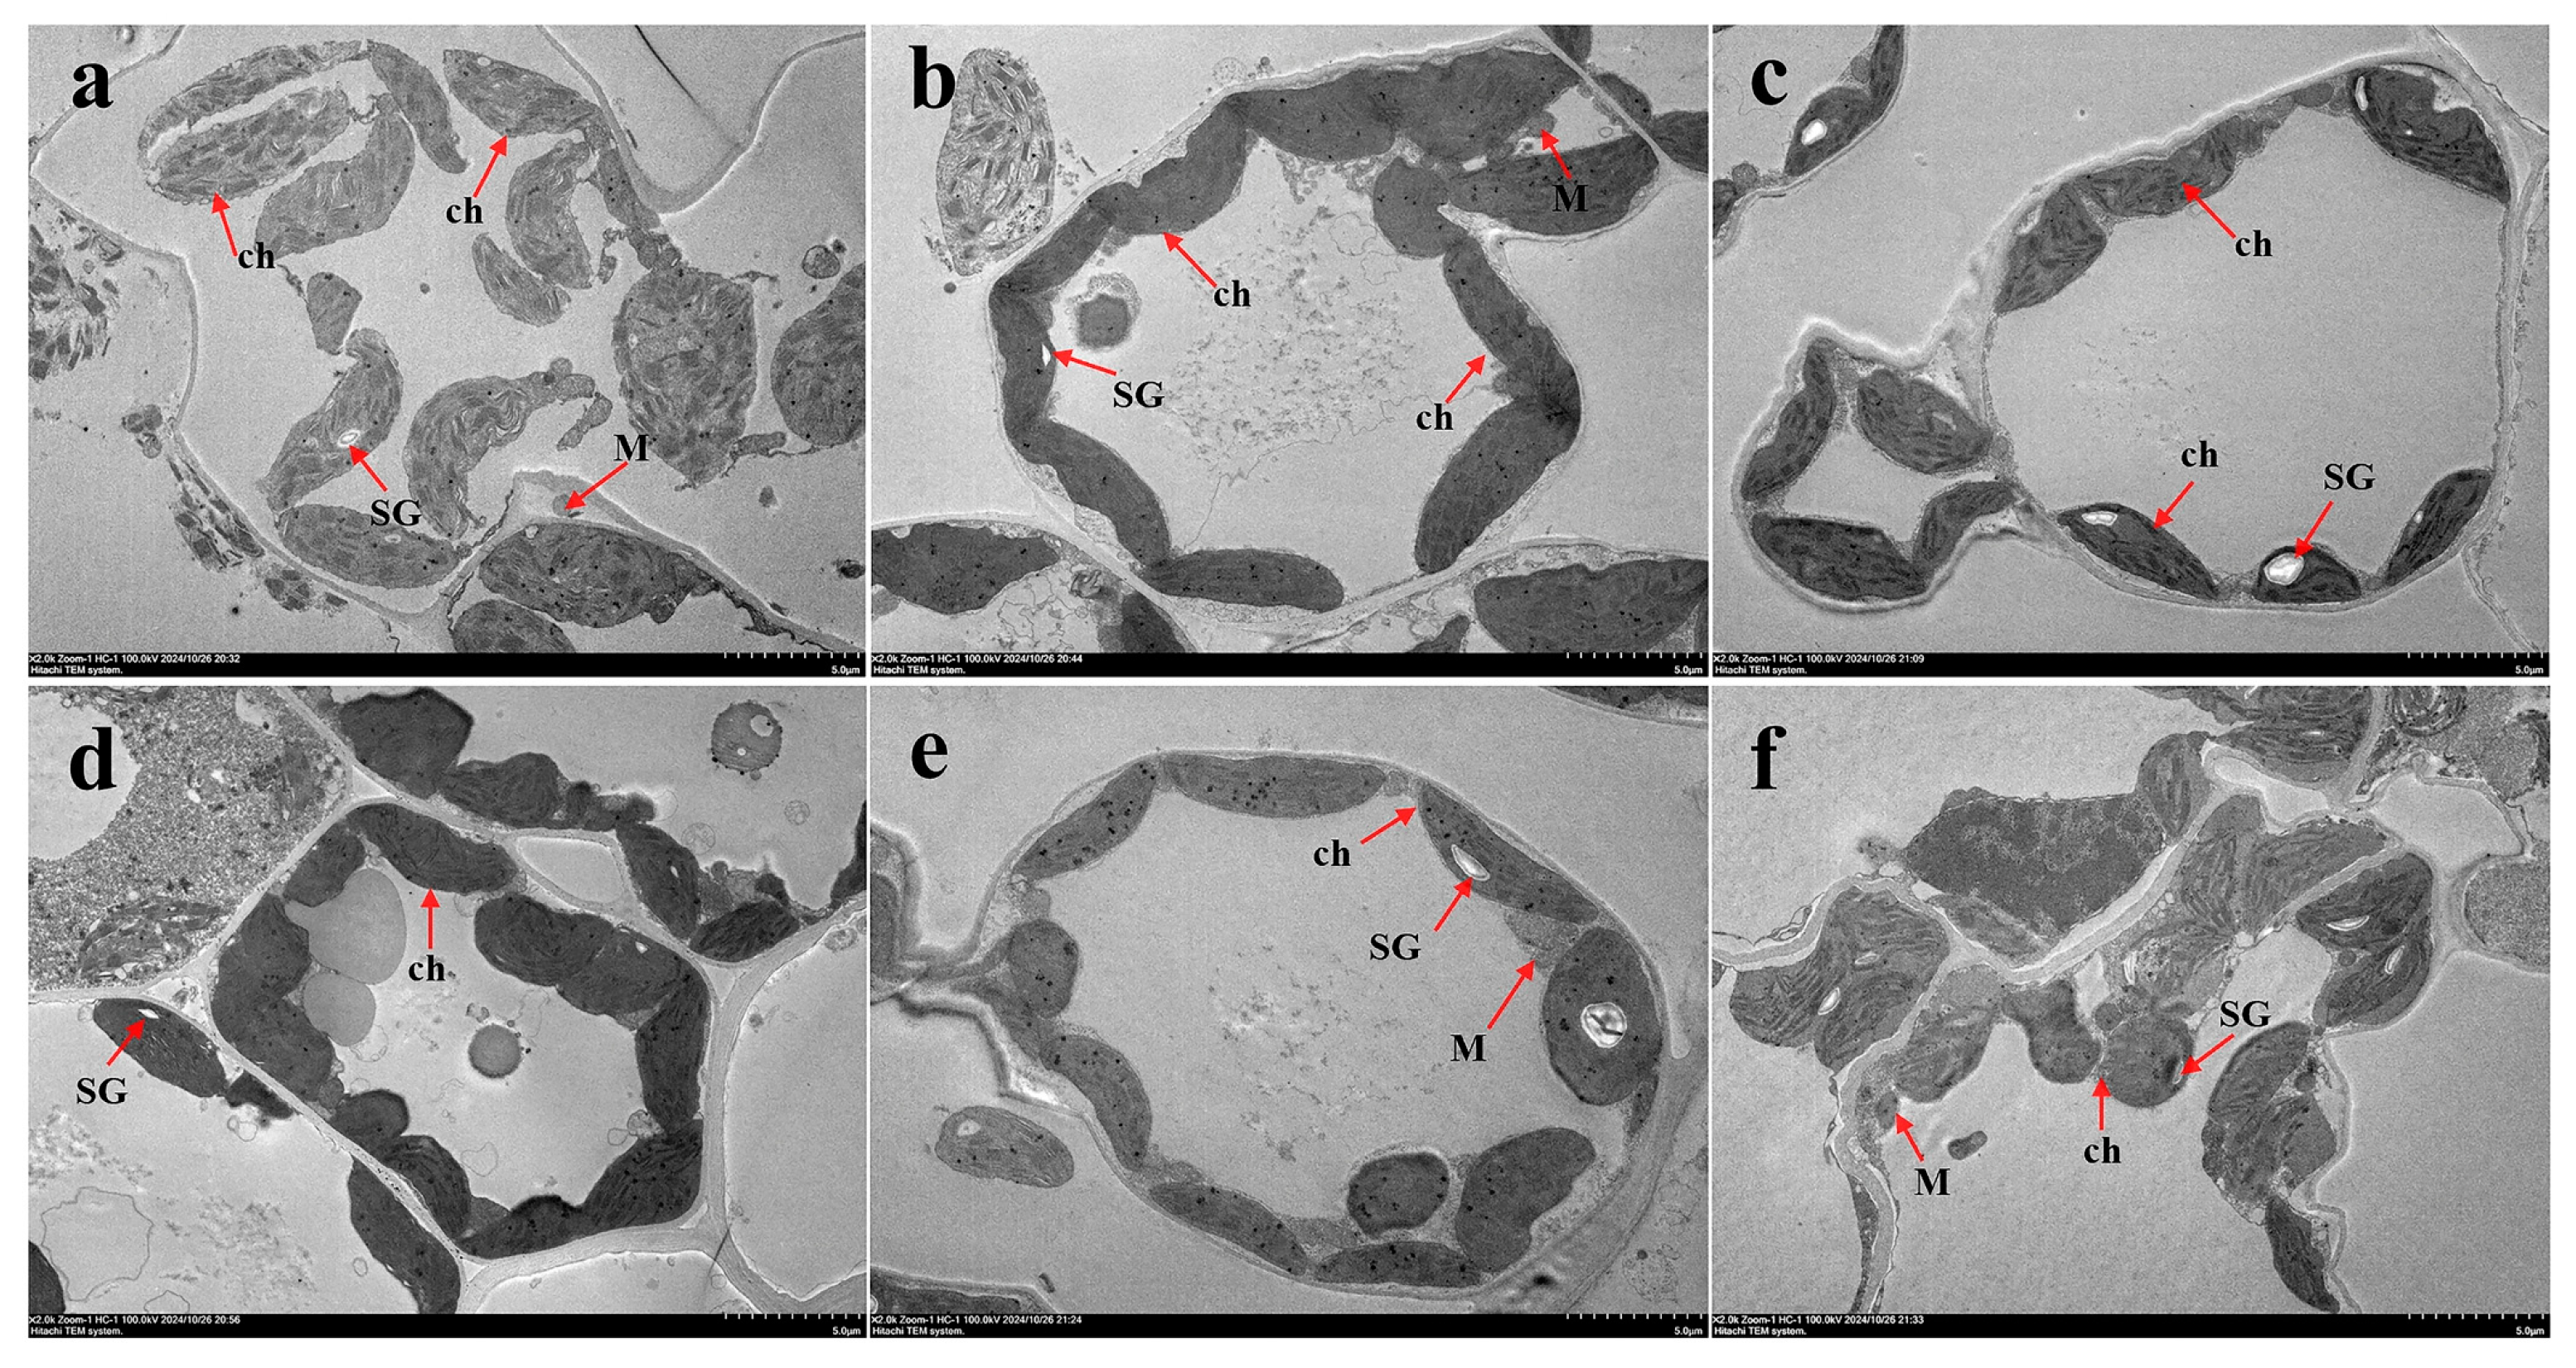
3.4.2. Transmission Electron Microscopy Analysis

Figure 7 presents a comparative analysis of the cellular ultrastructure of oat hay under different conditions, aimed at exploring the effects of HVDP drying. A certain number of mitochondria can be seen in the AD group, and the number of starch granules was obviously increased. Starch granules play an important role in energy storage and metabolism in plant cells, but too much starch in forage can adversely affect rumen health, feed intake, and digestion [38]. Furthermore, it is obvious for the AD and HAD group samples that the cell collapse is serious, the structure is not clear enough, and the cell membrane damage is serious, mainly due to the high-temperature stress having a certain negative impact on the stomatal structure, chloroplasts, and other organelles of the leaves [39]. An analysis of the HVDP groups revealed that the ultrastructure of oat hay cells in the 25 kV group remained relatively intact, with the cell wall and cytoplasmic membrane visible, and the distribution of chromatin in the nucleus was not uniform; at 30 kV, some of the stroma and vesicle-like membranes were structured; at 35 kV, almost all mitochondria were degraded, the chloroplast membrane was smooth and complete, and the thylakoid stack was abundant and orderly, indicating a relatively complete membrane system, while the number of starch granules was significantly reduced; at 40 kV, the ultrastructure of oat hay cells was significantly changed—namely, the cell wall was cracked, the cell plasma membrane was damaged, and the mitochondrial structure was blurred—which indicates that the high-voltage treatment had a significant destructive effect on the internal structure of the oat hay cells. As the site of respiration, mitochondrial degradation can reduce cell respiration and cell activity, thus reducing nutrient consumption [40]. Compared with HAD and AD, HVDP can properly reduce the number of starch granules on the premise of reducing cell respiration, reducing cell activity, and maintaining chloroplast integrity, thus maximising the retention of nutrients in forage.

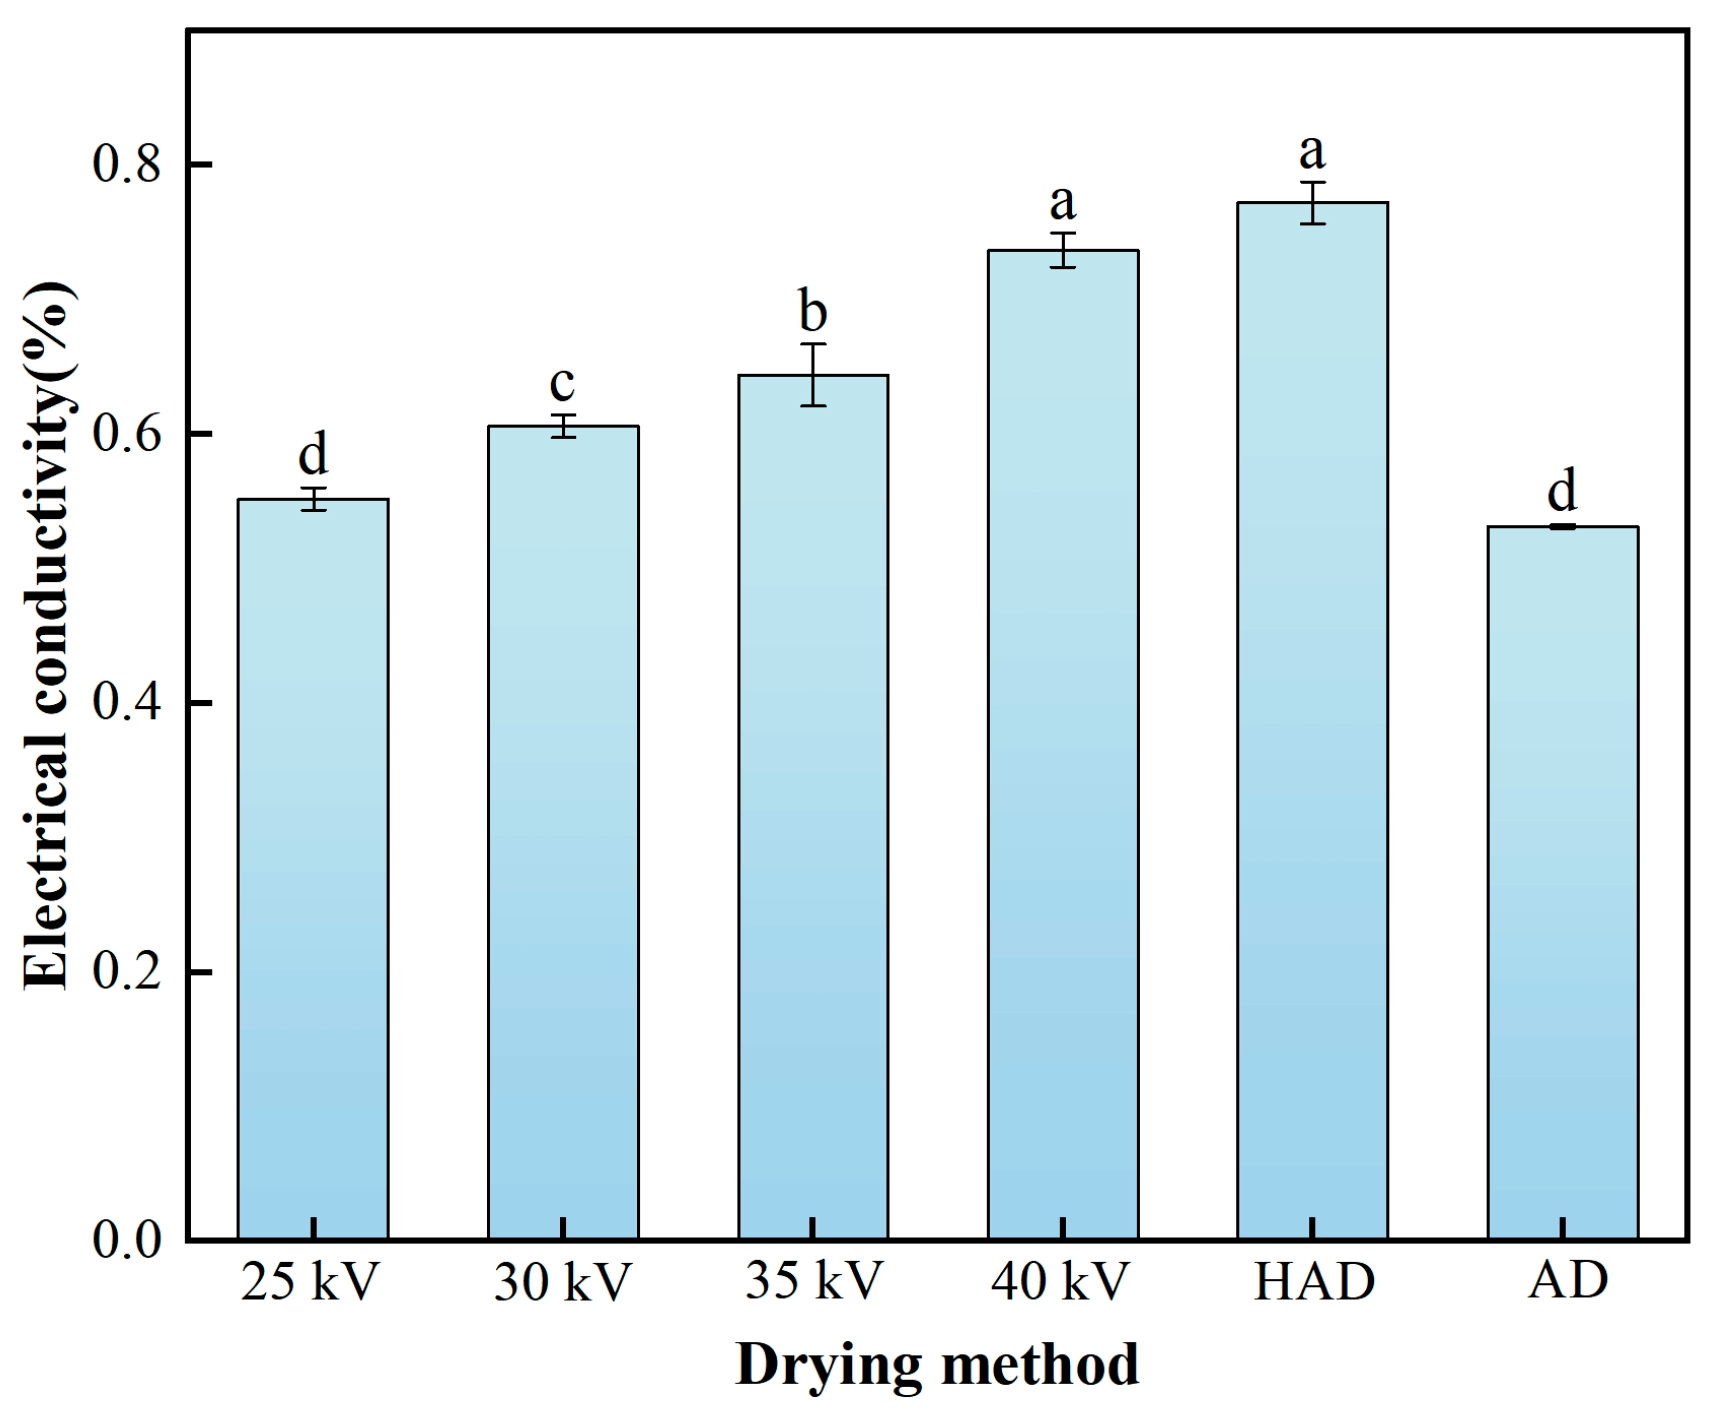
3.5. Electrical Conductivity Analysis

Electrical conductivity (EC) is a basic index to assess the permeability of plant cell membranes. Figure 8 shows the electrical conductivity of oat grass after drying using the different drying techniques. No statistically significant differences were observed between the HAD group and the 40 kV treatment group (p > 0.05), nor between the AD group and the 25 kV treatment group (p > 0.05). However, the conductivity levels in the 30 kV and 35 kV groups displayed significant variations when compared to all other groups (p < 0.05). The main reason for this is that plant cell membranes are selectively permeable to substances, and, when plants experience stress, it can damage cell membranes and increase their permeability. Due to cell membrane destruction, the release of cytoplasmic and vesicular ions results in increased conductivity of the rehydration solution, which leads to an increase in conductivity [41]. Furthermore, the internal structure of the cell was destroyed due to the excessively high voltage at 40 kV, and the HAD group was dried at a temperature of 55 °C, which caused physical damage to the structure of the cell wall [42]. Analysis of the microstructure of oat leaves revealed that HVDP drying at 35 kV led to a low density of the wax layer and preserved the cellular structure; therefore, the 35 kV group samples exhibited the best conductivity. Overall, the conductivity is greatly affected by the density of the wax layer and the integrity of the cellular structure [43,44]; as HVDP drying can selectively damage the microstructure and organelles of some tissues, the drying rate and nutritional quality showed a certain degree of enhancement.

3.6. Nutritional Quality

3.6.1. Protein Content (CP)

Crude protein content is a critical focus of scientific research and breeding, as it plays a vital role in feed nutrition, agricultural productivity, and livestock adaptability under adverse conditions [45]. Figure 9 shows the crude protein content in oat grass samples after treatment with the different drying methods. The crude protein content in the 35 kV group was 13.61%, significantly higher (p > 0.05) than those in the HAD and AD groups (10.67% and 10.53%, respectively). Across different voltages, the crude protein content in the HVDP groups exceeded those in the HAD and AD groups. Within a certain voltage range, the crude protein content increased with voltage, peaking at 35 kV. The main reason for this observation is that protein content is significantly influenced by environmental conditions. For HAD, high temperatures can lead to a reduction in protein content, with excessively high temperatures causing protein denaturation [46]. Natural air drying, due to uncertain conditions, is greatly influenced by environmental factors, and prolonged drying can result in a decrease in the protein content due to protein degradation and environmental factors [47]. Therefore, the protein contents in the HAD and AD groups were low. In contrast, HVDP drying can rapidly remove moisture from forage, reducing the loss of protein due to oxidation and microbial degradation during prolonged drying, as well as the physical and chemical processes leading to protein denaturation [48].

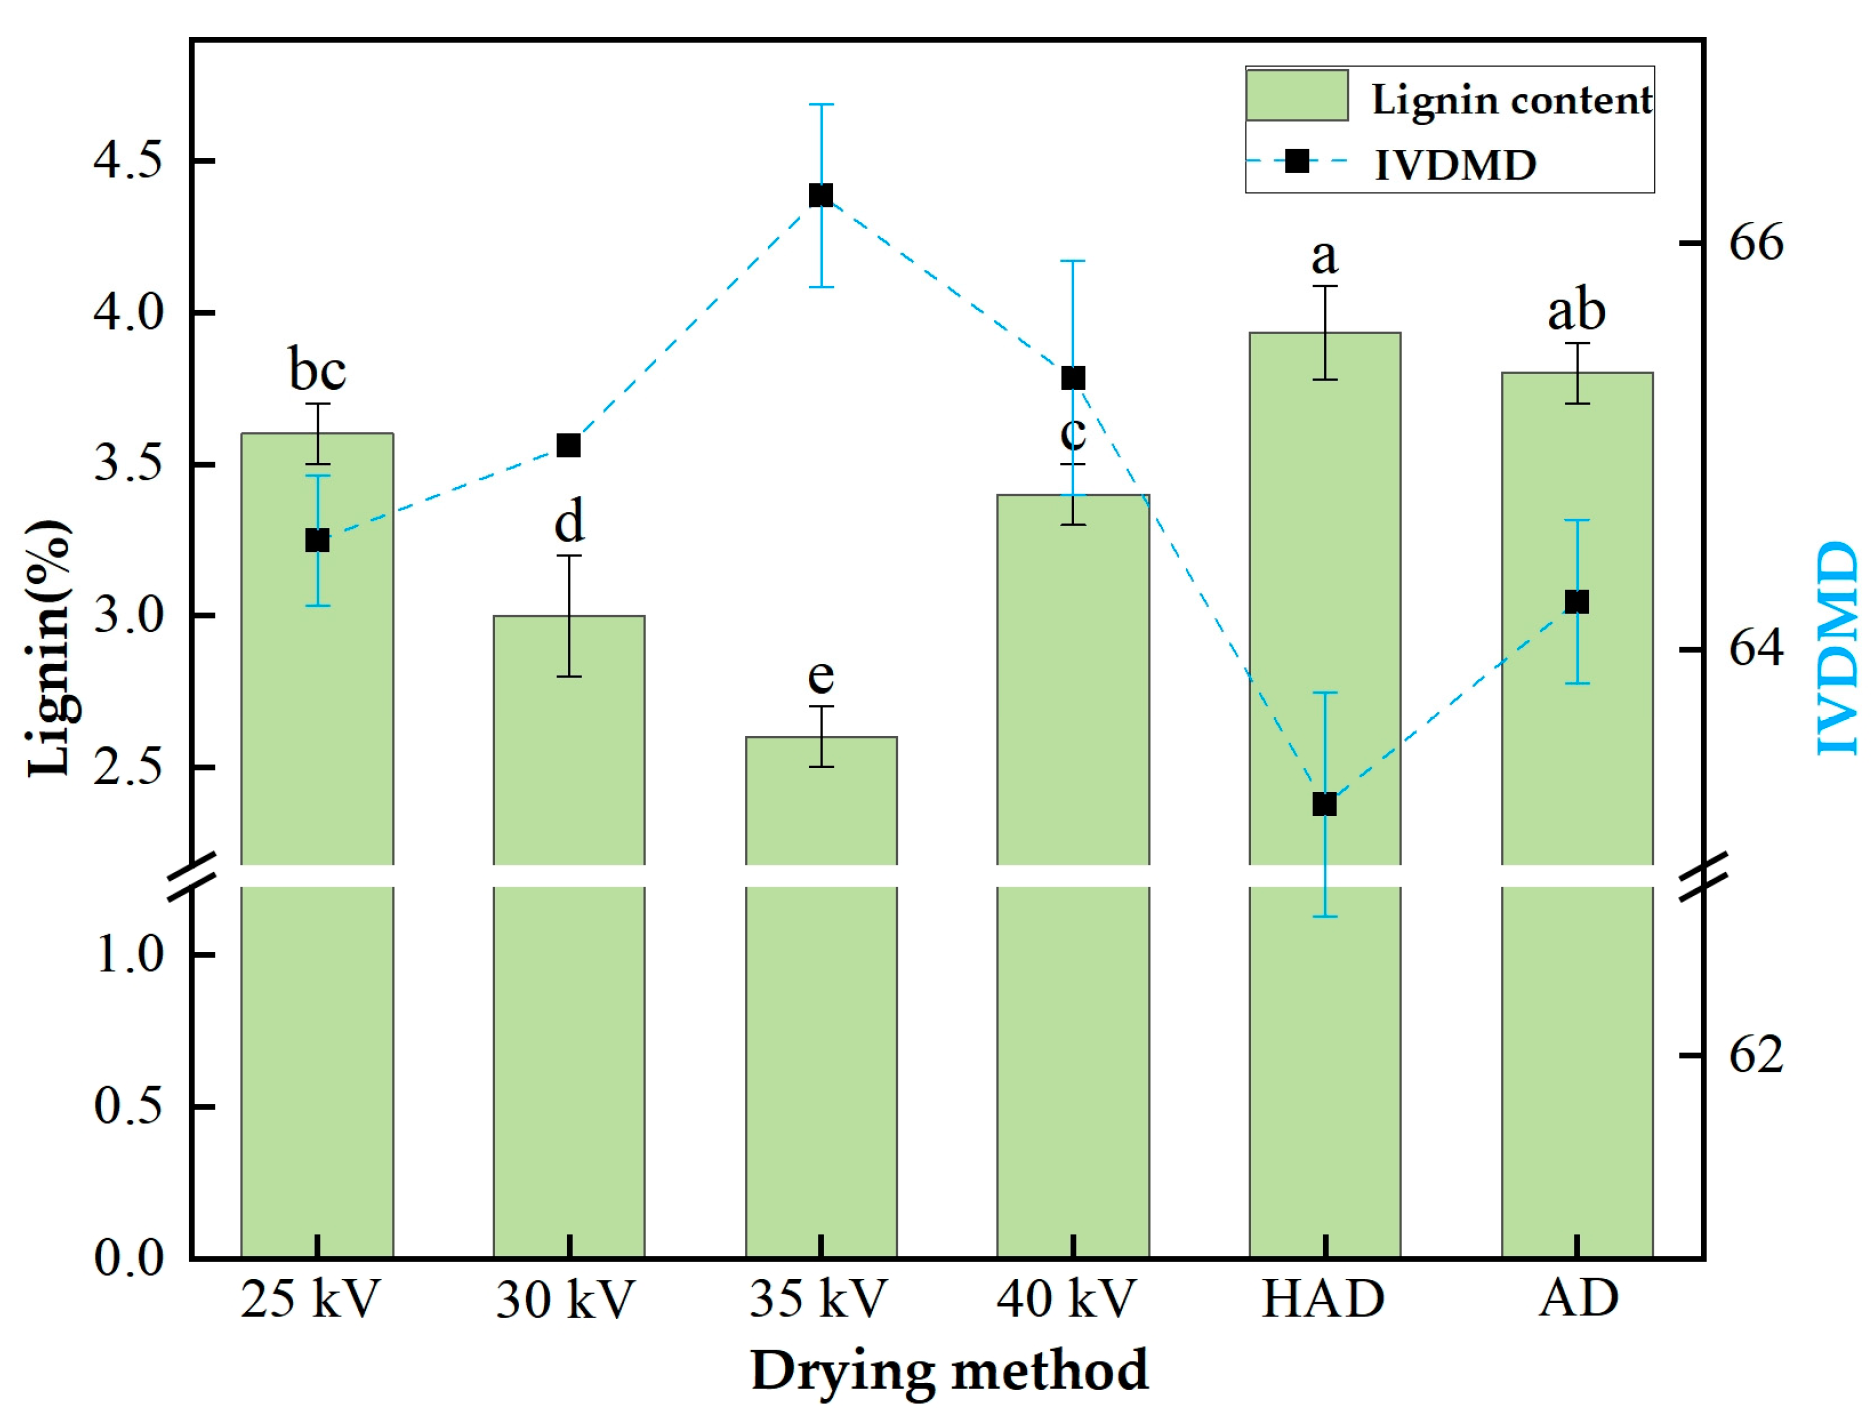
3.6.2. Lignin Content

Lignin content is a crucial determinant of feed quality, as it is a natural polymer which is predominantly present in plant cell walls. Its primary functions include providing mechanical strength to the cell wall and serving as a defence mechanism against microbial degradation [49]. Figure 10 illustrates the comparison of lignin levels and in vitro dry matter digestibility (IVDMD) under the various drying techniques. A notable distinction in lignin content was identified between the HAD and HVDP groups (p < 0.05). The IVDMD value was highest at 35 kV, exhibiting a statistically significant difference when contrasted with other treatment groups (p < 0.05). The HVDP groups had significantly lower lignin content and higher IVDMD, when compared to the HAD and AD groups. Lignin content gradually decreased and IVDMD increased with rising voltage, within a certain range, as cell structure damage during drying led to lignin reduction. The HAD group had the highest lignin content, due to the severe cell wall damage that occurred during high-temperature drying, while the AD group exhibited higher lignin content due to air drying disrupting the bonds between lignin and total cellulose. Overall, lignin content and IVDMD showed a significant negative correlation. HVDP selectively degraded substances such as lignin and mitochondria—which reduce nutritional quality—while preserving components that are positively correlated with nutrition. These findings align with previous microstructural and physicochemical property-related studies.

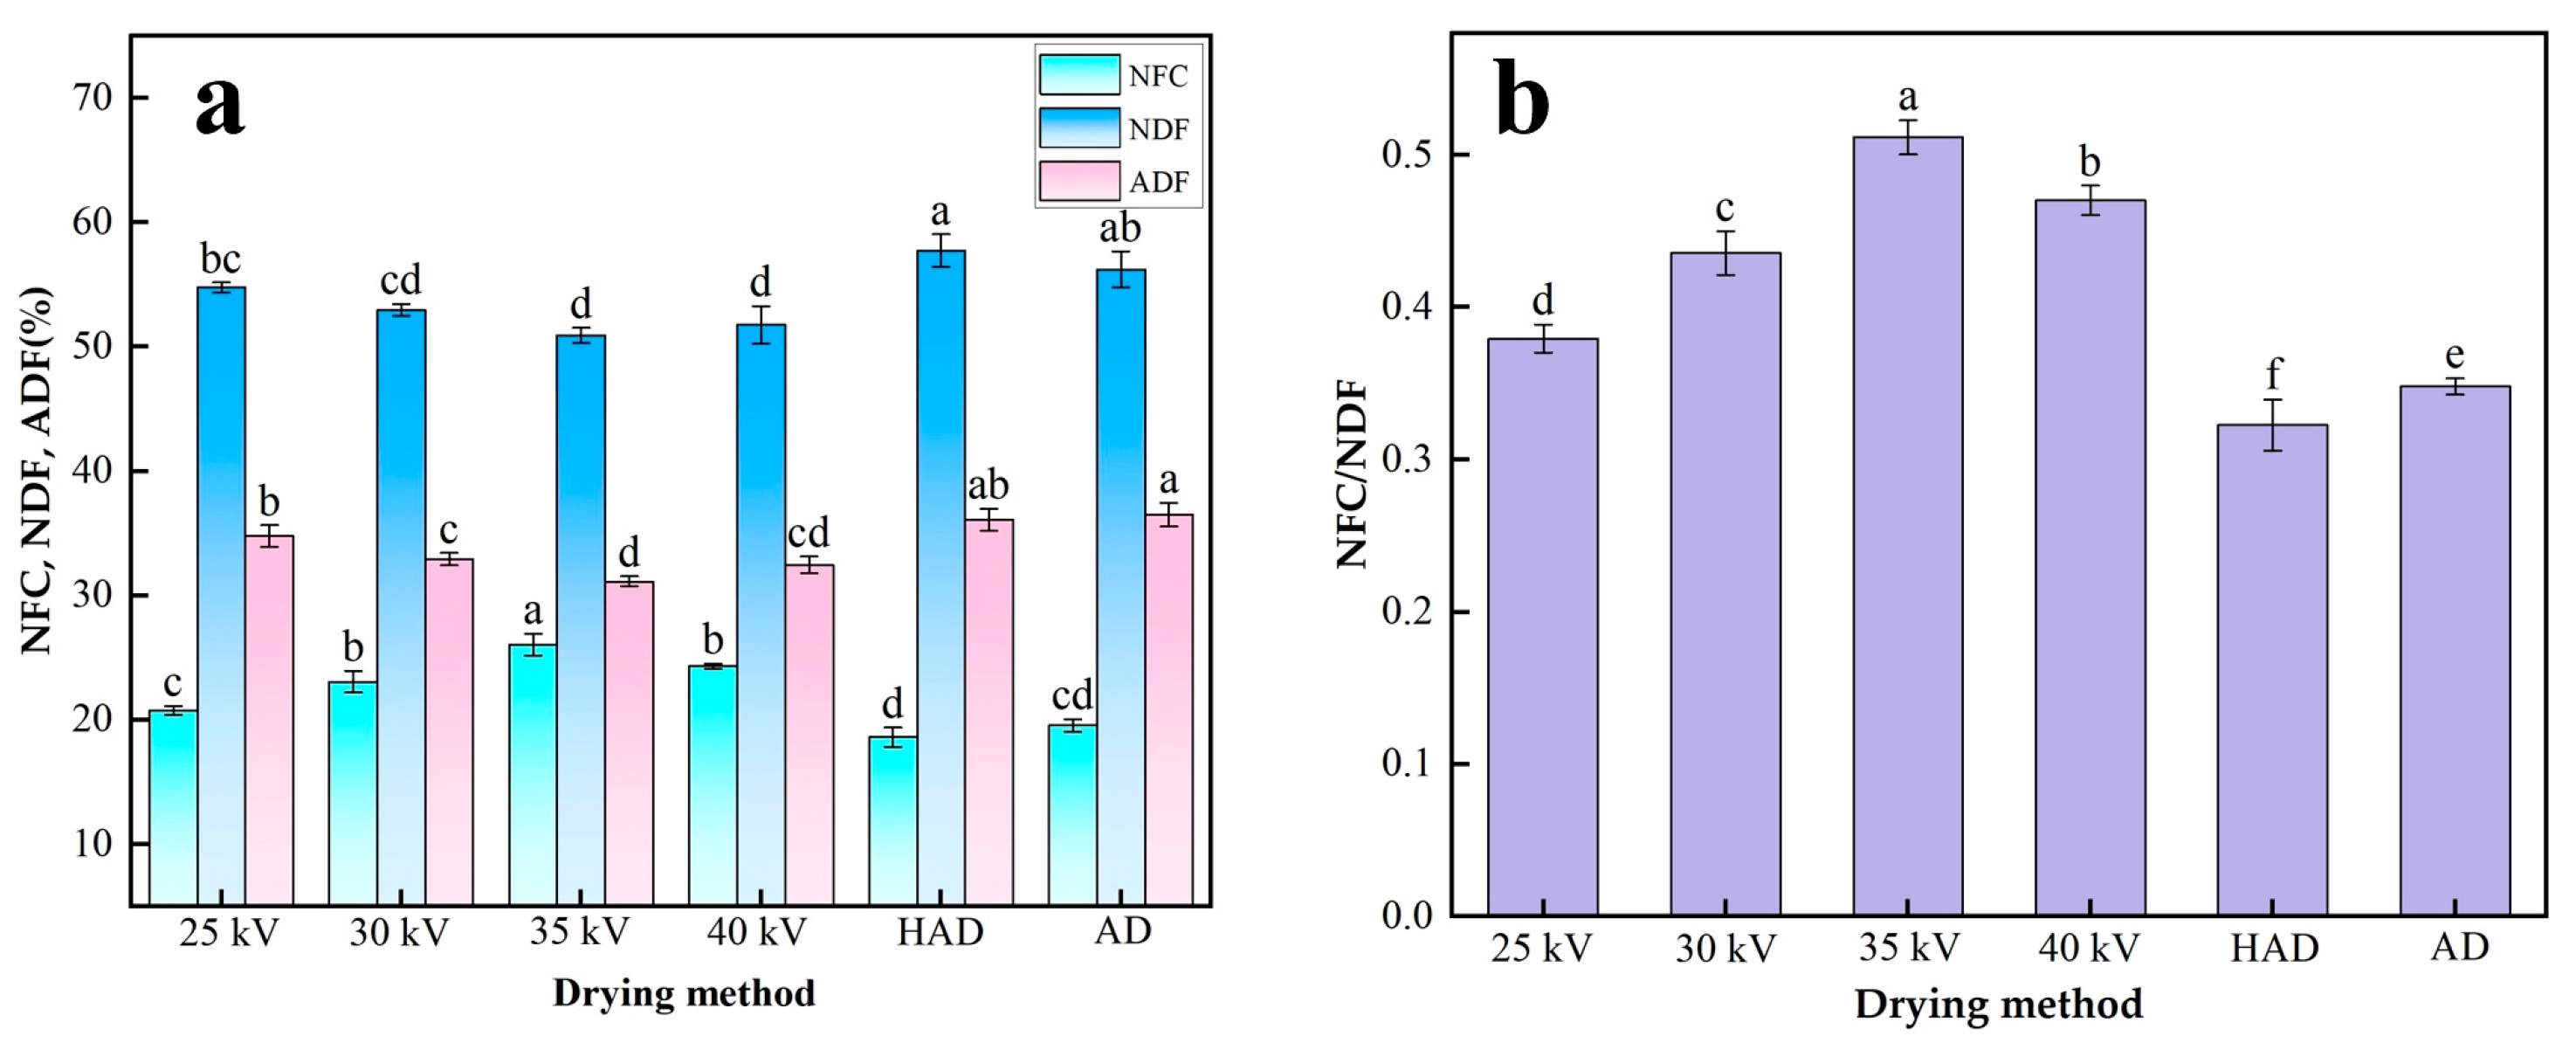
3.6.3. Contents of NFC, NDF and ADF

The levels of acid-detergent fibre (ADF), neutral detergent fibre (NDF), and non-fibre carbohydrate (NFC) are essential indicators for assessing the nutritional value of forage. Figure 11a presents the ADF, NDF, and NFC contents in oat grass processed using various drying techniques. HVDP-treated samples exhibited lower ADF and NDF levels, compared to the HAD and AD groups, with the 35 kV treatment showing a statistically significant difference from the other methods (p < 0.05). Feed quality is recued with increased fibre content (e.g., ADF and NDF) [50]. Figure 11b shows the NFC/NDF ratios under different drying approaches, revealing significant differences between the treatment groups (p < 0.05). The NFC/NDF ratio was significantly higher in the HVDP-treated groups, compared to the HAD and AD groups, again with the best performance at 35 kV. Song et al. [51] have reported that forages with higher NFC/NDF ratios enhance livestock weight gain, feed conversion efficiency, and nutrient utilisation. Therefore, to ensure feed palatability, nutrient utilisation, and animal performance, HVDP drying is more advantageous.

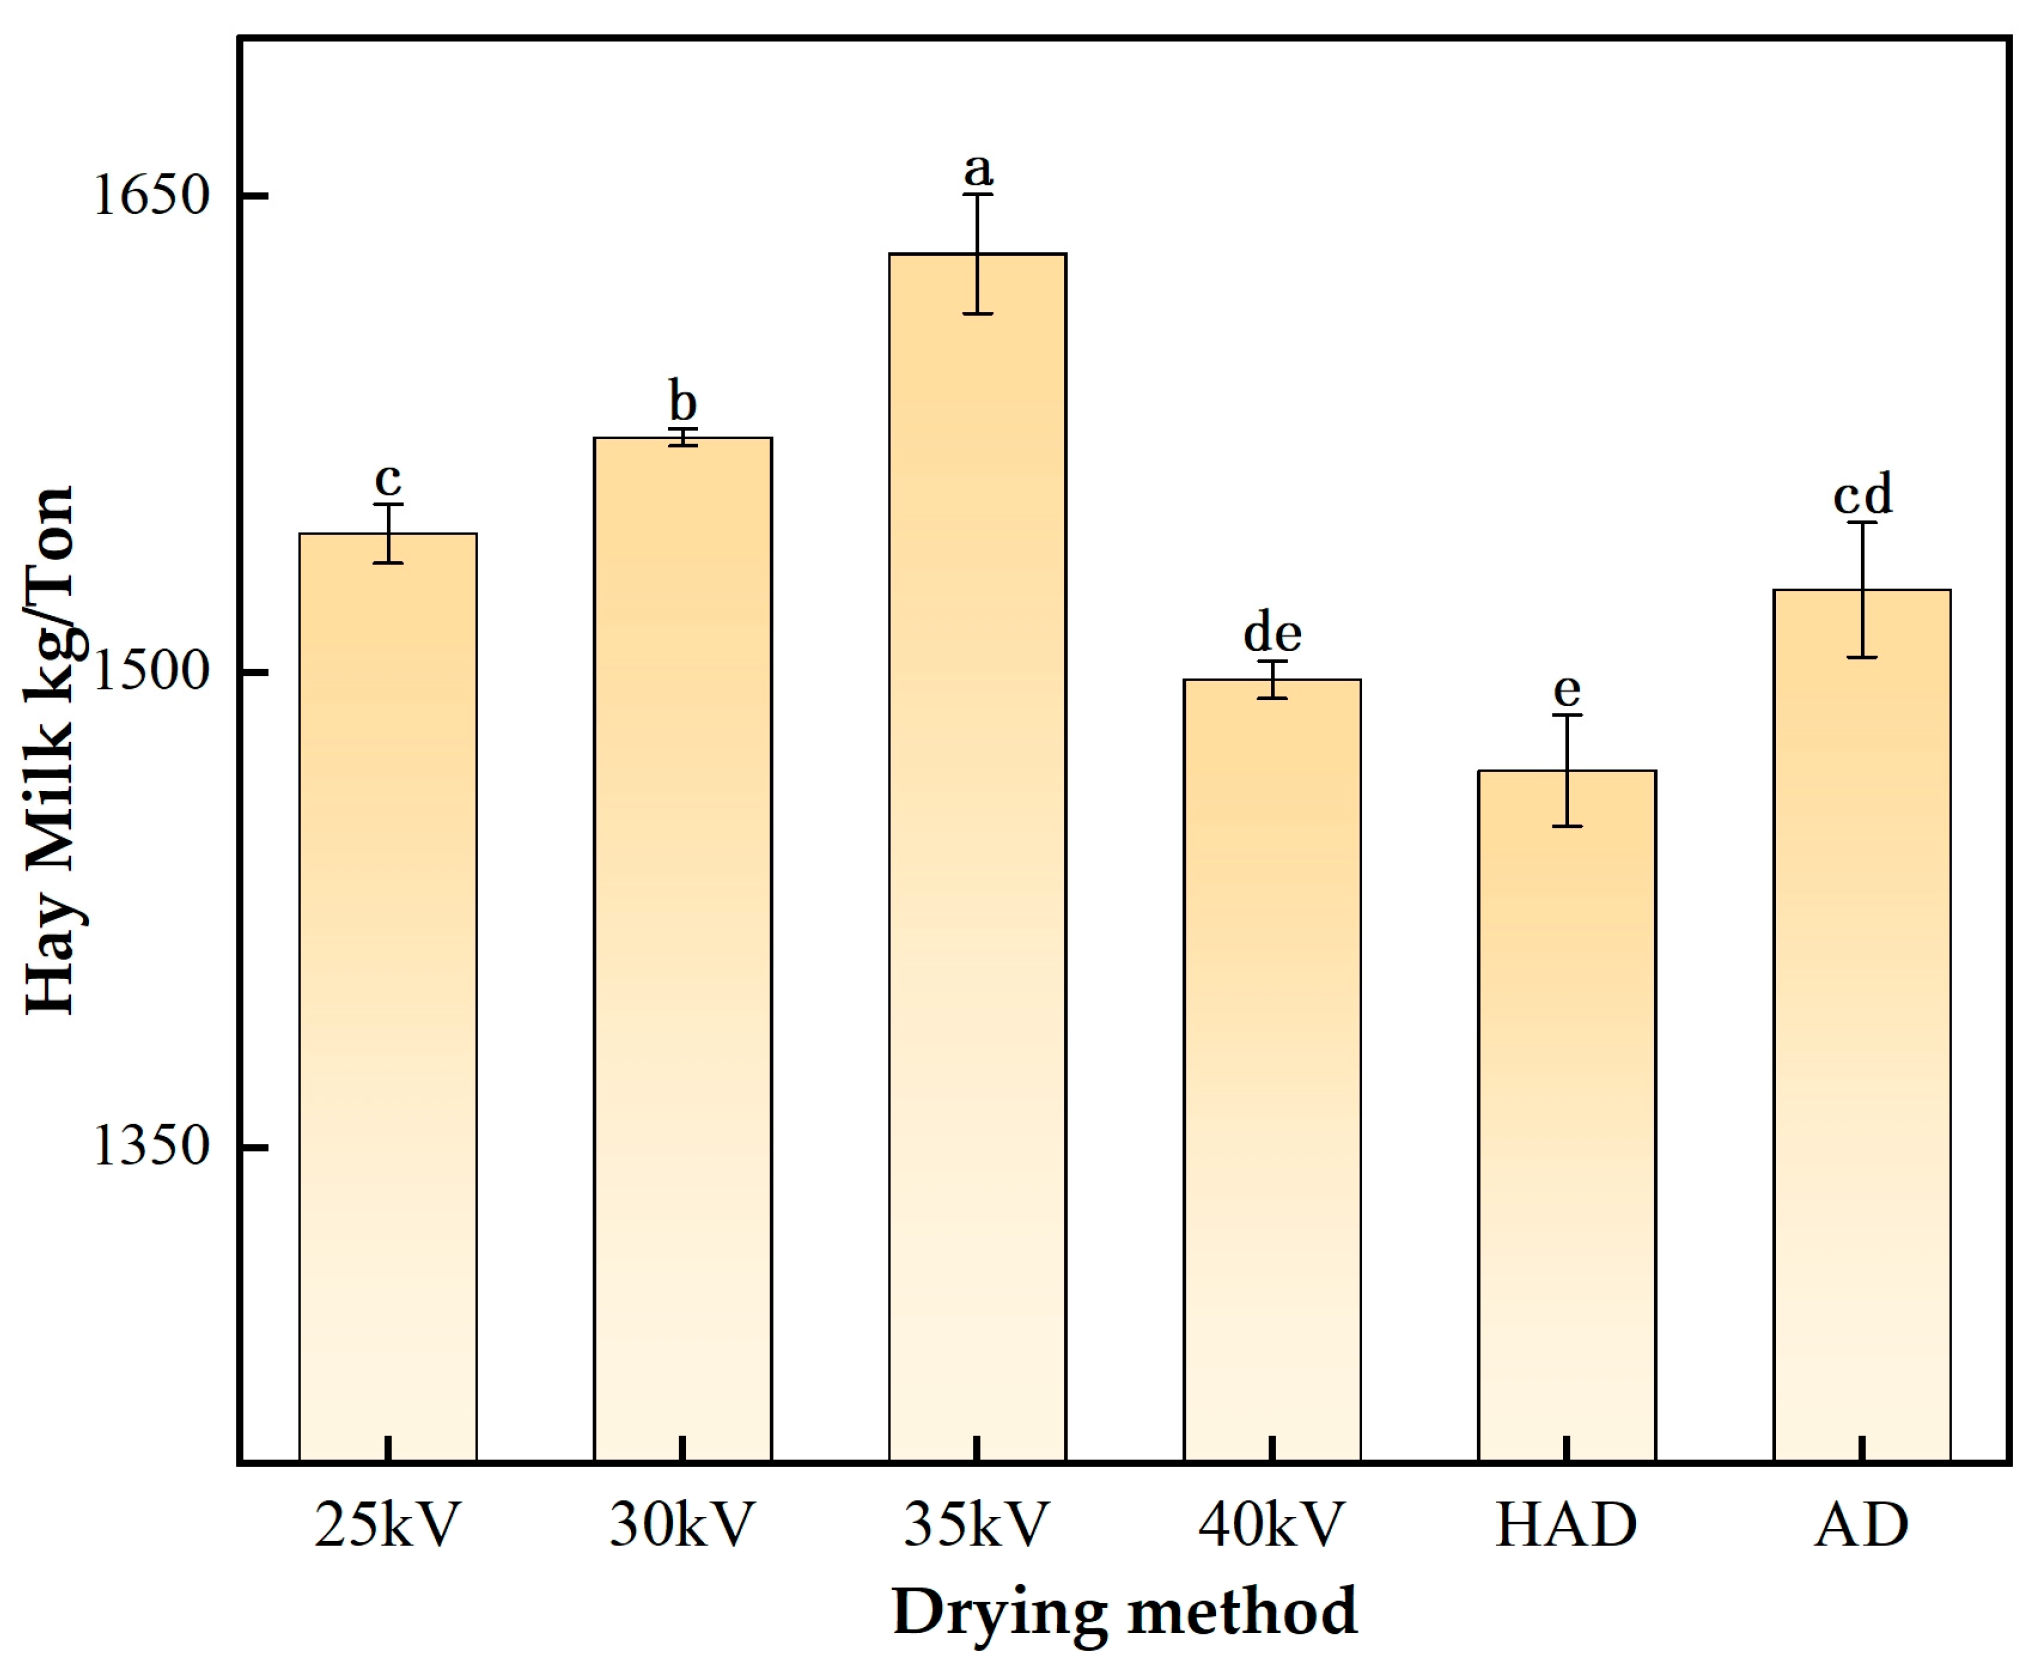
3.6.4. Milk Yield per Ton

The milk production per unit of hay weight is closely linked to the nutritional value of feed and the overall productivity of livestock [52]. Figure 12 shows the milk yield per ton of oat grass subjected to various drying techniques. There was no significant difference between the 25 kV and AD groups (p > 0.05) or the 40 kV and HAD groups (p > 0.05). However, significant variations (p < 0.05) were evident in the 30 kV and 35 kV groups, when compared to the other treatments. Analysis demonstrated that the HVDP drying method substantially improved milk yield per ton of dried forage through minimising nutrient loss while maintaining effective drying performance. Within a specific voltage range, milk yield increased as the voltage rose; however, excessively high voltages negatively impacted forage quality through degrading nutrients such as protein and cellulose. This degradation, in turn, adversely affects the health and productivity of livestock. Consequently, the 35 kV treatment resulted in the highest milk yield, whereas the 40 kV group showed a marked decline in yield due to excessive nutrient loss [53,54].

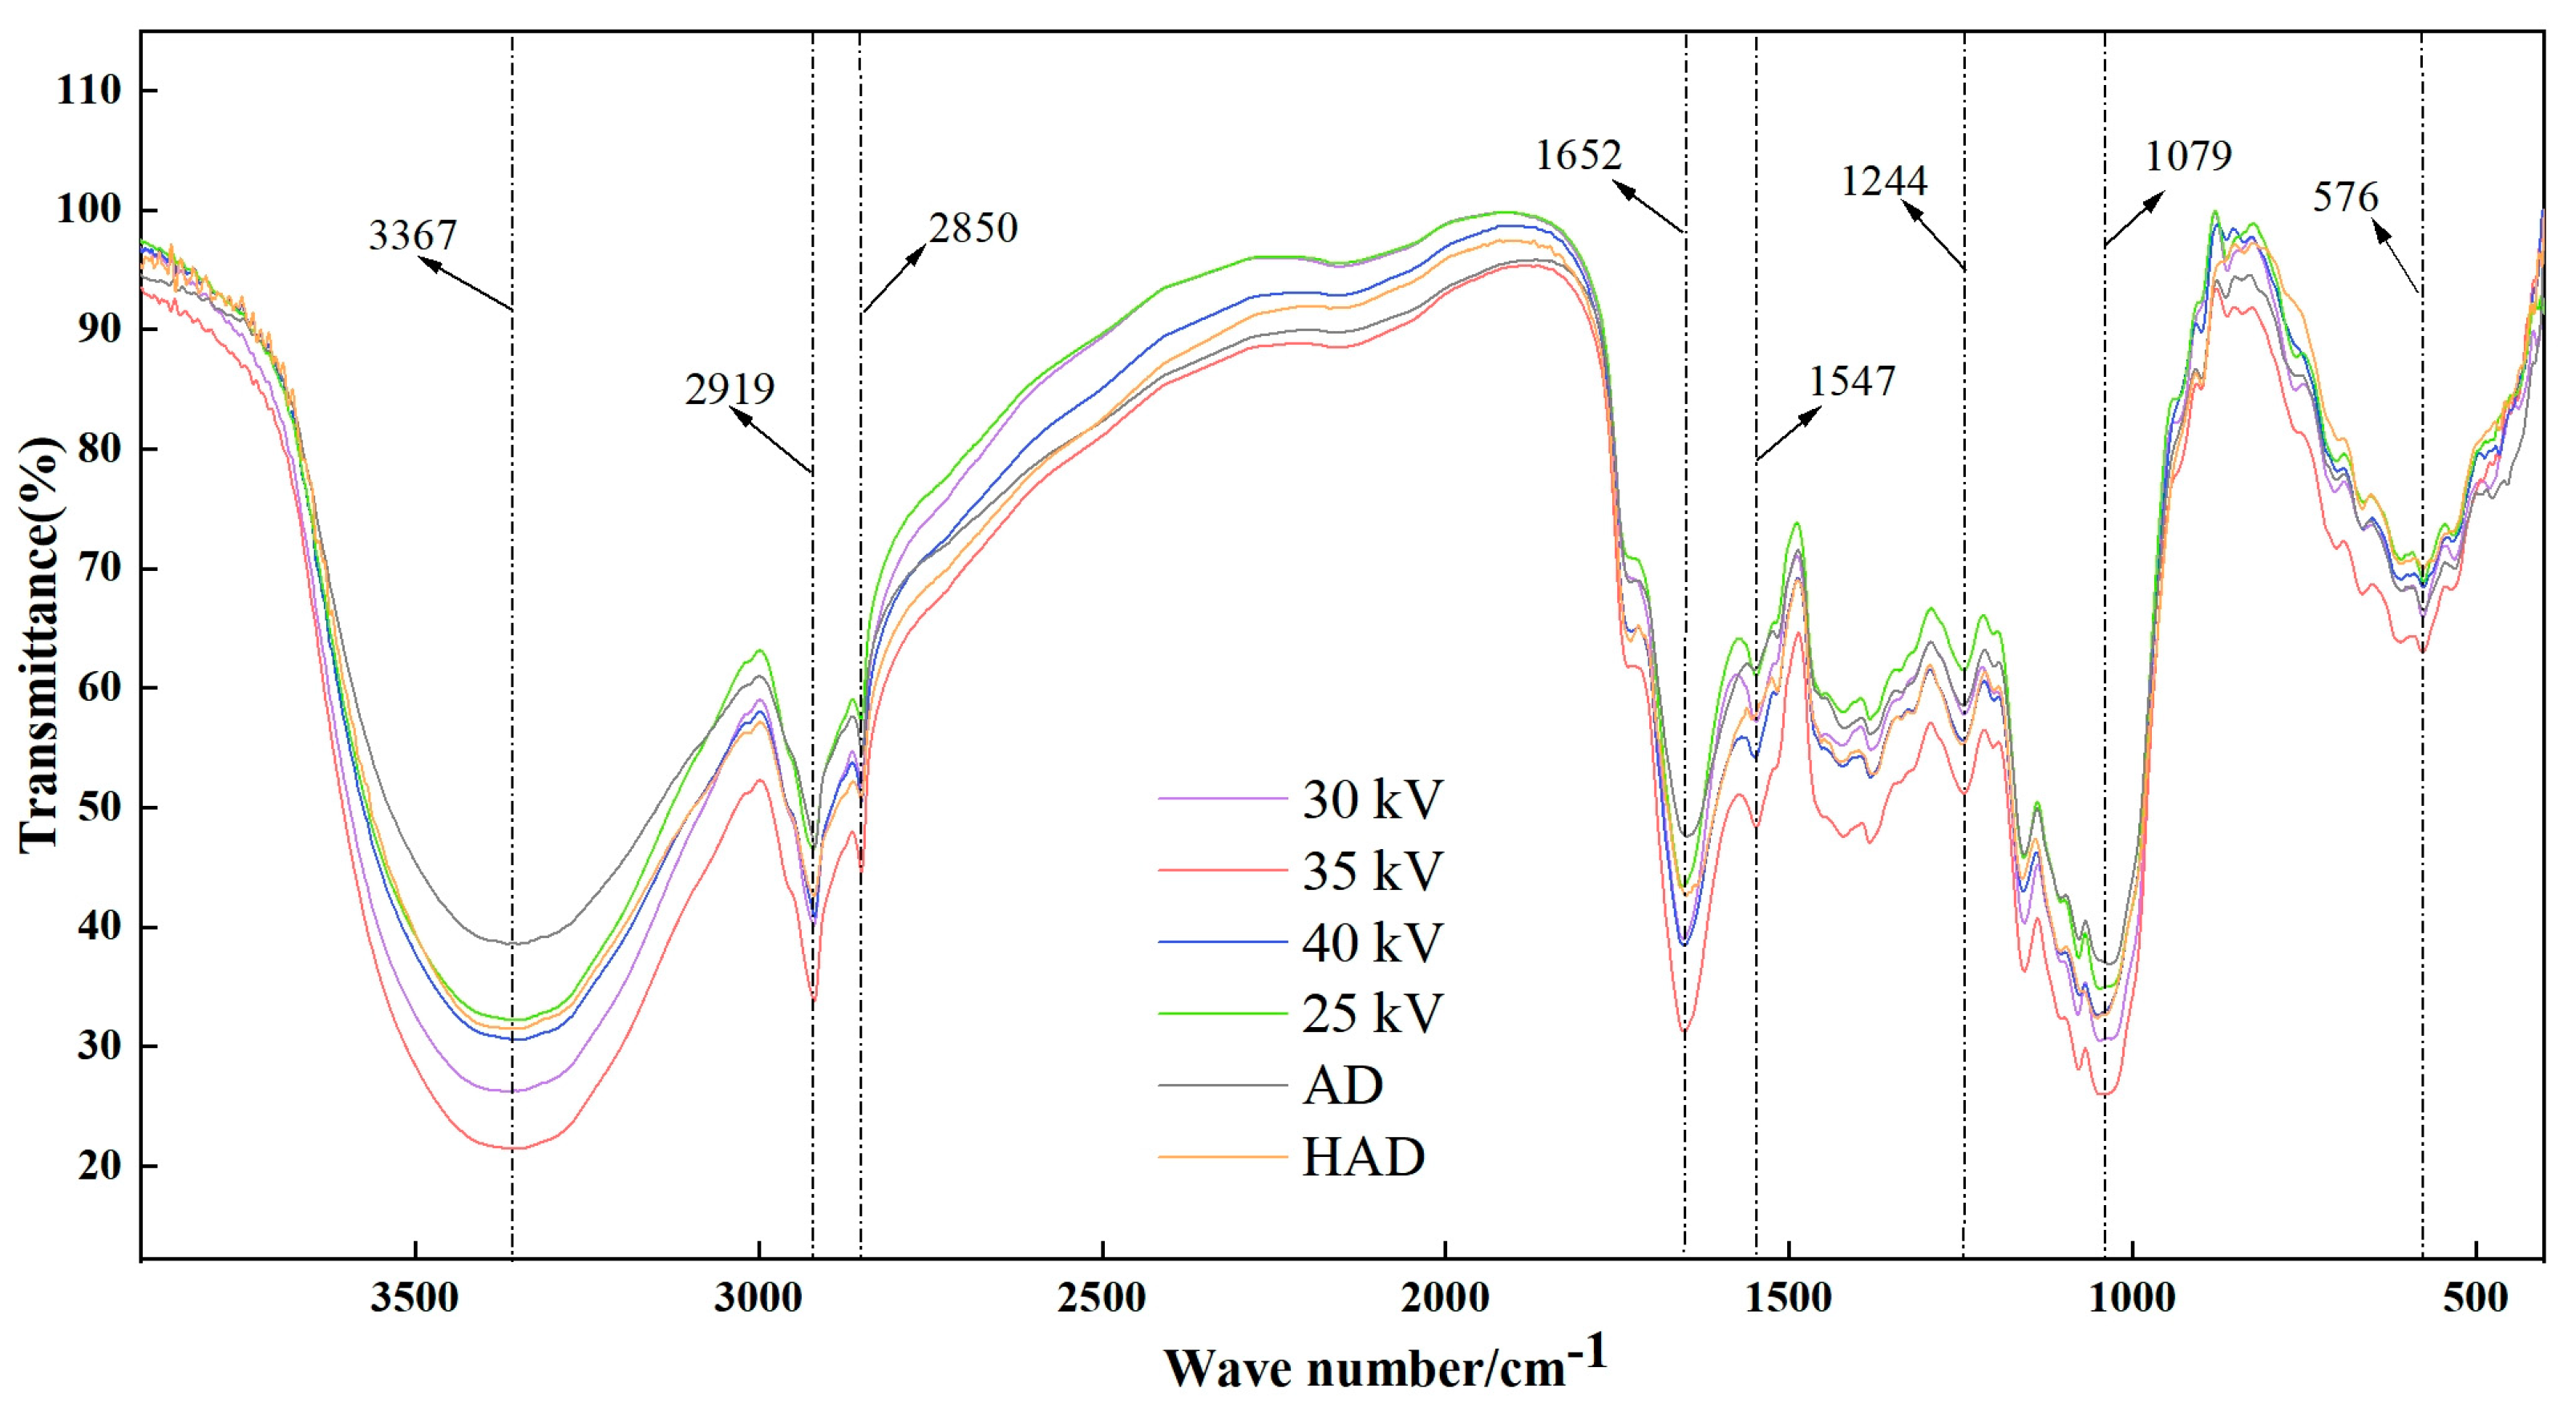
3.7. Infrared Spectrum Analysis

As shown in Figure 13, the infrared spectral peak positions of oat grass dried using the various methods were generally consistent; however, the intensity of the absorption peaks differed significantly depending on the drying method. The absorption peak intensity followed the order 35 kV > 30 kV > 40 kV > HAD > 25 kV > AD, from strongest to weakest. The broad and intense stretching observed at 3367 cm−1 was primarily associated with O-H or N-H stretching vibrations, indicating the potential presence of water molecules or hydroxyl-containing compounds within oat hay cells [55]. This peak also suggests the abundance of amino acids. The peaks at 2919 cm−1 and 2850 cm−1 were attributed to C-H stretching vibrations, commonly observed during Maillard reactions involving alanine [56]. The peaks near 1652 cm−1 and 1546 cm−1 corresponded to amide I and amide II bands, respectively [26], which related to the C=O stretching in peptide bonds, reflecting the protein content on the oat hay surface [57]. The characteristic amide III peak around 1244 cm−1, caused by C-O-C stretching vibrations, further indicated the presence of proteins [58]. Additionally, the absorption peak at approximately 1079 cm−1 was primarily linked to C-O stretching [59]. Tucker et al. [60] found that infrared spectroscopy has been successfully used to analyse various nutrients. The IR-based nutrient analysis revealed that the protein content was lowest in the AD group and highest in the 35 kV treatment. Moreover, the protein levels in the 35 kV, 30 kV, and 40 kV groups were higher than those in the HAD group. These findings suggest that applying an optimal voltage (35 kV) during drying is more beneficial for nutrient retention in oat hay.

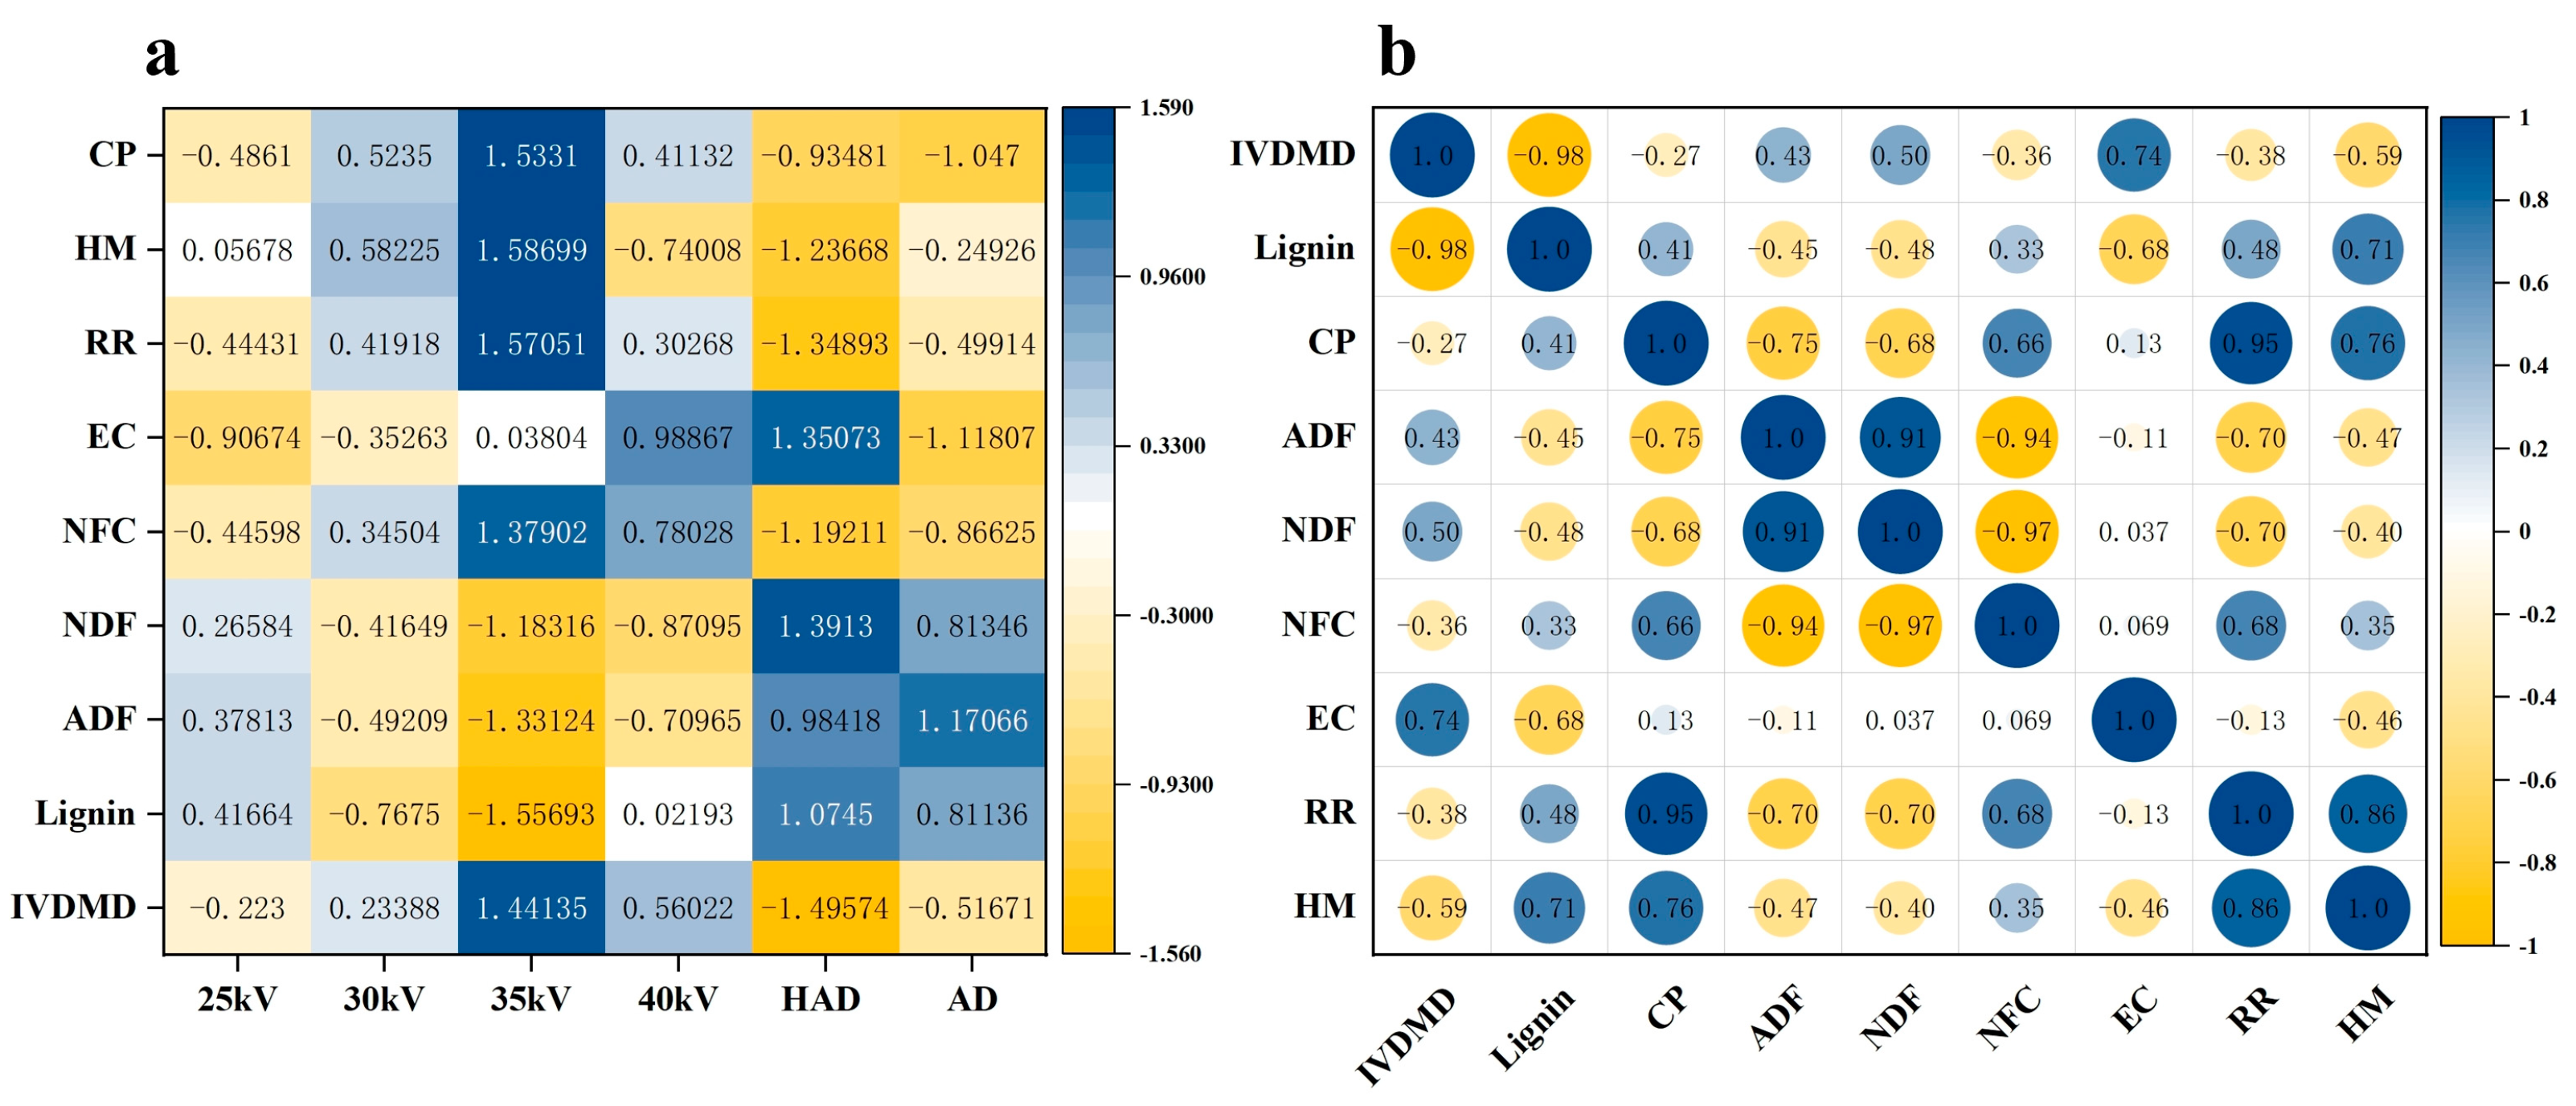
3.8. Correlation Analyse

The experimental data (rehydration rate, conductivity, in vitro dry matter digestibility, nutrient concentration) were standardised, and a correlation analysis was performed. Figure 14a presents a correlation heatmap of the effects of different drying methods on the oat-grass-drying indices. The rehydration rate and milk yield per ton results indicated that HVDP significantly outperformed HAD and AD, with the best rehydration capacity and highest milk yield observed at 35 kV, due to the minimisation of cell damage. Regarding nutrient content, the protein content at 35 kV showed the highest positive correlation, while the NDF and ADF had the lowest, indicating optimal nutrient preservation at this voltage. Figure 14b displays the Pearson correlation coefficient matrix, revealing the relationships between indicators. The protein content was positively correlated with milk yield per ton, rehydration rate, and NFC content but negatively correlated with NDF and ADF. Additionally, the lignin content showed a strong negative correlation with in vitro dry matter digestibility and milk yield, suggesting that the lignin content directly affects the digestibility and utilisation of forage. A statistical analysis confirmed that the protein, fibre, and lignin contents in forage are key factors influencing livestock production performance. As a non-thermal and efficient drying method, HVDP effectively preserves proteins and NFC while providing a rapid and reliable approach for evaluating drying technologies.

4. Conclusions

This research demonstrated that HVDP effectively accelerated the oat-grass-drying process by increasing the drying rate and reducing the drying duration, all while maintaining the integrity of the cellular microstructure. Compared to AD and HAD, the use of HVDP for drying oat grass significantly improved the drying performance and structural retention, increased the drying speed, and reduced energy consumption. The HVDP method significantly improved the nutritional composition of oat grass, particularly by increasing the levels of CP and NFC, while simultaneously lowering the lignin content and enhancing in vitro dry matter digestibility. Furthermore, the rehydration rate of oat grass treated with HVDP was higher, suggesting minimal structural damage and better retention of the original texture. The ability of HVDP to protect the cellular structure of oat grass during the drying process was validated through infrared spectroscopy, SEM, and TEM analyses. A statistical analysis revealed that 35 kV was the most effective voltage, providing optimal drying performance, nutrient retention, and rehydration capacity.
In summary, HVDP is an advanced, efficient, and energy-saving non-thermal drying technology with broad application potential for modern agricultural products and food processing. This method not only maintains the physical structure of the dried material but also maximises the retention of key nutrients in the dried material, providing an innovative solution for improving the quality and utilisation of oat grass.

Author Contributions

X.W., experiment, methodology, data curation, writing—original manuscript, validation, project administration; Z.S., supervision, project administration, funding acquisition; Z.L. and P.Z. completed a small part of the experiment. All authors have read and agreed to the published version of the manuscript.

Funding

This research was funded by the Innovation and Entrepreneurship Training Program for Chinese College Students (No. S202410128014), National Natural Science Foundations of China (Nos.12265021 and 12365023), Program for Young Talents of Science and Technology in Universities of Inner Mongolia Autonomous Region (No. NJYT23108), Natural Science Foundation of Inner Mongolia (2024MS01001), and the Basic Scientific Research Business Project of the Universities Directly of the Inner Mongolia Autonomous Region (Nos. JY20220057 and JY20240068).

Data Availability Statement

Data are contained within the article.

Conflicts of Interest

The authors declare no conflicts of interest.

Abbreviations

ADair drying
HADhot-air drying
HVDPhigh-voltage discharge plasma
SECspecific energy consumption
SEMscanning electron microscopy
TEMtransmission electron microscopy
RRrehydration rate
ECelectrical conductivity
CPcrude protein
HMhay milk
IVDMDin vitro dry matter digestibility
NFCnon-fibrous carbohydrate
NDFneutral detergent fibre
ADFacid detergent fibre

References

  1. Tang, Y.M.; Qiu, S.N.; Li, Q.Y.; Di, G.L.; Wang, J.L.; Sun, H.X. Simulated global climate change benefits the nutritive value of oat grass. Plant Biol. 2022, 24, 846–853. [Google Scholar] [CrossRef]
  2. Ma, Y.; Khan, M.Z.; Liu, Y.; Xiao, J.; Chen, X.; Ji, S.; Cao, Z.; Li, S. Analysis of nutrient composition, rumen degradation characteristics, and feeding value of Chinese rye grass, barley grass, and naked oat straw. Animals 2021, 11, 2486. [Google Scholar] [CrossRef]
  3. An, X.; Zhang, L.; Luo, J.; Zhao, S.; Jiao, T. Effects of oat hay content in diets on nutrient metabolism and the rumen microflora in sheep. Animals 2020, 10, 2341. [Google Scholar] [CrossRef] [PubMed]
  4. Ahmad, M.; Dar, Z.; Habib, M. A review on oat (Avena sativa L.) as a dual-purpose crop. Sci. Res. Essays 2014, 9, 52–59. [Google Scholar]
  5. Morand-Fehr, P.; Fedele, V.; Decandia, M.; Le Frileux, Y. Influence of farming and feeding systems on composition and quality of goat and sheep milk. Small Ruminant Res. 2007, 68, 20–34. [Google Scholar] [CrossRef]
  6. Capstaff, N.M.; Miller, A.J. Improving the yield and nutritional quality of forage crops. Front. Plant Sci. 2018, 9, 535. [Google Scholar] [CrossRef] [PubMed]
  7. Blom, E.; Gentry, W.; Pritchard, R.; Hales, K. Evaluation of inclusion of hay, dampened hay, and silage in receiving diets of newly weaned beef calves. Appl. Anim. Sci. 2020, 36, 367–376. [Google Scholar] [CrossRef]
  8. Caixia, P.; Kuanhu, D. Effect of different harvest time and drying methods on nutrient as water soluble carbon hydrates of herbage. Grassl. China 2002, 24, 32–37. [Google Scholar]
  9. Guo, Z.; Li, C.; Wang, L.; Wang, G.; Wang, Z.; Wang, D. Effects of Triple-Pass Drum Dryer on Enzyme Activity and Quality of Forage Oats. Appl. Eng. Agric. 2022, 38, 637–644. [Google Scholar] [CrossRef]
  10. Pelletier, S.; Tremblay, G.F.; Bertrand, A.; Bélanger, G.; Castonguay, Y.; Michaud, R. Drying procedures affect non-structural carbohydrates and other nutritive value attributes in forage samples. Anim. Feed Sci. Technol. 2010, 157, 139–150. [Google Scholar] [CrossRef]
  11. Weltmann, K.D.; Kolb, J.F.; Holub, M.; Uhrlandt, D.; Šimek, M.; Ostrikov, K.; Hamaguchi, S.; Cvelbar, U.; Černák, M.; Locke, B. The future for plasma science and technology. Plasma Process. Polym. 2019, 16, 1800118. [Google Scholar] [CrossRef]
  12. Ihediwa, V.E.; Akpan, G.E.; Akuwueke, L.; Oriaku, L.; Ndubuisi, C.; Mbanasor, J.; Ndukwu, M.C. Thermal dehydration of some forage grasses for livestock feeding: Effect of different methods on moisture diffusivity and the quality of dried leaves. Energy Nexus 2022, 8, 100156. [Google Scholar] [CrossRef]
  13. Mattioli, S.; Dal Bosco, A.; Castellini, C.; Falcinelli, B.; Sileoni, V.; Marconi, O.; Mancinelli, A.C.; Cotozzolo, E.; Benincasa, P. Effect of heat-and freeze-drying treatments on phytochemical content and fatty acid profile of alfalfa and flax sprouts. J. Sci. Food Agric. 2019, 99, 4029–4035. [Google Scholar] [CrossRef]
  14. Zhang, A.-A.; Ni, J.-B.; Martynenko, A.; Chen, C.; Fang, X.-M.; Ding, C.-J.; Chen, J.; Zhang, J.-W.; Xiao, H.-W. Electrohydrodynamic drying of citrus (Citrus sinensis L.) peel: Comparative evaluation on the physiochemical quality and volatile profiles. Food Chem. 2023, 429, 136832. [Google Scholar] [CrossRef] [PubMed]
  15. Esehaghbeygi, A.; Pirnazari, K.; Sadeghi, M. Quality assessment of electrohydrodynamic and microwave dehydrated banana slices. LWT-Food Sci. Technol. 2014, 55, 565–571. [Google Scholar] [CrossRef]
  16. Sriariyakul, W.; Swasdisevi, T.; Devahastin, S.; Soponronnarit, S. Drying of aloe vera puree using hot air in combination with far-infrared radiation and high-voltage electric field: Drying kinetics, energy consumption and product quality evaluation. Food Bioprod. Process. 2016, 100, 391–400. [Google Scholar] [CrossRef]
  17. Esehaghbeygi, A.; Basiry, M. Electrohydrodynamic (EHD) drying of tomato slices (Lycopersicon esculentum). J. Food Eng. 2011, 104, 628–631. [Google Scholar] [CrossRef]
  18. Yang, M.; Ding, C.; Zhu, J. The drying quality and energy consumption of Chinese wolfberry fruits under electrohydrodynamic system. Int. J. Appl. Electromagn. Mech. 2017, 55, 101–112. [Google Scholar] [CrossRef]
  19. Guo, M.; Qian, Y.; Yuan, J.; Song, Z. Influence of High-Voltage Corona Discharge on Drying Kinetics and Physicochemical Properties of Alfalfa at Various Air-Gap Spacings. Agronomy 2024, 14, 1235. [Google Scholar] [CrossRef]
  20. Elhussein, E.A.A.; Şahin, S. Drying behaviour, effective diffusivity and energy of activation of olive leaves dried by microwave, vacuum and oven drying methods. Heat Mass Transf. 2018, 54, 1901–1911. [Google Scholar] [CrossRef]
  21. Lawrence, A.; Thollander, P.; Andrei, M.; Karlsson, M. Specific energy consumption/use (SEC) in energy management for improving energy efficiency in industry: Meaning, usage and differences. Energies 2019, 12, 247. [Google Scholar] [CrossRef]
  22. Wang, Y.; Ding, C. Effect of Electrohydrodynamic Drying on Drying Characteristics and Physicochemical Properties of Carrot. Foods 2023, 12, 4228. [Google Scholar] [CrossRef]
  23. Hu, W.; Song, Z.; Ma, Q.; Li, B.; Zhang, M.; Ding, C.; Chen, H.; Zhao, S. Study on the Drying Characteristics and Physicochemical Properties of Alfalfa under High-Voltage Discharge Plasma. Agriculture 2024, 14, 1134. [Google Scholar] [CrossRef]
  24. Dumančić, E.; Vojta, L.; Fulgosi, H. Beginners guide to sample preparation techniques for transmission electron microscopy. Period. Biol. 2023, 125, 123–131. [Google Scholar] [CrossRef]
  25. Woodcock, T.; Downey, G.; O’Donnell, C.P. Better quality food and beverages: The role of near infrared spectroscopy. J. Near Infrared Spectrosc. 2008, 16, 1–29. [Google Scholar] [CrossRef]
  26. Jung, S.; Fang, J.; Chadha, T.S.; Biswas, P. Atmospheric pressure plasma corona enhanced by photoionizer for degradation of VOCs. J. Phys. D Appl. Phys. 2018, 51, 445206. [Google Scholar] [CrossRef]
  27. Zhang, J.; Ding, C.; Lu, J.; Zhu, J.; Bai, W.; Guan, P.; Song, Z.; Chen, H. Effect of electrohydrodynamic (EHD) drying on active ingredients, textural properties and moisture distribution of yam (Dioscorea opposita). Food Chem. X 2024, 23, 101622. [Google Scholar] [CrossRef] [PubMed]
  28. Kirschvink-Kobayashi, A.; Kirschvink, J.L. Electrostatic enhancement of industrial drying processes. Ind. Eng. Chem. Process Des. Dev. 1986, 25, 1027–1030. [Google Scholar] [CrossRef]
  29. Han, B.; Ding, C.; Jia, Y.; Wang, H.; Bao, Y.; Zhang, J.; Duan, S.; Song, Z.; Chen, H.; Lu, J. Influence of electrohydrodynamics on the drying characteristics and physicochemical properties of garlic. Food Chem. X 2023, 19, 100818. [Google Scholar] [CrossRef]
  30. Prosapio, V.; Norton, I. Influence of osmotic dehydration pre-treatment on oven drying and freeze drying performance. LWT 2017, 80, 401–408. [Google Scholar] [CrossRef]
  31. Martynenko, A.; Kudra, T. Electrically-induced transport phenomena in EHD drying—A review. Trends Food Sci. Technol. 2016, 54, 63–73. [Google Scholar] [CrossRef]
  32. Paul, A.; Martynenko, A. Electrohydrodynamic drying: Effects on food quality. Dry. Technol. 2021, 39, 1745–1761. [Google Scholar] [CrossRef]
  33. Marques, L.G.; Prado, M.M.; Freire, J.T. Rehydration characteristics of freeze-dried tropical fruits. LWT-Food Sci. Technol. 2009, 42, 1232–1237. [Google Scholar] [CrossRef]
  34. Hu, L.; Bi, J.; Jin, X.; van der Sman, R. Microstructure evolution affecting the rehydration of dried mushrooms during instant controlled pressure drop combined hot air drying (DIC-HA). Innov. Food Sci. Emerg. Technol. 2022, 79, 103056. [Google Scholar] [CrossRef]
  35. Hu, L.; Bi, J.; Jin, X.; Qiu, Y.; Sman, R.v.d. Study on the rehydration quality improvement of shiitake mushroom by combined drying methods. Foods 2021, 10, 769. [Google Scholar] [CrossRef]
  36. Dalvi-Isfahan, M.; Hamdami, N.; Le-Bail, A.; Xanthakis, E. The principles of high voltage electric field and its application in food processing: A review. Food Res. Int. 2016, 89, 48–62. [Google Scholar] [CrossRef] [PubMed]
  37. Jordan, W.; Shouse, P.; Blum, A.; Miller, F.; Monk, R. Environmental physiology of Sorghum. II. Epicuticular wax load and cuticular transpiration 1. Crop Sci. 1984, 24, 1168–1173. [Google Scholar] [CrossRef]
  38. Hanlon, M.; Moorby, J.; McConochie, H.; Foskolos, A. Effects of addition of nutritionally improved straw in dairy cow diets at 2 starch levels. J. Dairy Sci. 2020, 103, 10233–10244. [Google Scholar] [CrossRef]
  39. Wang, L.; Li, Y.-L.; Xiong, H.; Yuan, D.-Y.; Zhang, X.; Zou, F. Effect of temperature stress on leaf structure and photosynthesis of chinquapin (Castanea henryi). Acta Agric. Univ. Jiangxiensis 2020, 42, 692–699. [Google Scholar]
  40. Melser, S.; Lavie, J.; Bénard, G. Mitochondrial degradation and energy metabolism. Biochim. Biophys. Acta (BBA)-Mol. Cell Res. 2015, 1853, 2812–2821. [Google Scholar] [CrossRef]
  41. Lewicki, P.P.; Pawlak, G. Effect of drying on microstructure of plant tissue. Dry. Technol. 2003, 21, 657–683. [Google Scholar] [CrossRef]
  42. Coradi, P.C.; Melo, E.d.C.; Rocha, R.P.d. Evaluation of electrical conductivity as a quality parameter of lemongrass leaves (Cymbopogon citratus Stapf) submitted to drying process. Dry. Technol. 2014, 32, 969–980. [Google Scholar] [CrossRef]
  43. Cameron, K.D.; Teece, M.A.; Smart, L.B. Increased accumulation of cuticular wax and expression of lipid transfer protein in response to periodic drying events in leaves of tree tobacco. Plant Physiol. 2006, 140, 176–183. [Google Scholar] [CrossRef] [PubMed]
  44. Angersbach, A.; Heinz, V.; Knorr, D. Electrophysiological model of intact and processed plant tissues: Cell disintegration criteria. Biotechnol. Prog. 1999, 15, 753–762. [Google Scholar] [CrossRef] [PubMed]
  45. Nogoy, K.M.C.; Sun, B.; Shin, S.; Lee, Y.; Li, X.Z.; Choi, S.H.; Park, S. Fatty acid composition of grain-and grass-fed beef and their nutritional value and health implication. Food Sci. Anim. Resour. 2022, 42, 18. [Google Scholar] [CrossRef]
  46. Narmada, C. Protein Content comparsion between tray dried and oven dried muskmelon (Cucumis Melo). J. Surv. Fish. Sci. 2023, 10, 2580–2592. [Google Scholar]
  47. Grant, K.; Kreyling, J.; Dienstbach, L.F.; Beierkuhnlein, C.; Jentsch, A. Water stress due to increased intra-annual precipitation variability reduced forage yield but raised forage quality of a temperate grassland. Agric. Ecosyst. Environ. 2014, 186, 11–22. [Google Scholar] [CrossRef]
  48. Babu, A.K.; Kumaresan, G.; Raj, V.A.A.; Velraj, R. Review of leaf drying: Mechanism and influencing parameters, drying methods, nutrient preservation, and mathematical models. Renew. Sust. Energ. Rev. 2018, 90, 536–556. [Google Scholar]
  49. Yoo, C.G.; Meng, X.; Pu, Y.; Ragauskas, A.J. The critical role of lignin in lignocellulosic biomass conversion and recent pretreatment strategies: A comprehensive review. Bioresour. Technol. 2020, 301, 122784. [Google Scholar] [CrossRef]
  50. Adjesiwor, A.T.; Islam, M.A.; Zheljazkov, V.D.; Ritten, J.P.; Garcia y Garcia, A. Grass-legume seed mass ratios and nitrogen rates affect forage accumulation, nutritive value, and profitability. Crop Sci. 2017, 57, 2852–2864. [Google Scholar] [CrossRef]
  51. Song, S.; Chen, G.; Guo, C.; Rao, K.; Gao, Y.; Peng, Z.; Zhang, Z.; Bai, X.; Wang, Y.; Wang, B. Effects of exogenous fibrolytic enzyme supplementation to diets with different NFC/NDF ratios on the growth performance, nutrient digestibility and ruminal fermentation in Chinese domesticated black goats. Anim. Feed Sci. Technol. 2018, 236, 170–177. [Google Scholar] [CrossRef]
  52. Bal, M.; Coors, J.; Shaver, R. Impact of the maturity of corn for use as silage in the diets of dairy cows on intake, digestion, and milk production. J. Dairy Sci. 1997, 80, 2497–2503. [Google Scholar] [CrossRef]
  53. Takaki, K.; Hayashi, N.; Wang, D.; Ohshima, T. High-voltage technologies for agriculture and food processing. J. Phys. D Appl. Phys. 2019, 52, 473001. [Google Scholar] [CrossRef]
  54. Li, X.; Wang, Y.; Ma, X.; Li, M.; Kong, D.; Phavady, P.; Wang, Q.; Abdelkader, T.K. Chinese medicinal materials’ drying technologies advancements—Principles, energy performance, and influence on the bioactive components. Dry. Technol. 2024, 42, 1815–1845. [Google Scholar] [CrossRef]
  55. Xiao, A.; Ding, C. Effect of electrohydrodynamic (EHD) on drying kinetics and quality characteristics of shiitake mushroom. Foods 2022, 11, 1303. [Google Scholar] [CrossRef] [PubMed]
  56. Mohsin, G.F.; Schmitt, F.-J.; Kanzler, C.; Epping, J.D.; Flemig, S.; Hornemann, A. Structural characterization of melanoidin formed from d-glucose and l-alanine at different temperatures applying FTIR, NMR, EPR, and MALDI-ToF-MS. Food Chem. 2018, 245, 761–767. [Google Scholar] [CrossRef]
  57. Zhang, S.; Xiong, A.; Pan, Y.; Yu, S.; Jiang, L.; Xiong, B. Near infrared prediction model establishment for conventional nutrient contents of oat grass. Chin. J. Anim. Nutr. 2022, 34, 1334–1342. [Google Scholar]
  58. Akram, K.; Ahn, J.J.; Kwon, J.H. Identification and characterization of gamma-irradiated dried Lentinus edodes using ESR, SEM, and FTIR analyses. J. Food Sci. 2012, 77, C690–C696. [Google Scholar] [PubMed]
  59. Candoğan, K.; Altuntas, E.G.; İğci, N. Authentication and quality assessment of meat products by fourier-transform infrared (FTIR) spectroscopy. Food Eng. Rev. 2021, 13, 66–91. [Google Scholar] [CrossRef]
  60. Tucker, M.P.; Nguyen, Q.A.; Eddy, F.P.; Kadam, K.L.; Gedvilas, L.M.; Webb, J.D. Fourier transform infrared quantitative analysis of sugars and lignin in pretreated softwood solid residues. In Twenty-Second Symposium on Biotechnology for Fuels and Chemicals; Humana Press: Totowa, NJ, USA, 2001; pp. 51–61. [Google Scholar]
Figure 1. HVDP drying system: 1. power supply; 2. control system; 3. oat grass; 4. medium plate; 5. ground electrode; 6. needle electrode.
Agronomy 15 00408 g001
Figure 2. Discharge properties at different voltages: (AD) Voltage and current waveforms; (ad) Lissajous graphs at different drying voltages.
Agronomy 15 00408 g002
Figure 3. SEC of drying by different drying methods (p < 0.05). Different letters show significant differences between sample means.
Agronomy 15 00408 g003
Figure 4. Drying characteristic curves of different drying methods: (a) variation in moisture content with time; (b) variation in drying rate with time; (c) average drying time and average drying rate. Different letters indicate significant differences between sample means.
Agronomy 15 00408 g004
Figure 5. Rehydration rate. Different letters show significant differences between sample means.
Agronomy 15 00408 g005
Figure 6. Scanning electron microscope images of oat leaves treated with different drying methods: (a) HVDP (25 kV); (b) HVDP (30 kV); (c) HVDP (35 kV); (d) HVDP (40 kV); (e) AD; (f) HAD. Arrows indicate the wax layer.
Agronomy 15 00408 g006
Figure 7. Ultrastructural images of oat leaves taken under a transmission electron microscope after drying with different drying methods: (a) HVDP (25 kV); (b) HVDP (30 kV); (c) HVDP (35 kV); (d) HVDP (40 kV); (e) AD; (f) HAD. M: mitochondria; ch: chloroplasts; SG: starch granules.
Agronomy 15 00408 g007
Figure 8. Conductivity under different drying methods. Different letters show significant differences between sample means.
Agronomy 15 00408 g008
Figure 9. Crude protein results. Different letters indicate significant differences between sample means (p < 0.05).
Agronomy 15 00408 g009
Figure 10. Lignin content and in vitro dry matter digestibility. Different letters indicate significant differences between sample means (p < 0.05).
Agronomy 15 00408 g010
Figure 11. (a) Non-fibrous carbohydrates (NFCs), neutral detergent fibre (NDF), and acid detergent fibre (ADF); (b) NFC/NDF. Different letters indicate significant differences between sample means (p < 0.05).
Agronomy 15 00408 g011
Figure 12. Milk yield per ton of oat grass after drying under different drying methods. Different letters indicate significant differences between sample means (p < 0.05).
Agronomy 15 00408 g012
Figure 13. Infrared spectra of oat grass under different drying methods.
Agronomy 15 00408 g013
Figure 14. Statistical analysis: (a) heat map of correlation between drying method and drying index; (b) Pearson correlation coefficient matrix.
Agronomy 15 00408 g014
Disclaimer/Publisher’s Note: The statements, opinions and data contained in all publications are solely those of the individual author(s) and contributor(s) and not of MDPI and/or the editor(s). MDPI and/or the editor(s) disclaim responsibility for any injury to people or property resulting from any ideas, methods, instructions or products referred to in the content.

