Article

The Potential Role of Nitrogen Management in Enhancing Grain Yield and Lodging Resistance of Shanlan Upland Rice (Oryza sativa L.)

1
School of Breeding and Multiplication (Sanya Institute of Breeding and Multiplication), Hainan University, Sanya 572025, China
2
School of Tropical Agriculture and Forestry, Hainan University, Haikou 570100, China
3
Department of Agronomy, Garden Campus, Abdul Wali Khan University, Mardan 23200, Pakistan
*
Author to whom correspondence should be addressed.
These authors contributed equally to this work.
Agronomy 2025, 15(3), 614; https://doi.org/10.3390/agronomy15030614
Submission received: 26 January 2025 / Revised: 17 February 2025 / Accepted: 27 February 2025 / Published: 28 February 2025
(This article belongs to the Section Innovative Cropping Systems)

Abstract

:
As a drought-resistant and water-saving rice (Oryza sativa L.), the Shanlan upland rice germplasm can provide solutions to the food security problems caused by frequent water shortages. In most nitrogen (N) fertilizer management strategies targeting maximum rice yields, lodging (both root and stem) is often ignored. Hence, this study aimed to determine an optimal N fertilizer management strategy that balanced the trade-off between yield and lodging in Shanlan upland rice. Our research employed the “safety factor” (SF) technique to explore the root-lodging resistance (represented by SFr) and stem-lodging resistance (represented by SFs) of Shanlan upland rice using three N fertilizer methods, including conventional N fertilization (CNF), split–postponed N fertilization (SPNF), and controlled-release N fertilizer (CRNF), and three N application rates (80, 120, and 160 kg N ha−1) for two consecutive years. Compared with CNF, the SFr improved by 14.9% for CRNF and 9.1% for SPNF. Likewise, the SFs increased by 22.7% for CRNF and 15.3% for SPNF. Moreover, Shanlan upland rice was found to be more prone to the risk of root lodging than stem lodging. At the same time, the grain yield and net benefit improved by 14.6% and 18.1% for CRNF, respectively, compared with CNF. Hence, employing the CRNF technique was more effective at reducing the lodging risk of Shanlan upland rice. Moreover, increasing the N application rate beyond 120 kg N ha−1 did not significantly increase the grain yield for CRNF but the lodging resistance and net benefit were reduced. In conclusion, with an N application rate of 120 kg N ha−1 for CRNF, Shanlan upland rice could achieve a relatively stable and high net income and can be recommended to growers for adoption.

1. Introduction

Against the backdrop of continued global population growth, increasing food production has become a key issue that needs to be urgently addressed [1,2]. During the last few decades, climate change has intensified the frequency of droughts and reduced water availability for agriculture, posing a major risk to global food security [3,4]. Hence, developing water-saving and drought-resistant crops is pivotal for harnessing the resilience of the current cropping systems. Shanlan upland rice is an aerobic rice type with superior drought tolerance compared with paddy rice and thus requires less water [5,6]. Currently, with the support of crop management and breeding efforts, the yield potential of Shanlan upland rice has significantly improved [7,8,9]. However, in pursuit of maximum yield, the lodging risk of Shanlan upland rice has also substantially risen, placing greater demands on its agronomic practice [10].
Lodging, a key constraint in many agricultural ecosystems, is the permanent displacement of a plant from its vertical position. It is usually caused by a combination of inadequate mechanical support within the plant and damage from adverse environmental factors [11,12]. Lodging can cause a grain yield reduction of up to 80% in rice by inhibiting its photosynthesis and carbohydrate transport [13,14,15]. At the same time, lodging also hinders mechanical harvesting and increases grain-drying requirements and overall production costs, thus significantly reducing the economic benefits of cultivation [15,16]. Therefore, it is imperative to identify management strategies, including fertilizer application, that can efficiently reduce the lodging hazard of Shanlan upland rice while increasing food production. Ironically, lodging often receives little attention in most fertilizer management strategies targeting improved crop productivity [17].
Nitrogen (N) plays a crucial role in the growth and development of rice [18,19,20]. Therefore, the N fertilizer application rate, one of the most significant factors in increasing the yield of Shanlan upland rice, is also among the key reasons affecting lodging [21,22,23]. The greater susceptibility under an elevated N application can be primarily ascribed to the increased fresh weight and plant height [22]. Previous studies have also found that an increase in the N application rate changes the morphological characteristics of rice, such as a decrease in stem thickness and a thinning of stem walls [23,24]. In addition, the existing literature suggests that certain chemical components such as cell-wall cellulose and lignin and structural features like the vascular bundle area also vary with N application rates [25,26]. Due to the changes in these structural and chemical traits, crop physical parameters such as stem-bending strength (Ss), flexural rigidity, and the second moment of area (I) are also influenced, ultimately affecting the crop’s lodging susceptibility [15,27]. Therefore, rationally formulating the amount of N fertilizer applied to a crop is the key to increasing the grain yield and maintaining lodging resistance.
The timing of the N supply is another key factor affecting lodging [16,28]. Globally, many farmers are still accustomed to applying large quantities of N fertilizer during the initial growth stages of a crop [29,30]. The reason is that this fertilization method is more convenient and the applied fertilizer can promote seedling growth. However, this strategy leads to a mismatch in the demand and availability of N to crops and increases the probability of lodging [30,31]. A sole application of the intended N at the initial stage causes crops such as rice to tiller too much during the early stage and results in thinner and weaker stems, rendering the crop more vulnerable to mechanical defects [23]. Previous studies have shown that delaying the application of split N or the use of polymer-coated controlled-release fertilizers can improve crop yield, lodging resistance, N use efficiency, and producers’ profitability due to a better match between the soil’s N supply and crop demand [28,30,32]. However, there is limited research on rice lodging resistance using varied N application rates and fertilizer methods, especially for Shanlan upland rice.
Developing an appropriate N application management strategy can reduce the occurrence of lodging in Shanlan upland rice. The effective implementation of such a strategy must be based on a foundation that can distinguish which type of lodging is more likely to occur (root lodging or stem lodging) [11,33,34]. Although the occurrence of these two types of lodging is interdependent, their underlying lodging mechanisms are quite different. Previous studies have shown that root lodging refers to the straight tilting of the plant caused by the destruction of the root–soil anchoring system or the displacement of the root system in the soil. On the other hand, stem lodging is mainly caused by the bending and breaking of the internodes at the base of the plant due to the influence of mechanical properties such as the stem diameter, bending strength, and stem fullness [35,36]. As N fertilizer methods and N application rates affect stem bending (breaking) and root anchorage failure differently, it is important to distinguish their response characteristics to lodging. To our knowledge, no study has simultaneously evaluated the response of Shanlan upland rice root and stem lodgings to N fertilizer. Therefore, the study was planned to (1) clarify the impacts of different N application techniques on the lodging resistance of Shanlan upland rice; (2) differentiate the sensitivity of root-lodging and stem-lodging resistance; and (3) explore the optimal N application rate for rice by considering both yield and lodging resistance.

2. Materials and Methods

2.1. Experimental Site

The field trials were carried out in Qiongzhong, Hainan Province, China (18°88′ N, 109°82′ E). Rice was planted over two seasons from 2023 to 2024. Meteorological data during the growing seasons were collected from an adjoining weather station and are shown in Figure S1. The chemical attributes of the topsoil (0–20 cm depth) from the experimental field are presented in Table S1.

2.2. Experimental Design and Crop Management

The experiment comprised a factorial arrangement of three N fertilizer methods × three N application rates in a split-plot design, with three replications during two experimental years. The main plot consisted of the following three N fertilizer methods: conventional N fertilization (CNF), with an N pattern of basal fertilizer (50%) and tillering fertilizer (50%); split–postponed N fertilization (SPNF), with an N-splitting pattern of basal fertilizer (30%), a tillering fertilizer (30%), a heading fertilizer (20%), and a flower-keeping fertilizer (20%); and a one-time application of controlled-release N fertilizer (CRNF) of basal fertilizer (100%), with a ratio of 30% conventional urea (46% N content), 10% sulfur-coated urea (44% N content), and 60% resin-coated urea (37% N content). The subplots consisted of three different N application rates, i.e., 80, 120, and 160 kg N ha−1. We also added a zero N treatment (0 kg N ha−1) as a control check (CK). Phosphorus at 100 kg P2O5 ha−1 and potassium at 100 kg K2O ha−1 sourced from superphosphate and potassium chloride were applied at sowing time. The field was divided into 30 m2 plots. In the plots, a ridge was built every 30 cm with a width of 40 cm to collect more soil moisture during the early growth stage of the crop. The seed was directly sown in two rows within the furrows at a sowing rate of 75 kg ha−1. In 2023, the rice seed was directly sown by hand on 6 July and harvested on 3 December. In 2024, the seeds were directly sown by hand on 9 July and harvested on 4 December. Both sowing seasons of the two upland rice crops followed the prior crop (also rice) during the calendar growing season. Insects/pests were rigorously controlled with chemicals to prevent biomass and yield loss. No diseases were observed in any of the experiments. Weeding was carried out manually. Other crop management practices followed the standard recommendations provided by the local agricultural technology extension office.

2.3. Data Recording

2.3.1. Yield-Related Parameters

At the harvest maturity stage, an area of 2 × 2.5 m2 at the center of each plot was manually harvested from each plot to measure the grain yield. The actual yield was measured using an electronic balance scale (MeiLen, MT205, Haidian, China). The moisture content was measured using a portable grain moisture tester (Vicometer, LDS-1G, Zhejiang, China). The yield was adjusted to the grain yield based on a uniform moisture content of 13.5%.
To measure the grain yield parameters, 12 representative hills were randomly reaped at maturity from the central plot. The panicles were counted before separating the plants into straw and panicle components. Then, the panicles were manually threshed and the spikelets were immersed in tap water to separate the filled and unfilled spikelets. Three subsamples, each weighing 30 g, were taken from the respective spikelets to determine the number of filled and unfilled spikelets. Thereafter, the straw, rachis, and filled and unfilled spikelets were oven-dried at 80 °C to record their dry weights. The total shoot biomass was measured as the sum of the dry matter of straw, rachis, and filled and unfilled spikelets. Data on other grain-yield-related attributes, including grain weight, spikelets/panicle, and grain filling (100 × filled spikelet number/total spikelet number), were also recorded. Finally, the harvest index (%) was calculated as the weight of full grain/total aboveground biomass ×100 [15].

2.3.2. Root- and Stem-Lodging-Related Parameters

Root- and stem-lodging tests were performed nearly 10 days before maturity. Eight plants were randomly selected and cut at 0.20 m above the ground. On the left stem portion (Lr; cm) of each plant, the root anchorage strength (Sr; N cm) was determined using a sensitive digital torque screwdriver (Mecmesin, Slinfold, UK) [16]. The plant height (cm), height of the center of gravity for the whole plant (hr; cm), fresh weight (mr; g), and stem diameter were recorded. At the same time, the height of the center of gravity for the stem (hs; cm) and fresh weight excluding the fourth internode (ms; g) were also recorded (Table 1).
The stem-breaking resistance of the fourth internode basal stem segments was assessed with a three-point bending test using a Multitest 2.5-I instrument fitted with a 100 N load cell (Mecmesin, Slinfold, UK). The center of the basal stem, where the breaking resistance was measured, was horizontally aligned with the middle point between the two fulcra with a length (Ls; cm) of 5 cm. The crosshead was then moved and attached to the center point of the basal stem to bend the stem vertically at a rate of approximately 100 mm min−1 until it eventually buckled. The maximum bending force (Fmax; N) was measured for all samples with the help of software. The Ss (N cm) is shown in Table 1 [37]. The lower stem portion was dried in an oven at 80 °C until a constant weight was reached and then the dry weight was recorded. The mass density (mg cm−1) of the basal stem was calculated as the dry weight divided by the length.

2.3.3. Calculation of the Safety Factor

The safety factor (SF) represents the number of times a supporting structure (like roots and stems) can tolerate the bending moment of the plant part it holds. A larger SF value implies that a crop is more resistant to lodging and vice versa. The formulas for the root safety factor (SFr) and stem safety factor (SFs) are SFr = Sr/Mr and SFs = Ss/Ms. A detailed description of calculating the SFr and SFs values and other relevant parameters is provided in Table 1.

2.3.4. Economic Benefits

We also measured the costs and revenue to assess the economic benefits of the tested treatments. The production cost mainly considers expenditure on materials, labor, and equipment. The material cost covers the expenses associated with purchasing seedlings (breeding seeds), chemical fertilizers, irrigation pipelines, and pesticides. Similarly, labor expenditure comprises the labor costs of furrow and ridge constructions, transplanting, fertilization, spraying, harvesting, transportation, etc. Equipment expenditure includes the rental costs for ridge plowing and formation as well as fuel consumption. The unit price of Shanlan upland rice was calculated based on the average price of each purchase, which was CNY 30/kg (Chinese Yuan). Net income was calculated as the difference between the production cost and total income.

2.4. Data Analysis

A three-way analysis of variance (ANOVA) was performed to assess the influence of different levels of N fertilizer methods, N application rates, years and their interactions on yield-associated parameters and lodging-related traits. SAS software (version 9.3; SAS Institute, Cary, NC, USA) was employed for the data analysis. When the results of the ANOVA were significant (p < 0.05), the means of the three N fertilizer methods and three N application rates were compared according to Fisher’s least significant difference test (LSD 0.05). Pearson’s correlations were determined using R software (version 4.0.0; R Core Team, Vienna, Austria). Similarly, Sigma Plot (version 12.5; SYSTAT, San Jose, CA, USA) and R software were used to generate figures. The recorded traits were divided into the following two primary categories: (1) yield-related parameters, and (2) lodging-related parameters. A principal component analysis (PCA) was conducted for each category using R software. Before performing the PCA, the data were checked for normality and homogeneity. The PCA generated ordination diagrams in the form of biplots.

3. Results

3.1. Grain Yield and Yield Components

The ANOVA revealed that the year, N fertilizer method, and N application rate had significant effects on the grain yield and most of the yield-related attributes (Table S2). However, their interactions did not show a significant effect on the grain yield and yield composition. A maximum grain yield of 4.35 t ha−1 was attained from the 160 kg ha−1 N rate for SPNF in 2024 (Table 2). The grain yield increased by 14.6% for CRNF and 18.5% for the SPNF treatment compared with CNF over the two experimental years (Table 2). Similarly, the yield components also increased with the CRNF and SPNF treatments relative to the CNF treatment (except for the thousand-grain weight). The grain yields significantly increased by 59.2% with an increase in the N rate from 0 to 120 kg ha−1. The number of panicles m−2, spikelets/panicle, grain-filling percentage, and aboveground biomass were significantly improved by 12.3%, 25.6%, 12.0%, and 50.1%, respectively, with an increase in the N rate from 0 to 120 kg ha−1 over the two experimental years. Conversely, the N rate did not consistently affect the thousand-grain weight or harvest index.

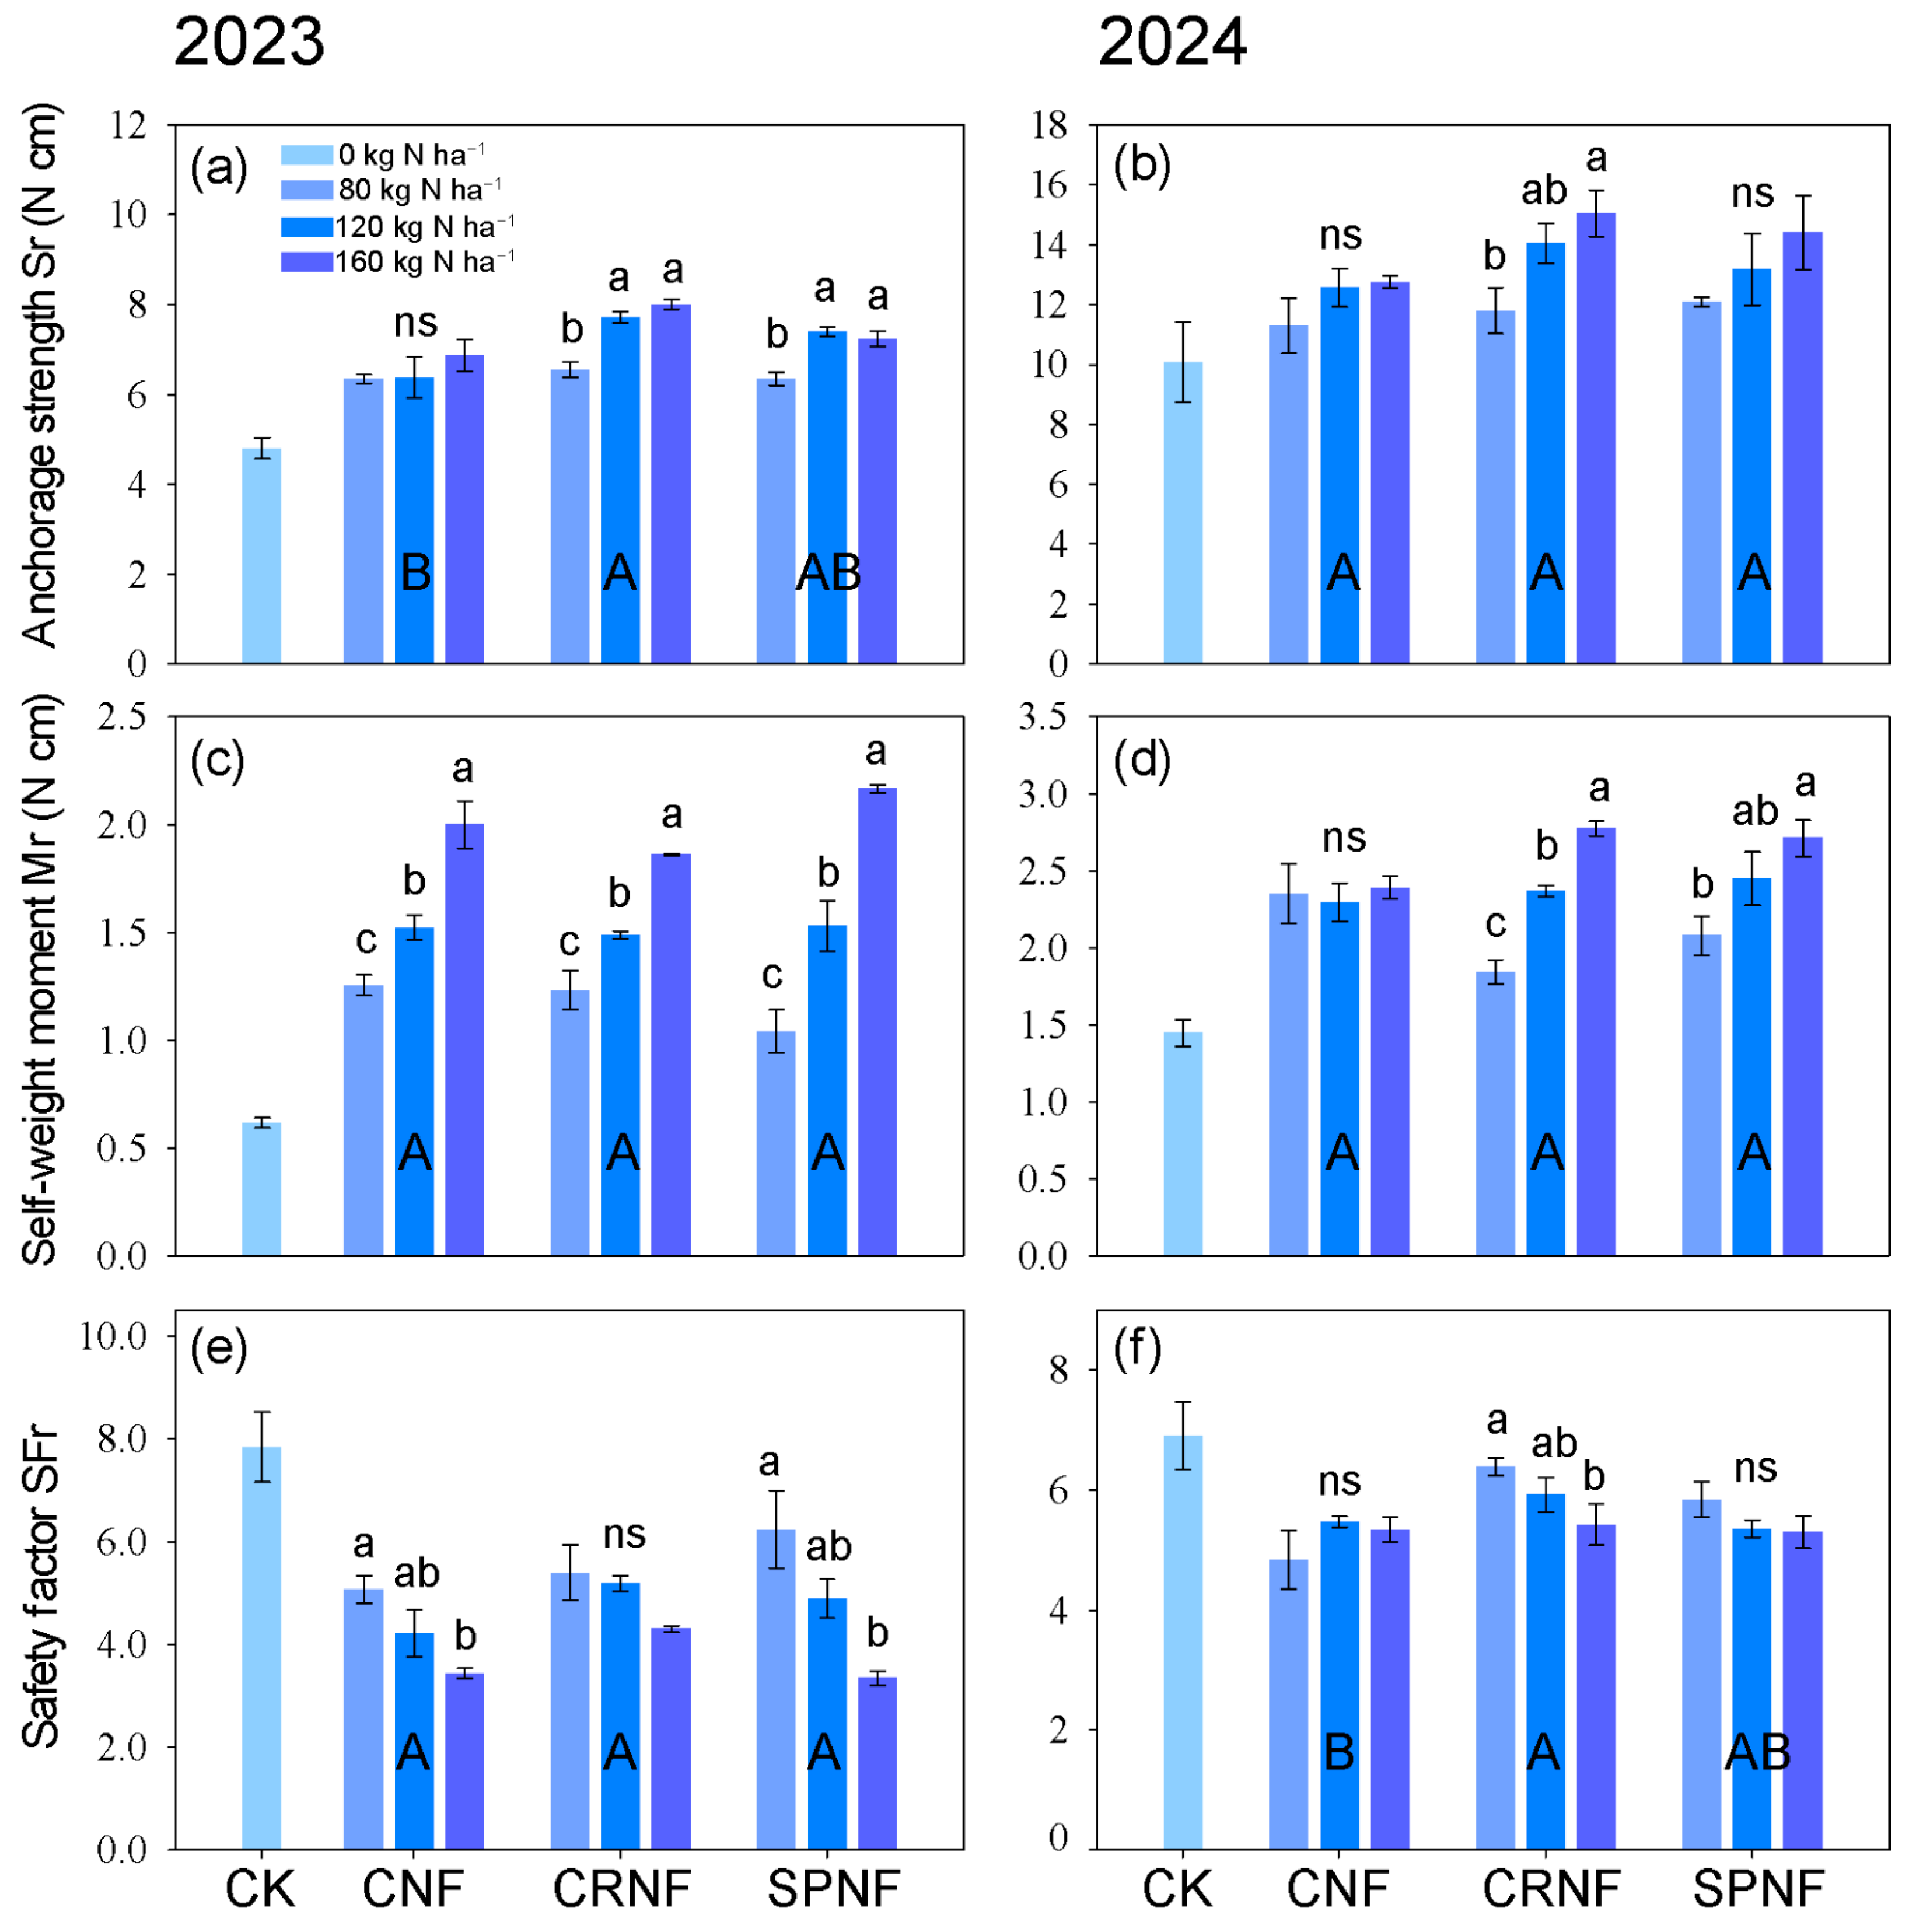
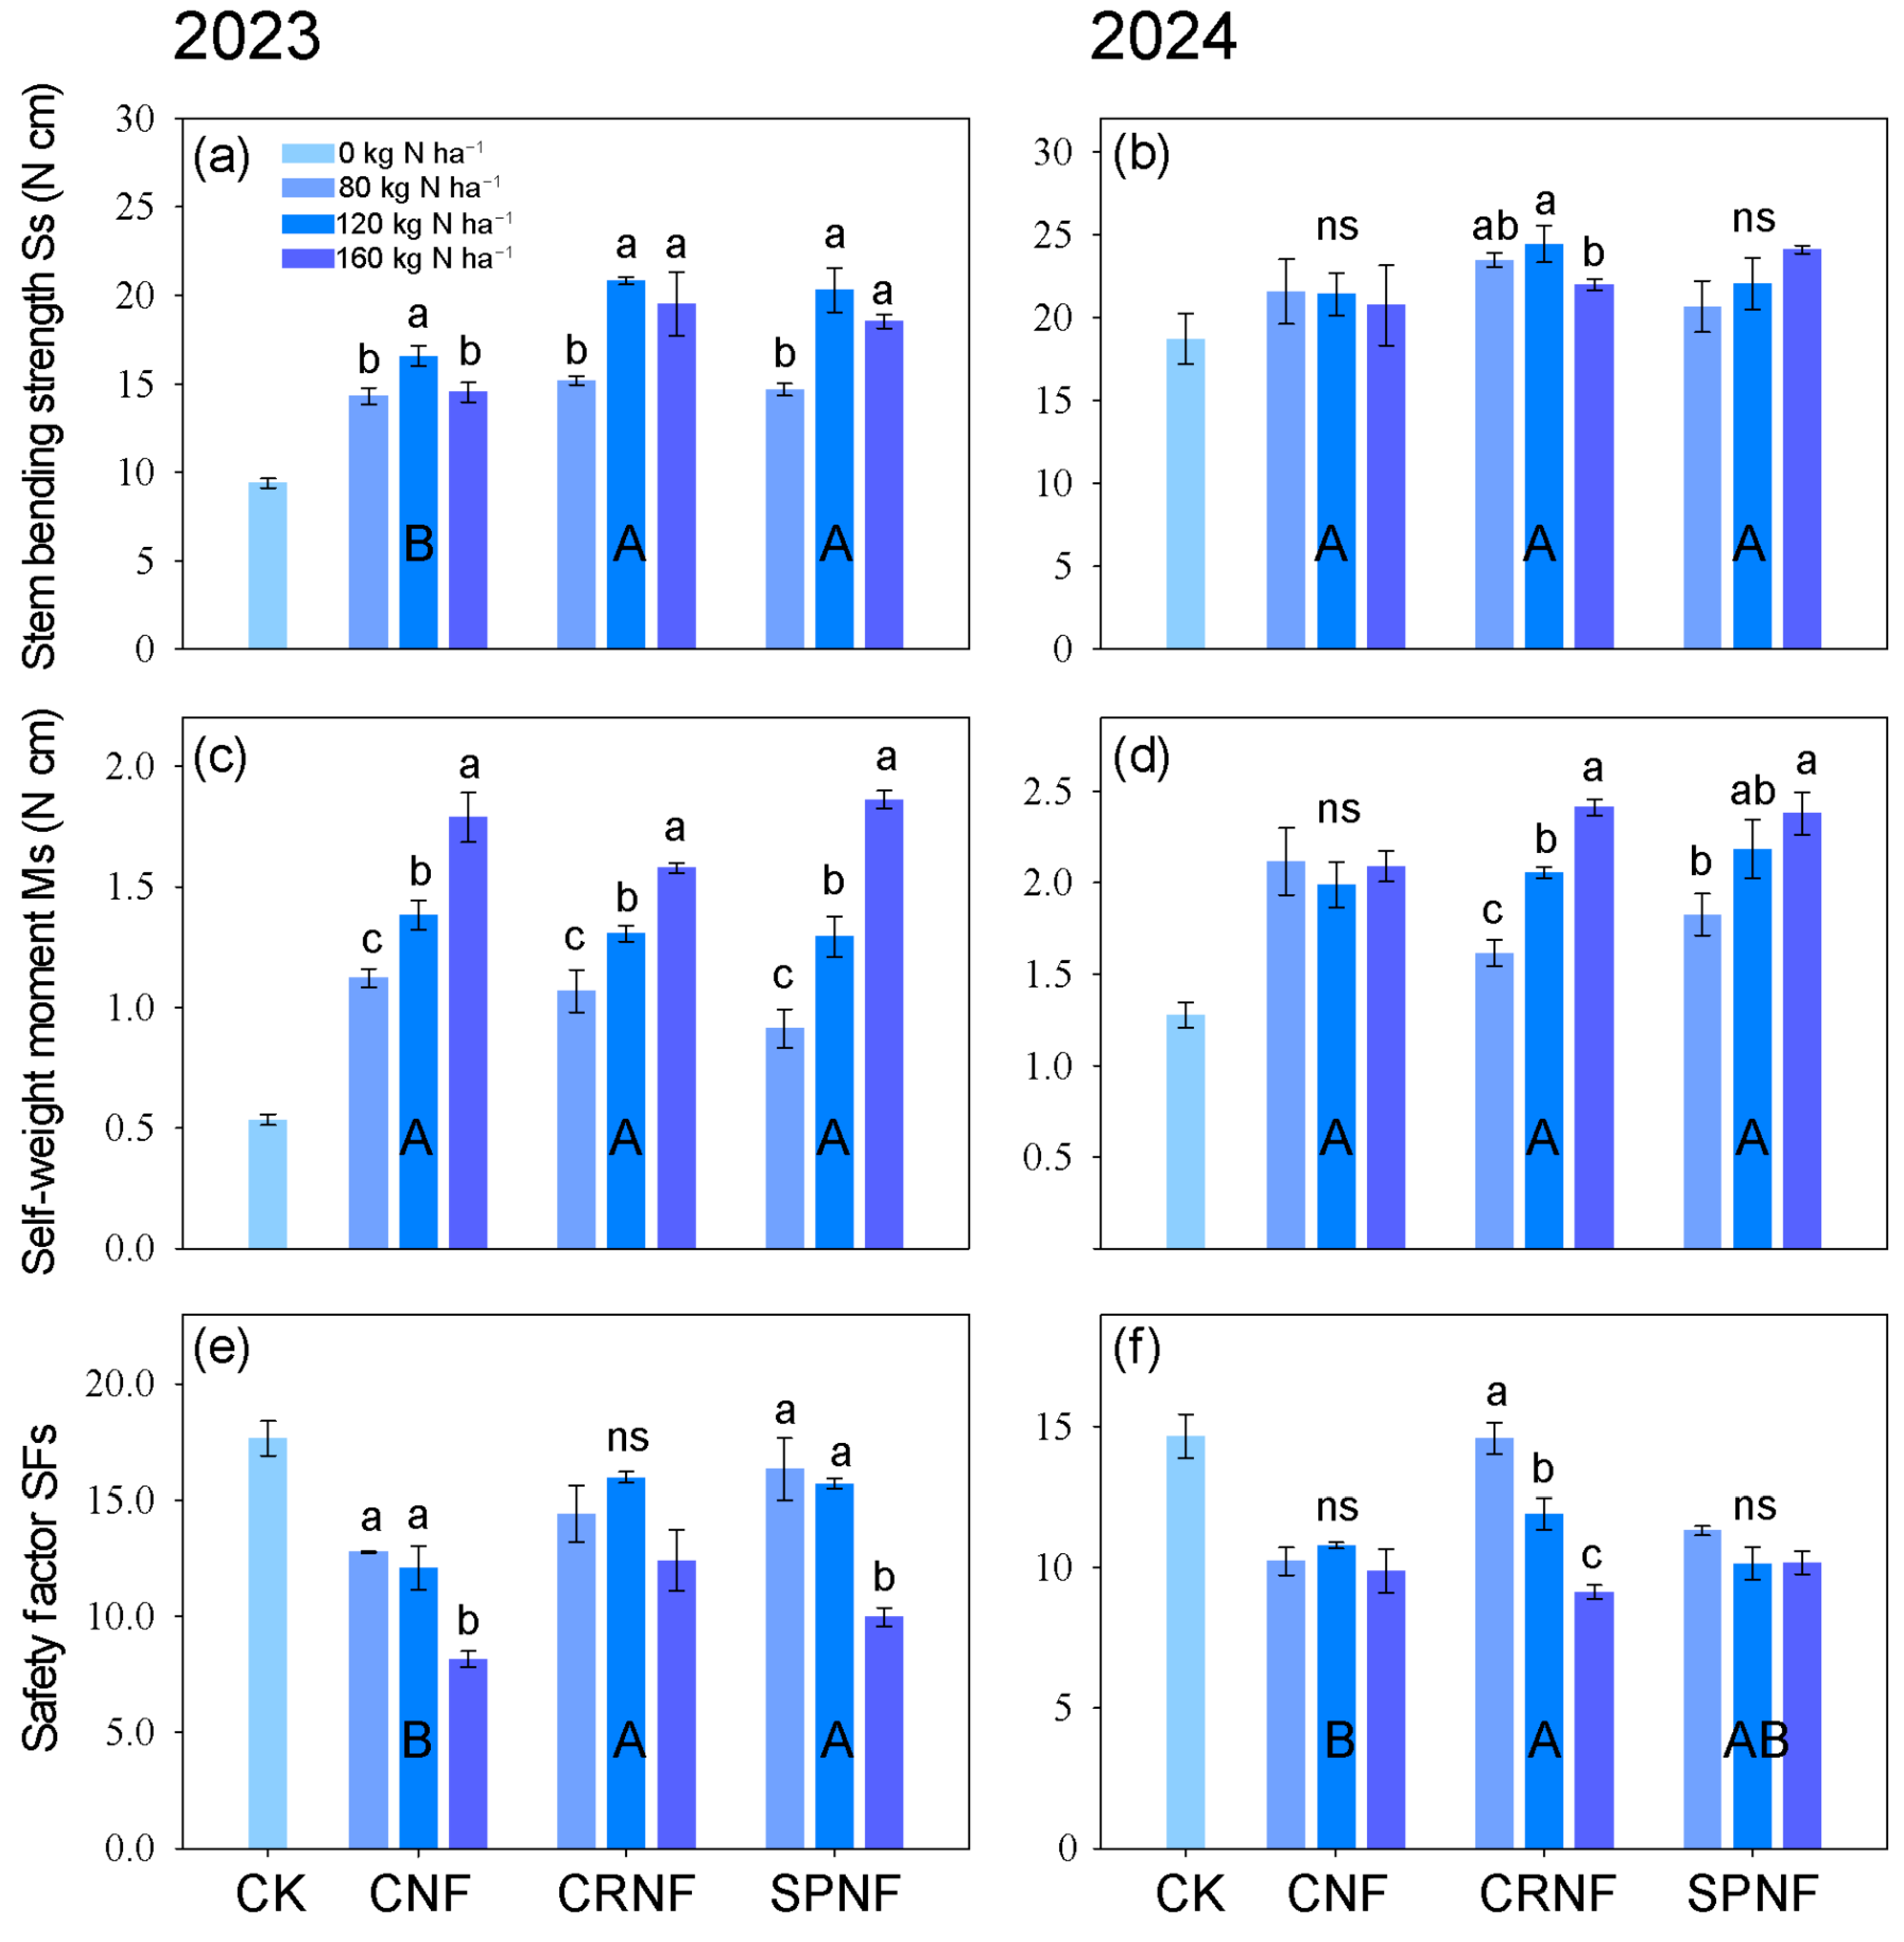
3.2. Comparison of Lodging-Related Parameters

Significant influences for the year, N fertilizer method, and N application rate were observed for lodging resistance (SFr and SFs) and most of the lodging-related parameters (Table S2). Their interactions did not always show a significant influence on most of the SFs, SFr, and lodging-related parameters. A comparison of N fertilizer methods further revealed that CRNF and SPNF always had higher SFr and SFs values than CNF, especially CRNF (Figure 1 and Figure 2; Table 3). This was evident from comparisons of the lodging-related parameters for the three fertilizer methods. The SFr and SFs values for CRNF were 14.9% and 22.7% higher, respectively, while SPNF showed increases of 9.1% and 15.3% compared with CNF, based on the average N rate and data from both experimental years (Figure 1 and Figure 2). The superior lodging resistance of CRNF compared with CNF could be mainly attributed to the greater Sr (12.6%), Ss (14.9%), stem diameter (4.9%), mass density (9.0%), and I (11.0%) and lower Mr (–2.1%), Ms (–4.3%), and hr (–5.9%) when averaged for all three N rates and the two experimental years (Figure 1, Figure 2, and Figure S2; Table 3).
In general, both the SFr and SFs values significantly declined when the N rate increased from zero to 120 kg N ha−1. Conversely, the values of other lodging-related parameters increased with the 120 kg N ha−1 rate, irrespective of the N fertilizer method and experimental year (Figure 1, Figure 2, and Figure S2; Table 3). However, when the N application rate exceeded this rate, the upward trend of most of these parameters was no longer significant and even showed a downward trend. A comparison between the SFr and SFs (representing the root- and stem-lodging susceptibility, respectively) values for the two experimental years is shown in Figure 3. The value of the SFr for both years was much smaller than that of the SFs irrespective of the N rate or fertilizer method, showing a consistently greater risk of root lodging than stem lodging.

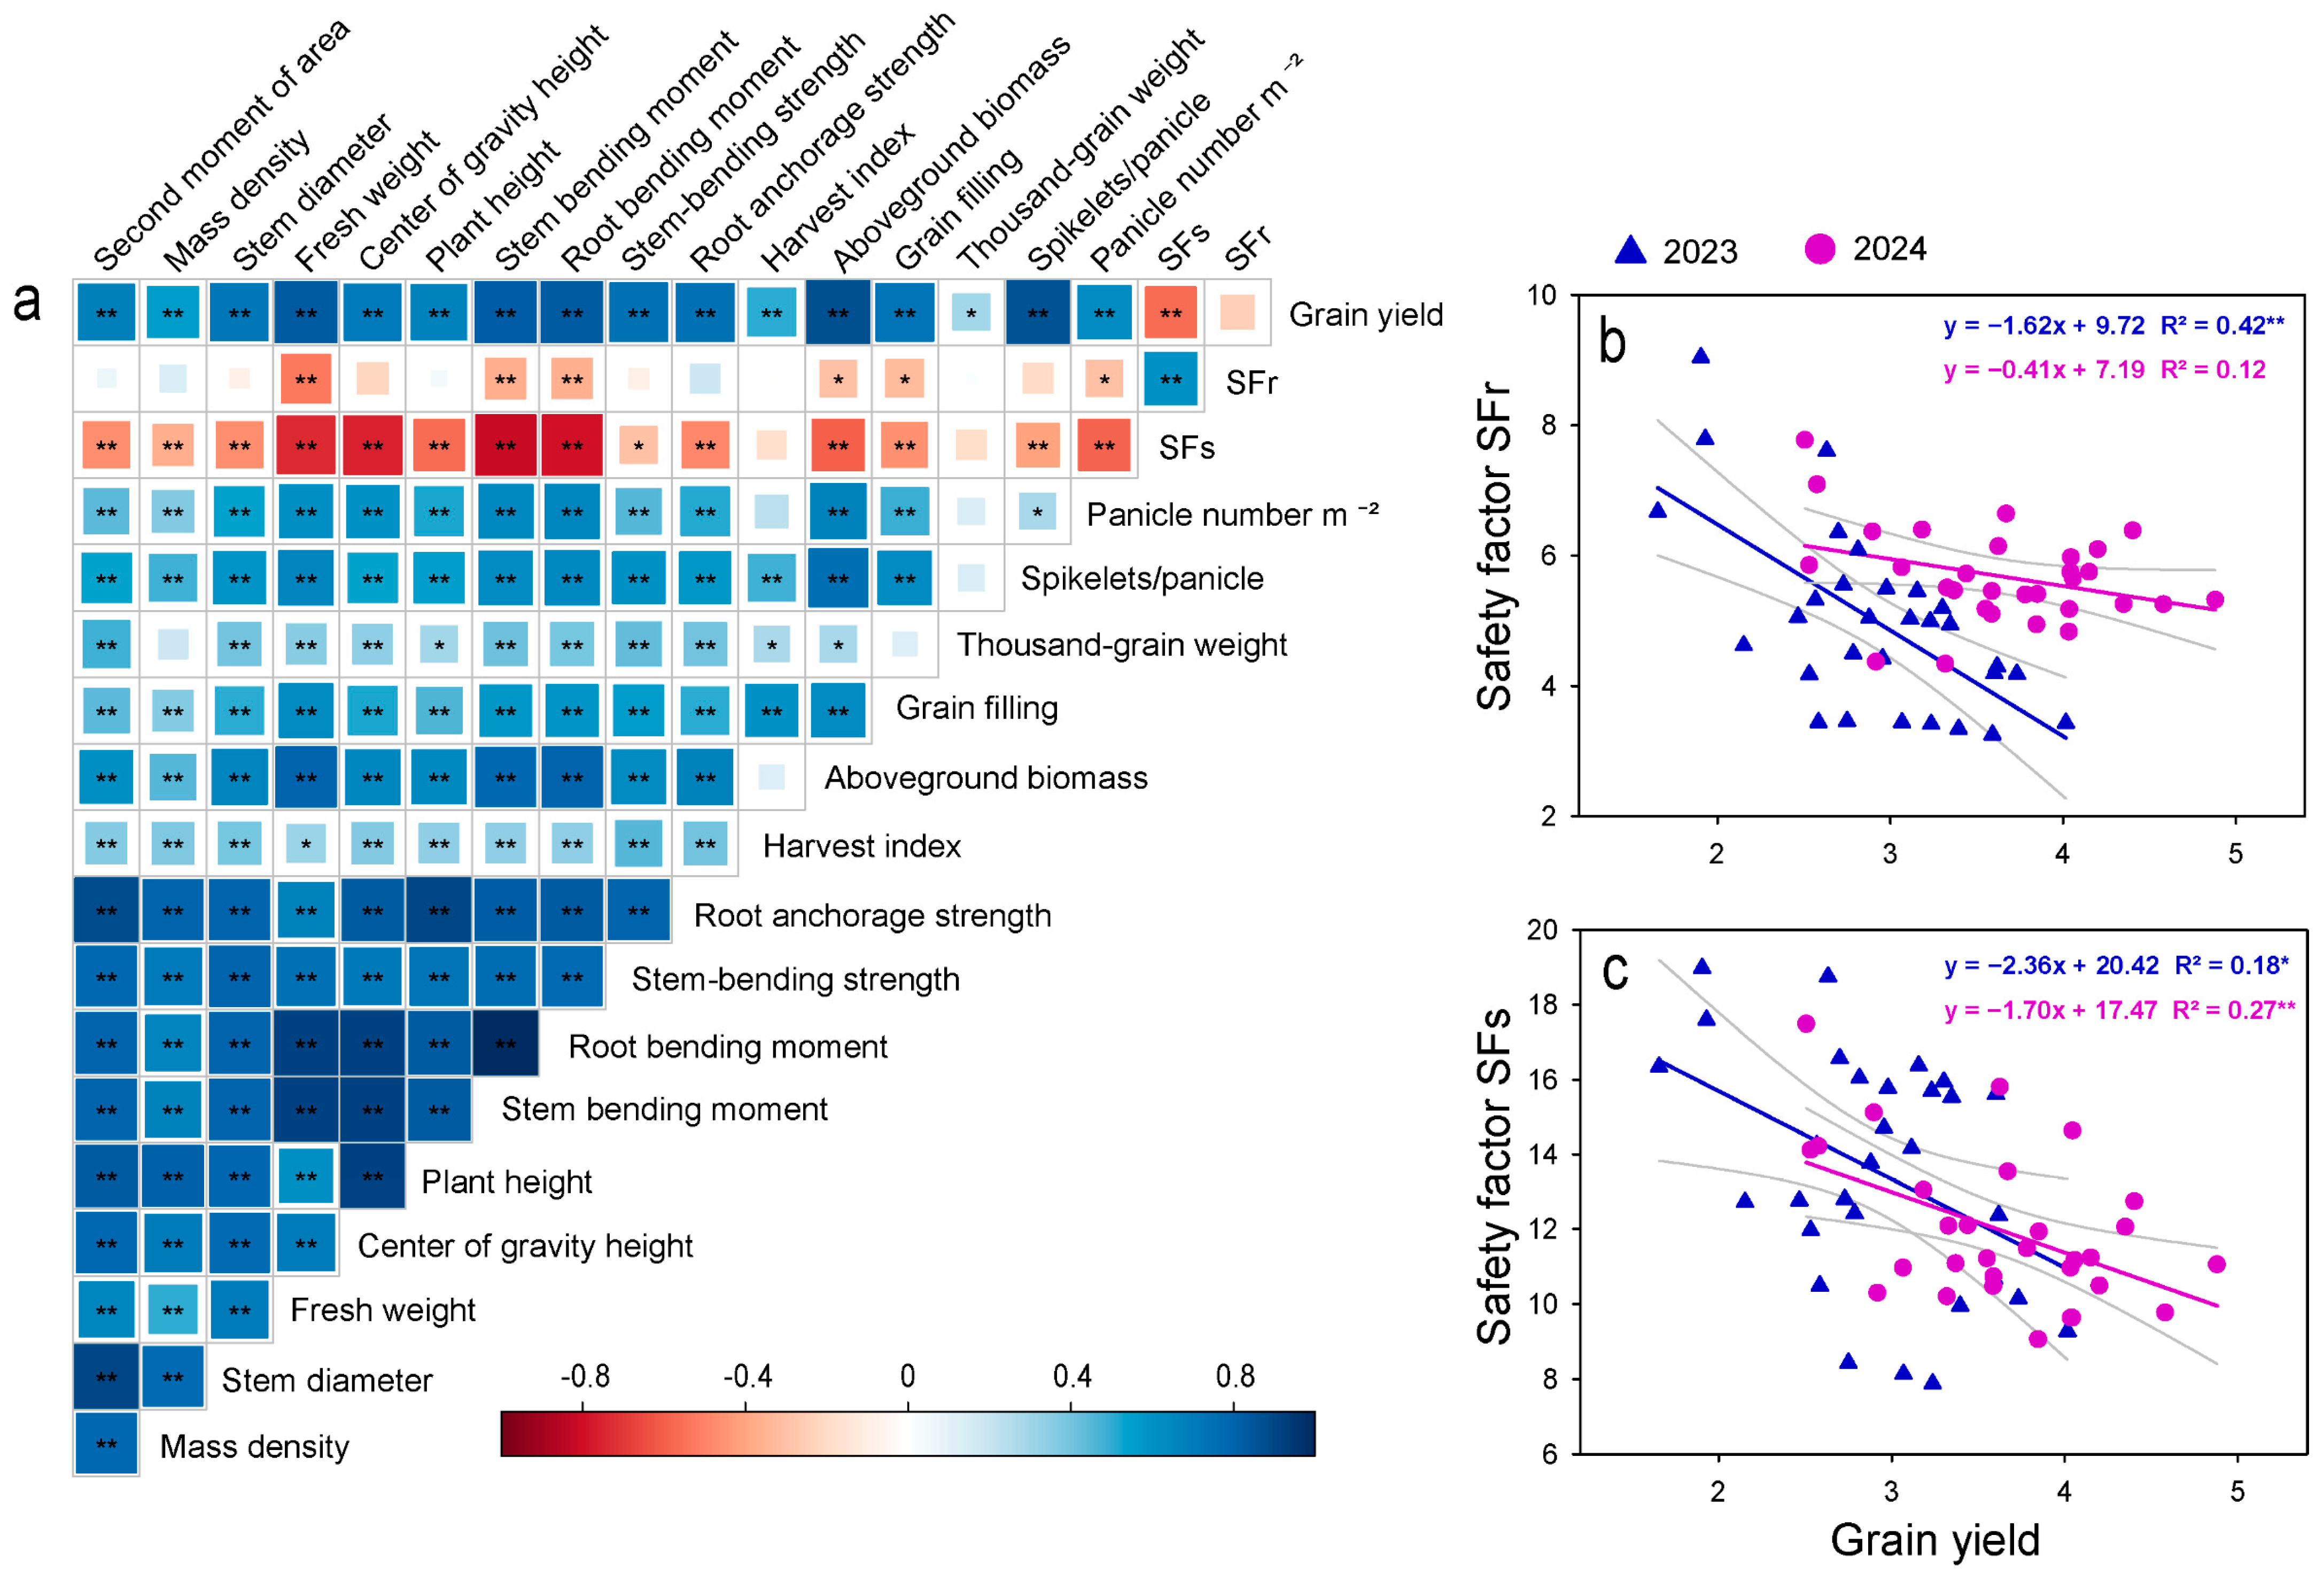
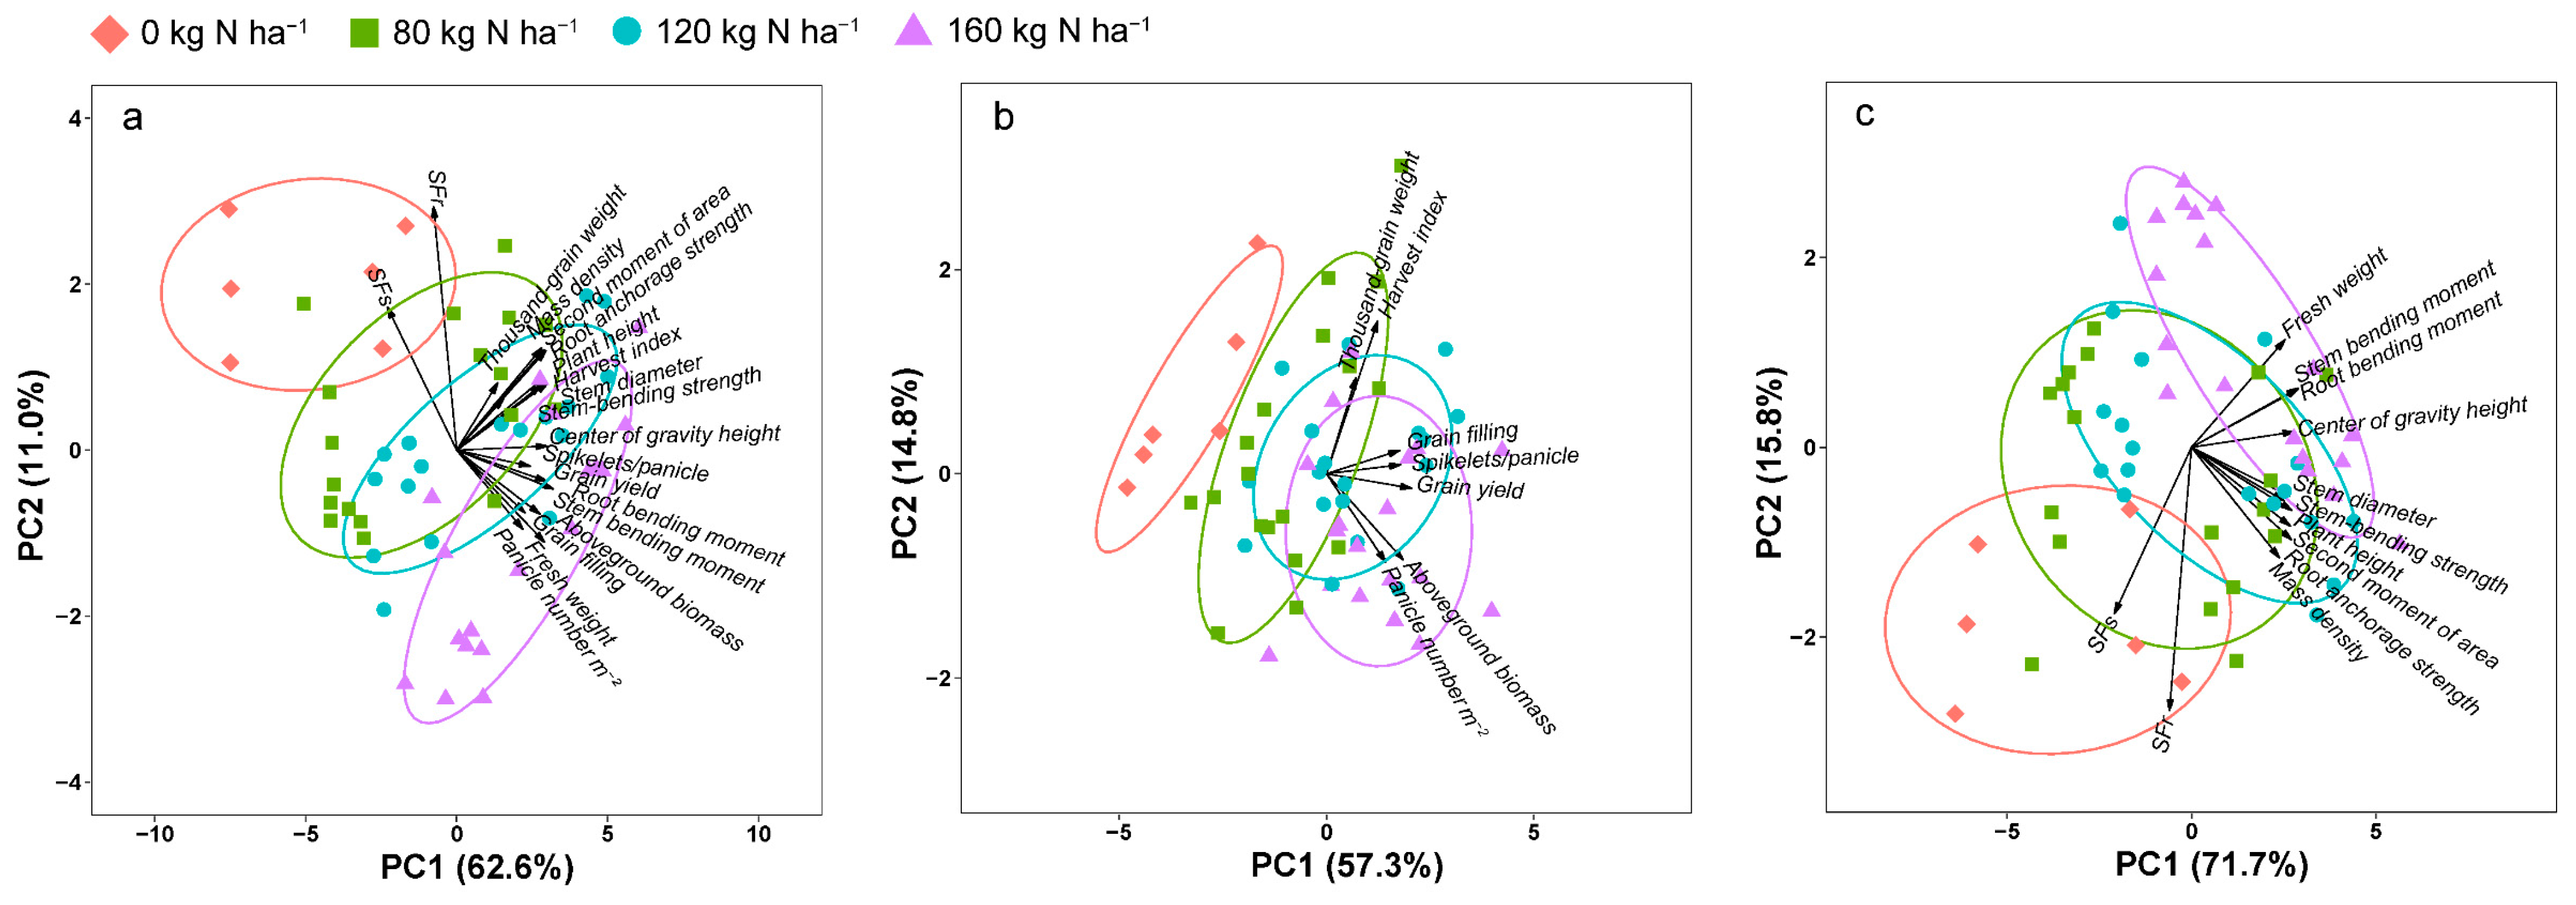
3.3. Pearson’s Correlations and PCA Analyses

Pearson’s correlation analysis showed that the grain yield was negatively related to the SFr (R2 = 0.12–0.42 **) and SFs (R2 = 0.18 *–0.27 **) (Figure 4). The results from the PCA indicated a trade-off between the grain yield and lodging resistance as the arrows for these parameters pointed in opposite directions (Figure 5a). The 24 measured parameters were divided into two groups (yield-related traits and lodging-related traits) and two independent PCA analyses were performed for each group. The first two components explained 72.1% and 87.5% of the variance, respectively (Figure 5b,c). The Pearson’s correlation and PCA further revealed that the grain yield was strongly and positively correlated with the yield components (Figure 4 and Figure 5). Similarly, Sr and Ss depicted a positive and strong correlation with stem diameter, mass density, and I.
All PCA results demonstrated a distinct differentiation among the four N application rates (Figure 5). The higher N rates of 120 and 160 kg N ha−1 were closely grouped and aligned with the positions of the grain yield and yield components. This further indicated that an increase in the N rate improved the yield-related parameters. In addition, they were in the same positions as the Sr, Ss, Mr, and Ms and opposite to the SFr and SFs, indicating that an increase in the N rate led to increases in Ss and Sr but decreases in lodging resistance.

3.4. Economic Analysis

The list of various production inputs using different N fertilizer methods and N application rates is shown in Table S3. The maximum total investment was recorded for the SPNF treatment, which was 13.3% and 26.3% higher than those for CRNF and CNF, respectively. The SPNF model led to a significant increase in total investment, mainly due to the elevated costs of labor/machinery. In this study, the total income was solely derived from the yield value of the harvested rice. The total revenue for the CRNF and SPNF treatments was 14.6% and 18.5% higher, respectively, than the CNF treatment (Figure 6) due to the increase in yield. This relatively higher total income and lower input cost resulted in a maximum net benefit of CNY 45.0 thousand (Chinese Yuan) ha−1 for the CRNF treatment averaged across the two years. This net benefit was 18.1% greater than CNF and 9.7% higher than SPNF (Figure 6). With an increase in the N rate, the total investment, total income, and net profit of Shanlan upland rice also showed an upward trend. Further increasing the N fertilizer beyond 120 kg N ha−1 did not significantly enhance the net profit.

4. Discussion

4.1. Optimizing N Fertilizer Methods to Achieve Maximum Lodging Resistance

An adequate N fertilizer method can effectively reduce the occurrence of lodging [16]. Using controlled-release fertilizers and the strategy of split–postponed N can provide an appropriate amount of N fertilizer during the critical periods of crop growth to meet its nutritional needs [28,30,32]. Our study found that both CRNF and SPNF treatments consistently showed higher lodging resistance (SFr and SFs) than CNF, with CRNF showing the most notable improvement (Figure 1 and Figure 2). Such trends could primarily be explained by the ability of CRNF and SPNF to promote thicker and stronger basal internodes in Shanlan upland rice, lowering the center of gravity downward and avoiding the “top-heavy” phenomenon (internode elongation and cavity enlargement) often associated with excessive N application at the early stage (Figure S2). Both CRNF and SPNF treatments led to larger diameters, greater mass density, and higher I (strongly positively correlated with Ss) along with lower bending moments and center of gravity heights compared with the CNF treatment, thereby enhancing lodging resistance. Previous research also indicated that, compared with a sole N application during the early planting stage, a split N application leads to greater biomass input into the root system, allowing it to explore a larger soil volume and establish stronger Sr characteristics [14,16].
Generally, the lodging resistance of a crop is primarily linked to the biomass distribution between yield- and lodging-related parameters, which maintains a balanced relationship between the two [16]. In our study, there was a negative relationship between the grain yield and lodging resistance (Figure 4). It suggested a trade-off between the grain yield and lodging resistance, and further evidenced the higher SFr and SFs values for CRNF than for SPNF (Figure 1 and Figure 2). A comparative analysis further demonstrated that CRNF prioritized allocating biomass to the mechanical support structures, whereas SPNF directed more biomass toward the grain yield. Consequently, CRNF outperformed SPNF for the mechanical properties, which helped to reduce the likelihood of lodging to some extent. In addition, previous studies have suggested that stem strength and root–soil cone diameter are key selection traits in future breeding programs to increase both the yield performance and lodging resistance [14,16].
As N fertilizer management affects the SFs and SFr differently, it is important to distinguish their response sensitivity to lodging [14,15]. Further analyses revealed that the SFr was consistently smaller than the SFs in our study, indicating that root lodging was more likely to occur than stem lodging (Figure 3). The existing literature shows that rice [15], rapeseed [14], and wheat [31] also show higher sensitivity to root lodging than stem lodging. Therefore, the CRNF method of N application could help Shanlan upland rice to develop a stronger root system, should it be further developed and applied in the future, especially under direct-seeding conditions. This could be a promising technique for direct-sown Shanlan upland rice, which is typically more prone to lodging than transplanted rice due to its shallower root system [38,39]. In addition to the N fertilizer strategy, we also recognize that other elements such as potassium and silicon may play a crucial role in strengthening the stem’s structural integrity, potentially enhancing lodging resistance by regulating cell-wall synthesis in many crop species [14,15]. This observation warrants further investigation for Shanlan upland rice.

4.2. Optimal N Rate for High Yield and Lodging Resistance

After optimizing the N fertilizer method, formulating a reasonable N application rate is crucial to maintain maximum lodging resistance as well as the grain yield [23,25,40]. Our findings revealed that the grain yield was significantly enhanced with an increase in the nitrogen application rate within the range of 0–120 kg N ha−1. This improvement could be attributed to the increase in the panicle number (m−2), spikelets/panicle, grain filling, and aboveground biomass (Table 2). However, the grain yield did not significantly increase when the N application rate was further increased to 160 kg N ha−1, while lodging resistance significantly decreased (Figure 1 and Figure 2). These effects could be explained by the fact that higher N application rates usually negatively influence physical characteristics such as the stem diameter, mass density, and I, thereby reducing lodging resistance (Table 3). Previously, higher N application rates have been reported to reduce lignin and cellulose contents, the area of the vascular bundle, and the thickness of secondary cell walls [23,24]. These properties are crucial for improving the stem’s mechanical strength and lodging resistance [25,26]. The weakening of the above traits reduces Ss, flexural rigidity, and the Young’s modulus, making the crop more susceptible to lodging [27]. In addition, a higher N input also causes an increase in plant height, center of gravity height, and fresh weight, which leads to excessive bending moments and increases the risk of lodging (Figure S2). Therefore, considering lodging resistance, an N application rate of 120 kg N ha−1 can be regarded as an optimal N application rate that achieves a maximum grain yield.

4.3. Effects of Different N Fertilizer Management Strategies on Economic Benefits

Beyond boosting crop yields, evaluating if a specific cropping system is practical and beneficial for local farmers from a socio-economic perspective is also crucial [41]. In this study, the net benefit of CRNF reached the maximum value, exceeding that of CNF and SPNF. This maximum benefit could be attributed to the maximum yield for the CRNF treatment as well as the special nature of this fertilizer (one-time application); thus, labor/machinery costs were reduced (Figure 6). A further exploration of the economic benefits of N application revealed that increasing the N fertilizer application beyond 120 kg N ha−1 did not always bring a net benefit and could decrease the net benefit due to an increase in the input cost. Integrated nutrient management could improve resource-use efficiency and economic returns [42]. Previous studies have shown that if an integrated nutrient management method is successfully used, it not only reduces fertilizer application by 20% but also synergistically increases economic returns by 9% without reducing grain yields [41]. In summary, with an N application rate of 120 kg N ha−1 and CRNF, Shanlan upland rice could achieve a relatively stable and high net income.

5. Conclusions

This study used the SF technique to investigate the sensitivity of Shanlan upland rice to stem and root lodging using different N fertilizer methods and application rates. Both CRNF and SPNF improved the lodging resistance (SFr and SFs) of Shanlan upland rice. These positive effects could be attributed to a timely N supply, which strengthened the basal internodes of the Shanlan upland rice while lowering the center of gravity height. A comparison between root lodging and stem lodging showed that Shanlan upland rice was relatively more prone to root lodging. CRNF showed a greater improvement in root lodging than SPNF, which is crucial for Shanlan upland rice. Among the tested N application rates, 120 kg N ha−1 was the most effective at balancing the trade-off between the grain yield and lodging in Shanlan upland rice. Moreover, among all treatment combinations, an N application rate of 120 kg N ha−1 in combination with CRNF yielded the highest net benefit and can, therefore, be recommended to the grower for adoption.

Supplementary Materials

The following supporting information can be downloaded at https://www.mdpi.com/article/10.3390/agronomy15030614/s1, Table S1: The physicochemical properties of the topsoil (0–20 cm), including soil organic matter (SOM, g kg−1), total N (g kg−1), total P (g kg−1), Olsen-P (mg kg−1), and pH at the beginning of the field experiment in Qiongzhong, Hainan Province, China; Table S2: Analysis of variance (ANOVA) for yield and lodging-related parameters; Table S3: Effects of nitrogen fertilizer methods and application rates on production inputs (CNY ha−1) for Shanlan upland rice; Figure S1: The daily maximum, minimum, and average temperatures and rainfall in 2023 (a) and 2024 (b) at the Shanlan upland rice experimental site in Qiongzhong, Hainan Province, China; Figure S2: Fresh weight (a,b), dry weight (c,d), and plant height (e,f) of the first four internodes of rice from the top as influenced by three nitrogen (N) fertilizer methods (a) and four N application rates over two experimental years, respectively. Transparent dots represent the height of the center of gravity. Vertical bars above mean values indicate the standard error.

Author Contributions

Conceptualization, W.W.; methodology, W.W.; software, J.W., Q.L. and Z.L.; validation, F.S., P.W. and L.X.; formal analysis, Q.L. and L.X.; investigation, J.W., Q.L., P.W. and Q.Y.; resources, Q.Y. and W.W.; data curation, J.W. and Q.L.; writing—original draft preparation, J.W., Q.L., Z.L. and Y.T.; writing—review and editing, F.S., P.W., L.X., Q.Y. and W.W.; project administration, Y.T. and W.W.; funding acquisition, Y.T. All authors have read and agreed to the published version of the manuscript.

Funding

The research was supported by the National Natural Science Foundation of China (32201894) and the Hainan Provincial Natural Science Foundation of China (323QN193).

Data Availability Statement

All data are included in the tables, figures, and supplementary tables.

Conflicts of Interest

The authors declare no conflicts of interest.

References

  1. Tilman, D.; Balzer, C.; Hill, J.; Befort, B.L. Global food demand and the sustainable intensification of agriculture. Proc. Natl. Acad. Sci. USA 2011, 108, 20260–20264. [Google Scholar] [CrossRef] [PubMed]
  2. Food and Agriculture Organization of the United Nations. The Future of Food and Agriculture: Trends and Challenges; FAO: Rome, Italy, 2017; Available online: https://www.fao.org/3/i6583e/i6583e.pdf (accessed on 16 January 2025).
  3. Spracklen, D.V. Global warming: China’s contribution to climate change. Nature 2016, 531, 310–312. [Google Scholar] [CrossRef] [PubMed]
  4. Chaves, M.M.; Oliveira, M.M. Mechanisms underlying plant resilience to water deficits: Prospects for water-saving agriculture. J. Exp. Bot. 2004, 55, 2365–2384. [Google Scholar] [CrossRef]
  5. Yang, G.; Yang, Y.; Guan, Y.; Xu, Z.; Wang, J.; Yun, Y.; Yan, X.; Tang, Q. Genetic Diversity of Shanlan Upland Rice (Oryza sativa L.) and Association Analysis of SSR Markers Linked to Agronomic Traits. BioMed Res. Int. 2021, 1, 7588652. [Google Scholar] [CrossRef]
  6. Zhou, S.; He, L.; Lin, W.; Su, Y.; Liu, Q.; Qu, M.; Xiao, L. Integrative analysis of transcriptome and metabolism reveals potential roles of carbon fixation and photorespiratory metabolism in response to drought in Shanlan upland rice. BMC Genom. 2022, 23, 862. [Google Scholar] [CrossRef]
  7. Crusciol, C.A.C.; Soratto, R.P.; Nascente, A.S.; Arf, O. Root Distribution, Nutrient Uptake, and Yield of Two Upland Rice Cultivars under Two Water Regimes. Agron. J. 2013, 105, 237–247. [Google Scholar] [CrossRef]
  8. Fageria, N.K.; Moreira, A.; Coelho, A.M. Yield and yield components of upland rice as influenced by nitrogen sources. J. Plant Nutr. 2011, 34, 361–370. [Google Scholar] [CrossRef]
  9. Zhang, Y.; Liu, G.; Huang, W.; Xu, J.; Cheng, Y.; Wang, C.; Zhu, T.; Yang, J. Effects of irrigation regimes on yield and quality of upland rice and paddy rice and their interaction with nitrogen rates. Agric. Water Manag. 2020, 241, 106344. [Google Scholar] [CrossRef]
  10. Liao, P.; Bell, S.M.; Chen, L.; Huang, S.; Wang, H.; Miao, J.; Qi, Y.; Sun, Y.; Liao, B.; Zeng, Y.; et al. Improving rice grain yield and reducing lodging risk simultaneously: A meta-analysis. Eur. J. Agron. 2023, 143, 126709. [Google Scholar] [CrossRef]
  11. Pinthus, M.J. Lodging in wheat, barley and oats: The phenomenon, its causes and preventative measures. Adv. Agron. 1974, 25, 210–263. [Google Scholar] [CrossRef]
  12. Berry, P.M.; Sterling, M.; Spink, J.H.; Baker, C.J.; Sylvester-Bradley, R.; Mooney, S.J.; Tams, A.R.; Ennos, A.R. Understanding and reducing lodging in cereals. Adv. Agron. 2004, 84, 215–269. [Google Scholar] [CrossRef]
  13. Acreche, M.M.; Slafer, G.A. Lodging yield penalties as affected by breeding in Mediterranean wheats. Field Crops Res. 2011, 122, 40–48. [Google Scholar] [CrossRef]
  14. Wu, W.; Shah, F.; Ma, B.L. Understanding of crop lodging and agronomic strategies to improve the resilience of rapeseed production to climate change. Crop Environ. 2022, 1, 133–144. [Google Scholar] [CrossRef]
  15. Fu, W.; Zhao, Y.; Zha, X.; Ullah, J.; Ye, M.; Shah, F.; Yuan, Q.; Wang, P.; Tao, Y.; Wu, W. The potential role of zinc and silicon in improving grain yield and lodging resistance of rice (Oryza sativa L.). Agronomy 2023, 14, 91. [Google Scholar] [CrossRef]
  16. Wu, W.; Ma, B.L. Understanding the trade–off between lodging resistance and seed yield, and developing some non–destructive methods for predicting crop lodging risk in canola production. Field Crops Res. 2022, 288, 108691. [Google Scholar] [CrossRef]
  17. Hong, W.; Chen, Y.; Huang, S.; Li, Y.; Wang, Z.; Tang, X.; Pan, S.; Tian, H.; Mo, Z. Optimization of nitrogen–silicon (N-Si) fertilization for grain yield and lodging resistance of early-season indica fragrant rice under different planting methods. Eur. J. Agron. 2022, 136, 126508. [Google Scholar] [CrossRef]
  18. Mae, T. Physiological nitrogen efficiency in rice: Nitrogen utilization, photosynthesis, and yield potential. Plant Soil 1997, 196, 201–210. [Google Scholar] [CrossRef]
  19. Zhu, D.; Zhang, H.; Guo, B.; Xu, K.; Dai, Q.; Wei, C.; Wei, H.; Gao, H.; Hu, Y.; Cui, P.; et al. Effect of Nitrogen Management on the Structure and Physicochemical Properties of Rice Starch. J. Agric. Food Chem 2016, 64, 8019–8025. [Google Scholar] [CrossRef]
  20. Spiertz, J.H.J. Nitrogen, sustainable agriculture and food security. A review. Agron. Sustain. Dev. 2010, 30, 43–55. [Google Scholar] [CrossRef]
  21. Wang, F.; Peng, S. Yield potential and nitrogen use efficiency of China’s super rice. J. Integr. Agric. 2017, 16, 1000–1008. [Google Scholar] [CrossRef]
  22. Zhang, Y.; Yu, C.; Lin, J.; Liu, J.; Liu, B.; Wang, J.; Huang, A.; Li, H.; Zhao, T. OsMPH1 regulates plant height and improves grain yield in rice. PLoS ONE 2017, 12, e0180825. [Google Scholar] [CrossRef] [PubMed]
  23. Zhang, W.J.; Li, G.H.; Yang, Y.; Li, Q.; Zhang, J.; Liu, J.Y.; Wang, S.H.; Tang, S.; Ding, Y.F. Effects of nitrogen application rate and ratio on lodging resistance of super rice with different genotypes. J. Integr. Agric. 2014, 13, 63–72. [Google Scholar] [CrossRef]
  24. Islam, M.S.; Peng, S.; Visperas, R.M.; Ereful, N.; Bhuiya, M.S.U.; Julfiquar, A.W. Lodging-related morphological traits of hybrid rice in a tropical irrigated ecosystem. Field Crop Res. 2007, 101, 240–248. [Google Scholar] [CrossRef]
  25. Zhang, W.; Wu, L.; Wu, X.; Ding, Y.; Li, G.; Li, J.; Weng, F.; Liu, Z.; Tang, S.; Ding, C.; et al. Lodging resistance of japonica rice (Oryza Sativa, L.): Morphological and anatomical traits due to top-dressing nitrogen application rates. Rice 2016, 9, 1–11. [Google Scholar] [CrossRef]
  26. Fan, C.; Feng, S.; Huang, J.; Wang, Y.; Wu, L.; Li, X.; Wang, L.; Tu, Y.; Xia, T.; Li, J.; et al. AtCesA8-driven OsSUS3 expression leads to largely enhanced biomass saccharification and lodging resistance by distinctively altering lignocellulose features in rice. Biotechnol. Biofuels 2017, 10, 221. [Google Scholar] [CrossRef]
  27. Sekhon, R.S.; Joyner, C.N.; Ackerman, A.J.; McMahan, C.S.; Cook, D.D.; Robertson, D.J. Stalk bending strength is strongly associated with maize stalk lodging incidence across multiple environments. Field Crops Res. 2020, 249, 107737. [Google Scholar] [CrossRef]
  28. Ma, B.L.; Herath, A.W. Timing and rates of nitrogen fertilizer application on seedyield, quality and nitrogen–use efficiency of canola. Crop Pasture Sci. 2016, 67, 167–180. [Google Scholar] [CrossRef]
  29. Olfs, H.W.; Blankenau, K.; Brentrup, F.; Jasper, J.; Link, A.; Lammel, J. Soil- and plant-based nitrogen-fertilizer recommendations in arable farming. J. Plant Nutr. Soil Sci. 2005, 168, 414–431. [Google Scholar] [CrossRef]
  30. Subedi, K.D.; Ma, B.L.; Xue, A. Planting date and nitrogen amendment effects on grain yield and protein content of spring wheat. Crop Sci. 2007, 47, 36–44. [Google Scholar] [CrossRef]
  31. Ma, B.L.; Biswas, D.K.; Zhou, Q.P.; Ren, C.Z. Comparisons among cultivars of wheat, hulled and hulless oats: Effects of N fertilization on growth and yield. Can. J. Plant Sci. 2012, 92, 1213–1222. [Google Scholar] [CrossRef]
  32. Ohnishi, M.; Horie, T.; Homma, K.; Supapoj, N.; Takano, H.; Yamamoto, S. Nitrogen management and cultivar effects on rice yield and nitrogen use efficiency in Northeast Thailand. Field Crops Res. 1999, 64, 109–120. [Google Scholar] [CrossRef]
  33. Berry, P.M.; Sterling, M.; Baker, C.J.; Spink, J.; Sparkes, D.L. A calibrated model of wheat lodging compared with field measurements. Agric. For. Meteorol. 2003, 119, 167–180. [Google Scholar] [CrossRef]
  34. Van Delden, S.H.; Vos, J.; Ennos, A.R.; Stomph, T.J. Analyzing lodging of the panicle bearing cereal teff (Eragrostis tef). N. Phytol. 2010, 186, 696–707. [Google Scholar] [CrossRef] [PubMed]
  35. Crook, M.J.; Ennos, A.R. Stem and root characteristics associated with lodging resistance in four winter wheat cultivars. J. Agric. Sci. 1994, 123, 167–174. [Google Scholar] [CrossRef]
  36. Ennos, A.R. The mechanics of root anchorage. Adv. Bot. Res. 2004, 33, 133–157. [Google Scholar] [CrossRef]
  37. Goodman, A.M.; Crook, M.J.; Ennos, A.R. Anchorage mechanics of the tap root system of winter-sown oilseed rape (Brassica napus L.). Ann. Bot. 2001, 87, 397–404. [Google Scholar] [CrossRef]
  38. Chen, L.; Yi, Y.; Wang, W.; Zeng, Y.; Tan, X.; Wu, Z.; Chen, X.; Pan, X.; Shi, Q.; Zeng, Y. Innovative furrow ridging fertilization under a mechanical direct seeding system improves the grain yield and lodging resistance of early indica rice in South China. Field Crops Res. 2021, 270, 108184. [Google Scholar] [CrossRef]
  39. Hirano, K.; Ordonio, R.L.; Matsuoka, M. Engineering the lodging resistance mechanism of post-Green Revolution rice to meet future demands. Proc. Jpn. Acad. Ser. B Phys. Biol. Sci. 2017, 93, 220–233. [Google Scholar] [CrossRef]
  40. Corbin, J.; Orlowski, J.; Harrell, D.; Golden, B.; Falconer, L.; Krutz, L.; Gore, J.; Cox, M.; Walker, T. Nitrogen strategy and seeding rate affect rice lodging, yield, and economic returns in the Midsouthern United States. Agron. J. 2016, 108, 1938–1943. [Google Scholar] [CrossRef]
  41. Chen, X.; Cui, Z.; Fan, M.; Vitousek, P.; Zhao, M.; Ma, W.; Wang, Z.; Zhang, W.; Yan, X.; Yang, J.; et al. Producing more grain with lower environmental costs. Nature 2014, 514, 486–489. [Google Scholar] [CrossRef]
  42. Cui, J.; Yan, P.; Wang, X.; Yang, J.; Li, Z.; Yang, X.; Sui, P.; Chen, Y. Integrated assessment of economic and environmental consequences of shifting cropping system from wheat-maize to monocropped maize in the North China plain. J. Clean. Prod. 2018, 193, 524–532. [Google Scholar] [CrossRef]
Figure 1. Anchorage strength (Sr) (a,b), self-weight moment of whole plant (Mr) (c,d), and root safety factor (SFr) (e,f) as affected by various nitrogen (N) application rates using three different N fertilizer methods for two experimental years. CNF: conventional N fertilization; CRNF: controlled-release N fertilizer; SPNF: split–postponed N fertilization. Vertical bars above the mean values indicate the standard error. Means with different small alphabetical letters show significant differences among the various N rates according to LSD0.05. Means with different capital alphabetical letters show significant differences among the three N fertilizer methods according to LSD0.05; ns indicates a non-significant difference (p > 0.05).
Agronomy 15 00614 g001
Figure 2. Stem-bending strength (Ss) (a,b), self-weight moment of stem (Ms) (c,d), and stem safety factor (SFs) (e,f) as affected by various nitrogen (N) application rates using the three different N fertilizer methods over two experimental years. CNF: conventional N fertilization; CRNF: controlled-release N fertilizer; SPNF: split–postponed N fertilization. Vertical bars above the mean values indicate the standard error. Means with different small alphabetical letters show significant differences among the various N rates according to LSD0.05. Means with different capital alphabetical letters show significant differences among the three N fertilizer methods according to LSD0.05; ns indicates a non-significant difference (p > 0.05).
Agronomy 15 00614 g002
Figure 3. A comparison between root and stem lodgings (represented by SFr and SFs) using different nitrogen (N) fertilizer methods (a) and N application rates (b), and their averages over the two experimental years (c). CNF: conventional N fertilization; CRNF: controlled-release N fertilizer; SPNF: split–postponed N fertilization.
Agronomy 15 00614 g003
Figure 4. The Pearson correlations among yield-related parameters and lodging-related parameters are illustrated in a heat map on the left panel (a). Relationships of grain yield with root safety factor (SFr) (b) and stem safety factor (SFs) (c) during the two experimental years are shown in the right panel. ** Significant at p < 0.01, * Significant at p < 0.05.
Agronomy 15 00614 g004
Figure 5. Principal component analysis (PCA) of all explanatory parameters (a), yield-related parameters (b), and lodging-related parameters (c) using different nitrogen application rates over two experimental years.
Agronomy 15 00614 g005
Figure 6. Effect of different nitrogen (N) fertilizer methods and N application rates on total income (a,b) and net benefit (c,d) during the two experimental years. CNF: conventional N fertilization; CRNF: controlled-release N fertilizer; SPNF: split–postponed N fertilization. Vertical bars above mean values indicate the standard error. Means with different small alphabetical letters show significant differences among the N application rates according to LSD0.05. Means with different capital alphabetical letters show significant differences among the three N fertilizer methods according to LSD0.05; ns indicates a non-significant difference (p > 0.05).
Agronomy 15 00614 g006
Table 1. Abbreviations of all parameters related to root and stem lodgings.
AbbreviationUnitFull NameEquationDetailed Explanation
Root-lodging-related parameters
SFrUnitlessSafety factor of the rootSFr = Sr/MrNumber of times a root can withstand the moment of its own weight and the plant organs it supports
SrN cmRoot anchorage strength/Parameter of plant’s resistance to root anchorage failure
MrN cmBending moment of whole plantMr = sin 30° × hr × mr × gSelf-weight moments of the whole plant at 30° from the vertical position
gN kg−1Gravitational acceleration //
hrcmThe height of the
center of gravity for the whole plant
/Distance between the balance point and the base end of the whole plant
mrgFresh weight of the whole plant/Fresh weight of the whole plant, including the basal stem
Stem-lodging-related parameters
SFsUnitlessStem safety factorSFs = Ss/MsNumber of times a stem can withstand the moment of its own weight and the plant organs it supports
SsN cmStem-bending strengthSs = Fmax × Ls/4Maximum bending strength of the basal stem
MsN cmBending moment of stemMs = sin 30° × hs × ms × gSelf-weight moments of the stem at 30° from the vertical position
FmaxNMaximum bending force/Maximum force generated when the basal stem is bending
LscmLength of stem fulcra/Length between the two fulcra when conducting the three-point bending test, set as 5 cm
hscmThe height of the
center of gravity for the stem
/Distance between the balance point and the base end of the basal stem
msgFresh weight of the stem/Fresh weight of the plant without the basal stem
Imm4Second moment of areaI = π × a3 × b/4Geometrical property of the basal internode that reflects how its points are distributed with regard to an arbitrary axis
ammDiameter of the minimum axis/Outer diameter of the minimum axis in an oval cross-section for the basal stem segment near the breaking position
bmmDiameter of the maximum axis/Outer diameter of the maximum axis in an oval cross-section for the basal stem segment near the breaking position
Table 2. Grain yield (t ha−1), panicle number (m−2; no.), spikelets/panicle (no.), thousand-grain weight (g), grain filling (%), aboveground biomass (t ha−1), and harvest index (%) as affected by various nitrogen (N) application rates using three different N fertilizer methods for two experimental years.
N Fertilizer MethodN RateGrain
Yield
Panicle
Number, m−2
Spikelets/PanicleThousand-Grain
Weight
Grain
Filling
Aboveground
Biomass
Harvest
Index
2023
N01.83174.7678.3024.0863.144.7843.50
CNFN802.45b181.43bc88.74a23.93a67.90a5.80b45.00a
N1202.66ab195.24ab88.19a24.56a69.54a6.30b47.48a
N1603.02a213.33a94.10a24.22a72.09a7.05a47.19a
Mean2.71B 196.67A 90.34B24.24A69.84A6.39B46.59A
CRNFN802.68b183.81a94.52a23.89a71.02a6.24b46.79b
N1203.27a198.57a101.18a24.31a73.38a6.93a51.29a
N1603.44a211.43a96.90a24.23a74.00a7.26a50.46ab
Mean3.13A197.94A97.53AB24.14A72.80A6.81AB49.51A
SPNFN802.85b180.48b102.49a23.76a69.82a6.73b45.78a
N1203.27a201.43a99.93a24.36a72.34a7.05b50.39a
N1603.67a206.67a104.88a24.54a74.02a8.12a48.45a
Mean3.26A196.19A102.43A24.22A72.06A7.30A48.21A
2024
N02.54187.5085.6724.6868.495.2052.33
CNFN803.10b197.79a95.73b24.97a71.31a7.20a47.15a
N1203.43ab200.67a104.99ab23.90a73.75a7.77a48.02a
N1603.73a209.34a107.90a24.83a72.55a8.21a49.39a
Mean3.42B202.60A102.88A24.56A72.54A7.73A48.19B
CRNFN803.40b202.39a104.01b24.47a72.60a6.85b54.57a
N1204.08ab208.23a113.85a25.03a75.97a8.67a52.24a
N1604.21a220.84a111.75a24.92a74.44a9.10a50.37a
Mean3.89A210.49A109.87A24.81A74.34A8.21A52.39AB
SPNFN803.49b201.91a103.97a25.24a73.79b7.09b54.84a
N1204.15ab216.75a109.84a24.88a77.24a8.21ab55.76a
N1604.35a214.97a119.40a25.01a74.01b9.49a50.21a
Mean4.00A211.21A111.07A25.05A75.01A8.26A53.61A
CNF: conventional N fertilization; CRNF: controlled-release N fertilizer; SPNF: split–postponed N fertilization. Means with different small alphabetical letters show significant differences among various N application rates according to LSD0.05. Means with different capital alphabetical letters show significant differences among the three N fertilizer methods according to LSD0.05.
Table 3. Plant height (cm), center of gravity height (cm), fresh weight (g), stem diameter (mm), mass density (mg/cm), and second moment of area (mm4) as affected by various nitrogen (N) application rates using three different N fertilizer methods over two experimental years.
N Fertilizer MethodN RatePlant HeightCenter of Gravity HeightFresh WeightStem DiameterMass DensitySecond Moment of Area
2023
N074.3129.674.243.5828.527.26
CNFN8078.95b36.67c6.98a3.63b33.61a7.71b
N12076.05b40.96b7.60ab4.00b35.85a11.30b
N16085.79a47.67a8.56a4.58a35.06a19.52a
Mean80.26A41.76A7.71A4.07A34.84A12.85A
CRNFN8075.73b33.75c7.43a4.10b33.19b12.69b
N12079.32b37.33b8.13a4.36a40.65a16.28a
N16087.51a45.46a8.36a4.26a34.63b14.81a
Mean80.85A38.85A7.98A4.24A36.16A14.59A
SPNFN8073.37b32.13c6.63b4.05a34.99a11.80a
N12079.96ab35.50b8.78a4.33a33.04a14.56a
N16090.52a45.33a9.76a4.32a36.15a14.89a
Mean81.28A37.65A8.39A4.23A34.73A13.75A
2024
N093.2543.676.774.2849.9919.89
CNFN80108.89a52.08a9.21a4.88a53.25a34.62a
N120112.15a53.08a8.83a4.73a55.61a28.24a
N160111.78a54.00a9.04a4.51a47.72a29.01a
Mean110.94A53.06A9.02A4.71A52.19A30.62A
CRNFN80107.03a48.88a7.70c4.64b58.38a24.14c
N120109.27a50.33a9.62b5.35a60.23a44.25a
N160111.69a51.83a10.92a4.93ab57.53a32.56b
Mean109.33A50.35B9.42A4.97A58.72A33.65A
SPNFN80106.28b50.33a8.42b4.71a51.11a29.17a
N120108.83b51.08a9.80ab4.85a56.32a30.91a
N160114.86a53.58a10.32a5.11a64.36a39.29a
Mean109.99A51.67AB9.51A4.89A57.27A33.13A
CNF: conventional N fertilization; CRNF: controlled-release N fertilizer; SPNF: split–postponed N fertilization. Means with different small alphabetical letters show significant differences among the various N application rates according to LSD0.05. Means with different capital alphabetical letters show significant differences among the three N fertilizer methods according to LSD0.05.
Disclaimer/Publisher’s Note: The statements, opinions and data contained in all publications are solely those of the individual author(s) and contributor(s) and not of MDPI and/or the editor(s). MDPI and/or the editor(s) disclaim responsibility for any injury to people or property resulting from any ideas, methods, instructions or products referred to in the content.

