Abstract
Droughts, intensified by climate change and human activities, pose a significant threat to winter wheat cultivation in the Huang-Huai-Hai (HHH) region. Soil moisture drought indices are crucial for monitoring agricultural droughts, while challenges such as data accessibility and soil heterogeneous necessitate the use of numerical simulations for their effective regional-scale applications. The existing simulation methods like physical process models and machine learning (ML) algorithms have limitations: physical models struggle with parameter acquisition at regional scales, while ML algorithms face difficulties in agricultural settings due to the presence of crops. As a more advanced and complex branch of ML, deep learning algorithms face even greater limitations related to crop growth and agricultural management. To address these challenges, this study proposed a novel hybrid monitoring system that merged ML algorithms with a physical process model. Initially, we employed the Random Forest (RF) regression model that integrated multi-source environmental factors to estimate soil moisture prior to the sowing of winter wheat, achieving an average coefficient of determination (R2) of 0.8618, root mean square error (RMSE) of 0.0182 m3 m−3, and mean absolute error (MAE) of 0.0148 m3 m−3 across eight soil depths. The RF regression models provided vital parameters for the operation of the Water Balance model for Winter Wheat (WBWW) at a regional scale, enabling effective drought monitoring and assessments combined with the Soil Moisture Anomaly Percentage Index (SMAPI). Subsequent comparative analyses between the monitoring system-generated results and the actual disaster records during two regional-scale drought events highlighted its efficacy. Finally, we utilized this monitoring system to examine the spatiotemporal variations in drought patterns in the HHH region over the past two decades. The findings revealed an overall intensification of drought conditions in winter wheat, with a decline in average SMAPI at a rate of −0.021% per year. Concurrently, there has been a significant shift in drought patterns, characterized by an increase in both the frequency and extremity of drought events, while the duration and intensity of individual drought events have decreased in a majority of the HHH region. Additionally, we identified the northeastern, western, and southern areas of HHH as areas requiring concentrated attention and targeted intervention strategies. These efforts signify a notable application of multi-source data fusion techniques and the integration of physical process models within a big data context, thereby facilitating effective drought prevention, agricultural management, and mitigation strategies.
1. Introduction
Drought is one of the most pervasive and catastrophic natural disasters that can have significant negative effects on food security, ecosystem health, economic development, societal stability, and overall human well-being [1,2]. In recent years, the combination of climate change and human activities has significantly intensified the frequency, intensity, duration, and geographical spread of drought events [3]. Projections indicate that in many regions around the world, both the intensity and frequency of droughts are likely to increase in the coming decades, potentially resulting in a significant decline in global food production [4,5,6,7,8,9,10]. In China, winter wheat stands as a cornerstone of the country’s food production and is crucial to ensuring national food security [11], with the Huang-Huai-Hai (HHH) region accounting for over 75% of the country’s winter wheat cultivation and contributing more than 80% to national yield [12,13]. However, droughts, especially during the low-precipitation winter and spring months, present a major meteorological threat in this area, severely hampering the growth of winter wheat and leading to both diminished crop yields and reduced quality [14,15]. As temperatures continue to rise and droughts become more frequent, both the vulnerability of winter wheat and the risk to winter wheat production in the HHH region increase [16,17,18], threatening rural economic development and national food security in China [19,20,21]. Given these emerging risks, there is a pressing need for timely, precise drought monitoring strategies that can inform and guide effective disaster prevention and mitigation efforts aimed at safeguarding winter wheat production.
Agricultural drought is primarily defined as an insufficient supply of water to crops, which is mainly a result of inadequate soil moisture levels. This lack of soil moisture hinders crop growth and development, frequently leading to diminished yields or even total crop failures [15,22]. Various meteorological drought indices, such as the standardized precipitation evapotranspiration index (SPEI) [23] and the standardized precipitation index (SPI) [24], are widely utilized in the monitoring of agricultural drought at both the regional and global scales due to their availability and reliability of input data [1,25,26,27,28]. However, these indices primarily assess water conditions from an atmospheric perspective, which may limit their capacity to fully capture the complexities related to the water directly accessible to crops [15,29,30]. Soil moisture serves as a fundamental element for the sustenance of crop life and is integral to the Earth’s hydrological cycle as well as meteorological and climatic processes [31,32]. Accurate information regarding soil moisture content is essential for monitoring and forecasting natural disasters such as droughts, and it also aids in irrigation scheduling, crop yield predictions, and studies related to weather and climate change [31,32]. Furthermore, soil moisture plays a crucial role in regulating the exchange of water and energy between land and the atmosphere, and it significantly impacts chemical and biological processes within the soil [33,34]. Consequently, soil moisture drought indices, such as the Standardized Soil Moisture Index (SSI) [35], Soil Water Deficit Index (SWDI) [36], and the Soil Moisture Anomaly Percentage Index (SMAPI) [37], are considered valuable instruments for identifying and characterizing agricultural drought [27,38,39].
High-resolution soil moisture data, both spatially and temporally, is essential for the calculation of soil moisture drought indices on a regional scale. However, the heterogeneous nature of soil moisture across different locations and times, along with issues related to data accessibility, poses significant challenges to the application of these drought indices at a regional scale [14,29]. While manual measurements are considered the most accurate indicators of soil moisture conditions, they are limited by their coarse spatiotemporal resolution and the labor-intensive nature of the data collection, which restricts their effectiveness for regional applications [40,41]. In recent decades, various soil moisture sensors have been implemented; however, the routine collection of soil moisture data often encounters considerable errors and uncertainties due to systematic biases, complications arising from field management practices, and an insufficient spatial density of site observations [42]. Microwave sensors have been identified as valuable tools for retrieving soil moisture on a regional scale; nevertheless, their effectiveness is limited by the relatively low spatiotemporal resolution of the data they provide, and these sensors primarily capture moisture content within the surface layer of the soil [43]. At present, numerical simulations, bolstered by extensive datasets, constitute the primary approach for achieving continuous and finely gridded soil moisture modeling at regional scales [41,44,45].
Soil moisture numerical simulation models can be mainly categorized into physical process models and statistical models [45,46,47]. Physical process models are well known for their robust physical properties and cost-effectiveness, and they have been widely utilized in studies related to agricultural water dynamics, thereby rendering them appropriate for practical application [48,49,50]. Despite the encouraging potential of these models, their implementation at a regional scale faces significant challenges. One of the main difficulties is the accurate determination of essential parameters that play a critical role in influencing soil moisture dynamics [33,34,51]. In the absence of precise data for these parameters, the reliability and efficacy of the models in simulating moisture dynamics become uncertain, thereby impeding their overall effectiveness. Recently, machine learning (ML), including random forests, support vector machines, and artificial neural networks, have gained popularity for assessing soil moisture conditions due to their capacity to model nonlinear and complex relationships among variables [40,42,45]. These algorithms also benefit from the integration of multiple data sources, such as remote sensing, to retrieve soil moisture information [52,53]. By utilizing meteorological, vegetation, topographic, and historical data related to soil moisture variations, these ML algorithms can provide accurate forecasts of soil moisture over short time frames and provide valuable insight for the scheduling of irrigation [42]. Furthermore, ML algorithms are widely applied for downscaling coarse-resolution satellite-derived products to finer spatial resolutions, thereby enabling their application at the regional scale [54]. As one of the most advanced research areas in the field of machine learning, deep learning (DL) algorithms exhibit enhanced learning capabilities. They can autonomously extract complex features from raw data and capture intricate nonlinear variations in both time and space. These capabilities demonstrate significant potential in the domain of soil moisture prediction [55,56,57]. While ML algorithms significantly advance soil moisture research, they are limited in their ability to clarify the underlying mechanisms and depend heavily on substantial field data to ensure prediction accuracy. Additionally, spatiotemporal heterogeneity—stemming from variations in crop types, growth conditions, and agricultural management practices—can introduce considerable uncertainty in soil moisture simulations, resulting in ML models frequently exhibiting inferior performance compared to physical process models in agricultural settings [51]. Compared to traditional ML algorithms, DL algorithms frequently exhibit reduced robustness when faced with these challenges within agroecosystems, which poses significant obstacles to maintaining the accuracy of soil moisture predictions [58,59]. It is evident that there is a significant complementarity between these two types of simulation methods. Consequently, we aim to enhance soil moisture simulation and drought monitoring through a coupling strategy that integrates ML algorithms with physical process models.
In this study, we aim to achieve the accurate and timely identification of drought conditions and exploration of the variations in spatiotemporal patterns of drought that impact winter wheat in the HHH region. To accomplish this, we have developed a monitoring system that combines ML models with physical process models to obtain soil moisture and SMAPI dynamics. Initially, we developed an ML model multi-source for the fusion of multi-source data to estimate soil moisture prior to the sowing of winter wheat. This estimation enabled the application of the soil hydrodynamic process-driven model for winter wheat, referred to as the Water Balance model for Winter Wheat (WBWW) [60], at the regional scale across various planting years. Following this, the initialized WBWW model was employed to perform continuous calculations of SMAPI throughout the winter wheat growing season in the HHH region, thereby enabling the dynamic monitoring and assessment of regional drought conditions. Ultimately, historical SMAPI data were analyzed to examine the variations in the spatiotemporal patterns of drought over the past two decades. These endeavors represent a significant application of multi-source data fusion methods and physical process model integration in the context of big data. They provide a scientific basis for decision making regarding drought prevention and mitigation while also offering guidance to farmers for the implementation of efficient agricultural irrigation practices.
2. Materials and Methods
2.1. Study Area
The HHH region is predominantly situated within the mid-latitude zone of China’s eastern monsoon climate region, including Beijing, Tianjin, Hebei, Henan, Shandong, Anhui, and Jiangsu provinces (Figure 1). It lies within the warm temperate semi-humid climatic zone, where the average annual air temperature ranges from 11 to 12 °C in the northern part, and from 14 to 15 °C in the southern part [61,62]. Owing to the temperate monsoon climate characteristic of this region, the annual precipitation is relatively low and exhibits significant spatial and temporal variability. Notably, only about 30 to 40% of the annual precipitation occurs during the winter wheat growing season [63], rendering the region particularly vulnerable to the impacts of climate change [14]. The data regarding winter wheat planting areas in the HHH region is derived from a 1 km phenological dataset that includes three major crops in China from 2000 to 2019 [64].
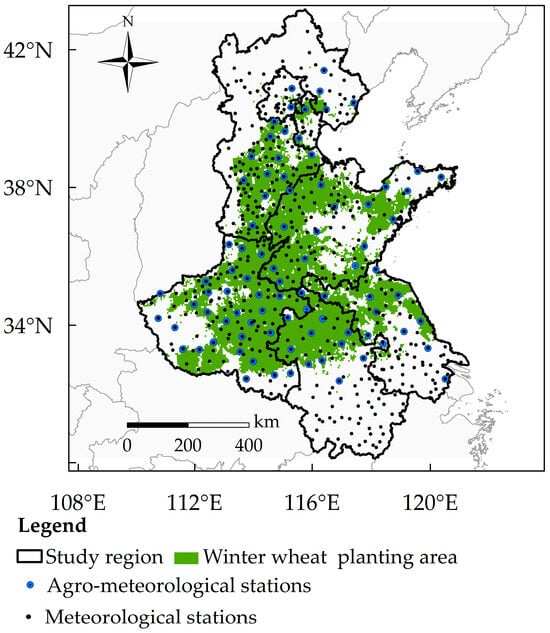
Figure 1.
The location of the Huang-Huai-Hai (HHH) region in China and its agro-meteorological stations and meteorological stations.
2.2. Data
2.2.1. Meteorological Data
The meteorological data utilized in this study was obtained from a total of 579 meteorological stations situated within the HHH region (Figure 1). These data were accessed through the China Meteorological Data Sharing Service System (https://data.cma.cn (accessed on 18 July 2024)) and encompass the time frame from 2010 to 2022. The daily meteorological variables included maximum, minimum, and mean temperature (°C); sunshine duration (h); relative humidity (%) measured at 2 m height; wind speed (m s−1) measured at 10 m height; atmospheric pressure (hPa); and precipitation (mm). To address the presence of missing data values, inverse distance weighting interpolation was utilized, incorporating information from nearby stations.
2.2.2. Soil Moisture Observations Data
Soil moisture data collected prior to the sowing of winter wheat, spanning the years 2010 to 2022, were sourced from a daily soil moisture dataset produced by automatic observation stations. This dataset is made available through the China Meteorological Data Sharing Service System (https://data.cma.cn (accessed on 18 July 2024)). The data are linked to the meteorological stations described in Section 2.2.1. Measurements of soil moisture were conducted at various depths, specifically at 0.1, 0.2, 0.3, 0.4, 0.5, 0.6, 0.8, and 1.0 m.
Soil moisture measurements were carried out using Time Domain Reflectometry (TDR) at automatic observation stations. TDR sensors were installed in representative agricultural fields at predetermined depths (0.1–1.0 m) following a standardized protocol designed to minimize soil disturbance. Each sensor was placed in a vertical borehole to accurately capture soil moisture profiles within the root zone as well as in deeper soil layers. The sensors were connected to a central data logger, which recorded soil moisture readings at hourly intervals. The data logger was equipped with a weatherproof enclosure to protect against environmental factors such as direct sunlight, rain, and extreme temperatures. To ensure data accuracy, regular calibration of the sensors was performed using standard soil moisture samples. Additionally, the data were screened for outliers and inconsistencies using automated algorithms. The raw soil moisture data were processed to remove noise and correct for any systematic error, after which the data were aggregated into a daily average. All the procedures related to data collection, quality control, and data processing were completed prior to the release of the available dataset, thereby ensuring high precision and consistency in the measurements [65].
2.2.3. Soil Physical Properties Data
The soil physical properties data utilized in this study were obtained from the soil properties dataset for land surface modeling of China [66] from the National Tibetan Plateau/Third Pole Environment Data Center (https://data.tpdc.ac.cn/ (accessed on 24 July 2024)). This dataset encompasses various soil physical characteristics, including soil clay content (CL; %), soil sand content (SA; %), soil silt content (SI; %), soil organic matter content (SOM; %), and soil bulk density (BD; g·cm−3). Furthermore, it is possible to derive soil dynamics parameters such as soil saturated water content (; m3·m−3), field capacity (; m3·m−3), wilt point (; m3·m−3), and saturated hydraulic conductivity (; m·day−1) by utilizing Pedotransfer Functions (PTFs) that are based on the aforementioned soil physical properties [67].
2.2.4. Phenological Observations Data
Phenological observations of winter wheat were collected from 87 agro-meteorological stations located in the HHH region (Figure 1), covering the period from 2010 to 2022, through the China Meteorological Data Sharing Service System (https://data.cma.cn (accessed on 24 July 2024)). The phenological phases recorded through manual observation encompass several key dates: sowing, emergence, the three-leaf stage, tillering, overwintering, regreening, jointing, booting, flowering, milky, and maturity. To extrapolate each phenological stage to a regional scale, the inverse distance weighting interpolation was employed.
2.2.5. Remote Sensing Data
The study collected daily aerosol data, along with a 16-day composite normalized difference vegetation index (NDVI) and 16-day enhanced vegetation index (EVI) with a spatial resolution of 500 m, sourced from the MOD13A2 synthetic vegetation index products of the MODIS database (https://lpdaac.usgs.gov (accessed on 23 September 2024)), covering the period from 2000 to 2022.
2.3. Methods
2.3.1. Variable Selection and Data Treatment
Soil moisture, as an essential element of the soil–plant–atmosphere continuum (SPAC), is significantly affected by the intricate interactions among its three components [31,32].
The atmosphere serves as an exchange layer and plays a crucial role in the transfer of energy between the Earth’s surface and its surrounding environment. Various meteorological factors, such as precipitation, relative humidity, air temperature, and wind speed, facilitate this exchange, particularly concerning latent and sensible heat. These factors are instrumental in shaping the dynamics of water energy transfer, which in turn influences fluctuations in soil moisture [45,46,47].
The presence of crops is a significant determinant of energy and water transport in agricultural landscapes. The HHH region is predominantly characterized by a crop rotation system that includes winter wheat and summer maize. Variations in the growth conditions of summer maize can directly impact the variability of soil moisture [68,69]. Crops alter land surface properties through physical processes, thereby modifying soil moisture patterns and enhancing the regulation of water and energy through evapotranspiration [70,71]. The remote sensing vegetation index serves as a vital indicator of the growth status of surface crops prior to the sowing of winter wheat [2,61]. Simultaneously, they can offer indirect insights into irrigation information cross various landscapes and environmental contexts [40,42,43]. The geographic characteristics of cropland, such as geographical coordinates and elevation, significantly contribute to the net energy balance [40].
The physical properties of soil significantly influence the movement, retention, and evaporation of water within the soil, thereby affecting variations in soil moisture [72,73]. For instance, the size of soil particles plays a critical role in determining both water retention and drainage capacities, which in turn alters the vertical distribution of soil moisture. Additionally, the content of organic matter within the soil is a crucial factor; soils with higher organic matter content, such as humic soils, have enhanced water retention capabilities and improved soil structure.
Recent advancements in meteorological big data analysis and multi-source data fusion techniques have facilitated the development of sophisticated models that integrate these various factors [54]. The application of multi-source data and ML models has the potential to enhance the precision of pre-sowing soil moisture estimations in the HHH region. As a result, this study has assembled a comprehensive set of environmental factors that affect soil moisture conditions prior to the sowing of winter wheat. These factors include meteorological conditions, climate data, geographic information, soil characteristics, and the growth status of previous crop rotations (Table 1). Given that the pre-sowing soil moisture conditions are the result of the cumulative effects of complex environmental factors, we also considered the cumulative impacts of various variables when selecting input features for the ML models, resulting in a total of 88 features.

Table 1.
Inputs of machine learning (ML) algorithms used in the study, including meteorological data (MD), planting information (PI), geographical information (GI), soil properties (SPs), and remote sensing data (RSD).
2.3.2. Development of Pre-Sowing Soil Moisture Estimation Model
In this study, we developed multi-source data fusion models to estimate soil moisture levels prior to sowing. These models utilized in situ soil moisture measurements as target labels and various environmental factors as input features. The methodological framework employed is detailed as follows:
Initially, we assembled a label dataset consisting of 1464 records of pre-sowing soil moisture data related to the planting years of winter wheat. These measurements were obtained from automatic soil moisture observation stations and served as the target labels for model fitting. Concurrently, we gathered relevant environmental variables from various data sources to function as input features. By integrating these two datasets, we established a sample dataset for the purposes of model training and evaluation. Specifically, 80% of the total samples were randomly allocated for training, while the remaining 20% were reserved for assessing the model’s predictive accuracy.
The second step involved model selection, as the architecture of the model can significantly influence its simulation capabilities. While DL algorithms theoretically offer the potential for enhanced fitting performance, they may encounter challenges related to overfitting due to the limited scale and dimensionality of the dataset, as well as the complexity and variability inherent in agricultural ecosystems [58,59]. In contrast, traditional ML models typically provide more robust predictions at a lower computational cost [40,45,56], making them more suited to the needs of this study. To achieve optimal simulation accuracy, we examined a wide range of ML algorithms, including both linear and nonlinear regression techniques. The algorithms applied included Decision Tree Regressor (DT), K-Nearest Neighbors Regressor (KNN), Support Vector Regressor (SVR), Multilayer Perceptron Regressor (MLP), Random Forest Regressor (RF), Bootstrap Aggregating Regressor (Bagging), Gradient Boosting Regressor (GdBoost), Adaptive Boosting Regressor (AdaBoost), Extreme Gradient Boosting Regressor (XGBoost), Ridge Regressor (Ridge), and Lasso Regressor (Lasso). The development of these models primarily relied on the scikit-learn package (https://scikit-learn.org/ (accessed on 8 October 2024)) and the XGBoost package (https://pypi.org/project/xgboost/ (accessed on 8 October 2024)).
Thirdly, we identified input features through feature engineering, which is essential for reducing feature dimensionality, enhancing model performance, and mitigating overfitting. To elucidate the significance of the environmental factors influencing pre-sowing soil moisture, we employed the SHapley Additive exPlanations (SHAP) package (https://pypi.org/project/shap/ (accessed on 8 October 2024)). This tool enabled us to interpret the outcomes of the ML models by calculating the Shapley values for each feature, thus revealing its contribution to the prediction results. This approach not only enhanced our understanding of the complex mechanisms within the ML models but also facilitated the construction of the final estimation model for pre-sowing soil moisture [74,75].
Finally, we optimized the hyperparameters of the ML algorithms by employing grid search and cross-validation techniques [40]. This rigorous process ensured that each model achieved optimal performance on the validation set. Consequently, this optimization substantially enhanced improving the overall accuracy and robustness of our pre-sowing soil moisture estimation models, ensuring their reliability and effectiveness in practical applications.
2.3.3. Model Evaluation Metrics
The accuracy of via ML models was evaluated based on three metrics: coefficient of determination (R2), root mean square error (RMSE; m3·m−3), and mean absolute error (MAE; m3·m−3), which are defined as follows:
where is the i-th in situ measurement of soil volumetric water content, is the i-th soil volumetric water content estimated by the ML model, is the total number of observations, and is the average value of in situ measurements of soil volumetric water content.
2.3.4. The Soil Moisture Anomaly Percentage Index
The Soil Moisture Anomaly Percentage Index (SMAPI) (Equation (4)) is a widely utilized agricultural drought index and has been found to exhibit a significant correlation with winter wheat yields [41,76,77]. Notably, the RSMI is distinguished by clearly established thresholds for assessing the grade of drought impacts [78] (Table 2), thereby augmenting its effectiveness in regional evaluations of drought conditions.
where and represent the current value of soil moisture within 0–1.0 m and multi-year average in the same period [41].
Table 2.
Categories of the Soil Moisture Anomaly Percentage Index (SMAPI).
2.3.5. Development of the ML–Physical Process Hybrid Drought Monitoring System
In this study, we developed a hybrid drought monitoring system that combines ML techniques with physics-based models to identify drought conditions and assess drought impacts in winter wheat. Specifically, the ML regression models are employed to determine the regional distribution of soil moisture at various soil depths prior to the sowing of winter wheat. By leveraging ML-based estimations of pre-sowing soil moisture, phenological observation data, and soil dynamic parameters, the WBWW model is utilized to simulate variations in soil moisture distribution across winter wheat fields in the HHH region. It is important to highlight that WBWW has already finalized the calibration of operational parameters at the regional scale utilizing historical data from the HHH region [60]. This hybrid approach subsequently enables the derivation of daily dynamics of the SMAPI, thereby facilitating the dynamic monitoring and impact assessment of drought conditions on winter wheat at a regional scale.
3. Result
3.1. Construction of Pre-Sowing Soil Moisture Estimation Model
3.1.1. Preliminary Selection of Model Architecture
Table 3 presents the average accuracy evaluation metrics for different soil depths obtained from 10-fold cross-validation results. This analysis employed 11 distinct candidate ML regression models, with each model being independently trained and validated at each soil depth based on the training samples. This analysis took into account all 88 environmental factors, thereby comprehensively considering the complex interactions and cumulative effects that influence soil moisture variability.
Table 3.
The average evaluation metrics of different soil depths obtained from a 10-fold cross-validation of candidate estimation models for the pre-sowing soil moisture in winter wheat based on 88 environmental factors as input features.
The findings revealed notable differences in the simulation capabilities among various ML regression models. Specifically, DT and two linear regression models (e.g., Ridge and Lasso) exhibited the poorest performance concerning simulation capability. This suggested that the mechanisms influencing soil moisture variability may be inherently complex, and simpler models may not be suitable for accurately capturing these dynamics. As previous research has highlighted, it is crucial to employ more advanced ML models that can effectively capture these intricate relationships [42,74]. We also included the MLP as representative of DL models. Although its performance showed improvement compared to the aforementioned models, it remained generally suboptimal. This suggested that given the current dataset size, the architecture of the MLP might be overly complex, leading to potential overfitting issues. Conversely, models that achieve a better balance between fitting capability and generalization may be better suited to tackle the challenges encountered in the current simulations.
Among all the models evaluated, the RF model exhibited the most effective performance in modeling the variation in pre-sowing soil moisture. This model achieved an average R2 of 0.84755, RMSE of 0.01861 m3·m−3, and MAE of 0.01526 m3·m−3 in the validation results. These results indicated that the RF model possessed excellent fitting capabilities and robust performance in modeling soil moisture changes. Therefore, the RF model was selected to establish the optimal estimation framework for pre-sowing soil moisture distribution in winter wheat.
3.1.2. Ranking the Importance of Input Features
The variation in pre-sowing soil moisture levels in winter wheat is intricately linked to the multifaceted interactions among various environmental factors, reflecting a cumulative effect over an extended period. Additionally, there exist notable disparities in the processes of water and energy transfer within soils at varying depths. Surface soils serve as the critical interface for the exchange of energy and moisture between the atmosphere and terrestrial ecosystems, rendering them more susceptible to short-term atmospheric and climatic conditions [73,79]. Conversely, deeper soil layers exhibit a reduced influence on external factors, making their moisture more influenced by long-term climatic conditions and shallow groundwater distribution [80,81]. Moreover, variations in crop growth and discrepancies in the physical properties of the soil can significantly affect changes in soil moisture at different depths [46,82]. The intricate interactions observed suggest the presence of distinct mechanisms influencing variations in soil moisture across different depths. In order to identify the critical features for modeling pre-sowing soil moisture at different depths, we employed SHAP values to rank the significance of the features within RF regression models (Figure 2).
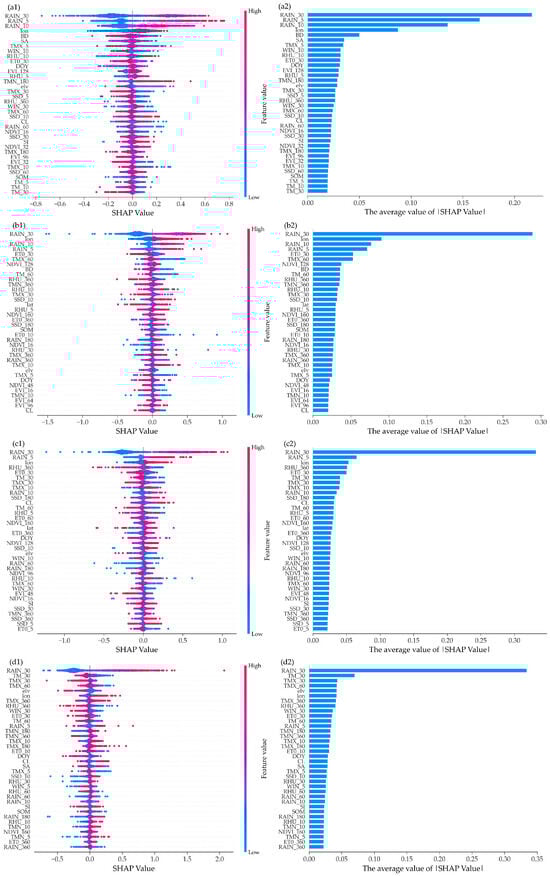

Figure 2.
The importance ranking of the top 36 features in the estimation model for pre-sowing soil moisture, constructed using the Random Forest Regressor (RF) models at soil depths of 0.1 m (a), 0.2 m (b), 0.3 m (c), 0.4 m (d), 0.5 m (e), 0.6 m (f), 0.8 m (g), and 1.0 m (h). (a1–h1) illustrates the distribution of SHAP values of different value variations in inputs across the features. (a2–h2) illustrates the SHAP values ranking of the features within the RF.
The findings demonstrated the significant positive and negative influences of various factors on changes in pre-sowing soil moisture. Across all the soil depths, the cumulative precipitation recorded over the 30 days preceding sowing is the most critical variable. For shallower soil layers, short-term cumulative precipitation (such as over 5 days and 10 days) exhibited a greater degree of importance. In contrast, as soil depth increases, this importance shifts towards the influences of long-term cumulative temperature and other climatic conditions. Soil physical properties also could significantly influence the variation in pre-sowing soil moisture, primarily through two parameters: CL and BD. This heightened importance can be attributed to the fact that CL reflects particle size, while BD serves as an indicator of soil compaction. Soils characterized by smaller particle sizes generally exhibit larger surface areas and enhanced water-holding capacities, thereby maintaining soil moisture content more effectively [72]. As the depth of soil increases, the influence of CL and BD diminishes. The importance of NDVI and EVI was considerably greater in shallower soil layers than in deeper ones. This discrepancy may be attributed to the differing root depths and water requirements of rotation crops, which can lead to differential moisture extraction from the soil profile [83,84]. For example, summer maize predominantly draws water from the uppermost soil layer, and variations in root length density and root water uptake can result in distinct patterns of soil moisture depletion and replenishment [85]. Additionally, geographic characteristics and DOY may inherently reflect local long-term climate conditions and energy transfer levels [40,54]. This could account for the consistently high level of importance across all the soil layers.
By identifying and utilizing these interactions, it becomes possible to investigate the underlying mechanisms that drive changes in soil moisture prior to sowing, thereby enabling the development of more precise estimation models. However, the SHAP values for the majority of the features illustrated in Figure 2 did not exhibit substantial variation. An excessive number of input features could lead to overfitting and diminish the robustness of the models. Consequently, we selected the optimal input features and determined the hyperparameters of the RF regression models through grid search and cross-validation techniques.
3.1.3. Determination of Model Hyperparameters
The setting of hyperparameters in the RF regression model significantly influences both the model’s simulation accuracy and its generalization capability. In this study, the critical parameters selected for examination include the number of features derived from the most important features, the number of base estimators in the RF (n_estimators), the number of samples utilized to train each base estimator (max_samples), the number of features considered for the optimal split (max_features), and the minimum number of samples required at a leaf node (min_samples_leaf) [40]. Figure 3 illustrates the fluctuations in the average accuracy evaluation metrics of RF models at different soil depths. These fluctuations were affected by modifications in hyperparameters, as demonstrated by the results of the 10-fold cross-validation. The three model accuracy evaluation metrics depicted in the figure demonstrate a consistent assessment of the model performance. Specifically, Figure 3a indicates that the inclusion of the top 19 most significant features is essential for constructing the RF models to achieve optimal performance. Figure 3b suggests that utilizing 400 base estimators within the RF framework can enhance performance. Figure 3c presents the max_samples parameter expressed as a ratio, which indicates that training each base estimator with the entirety of the samples can yield optimal performance. Similarly, Figure 3d represents the max_features parameter as a ratio, showing that considering 30% of the input features during each split can lead to optimal results. Figure 3e specified that a split point in the tree will only be considered if there are at least three training samples remaining in both the left and right branches. This parameter could contribute to model smoothness in regression contexts.
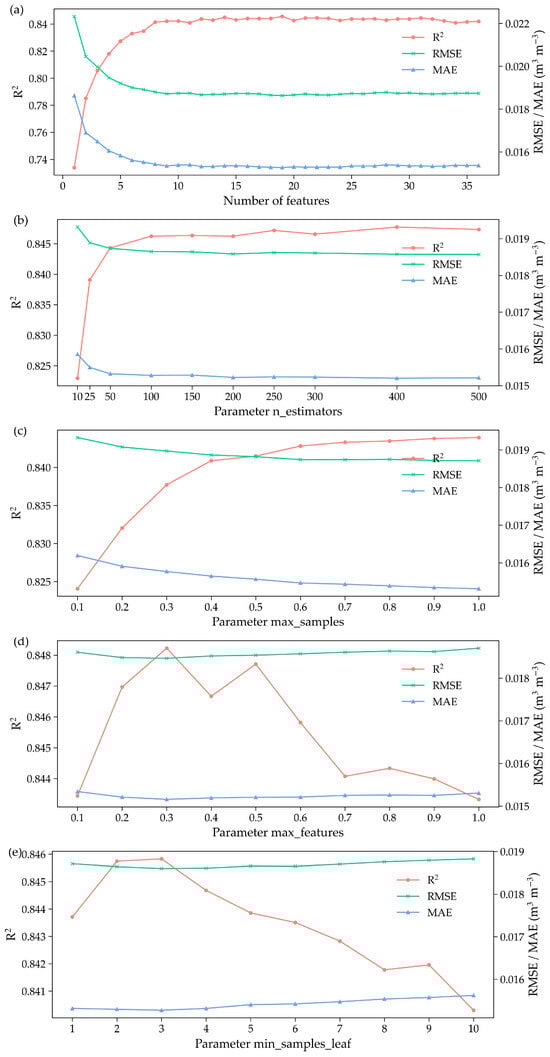
Figure 3.
The average evaluation metrics of the Random Forest Regressor (RF) models obtained from the 10-fold cross-validation with the selected hyperparameters of the number of features (a), the number of base estimators in the forest (n_estimators) (b), the number of samples to train each base estimator (max_samples) (c), the number of features for the best split (max_features) (d), and the minimum number of samples at a leaf node (min_samples_leaf) (e).
3.1.4. Model Validation and Performance Analysis
Based on the identified input features and the established hyperparameters, we constructed a final set of eight RF regression models for pre-sowing soil moisture estimation at varying soil depths. The relationship between the modeled pre-sowing soil moisture and the observed values from the testing dataset was presented in Figure 4, categorized by different soil depths. The RF regression models effectively replicated the pre-sowing soil moisture observed in the winter wheat fields, with an average R2 ranging from 0.8424 to 0.8711, RMSE ranging from 0.0172 to 0.0199 m3·m−3, and MAE ranging from 0.0137 to 0.0167 m3·m−3 at different soil depths. The validation results on the testing dataset demonstrated that the RF regression models achieved a generally acceptable accuracy in estimating soil moisture in the HHH region. Notably, the models performed better for mid-layer soils, while their performance was comparatively lower for both surface and deeper soil layers. This discrepancy can be attributed to the highly dynamic nature of soil moisture in the uppermost layer, specifically within the 0–0.3 m depth. Research indicates that the moisture content in these depths is significantly affected by atmospheric conditions, particularly precipitation and evaporation [86,87]. This rapid dynamic nature significantly often poses significant challenges to the simulation capabilities of the RF models. The moisture dynamics in deeper soils are more influenced by long-term trends rather than short-term fluctuations, leading to more stable and predictable soil moisture conditions [45,78]. Soil moisture at depths of 0.8 and 1.0 m is likely affected by more complex factors, such as groundwater table depth and intricate hydrological processes [81]. Although the soil moisture conditions within these two depths tend to be relatively stable, the RF model may require further enhancement and customization to effectively capture these intricate variations.

Figure 4.
Comparison of modeled pre-sowing soil moisture and in situ observation samples from testing dataset at depths of 0.1 m (a), 0.2 m (b), 0.3 m (c), 0.4 m (d), 0.5 m (e), 0.6 m (f), 0.8 m (g), and 1.0 m (h). The trend lines are shown in red, point density is represented by the color bar, and the 1:1 line is shown as black dash lines.
3.2. Assessment of the Efficacy of the Hybrid Drought Monitoring System
By employing a hybrid drought monitoring system, we successfully captured daily dynamics in the SMAPI throughout the winter wheat growing season in the HHH region, covering multiple planting years from 2000 to 2022. This data retrieval allows for the assessment of historical drought conditions and their impacts on winter wheat production in the HHH region. Prior to conducting further analyses, it is crucial to validate the effectiveness of our newly developed drought monitoring system by comparing its results with actual historical data. This validation is essential to ensure that subsequent analyses yield meaningful insights [2,74]. Accordingly, this study incorporated a comparative analysis of the SMAPI-derived drought evolution processes and the actual historical disaster records, as illustrated in Figure 5. In reconstructing the SMAPI for the period from autumn 2010 to spring 2022, we utilized data derived from training samples. To reduce the potential influence of these training samples on the independence of the evaluation process, the analysis specifically concentrated on drought events occurring from autumn 2000 through spring 2010, thereby establishing a robust validation framework for the drought monitoring system’s efficacy.
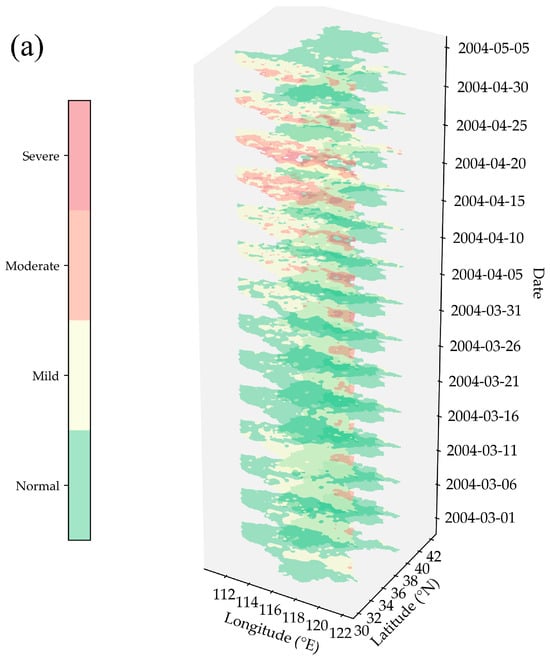
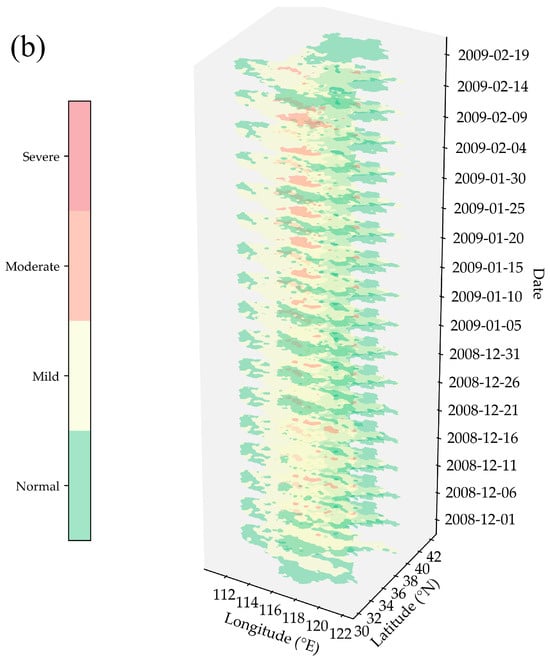
Figure 5.
The spatial evolution of drought identified by the machine learning–physical process hybrid drought monitoring system under rain-fed conditions for typical regional drought processes of Huang-Huai-Hai (HHH) region from 1 March to 5 May 2004 (a) and 1 December 2008 to 19 February 2009 (b).
Drought conditions affecting wheat crops frequently occur during the spring season. The critical water requirement stages for winter wheat occur from March to May, during which the wheat transitions from the jointing to the booting stages [61,88]. This period is characterized by inadequate precipitation and uneven rainfall distribution, which is prone to lead to insufficient soil moisture, thereby negatively affecting the normal growth and yield formation of winter wheat [79,89,90]. A notable instance of regional drought affecting winter wheat was observed between March and May of 2004, serving as a representative spring drought case for evaluating hybrid drought monitoring systems. According to the Yearbook of Meteorological Disasters in China (2005) [91], the majority of areas within the HHH region experienced extended periods of low precipitation and snowfall from 1 March to 24 April 2004. Concurrently, temperatures remained elevated, resulting in decreased soil moisture and an expansion of drought conditions, with some regions classified as experiencing moderate to severe drought, which significantly hindered the growth and development of winter wheat. Following 24 April and into early May, multiple substantial precipitation events occurred in the central and eastern regions of China, leading to a considerable improvement in soil moisture across most areas of HHH and alleviating drought conditions. However, varying degrees of drought persisted in the central portion of the southern HHH region. Figure 5a illustrates the spatial evolution of drought in the HHH region, as identified by the hybrid drought monitoring system, under rain-fed conditions from 1 March to 5 May 2004. The findings indicated that the extent of drought began to expand from 1 March; however, some alleviation was observed in mid to late March, which was corroborated by meteorological data indicating precipitation in the southern part of the HHH region, albeit with overall low rainfall levels. Following late March, the area affected by drought continued to expand, reaching moderate to severe levels in some regions. Beginning on 25 April, a gradual alleviation of drought conditions was noted as a result of precipitation, yet by 5 May, drought impacts were still evident in the central part of the southern HHH region. Overall, the evolution process of this typical spring drought, as deduced from the monitoring system, exhibited a significant consistency with historical records of actual disaster events.
Compared to spring drought, the winter drought experienced by winter wheat may be more complex and challenging to monitor accurately. This is primarily due to the fact that the moisture utilized by winter wheat during the winter months largely originates from the initial soil moisture content at the time of sowing [90,92]. Furthermore, the water requirement for winter wheat growth during its overwintering stage is relatively low [82,93], which suggests that considering only precipitation levels could lead to an overestimation of drought conditions. To robustly assess the efficacy of the hybrid drought monitoring system throughout the entire growth period of winter wheat, we also selected a regional continuous winter drought event that occurred during the winter of 2008–2009 for validation. According to the Yearbook of Meteorological Disasters in China (2010) [94], the winter wheat in the HHH region experienced persistent low precipitation and elevated temperatures, resulting in a sustained drought from December 2008 until mid-February 2009. Notably, the central part of the HHH region faced more devastating drought conditions, causing yellowing, wilting, and even death of some wheat seedlings. In mid-February, widespread precipitation and the implementation of irrigation and other drought mitigation strategies effectively alleviated the drought in the HHH region. Given that this event occurred during the overwintering period, the water demand of winter wheat was limited. Additionally, the favorable meteorological conditions post-regreening stage did not significantly impact yields. Figure 5b illustrates the spatial evolution of drought in the HHH region as identified by the hybrid drought monitoring system under rain-fed conditions from 1 December 2008 to 19 February 2009. The findings indicated that the drought extent began to expand from December 1, with some alleviation observed in late December. Meteorological data confirmed that precipitation occurred in the southern part of the HHH region, albeit at low levels. Beginning in early January, the area affected by drought continued to expand, with some regions reaching moderate drought levels. By 19 February, they indicated a significant alleviation of drought conditions due to precipitation. Overall, the drought events identified by the monitoring system align closely with historical records of actual disaster events. Nevertheless, the current lack of irrigation data limits our analysis to scenarios reliant on rainfall alone, thereby failing to reflect the mitigating effects of irrigation mentioned in the disaster records.
In conclusion, the retrieval of two typical drought evolution processes occurring in different seasons demonstrates that the hybrid drought monitoring system is capable of effectively capturing historical regional drought conditions across various growth phases of winter wheat. This finding provides substantial evidence of the system’s ability to identify drought events affecting winter wheat and to evaluate their impacts in the HHH region.
3.3. Temporal and Spatial Characteristics of Drought in Winter Wheat
To investigate the historical trend and pattern in winter wheat drought, we conducted an analysis of the temporal and spatial variations in the average value SMAPI during the winter wheat growing season in the HHH region from 2001 to 2022 (Figure 6). As illustrated in Figure 6a, the overall trend of the SMAPI during this period exhibited a declining pattern, with a rate of −0.021% per year under rain-fed conditions over the past two decades. This decreasing trend indicated a general, albeit weak, intensification of drought conditions affecting winter wheat. Notably, during the 2010–2011 winter wheat planting year, the SMAPI dropped below −5.0%, signifying an extremely severe drought event. According to the Yearbook of Meteorological Disasters in China (2011) [95], winter wheat in the HHH region experienced multiple instances of varying degrees of drought during the autumn, winter, and spring seasons, with the severity of these conditions being historically unprecedented. Consequently, the identification of the SMAPI, which is generated from our newly established drought monitoring system, exhibits a strong correlation with historical disaster event records. Figure 6b illustrates that areas exhibiting an increasing trend in SMAPI were predominantly situated in the central and eastern regions of Shandong Province, as well as the central-northern area of Hebei Province and the southwestern portion of Henan Province. Conversely, a decline in SMAPI was observed across the majority of the northeastern, western, and southern regions of the HHH region, with particularly pronounced decreases noted in Xingtai and Handan in Hebei Province, as well as in Anyang, Jiaozuo, Kaifeng, Shangqiu, and Zhoukou in Henan Province, in addition to Chengde in Hebei Province. Overall, the extent of areas experiencing a downward trend in SMAPI was significantly greater than those displaying an upward trend. The findings suggested that winter wheat in the HHH region may have encountered worsened drought conditions during its growing season over the past two decades from a regional perspective.
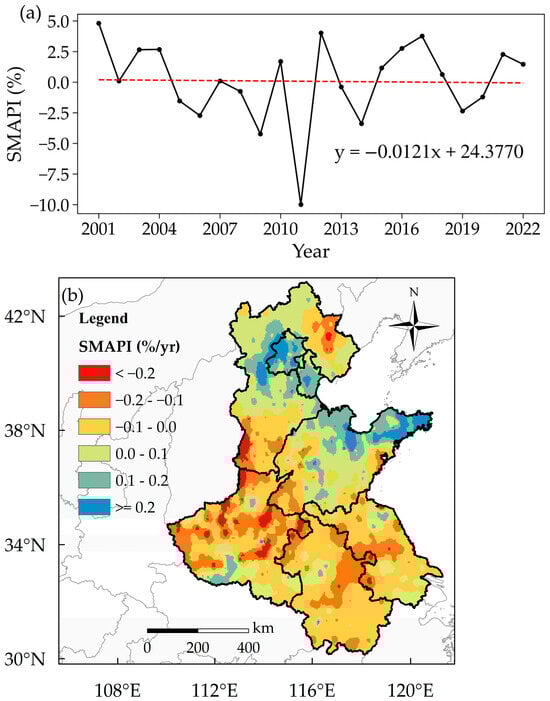
Figure 6.
The interannual variation (a) and the spatial distribution of trend (b) of the average value of Soil Moisture Anomaly Percentage Index (SMAPI) derived from the machine learning–physical process hybrid drought monitoring system during the growing season of winter wheat in the Huang-Huai-Hai (HHH) region from 2001 to 2022 under rain-fed conditions. The red dashed line represents the trend line.
We also employed the established hybrid drought monitoring system to further delineate a detailed analysis of the trends related to the characteristics of drought events affecting winter wheat within the HHH region. The analysis was structured around five key dimensions: duration, severity, extremes, intensity, and frequency, informed by the theory of runs [96,97] (Figure 7).

Figure 7.
The spatial distribution of trends in duration (a), severity (b), extremity (c), intensity (d), and frequency (e) of drought events identified by the machine learning–physical process hybrid drought monitoring system during the growing season of winter wheat in the Huang-Huai-Hai (HHH) region from 2001 to 2022 under rain-fed conditions.
The spatial distribution of trends for both the duration and severity of individual drought events in winter wheat exhibited a notable consistency (Figure 7a,b). It was noteworthy that the duration predominantly demonstrated a decreasing trend in the majority of the HHH region, although several areas in Henan Province, western Shandong Province, southern and northeastern Hebei Province, as well as southern Jiangsu Province and Anhui Province, experienced an increasing trend in duration. Simultaneously, the severity of individual drought events also showed a general decreasing trend, with the regions that experienced an increase in severity largely coinciding with those that demonstrated a rise in duration.
The spatial distribution of trends concerning extremes and intensity of individual drought events in winter wheat were largely similar (Figure 7c,d). Areas exhibiting increasing trends in both characteristics were mainly situated in the northern part of the HHH region, northern and western Henan Province, western and northeastern Shandong Province, central and western Anhui Province, and the northwest and southern parts of Jiangsu Province.
Lastly, Figure 7e demonstrated a noticeable upward trend in the frequency of drought occurrences across the majority of the HHH region, with the exception of eastern Shandong Province and southern Jiangsu Province. Specifically, significant increases in frequency have been observed in the areas of Chengde, Cangzhou, and Hengshui in Hebei Province, Jiaozuo, Kaifeng, Shangqiu, Sanmenxia, and Nanyang in Henan Province, along with the Yancheng region in Jiangsu Province.
Overall, the findings indicated that the patterns of drought events may have undergone significant changes over the past two decades. In our examination of the first four dimensions pertaining to drought characteristics related to individual drought events, we identified a consistent decreasing trend in these characteristics across central Shandong Province, southern Henan Province, northwestern Anhui Province, and central Jiangsu Province. This observation suggested a potential relieve in the adverse impact of individual drought events on winter wheat over time within these areas. Conversely, a consistent increasing trend was observed in southern Hebei Province, western and northern Shandong Province, central and southern Anhui Province, and southern Jiangsu Province. This observation suggested a potential deterioration in the nature of individual drought events within these areas, posing a significant threat to agricultural productivity and food security. Additionally, other regions predominantly exhibited a decreasing trend in the duration and severity of drought events, while simultaneously experiencing an increasing trend in the frequency and intensity. This may indicate a shift towards more short-term, extreme drought occurrences in these areas. Considering the rising frequency of drought occurrences, and in conjunction with the results presented in Figure 6, it was evident that the drought conditions are intensifying in the majority of the HHH region during the entire growing season of winter wheat, and the impact of individual drought events may gradually diminish. Simultaneously, extreme events are likely to become a central focus in disaster defense efforts. The northeastern, western, and southern regions of HHH have been identified as the areas most significantly affected by these variations over the past two decades, with all five dimensions of drought characteristics indicating a marked trend of increasing drought intensity. It is imperative that these areas receive focused attention and targeted intervention strategies to mitigate the effects of drought and enhance resilience against future climatic challenges.
4. Discussion
4.1. Estimation Model for Pre-Sowing Soil Moisture Considering Preceding Effects of Multi-Source Data
In the domain of agricultural water management, the accurate assessment of soil moisture prior to sowing is crucial for determining favorable planting dates, optimizing water resource management, and improving agricultural productivity [90,92,98]. Traditional estimation models tend to oversimplify the intricacies related to the growth and development of rotational crops by assuming that summer fields undergo a fallow period while inadequately accounting for the complex interactions among various preceding factors that influence soil moisture dynamics [99,100,101]. This oversight can lead to significant inaccuracies in pre-sowing soil moisture estimation in the HHH region, thereby affecting soil moisture dynamics and subsequent agricultural practices and outcomes.
To tackle this issue, we have developed RF regression models that integrate multi-source data, while also considering their historical interactions, to estimate pre-sowing soil moisture. Various meteorological variables, such as precipitation, temperature, wind speed, air humidity, sunshine hours, and evapotranspiration, have been employed to capture the atmospheric effects on soil moisture fluctuation. These variables are widely acknowledged as the most significant determinants of soil moisture variability [40,42,45,46]. An increasing body of research emphasizes the importance of considering the cumulative timeframes of these meteorological variables to accurately predict variations in soil moisture [22,75,86,102]. Additionally, the physical properties of soil play a fundamental role in determining pre-sowing soil moisture content. Soil physical properties such as soil type, texture, organic matter content, and bulk density are essential in influencing water retention and infiltration rates. The soil of different properties exhibits varying capacities to retain and release water, which directly impacts the moisture availability for plant uptake [46,72,73,103]. Recent studies have shown that differences in geographic conditions and sowing dates can result in distinct energy transfer mechanisms, which may potentially influence soil moisture variations [40,54,75]. Importantly, we quantitatively assess the impact of the growth and development of summer maize on soil moisture variations by incorporating the preceding effects of pre-sowing vegetation indices, including NDVI and EVI. Integrating these indices into the model can provide critical insights into the growth conditions of rotational crops before the sowing of winter wheat. This approach can partially mitigate the challenges posed by crop growth and agricultural management on soil moisture predictions [2,61,75,104]. This data fusion approach can enhance the rationale and effectiveness of ML models from a mechanistic perspective. Moreover, ML models can identify subtle relationships between variables through the SHAP method [74,75,105,106], which may not be readily observable through traditional statistical techniques. Consequently, the model can enhance modeling accuracy by utilizing historical data, processing large datasets, and extracting meaningful insights.
The results of this study provide compelling evidence that the incorporation of multi-source data through fusion models for assessing soil moisture before the planting of winter wheat constitutes a significant advancement in agricultural science in the global big data era. By integrating multi-source environmental factors, the RF regression models provided a more thorough and accurate estimation of pre-sowing soil moisture. This enhanced precision has the potential to improve agricultural outcomes, optimize water resource utilization, and promote sustainability. As the model evolves and integrates additional data and technological advancements, its capacity to revolutionize agricultural practices becomes increasingly evident.
4.2. ML-Physics Hybrid Technique Provides Valuable Insight into Soil Moisture Modeling
The integration of ML algorithms with physical process models harnesses the advantages of both data-driven approaches and physical mechanisms, resulting in more comprehensive and precise insights into soil moisture dynamics at a regional scale.
Historically, research on soil moisture in croplands has predominantly depended on physical process models that describe various processes such as infiltration, evapotranspiration, and drainage [48,49,50]. While these models are often accurate in simulating soil moisture at specific stations, they may struggle to account for the intricate variations in soil moisture across different spatial and temporal scales. This challenge is largely due to the intricate and heterogeneous nature of soil properties as well as the impact of external factors, including climate, vegetation, and land use [33,34,51].
In contrast, ML models are particularly effective at recognizing patterns and generating predictions from large datasets [42,45,57,103]. By training algorithms on extensive multi-source data, these models can uncover latent relationships and provide precise forecasts of soil moisture conditions. This capability can help mitigate some of the challenges associated with the variability of soil and environmental factors [52,53,54]. However, these models are frequently criticized for their lack of interpretability, commonly referred to as “black boxes”. Moreover, the variability associated with crop types and growth introduces considerable challenges in the application of ML models in agricultural water dynamic modeling, especially when the simulations are extended to deeper soil depths [51,58,59].
The combination of ML models with physical process models constitutes a synergistic strategy that leverages the strengths of both methodologies. Within this hybrid framework, ML algorithms can enhance the potential to improve the modeling efficacy of physical models while expanding their applicability across broader spatial scales [38,75,107]. In this study, RF regression models can be utilized to generate the initial parameters of the WBWW based on the fusion of selected multi-source data, thereby offering significant advantages for the real-time monitoring of soil moisture conditions. Given the context of climate change, having accurate and timely information on soil moisture is essential for understanding and addressing the impacts of extreme weather events, such as droughts and floods. By merging forecasting data, creating early warning systems can provide actionable insights for policymakers and stakeholders [22,76,107].
The results of this study indicated that the integration of ML techniques with the physical process model represents signifies a promising advancement in soil moisture modeling within the field of agriculture. This combined approach enhances the effectiveness of individual numerical simulation methods in regional applications and holds potential for broader generalization in the development of other drought monitoring and early warning systems. As the availability of data continues to grow and computational resources become more readily accessible, the potential applications of this methodology are vast, providing new opportunities to deepen our understanding of environmental dynamics and to inform sustainable water management strategies.
4.3. Limitations and Developments
The implementation of newly developed drought monitoring systems has traditionally focused solely on natural precipitation. However, the critical role that local effective irrigation and the water use efficiency of crops post-irrigation play in agricultural productivity was not considered. In regions such as HHH, where winter wheat supply is heavily reliant on irrigation practices, neglecting these factors could lead to significant inaccuracies in drought assessments and overall agricultural management strategies [20,108]. Studies have shown that the presence of agricultural irrigation practices can substantially alter the primary spatial distribution patterns of drought conditions [61,88]. Timely and adequate irrigation not only replenishes soil moisture effectively, thereby fostering the healthy growth of winter wheat, but it also plays a pivotal role in mitigating the adverse effects of drought on crop yield [89,90]. However, the acquisition of accurate irrigation data presents numerous challenges, constituting a significant limitation in practical applications. The HHH region, which spans multiple provinces, is characterized by intricate irrigation systems. Irrigation data are often dispersed among various agricultural management departments, meteorological stations, and individual farmers, lacking a unified approach for integration and standardization [103,109]. Additionally, irrigation timing and frequency vary due to factors such as climatic conditions, soil types, and crop requirements. As a result, irrigation decisions are typically based on farmers’ experiences and short-term weather forecasts, which lack long-term and systematic documentation [12,82,110]. This temporal and spatial variability complicates the collection and integration of irrigation data, significantly diminishing its predictability. Although the widespread implementation of soil moisture sensors and the utilization of remote sensing technologies in irrigation data collection present substantial opportunities to mitigate the existing irrigation challenges, these methods currently fall short of facilitating the accurate acquisition of daily scale irrigation data at a regional scale [29,40,42,43]. In light of this situation, we are compelled to adopt a compromise approach in the development of a drought monitoring system. While the reliance on natural precipitation for drought monitoring may provide a simplistic overview of water availability, drought monitoring under rainfed conditions can yield valuable insights regarding drought in winter wheat. A thorough understanding of these interactions is crucial for enhancing drought resilience within agricultural management practices [15,29]. In future studies, it is imperative to explore effective strategies for collecting irrigation data and integrate these data with precipitation information to offer a more comprehensive perspective on the impacts of drought on winter wheat. This approach will enhance the reliability of drought assessments and facilitate the development of more effective strategies aimed at promoting sustainable agricultural practices in arid and semi-arid regions.
The HHH region demonstrates considerable spatial variability in terms of both topography and climate conditions, with significant alterations observed as one moves across different locations. The presence of such temporal and spatial heterogeneity results in marked discrepancies in the performance of SMAPI across various regions, potentially leading to variations in accuracy that could impact the applicability of SMAPI [41,77,111]. As a result, relying on a single set of SMAPI categories for drought monitoring and assessment throughout the entire region may lead to inaccuracies. Furthermore, as climate change continues to advance, these established standards may become outdated, potentially causing misunderstandings regarding drought conditions [112,113]. Nevertheless, with respect to the comprehensive drought assessment of the HHH region over the last two decades, the results of this study affirm the reliability of the system. Further efforts should prioritize the identification of zones based on specific climatic and topographical characteristics, thereby allowing for the development of region-specific drought categories to improve the accuracy of detailed drought monitoring and assessment [2,61]. As the monitoring system is expanded to encompass a broader range of global regions, the challenges associated with obtaining soil moisture data and refining SMAPI drought categories will become increasingly intricate and pronounced. In future studies, we will seek to enhance the generalizability of the drought monitoring system through the integration of multi-source data and region-specific adjustments, thereby improving its applicability across a wider array of geographic areas and climatic conditions.
5. Conclusions
This study developed an innovative hybrid system integrating ML algorithms with a physical process model to monitor daily drought conditions in winter wheat. The system analyzes spatial and temporal variations in regional drought patterns, providing insights into the impacts of climate change.
We selected the RF algorithm from eleven candidate ML algorithms to estimate pre-sowing soil moisture using multi-source environmental data. Input features and hyperparameters were determined using SHAP methodology and cross-validation, resulting in robust estimation models across eight soil depths (0.1–1.0 m). The models achieved R² values ranging from 0.8424 to 0.8721, RMSE from 0.0172 to 0.0199 m³·m³, and MAE from 0.0137 to 0.0167 m3·m3. These models provide critical parameters for initializing the WBWW model, enabling regional-scale soil moisture dynamics simulation. The hybrid system’s efficacy was validated through SMAPI-derived drought monitoring, which aligned well with actual disaster records during two regional drought events.
We further investigated the spatiotemporal characteristics of drought affecting winter wheat in the HHH region utilizing the hybrid drought monitoring system. Over the past two decades, the average SMAPI during the winter wheat growing season had declined at a rate of −0.021% per year, indicating increasingly severe drought conditions. Spatially, the northeastern, western, and southern regions were experiencing intensified droughts. Drought frequency was rising in most areas, with the southern-central region showing alleviated drought conditions during individual events, while the majority of northern regions faced shorter but more intense droughts. These findings highlighted the need for targeted interventions in the northeastern, western, and southern regions to mitigate drought impacts and enhance resilience against future climatic challenges.
Author Contributions
Q.M. writing—original draft, writing—review and editing, software, and methodology. Z.H.: writing—review and editing, conceptualization, and methodology. M.L.: writing—review and editing, software, methodology, and formal analysis. L.Z.: writing—review and editing and investigation. R.K.: investigation and formal analysis. F.Z.: validation and formal analysis. Y.W.: validation and formal analysis. Y.H.: validation and visualization. All authors have read and agreed to the published version of the manuscript.
Funding
This study was supported by the National Key Research and Development Program of China (2022YFD2300202), the Key Innovative Team of Agricultural Meteorology of the China Meteorological Administration (CMA2024ZD02), and the Basic Research Fund of the Chinese Academy of Meteorological Sciences (2024Z001). The authors would like to thank the editors and anonymous reviewers for their helpful and constructive comments to improve this manuscript.
Data Availability Statement
Data will be made available upon request.
Conflicts of Interest
The authors declare that they have no known competing financial interests or personal relationships that could have appeared to influence the work reported in this paper.
References
- Ma, Q.; Li, Y.; Liu, F.; Feng, H.; Biswas, A.; Zhang, Q. SPEI and multi-threshold run theory based drought analysis using multi-source products in China. J. Hydrol. 2023, 616, 128737. [Google Scholar] [CrossRef]
- Zhang, Y.; Wang, P.; Chen, Y.; Yang, J.; Wu, D.; Ma, Y.; Huo, Z.; Liu, S. Daily dynamic thresholds of different agricultural drought grades for summer maize based on the Vegetation Water Index. J. Hydrol. 2023, 625, 130070. [Google Scholar] [CrossRef]
- IPCC. Climate Change 2021—The Physical Science Basis: Working Group I Contribution to the Sixth Assessment Report of the Intergovernmental Panel on Climate Change; Cambridge University Press: Cambridge, UK, 2023.
- Wang, R.; Zhao, H.; Qi, Y.; Zhao, F.; Chen, F.; Ding, W.; Jiang, J.; Zhang, K.; Wang, H. Onset and severity thresholds of drought impacts on wheat. Agric. Water Manag. 2023, 281, 108259. [Google Scholar] [CrossRef]
- Xu, Y.; Zhang, X.; Hao, Z.; Hao, F.; Li, C. Projections of future meteorological droughts in China under CMIP6 from a three-dimensional perspective. Agric. Water Manag. 2021, 252, 106849. [Google Scholar] [CrossRef]
- Markonis, Y.; Kumar, R.; Hanel, M.; Rakovec, O.; Máca, P.; AghaKouchak, A. The rise of compound warm-season droughts in Europe. Sci. Adv. 2021, 7, eabb9668. [Google Scholar] [CrossRef] [PubMed]
- Zhou, S.; Zhang, Y.; Park Williams, A.; Gentine, P. Projected increases in intensity, frequency, and terrestrial carbon costs of compound drought and aridity events. Sci. Adv. 2019, 5, eaau5740. [Google Scholar] [CrossRef] [PubMed]
- Zeng, Z.; Wu, W.; Li, Y.; Huang, C.; Zhang, X.; Peñuelas, J.; Zhang, Y.; Gentine, P.; Li, Z.; Wang, X.; et al. Increasing meteorological drought under climate change reduces terrestrial ecosystem productivity and carbon storage. One Earth 2023, 6, 1326–1339. [Google Scholar] [CrossRef]
- Kabato, W.; Getnet, G.T.; Sinore, T.; Nemeth, A.; Molnár, Z. Towards Climate-Smart Agriculture: Strategies for Sustainable Agricultural Production, Food Security, and Greenhouse Gas Reduction. Agronomy 2025, 15, 565. [Google Scholar] [CrossRef]
- Zhang, B.; Wang, S.; Slater, L. Anthropogenic climate change doubled the frequency of compound drought and heatwaves in low-income regions. Commun. Earth Environ. 2024, 5, 715. [Google Scholar] [CrossRef]
- Huang, H.; Huang, J.; Li, X.; Zhuo, W.; Wu, Y.; Niu, Q.; Su, W.; Yuan, W. A dataset of winter wheat aboveground biomass in China during 2007–2015 based on data assimilation. Sci. Data 2022, 9, 200. [Google Scholar] [CrossRef]
- Shi, W.; Wang, M.; Tao, F.; Xu, X.; Deng, X.; Liu, L.; Kong, X.; Zuo, L.; Lei, M.; Shi, X.; et al. Wheat redistribution in Huang-Huai-Hai, China, could reduce groundwater depletion and environmental footprints without compromising production. Commun. Earth Environ. 2024, 5, 380. [Google Scholar] [CrossRef]
- Zhao, J.; Yang, J.; Huang, R.; Xie, H.; Qin, X.; Hu, Y. Estimating evapotranspiration and drought dynamics of winter wheat under climate change: A case study in Huang-Huai-Hai region, China. Sci. Total Environ. 2024, 949, 175114. [Google Scholar] [CrossRef] [PubMed]
- Wu, X.; Wang, P.; Huo, Z.; Wu, D.; Yang, J. Crop Drought Identification Index for winter wheat based on evapotranspiration in the Huang-Huai-Hai Plain, China. Agric. Ecosyst. Environ. 2018, 263, 18–30. [Google Scholar] [CrossRef]
- Wu, J.; Wang, N.; Xing, X.; Ma, X. Loss of Net primary production of seasonal winter wheat due to multiple drought types in the main Grain-Producing area of China. J. Hydrol. 2023, 625, 130093. [Google Scholar] [CrossRef]
- Yang, C.; Liu, C.; Liu, Y.; Gao, Y.; Xing, X.; Ma, X. Prediction of drought trigger thresholds for future winter wheat yield losses in China based on the DSSAT-CERES-Wheat model and Copula conditional probabilities. Agric. Water Manag. 2024, 299, 108881. [Google Scholar] [CrossRef]
- Yao, N.; Li, L.; Feng, P.; Feng, H.; Li Liu, D.; Liu, Y.; Jiang, K.; Hu, X.; Li, Y. Projections of drought characteristics in China based on a standardized precipitation and evapotranspiration index and multiple GCMs. Sci. Total Environ. 2020, 704, 135245. [Google Scholar] [CrossRef]
- Zhao, T.; Dai, A. Uncertainties in historical changes and future projections of drought. Part II: Model-simulated historical and future drought changes. Clim. Change 2017, 144, 535–548. [Google Scholar] [CrossRef]
- Cai, Y.; Yao, C.; Wu, P.; Zhang, L.; Zhu, D.; Chen, J.; Du, Y. Effectiveness of a subsurface irrigation system with ceramic emitters under low-pressure conditions. Agric. Water Manag. 2021, 243, 106390. [Google Scholar] [CrossRef]
- Liu, J.; Si, Z.; Li, S.; Kader Mounkaila Hamani, A.; Zhang, Y.; Wu, L.; Gao, Y.; Duan, A. Variations in water sources used by winter wheat across distinct rainfall years in the North China Plain. J. Hydrol. 2023, 618, 129186. [Google Scholar] [CrossRef]
- Wang, C.; Ye, J.; Zhai, Y.; Kurexi, W.; Xing, D.; Feng, G.; Zhang, Q.; Zhang, Z. Dynamics of Moistube discharge, soil-water redistribution and wetting morphology in response to regulated working pressure heads. Agric. Water Manag. 2023, 282, 108285. [Google Scholar] [CrossRef]
- Zhang, Y.; Hao, Z.; Feng, S.; Zhang, X.; Xu, Y.; Hao, F. Agricultural drought prediction in China based on drought propagation and large-scale drivers. Agric. Water Manag. 2021, 255, 107028. [Google Scholar] [CrossRef]
- Vicente-Serrano, S.M.; Beguería, S.; López-Moreno, J.I. A Multiscalar Drought Index Sensitive to Global Warming: The Standardized Precipitation Evapotranspiration Index. J. Clim. 2010, 23, 1696–1718. [Google Scholar] [CrossRef]
- McKee, T.B.; Doesken, N.J.; Kleist, J. The relationship of drought frequency and duration to time scales. In Proceedings of the 8th Conference on Applied Climatology, Anaheim, CA, USA, 17–22 January 1993; pp. 179–183. [Google Scholar]
- Mi, Q.; Ren, C.; Wang, Y.; Gao, X.; Liu, L.; Li, Y. A robust ensemble drought index: Construction and assessment. Nat. Hazard 2023, 116, 1139–1159. [Google Scholar] [CrossRef]
- Yang, B.; Cui, Q.; Meng, Y.; Zhang, Z.; Hong, Z.; Hu, F.; Li, J.; Tao, C.; Wang, Z.; Zhang, W. Combined multivariate drought index for drought assessment in China from 2003 to 2020. Agric. Water Manag. 2023, 281, 108241. [Google Scholar] [CrossRef]
- Wu, J.; Gu, Y.; Sun, K.; Wang, N.; Shen, H.; Wang, Y.; Ma, X. Correlation of climate change and human activities with agricultural drought and its impact on the net primary production of winter wheat. J. Hydrol. 2023, 620, 129504. [Google Scholar] [CrossRef]
- Ajaz, A.; Taghvaeian, S.; Lollato, R.; Alderman, P.D.; Gowda, P.H. Gridded drought response assessment of winter wheat in Oklahoma using big data and AquaCrop-OS. Sci. Total Environ. 2025, 959, 178206. [Google Scholar] [CrossRef] [PubMed]
- Jin, N.; Shi, Y.; Niu, W.; He, L. Spatial and temporal patterns of agricultural drought in China during 1960–2020 characterized by use of the crop water deficit Abnormal Index. J. Hydrol. 2023, 627, 130454. [Google Scholar] [CrossRef]
- Wang, A.; Gao, X.; Zhou, Z.; Siddique, K.H.M.; Yang, H.; Wang, J.; Zhang, S.; Zhao, X. A novel index for vegetation drought assessment based on plant water metabolism and balance under vegetation restoration on the Loess Plateau. Sci. Total Environ. 2024, 918, 170549. [Google Scholar] [CrossRef] [PubMed]
- Fu, Z.; Ciais, P.; Prentice, I.C.; Gentine, P.; Makowski, D.; Bastos, A.; Luo, X.; Green, J.K.; Stoy, P.C.; Yang, H. Atmospheric dryness reduces photosynthesis along a large range of soil water deficits. Nat. Commun. 2022, 13, 989. [Google Scholar] [CrossRef]
- Kannenberg, S.A.; Anderegg, W.R.L.; Barnes, M.L.; Dannenberg, M.P.; Knapp, A.K. Dominant role of soil moisture in mediating carbon and water fluxes in dryland ecosystems. Nat. Geosci. 2024, 17, 38–43. [Google Scholar] [CrossRef]
- Li, M.; Wu, P.; Ma, Z.; Lv, M.; Yang, Q. Changes in soil moisture persistence in China over the past 40 years under a warming climate. J. Clim. 2020, 33, 9531–9550. [Google Scholar] [CrossRef]
- Li, M.; Wu, P.; Sexton, D.M.; Ma, Z. Potential shifts in climate zones under a future global warming scenario using soil moisture classification. Clim. Dyn. 2021, 56, 2071–2092. [Google Scholar] [CrossRef]
- Hao, Z.; AghaKouchak, A.; Nakhjiri, N.; Farahmand, A. Global integrated drought monitoring and prediction system. Sci. Data 2014, 1, 140001. [Google Scholar] [CrossRef] [PubMed]
- Martínez-Fernández, J.; González-Zamora, A.; Sánchez, N.; Gumuzzio, A.; Herrero-Jiménez, C.M. Satellite soil moisture for agricultural drought monitoring: Assessment of the SMOS derived Soil Water Deficit Index. Remote Sens. Environ. 2016, 177, 277–286. [Google Scholar] [CrossRef]
- Bergman, K.; Sabol, P.; Miskus, D. Experimental indices for monitoring global drought conditions. In Proceedings of the 13th Annual Climate Diagnostics Workshop, Cambridge, MA, USA, 31 October–4 November 1988; pp. 190–197. [Google Scholar]
- Hao, Z.; Singh, V.P.; Xia, Y. Seasonal Drought Prediction: Advances, Challenges, and Future Prospects. Rev. Geophys. 2018, 56, 108–141. [Google Scholar] [CrossRef]
- Liu, Y.; Liu, Y.; Wang, W. Inter-comparison of satellite-retrieved and Global Land Data Assimilation System-simulated soil moisture datasets for global drought analysis. Remote Sens. Environ. 2019, 220, 1–18. [Google Scholar] [CrossRef]
- Cheng, F.; Zhang, Z.; Zhuang, H.; Han, J.; Luo, Y.; Cao, J.; Zhang, L.; Zhang, J.; Xu, J.; Tao, F. ChinaCropSM1 km: A fine 1 km daily soil moisture dataset for dryland wheat and maize across China during 1993–2018. Earth Syst. Sci. Data 2023, 15, 395–409. [Google Scholar] [CrossRef]
- Wu, D.; Li, Z.; Zhu, Y.; Li, X.; Wu, Y.; Fang, S. A new agricultural drought index for monitoring the water stress of winter wheat. Agric. Water Manag. 2021, 244, 106599. [Google Scholar] [CrossRef]
- Togneri, R.; Felipe dos Santos, D.; Camponogara, G.; Nagano, H.; Custódio, G.; Prati, R.; Fernandes, S.; Kamienski, C. Soil moisture forecast for smart irrigation: The primetime for machine learning. Expert Syst. Appl. 2022, 207, 117653. [Google Scholar] [CrossRef]
- Mazzariello, A.; Albano, R.; Lacava, T.; Manfreda, S.; Sole, A. Intercomparison of recent microwave satellite soil moisture products on European ecoregions. J. Hydrol. 2023, 626, 130311. [Google Scholar] [CrossRef]
- Zeng, J.; Yuan, X.; Ji, P.; Shi, C. Effects of meteorological forcings and land surface model on soil moisture simulation over China. J. Hydrol. 2021, 603, 126978. [Google Scholar] [CrossRef]
- Zeng, J.; Yuan, X.; Ji, P. The important role of reliable land surface model simulation in high-resolution multi-source soil moisture data fusion by machine learning. J. Hydrol. 2024, 630, 130700. [Google Scholar] [CrossRef]
- Shin, Y.; Mohanty, B.P.; Kim, J.; Lee, T. Multi-model based soil moisture simulation approach under contrasting weather conditions. J. Hydrol. 2023, 617, 129112. [Google Scholar] [CrossRef]
- Zhu, Y.; Zhao, T.; Mao, W.; Ye, M.; Han, X.; Jia, B.; Yang, J. Development of flow model for partly and fully saturated soils using water balance and water table depth fluctuation analysis. J. Hydrol. 2023, 618, 129259. [Google Scholar] [CrossRef]
- Rosa, R.D.; Paredes, P.; Rodrigues, G.C.; Alves, I.; Fernando, R.M.; Pereira, L.S.; Allen, R.G. Implementing the dual crop coefficient approach in interactive software. 1. Background and computational strategy. Agric. Water Manag. 2012, 103, 8–24. [Google Scholar] [CrossRef]
- Raes, D.; Steduto, P.; Hsiao, T.C.; Fereres, E. AquaCrop—The FAO Crop Model to Simulate Yield Response to Water: II. Main Algorithms and Software Description. Agron. J. 2009, 101, 438–447. [Google Scholar] [CrossRef]
- de Wit, A.; Boogaard, H.; Fumagalli, D.; Janssen, S.; Knapen, R.; van Kraalingen, D.; Supit, I.; van der Wijngaart, R.; van Diepen, K. 25 years of the WOFOST cropping systems model. Agric. Syst. 2019, 168, 154–167. [Google Scholar] [CrossRef]
- Karandish, F.; Šimůnek, J. A comparison of numerical and machine-learning modeling of soil water content with limited input data. J. Hydrol. 2016, 543, 892–909. [Google Scholar] [CrossRef]
- Liu, Q.; Wu, Z.; Cui, N.; Jin, X.; Zhu, S.; Jiang, S.; Zhao, L.; Gong, D. Estimation of Soil Moisture Using Multi-Source Remote Sensing and Machine Learning Algorithms in Farming Land of Northern China. Remote Sens. 2023, 15, 4214. [Google Scholar] [CrossRef]
- Zhang, B.; Wu, Y.; Zhao, B.; Chanussot, J.; Hong, D.; Yao, J.; Gao, L. Progress and Challenges in Intelligent Remote Sensing Satellite Systems. IEEE J. Sel. Top. Appl. Earth Obs. Remote Sens. 2022, 15, 1814–1822. [Google Scholar] [CrossRef]
- Han, J.; Fang, S.; Mi, Q.; Wang, X.; Yu, Y.; Zhuo, W.; Peng, X. A time-continuous land surface temperature (LST) data fusion approach based on deep learning with microwave remote sensing and high-density ground truth observations. Sci. Total Environ. 2024, 914, 169992. [Google Scholar] [CrossRef] [PubMed]
- Wang, Y.; Shi, L.; Hu, Y.; Hu, X.; Song, W.; Wang, L. A comprehensive study of deep learning for soil moisture prediction. Hydrol. Earth Syst. Sci. 2024, 28, 917–943. [Google Scholar] [CrossRef]
- Teshome, F.T.; Bayabil, H.K.; Schaffer, B.; Ampatzidis, Y.; Hoogenboom, G. Improving soil moisture prediction with deep learning and machine learning models. Comput. Electron. Agric. 2024, 226, 109414. [Google Scholar] [CrossRef]
- Ivanova, I. Soil moisture forecasting from sensors-based soil moisture, weather and irrigation observations: A systematic review. Smart Agric. Technol. 2025, 10, 100692. [Google Scholar] [CrossRef]
- Logeshwaran, J.; Srivastava, D.; Kumar, K.S.; Rex, M.J.; Al-Rasheed, A.; Getahun, M.; Soufiene, B.O. Improving crop production using an agro-deep learning framework in precision agriculture. BMC Bioinf. 2024, 25, 341. [Google Scholar] [CrossRef]
- Pan, X.; Chen, J. The optimization path of agricultural industry structure and intelligent transformation by deep learning. Sci. Rep. 2024, 14, 29548. [Google Scholar] [CrossRef] [PubMed]
- Mi, Q.; Li, M.; Huo, Z.; Zhang, L.; Kong, R.; Jiang, M.; Zhang, F. Simulating the Vertical Distribution of Soil Moisture for Winter Wheat Based on a Hydrodynamic-Processes-Driven Water Balance Model in the Huang-Huai-Hai Region, China. arXiv 2024. [Google Scholar] [CrossRef]
- Zhao, J.; Peng, H.; Yang, J.; Huang, R.; Huo, Z.; Ma, Y. Response of winter wheat to different drought levels based on Google Earth Engine in the Huang-Huai-Hai Region, China. Agric. Water Manag. 2024, 292, 108662. [Google Scholar] [CrossRef]
- Zhao, L.; Li, Q.; Zhang, Y.; Wang, H.; Du, X. Normalized NDVI valley area index (NNVAI)-based framework for quantitative and timely monitoring of winter wheat frost damage on the Huang-Huai-Hai Plain, China. Agric. Ecosyst. Environ. 2020, 292, 106793. [Google Scholar] [CrossRef]
- Wu, D.; Fang, S.; Li, X.; He, D.; Zhu, Y.; Yang, Z.; Xu, J.; Wu, Y. Spatial-temporal variation in irrigation water requirement for the winter wheat-summer maize rotation system since the 1980s on the North China Plain. Agric. Water Manag. 2019, 214, 78–86. [Google Scholar] [CrossRef]
- Luo, Y.; Zhang, Z.; Chen, Y.; Li, Z.; Tao, F. ChinaCropPhen1km: A high-resolution crop phenological dataset for three staple crops in China during 2000–2015 based on leaf area index (LAI) products. Earth Syst. Sci. Data 2020, 12, 197–214. [Google Scholar] [CrossRef]
- Wu, D.; Cao, T.; Xue, H. The Study of Quality Control for Observing Data of Automatic Soil Moisture. Hans J. Soil Sci. 2016, 4, 1–10. [Google Scholar] [CrossRef]
- Shangguan, W.; Dai, Y.; Liu, B.; Zhu, A.; Duan, Q.; Wu, L.; Ji, D.; Ye, A.; Yuan, H.; Zhang, Q. A China data set of soil properties for land surface modeling. J. Adv. Model Earth. Syst. 2013, 5, 212–224. [Google Scholar] [CrossRef]
- Saxton, K.E.; Rawls, W.J. Soil water characteristic estimates by texture and organic matter for hydrologic solutions. Soil Sci. Soc. Am. J. 2006, 70, 1569–1578. [Google Scholar] [CrossRef]
- Zhang, B.; Liu, Y.; Xu, D.; Zhao, N.; Lei, B.; Rosa, R.D.; Paredes, P.; Paço, T.A.; Pereira, L.S. The dual crop coefficient approach to estimate and partitioning evapotranspiration of the winter wheat–summer maize crop sequence in North China Plain. Irrig. Sci. 2013, 31, 1303–1316. [Google Scholar] [CrossRef]
- Wu, P.; Wang, Y.; Li, Y.; Yu, H.; Shao, J.; Zhao, Z.; Qiao, Y.; Liu, C.; Liu, S.; Gao, C.; et al. Evaluating optimized irrigation strategies on crop productivity and field water utilization under micro sprinkling irrigation in typical cropping systems of the Huang-Huai-Hai Plain. Eur. J. Agron. 2024, 154, 127093. [Google Scholar] [CrossRef]
- Kendy, E.; Gérard-Marchant, P.; Todd Walter, M.; Zhang, Y.; Liu, C.; Steenhuis, T.S. A soil-water-balance approach to quantify groundwater recharge from irrigated cropland in the North China Plain. Hydrol. Process. 2003, 17, 2011–2031. [Google Scholar] [CrossRef]
- Yang, X.; Wang, G.; Chen, Y.; Sui, P.; Pacenka, S.; Steenhuis, T.S.; Siddique, K.H.M. Reduced groundwater use and increased grain production by optimized irrigation scheduling in winter wheat–summer maize double cropping system—A 16-year field study in North China Plain. Field Crops Res. 2022, 275, 108364. [Google Scholar] [CrossRef]
- Vereecken, H.; Amelung, W.; Bauke, S.L.; Bogena, H.; Brüggemann, N.; Montzka, C.; Vanderborght, J.; Bechtold, M.; Blöschl, G.; Carminati, A. Soil hydrology in the Earth system. Nat. Rev. Earth Environ. 2022, 3, 573–587. [Google Scholar] [CrossRef]
- Tenreiro, T.R.; García-Vila, M.; Gómez, J.A.; Jimenez-Berni, J.A.; Fereres, E. Water modelling approaches and opportunities to simulate spatial water variations at crop field level. Agric. Water Manag. 2020, 240, 106254. [Google Scholar] [CrossRef]
- Li, M.; Huo, Z.; Mi, Q.; Zhang, L.; Yang, J.; Zhang, F.; Kong, R.; Wang, Y.; Huo, Y. A Dynamic Monitoring Framework for Spring Low-Temperature Disasters Affecting Winter Wheat: Exploring Environmental Coercion and Mitigation Mechanisms. Agronomy 2025, 15, 337. [Google Scholar] [CrossRef]
- Zha, X.; Jia, S.; Han, Y.; Zhu, W.; Lv, A. Enhancing Soil Moisture Prediction in Drought-Prone Agricultural Regions Using Remote Sensing and Machine Learning Approaches. Remote Sens. 2025, 17, 181. [Google Scholar] [CrossRef]
- Wang, X.; Corzo, G.; Lü, H.; Zhou, S.; Mao, K.; Zhu, Y.; Duarte, S.; Liu, M.; Su, J. Sub-seasonal soil moisture anomaly forecasting using combinations of deep learning, based on the reanalysis soil moisture records. Agric. Water Manag. 2024, 295, 108772. [Google Scholar] [CrossRef]
- Ji, Y.; Li, Y.; Yao, N.; Biswas, A.; Zou, Y.; Meng, Q.; Liu, F. The lagged effect and impact of soil moisture drought on terrestrial ecosystem water use efficiency. Ecol. Indic. 2021, 133, 108349. [Google Scholar] [CrossRef]
- Xu, Z.-G.; Wu, Z.-Y.; He, H.; Guo, X.; Zhang, Y.-L. Comparison of soil moisture at different depths for drought monitoring based on improved soil moisture anomaly percentage index. Water Sci. Eng. 2021, 14, 171–183. [Google Scholar] [CrossRef]
- Li, L.; Li, H.; Liu, N.; Lu, Y.; Shao, L.; Chen, S.; Zhang, X. Water use characteristics and drought tolerant ability of different winter wheat cultivars assessed under whole growth circle and at seedling stage. Agric. Water Manag. 2024, 300, 108921. [Google Scholar] [CrossRef]
- Eitzinger, J.; Štastná, M.; Žalud, Z.; Dubrovský, M. A simulation study of the effect of soil water balance and water stress on winter wheat production under different climate change scenarios. Agric. Water Manag. 2003, 61, 195–217. [Google Scholar] [CrossRef]
- Wang, L.; Liu, X.; Liu, X.; Bao, X.; Zhang, X.; Yin, B.; Wang, W.; Wang, Y.; Zhen, W. Effects of spring limited irrigation on grain yield and root characteristics of winter wheat in groundwater-overexploitation areas in the North China Plain. Agric. Water Manag. 2024, 294, 108729. [Google Scholar] [CrossRef]
- Li, H.; Li, L.; Liu, N.; Chen, S.; Shao, L.; Sekiya, N.; Zhang, X. Root efficiency and water use regulation relating to rooting depth of winter wheat. Agric. Water Manag. 2022, 269, 107710. [Google Scholar] [CrossRef]
- Albasha, R.; Mailhol, J.-C.; Cheviron, B. Compensatory uptake functions in empirical macroscopic root water uptake models—Experimental and numerical analysis. Agric. Water Manag. 2015, 155, 22–39. [Google Scholar] [CrossRef]
- de Melo, M.L.A.; de Jong van Lier, Q. Revisiting the Feddes reduction function for modeling root water uptake and crop transpiration. J. Hydrol. 2021, 603, 126952. [Google Scholar] [CrossRef]
- Gao, Y.; Chen, J.; Wang, G.; Liu, Z.; Sun, W.; Zhang, Y.; Zhang, X. Different responses in root water uptake of summer maize to planting density and nitrogen fertilization. Front. Plant Sci. 2022, 13, 918043. [Google Scholar] [CrossRef] [PubMed]
- Cui, Y.; Jia, L. Estimation of evapotranspiration of “soil-vegetation” system with a scheme combining a dual-source model and satellite data assimilation. J. Hydrol. 2021, 603, 127145. [Google Scholar] [CrossRef]
- Allen, R.G.; Pereira, L.S.; Raes, D.; Smith, M. Crop Evapotranspiration-Guidelines for Computing Crop Water Requirements-FAO Irrigation and Drainage Paper 56; FAO: Rome, Italy, 1998; Volume 300, p. D05109. [Google Scholar]
- Wu, B.; Ma, Z.; Yan, N. Agricultural drought mitigating indices derived from the changes in drought characteristics. Remote Sens. Environ. 2020, 244, 111813. [Google Scholar] [CrossRef]
- Xu, X.; Zhang, M.; Li, J.; Liu, Z.; Zhao, Z.; Zhang, Y.; Zhou, S.; Wang, Z. Improving water use efficiency and grain yield of winter wheat by optimizing irrigations in the North China Plain. Field Crops Res. 2018, 221, 219–227. [Google Scholar] [CrossRef]
- Li, H.; Jia, B.; Wang, H.; Li, D.; Fang, Q.; He, J.; Li, R. Yield response of supplementary irrigation at the anthesis stage of winter wheat. Agric. Water Manag. 2023, 284, 108352. [Google Scholar] [CrossRef]
- China Meteorological Administration. Yearbook of Meteorological Disasters in China (2005); China Meteorological Press: Beijing, China, 2006; p. 36.
- Dong, Z.; Zhang, X.; Li, J.; Zhang, C.; Wei, T.; Yang, Z.; Cai, T.; Zhang, P.; Ding, R.; Jia, Z. Photosynthetic characteristics and grain yield of winter wheat (Triticum aestivum L.) in response to fertilizer, precipitation, and soil water storage before sowing under the ridge and furrow system: A path analysis. Agric. For. Meteorol. 2019, 272–273, 12–19. [Google Scholar] [CrossRef]
- Ren, A.; Sun, M.; Xue, L.; Deng, Y.; Wang, P.; Lei, M.; Xue, J.; Lin, W.; Yang, Z.; Gao, Z. Spatio-temporal dynamics in soil water storage reveals effects of nitrogen inputs on soil water consumption at different growth stages of winter wheat. Agric. Water Manag. 2019, 216, 379–389. [Google Scholar] [CrossRef]
- China Meteorological Administration. Yearbook of Meteorological Disasters in China (2010); China Meteorological Press: Beijing, China, 2011; p. 73.
- China Meteorological Administration. Yearbook of Meteorological Disasters in China (2011); China Meteorological Press: Beijing, China, 2012; p. 68.
- Wan, L.; Bento, V.A.; Qu, Y.; Qiu, J.; Song, H.; Zhang, R.; Wu, X.; Xu, F.; Lu, J.; Wang, Q. Drought characteristics and dominant factors across China: Insights from high-resolution daily SPEI dataset between 1979 and 2018. Sci. Total Environ. 2023, 901, 166362. [Google Scholar] [CrossRef] [PubMed]
- Chen, D.; Guo, Y.; Zhao, Y.; Zhang, J.; Liu, X.; Tong, Z.; Zhao, C. Dynamic evolution characteristics and hazard assessment of compound drought/waterlogging and low temperature events for maize. Sci. Total Environ. 2024, 946, 174427. [Google Scholar] [CrossRef] [PubMed]
- Wang, X.; Wang, H.; Si, Z.; Gao, Y.; Duan, A. Modelling responses of cotton growth and yield to pre-planting soil moisture with the CROPGRO-Cotton model for a mulched drip irrigation system in the Tarim Basin. Agric. Water Manag. 2020, 241, 106378. [Google Scholar] [CrossRef]
- Lollato, R.P.; Patrignani, A.; Ochsner, T.E.; Edwards, J.T. Prediction of Plant Available Water at Sowing for Winter Wheat in the Southern Great Plains. Agron. J. 2016, 108, 745–757. [Google Scholar] [CrossRef]
- Grassini, P.; You, J.; Hubbard, K.G.; Cassman, K.G. Soil water recharge in a semi-arid temperate climate of the Central U.S. Great Plains. Agric. Water Manag. 2010, 97, 1063–1069. [Google Scholar] [CrossRef]
- Nielsen, D.C.; Vigil, M.F. Precipitation Storage Efficiency during Fallow in Wheat-Fallow Systems. Agron. J. 2010, 102, 537–543. [Google Scholar] [CrossRef]
- Tian, Y.; Xu, Y.-P.; Wang, G. Agricultural drought prediction using climate indices based on Support Vector Regression in Xiangjiang River basin. Sci. Total Environ. 2018, 622–623, 710–720. [Google Scholar] [CrossRef] [PubMed]
- Li, S.; Zhu, P.; Song, N.; Li, C.; Wang, J. Regional Soil Moisture Estimation Leveraging Multi-Source Data Fusion and Automated Machine Learning. Remote Sens. 2025, 17, 837. [Google Scholar] [CrossRef]
- Zheng, M.; Liu, Z.; Li, J.; Xu, Z.; Sun, J. Downscaling soil moisture in regions with high soil heterogeneity: The solution based on ensemble learning with sequential and parallel learner. Sci. Total Environ. 2024, 950, 175260. [Google Scholar] [CrossRef]
- Ming, L.; Wang, Y.; Liu, G.; Meng, L.; Chen, X. Analysis of vegetation dynamics from 2001 to 2020 in China’s Ganzhou rare earth mining area using time series remote sensing and SHAP-enhanced machine learning. Ecol. Inf. 2024, 84, 102887. [Google Scholar] [CrossRef]
- Xue, C.; Ghirardelli, A.; Chen, J.; Tarolli, P. Investigating agricultural drought in Northern Italy through explainable Machine Learning: Insights from the 2022 drought. Comput. Electron. Agric. 2024, 227, 109572. [Google Scholar] [CrossRef]
- Li, L.; Dai, Y.; Wei, Z.; Shangguan, W.; Wei, N.; Zhang, Y.; Li, Q.; Li, X.-X. Enhancing Deep Learning Soil Moisture Forecasting Models by Integrating Physics-based Models. Adv. Atmos. Sci. 2024, 41, 1326–1341. [Google Scholar] [CrossRef]
- Li, H.; Zheng, L.; Lei, Y.; Li, C.; Liu, Z.; Zhang, S. Estimation of water consumption and crop water productivity of winter wheat in North China Plain using remote sensing technology. Agric. Water Manag. 2008, 95, 1271–1278. [Google Scholar] [CrossRef]
- Liao, Q.-Y.; Leng, P.; Li, Z.-L.; Labed, J. Prediction of Root-Zone Soil Moisture and Evapotranspiration in Cropland Using HYDRUS-1D Model with Different Soil Hydrodynamic Parameter Schemes. Water 2025, 17, 730. [Google Scholar] [CrossRef]
- Huang, M.; Wang, C.; Qi, W.; Zhang, Z.; Xu, H. Modelling the integrated strategies of deficit irrigation, nitrogen fertilization, and biochar addition for winter wheat by AquaCrop based on a two-year field study. Field Crops Res. 2022, 282, 108510. [Google Scholar] [CrossRef]
- Zhang, Y.; Wu, Z.; Singh, V.P.; Lin, Q.; Ning, S.; Zhou, Y.; Jin, J.; Zhou, R.; Ma, Q. Agricultural drought characteristics in a typical plain region considering irrigation, crop growth, and water demand impacts. Agric. Water Manag. 2023, 282, 108266. [Google Scholar] [CrossRef]
- Sun, P.; Ge, C.; Yao, R.; Bian, Y.; Yang, H.; Zhang, Q.; Xu, C.-Y.; Singh, V.P. Development of a nonstationary Standardized Precipitation Evapotranspiration Index (NSPEI) and its application across China. Atmos. Res. 2024, 300, 107256. [Google Scholar] [CrossRef]
- Chen, W.; Yao, R.; Sun, P.; Zhang, Q.; Singh, V.P.; Sun, S.; AghaKouchak, A.; Ge, C.; Yang, H. Drought Risk Assessment of Winter Wheat at Different Growth Stages in Huang-Huai-Hai Plain Based on Nonstationary Standardized Precipitation Evapotranspiration Index and Crop Coefficient. Remote Sens. 2024, 16, 1625. [Google Scholar] [CrossRef]
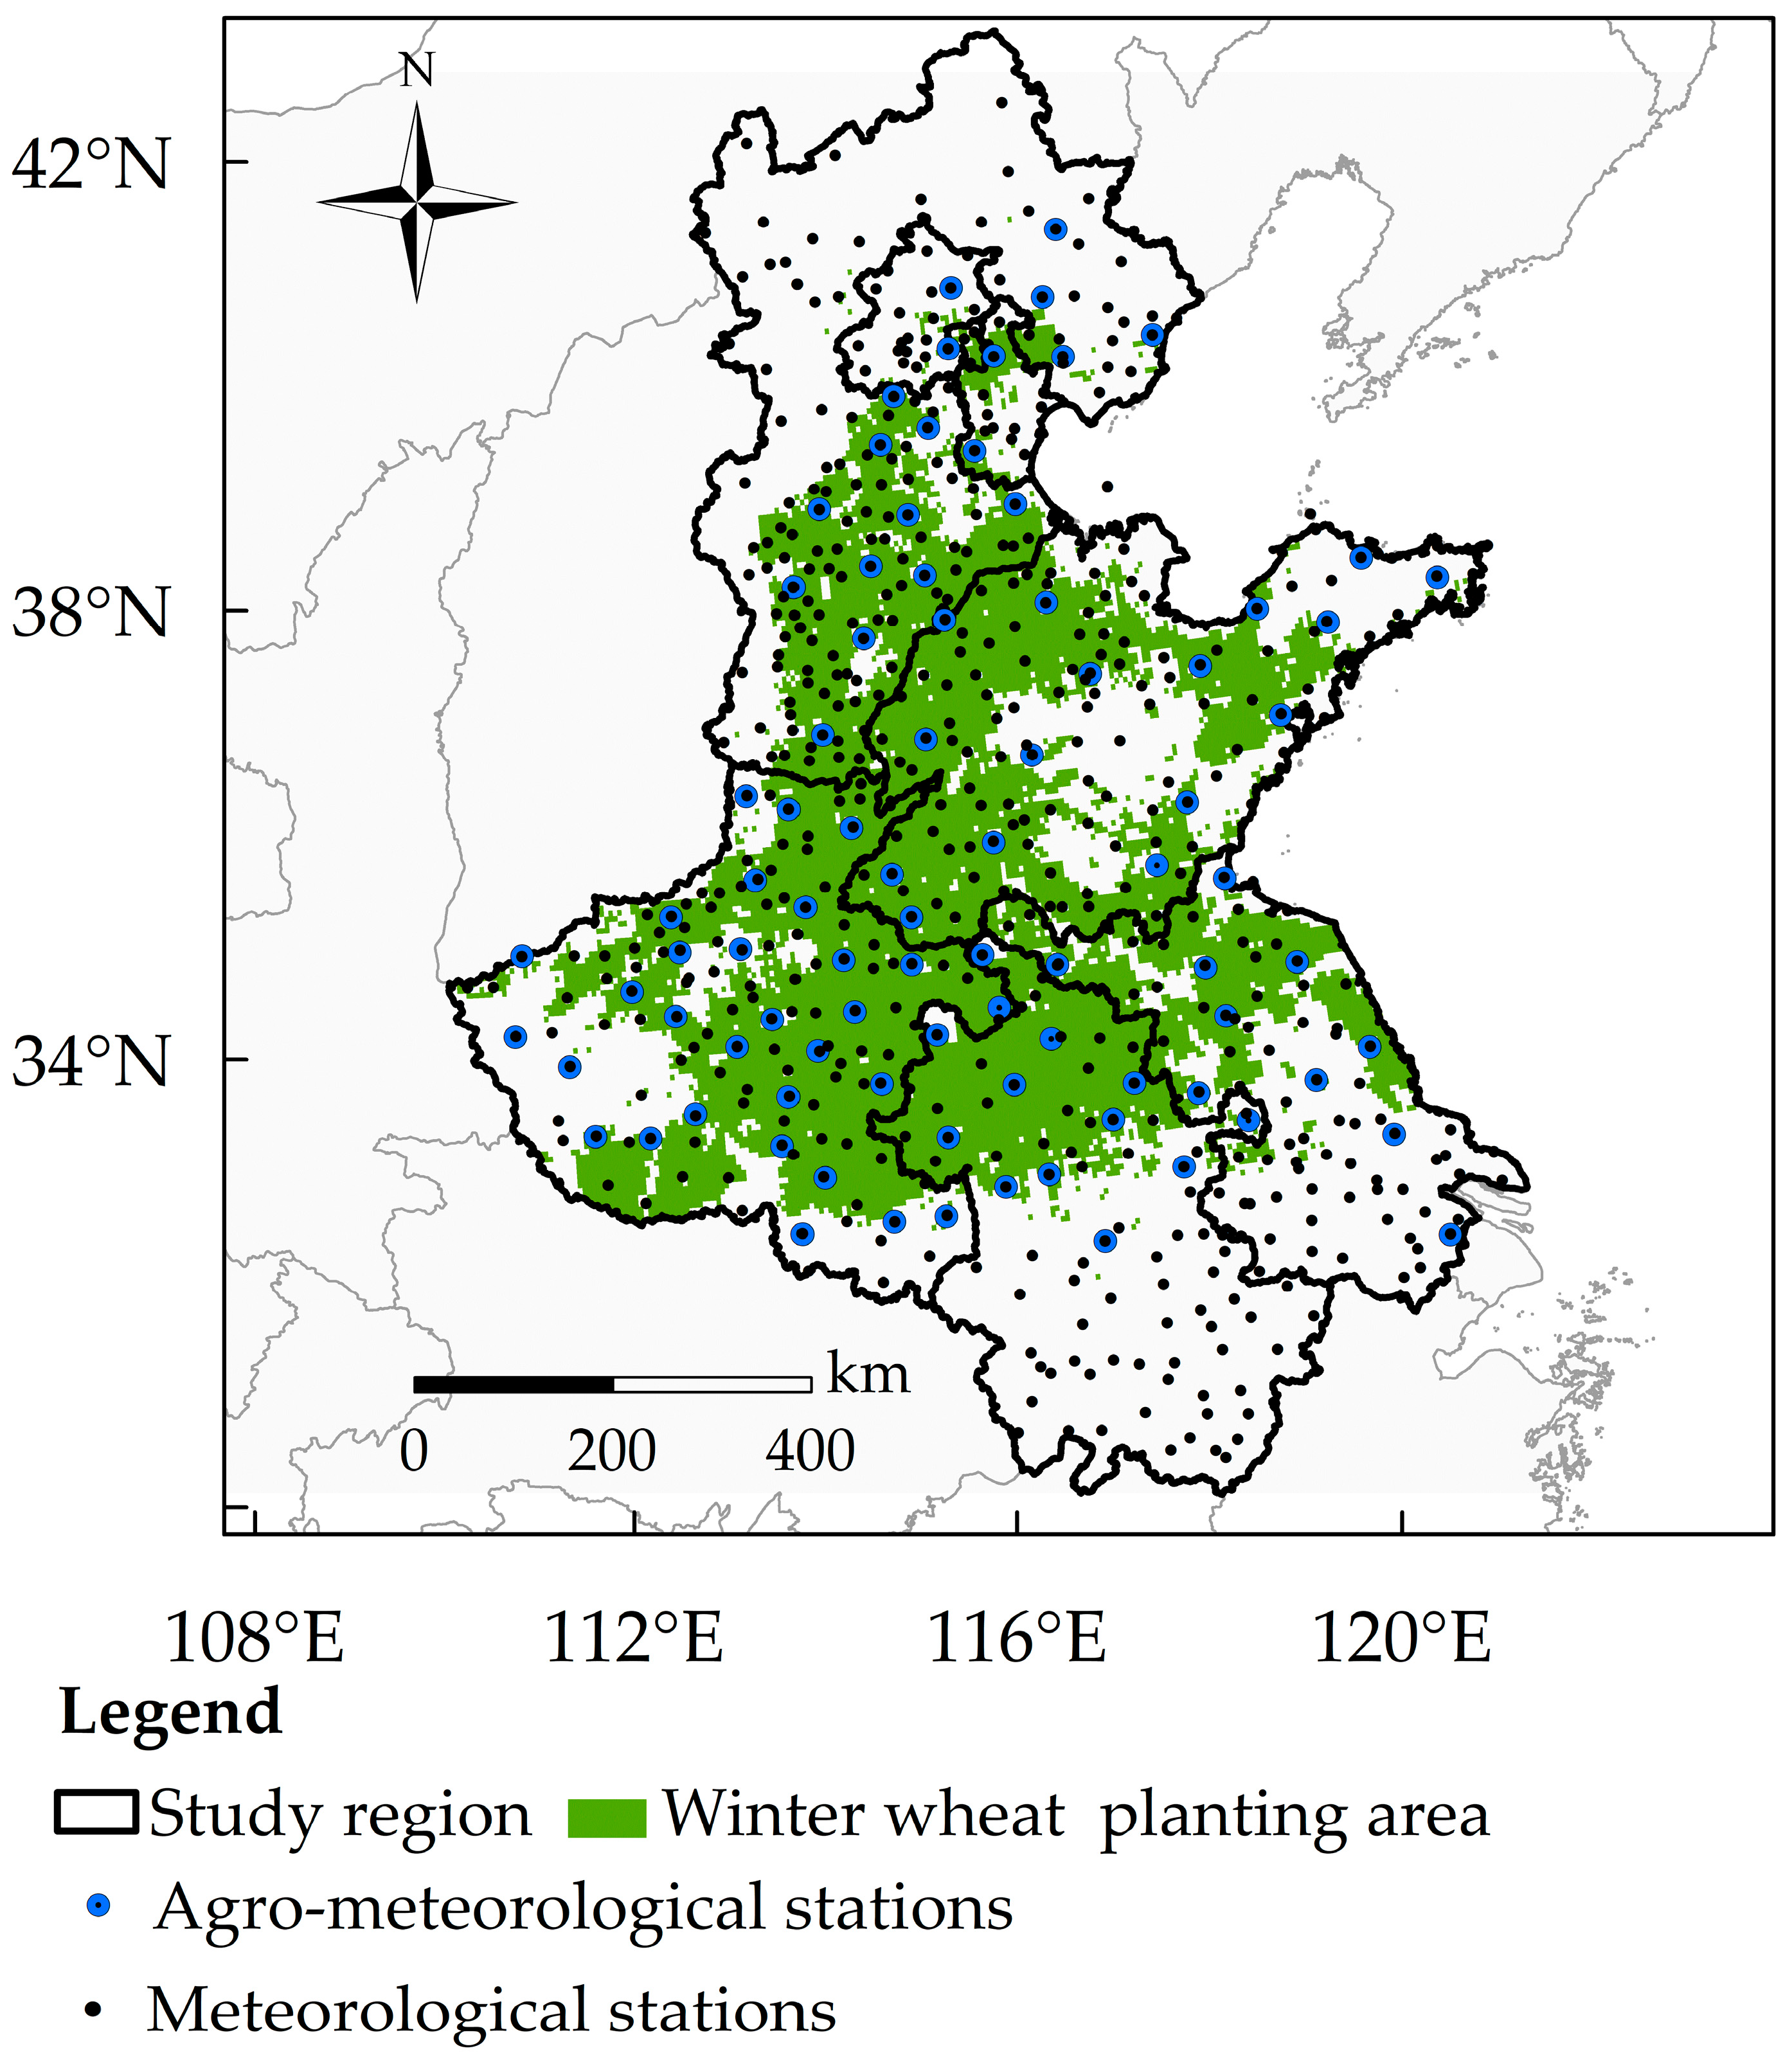
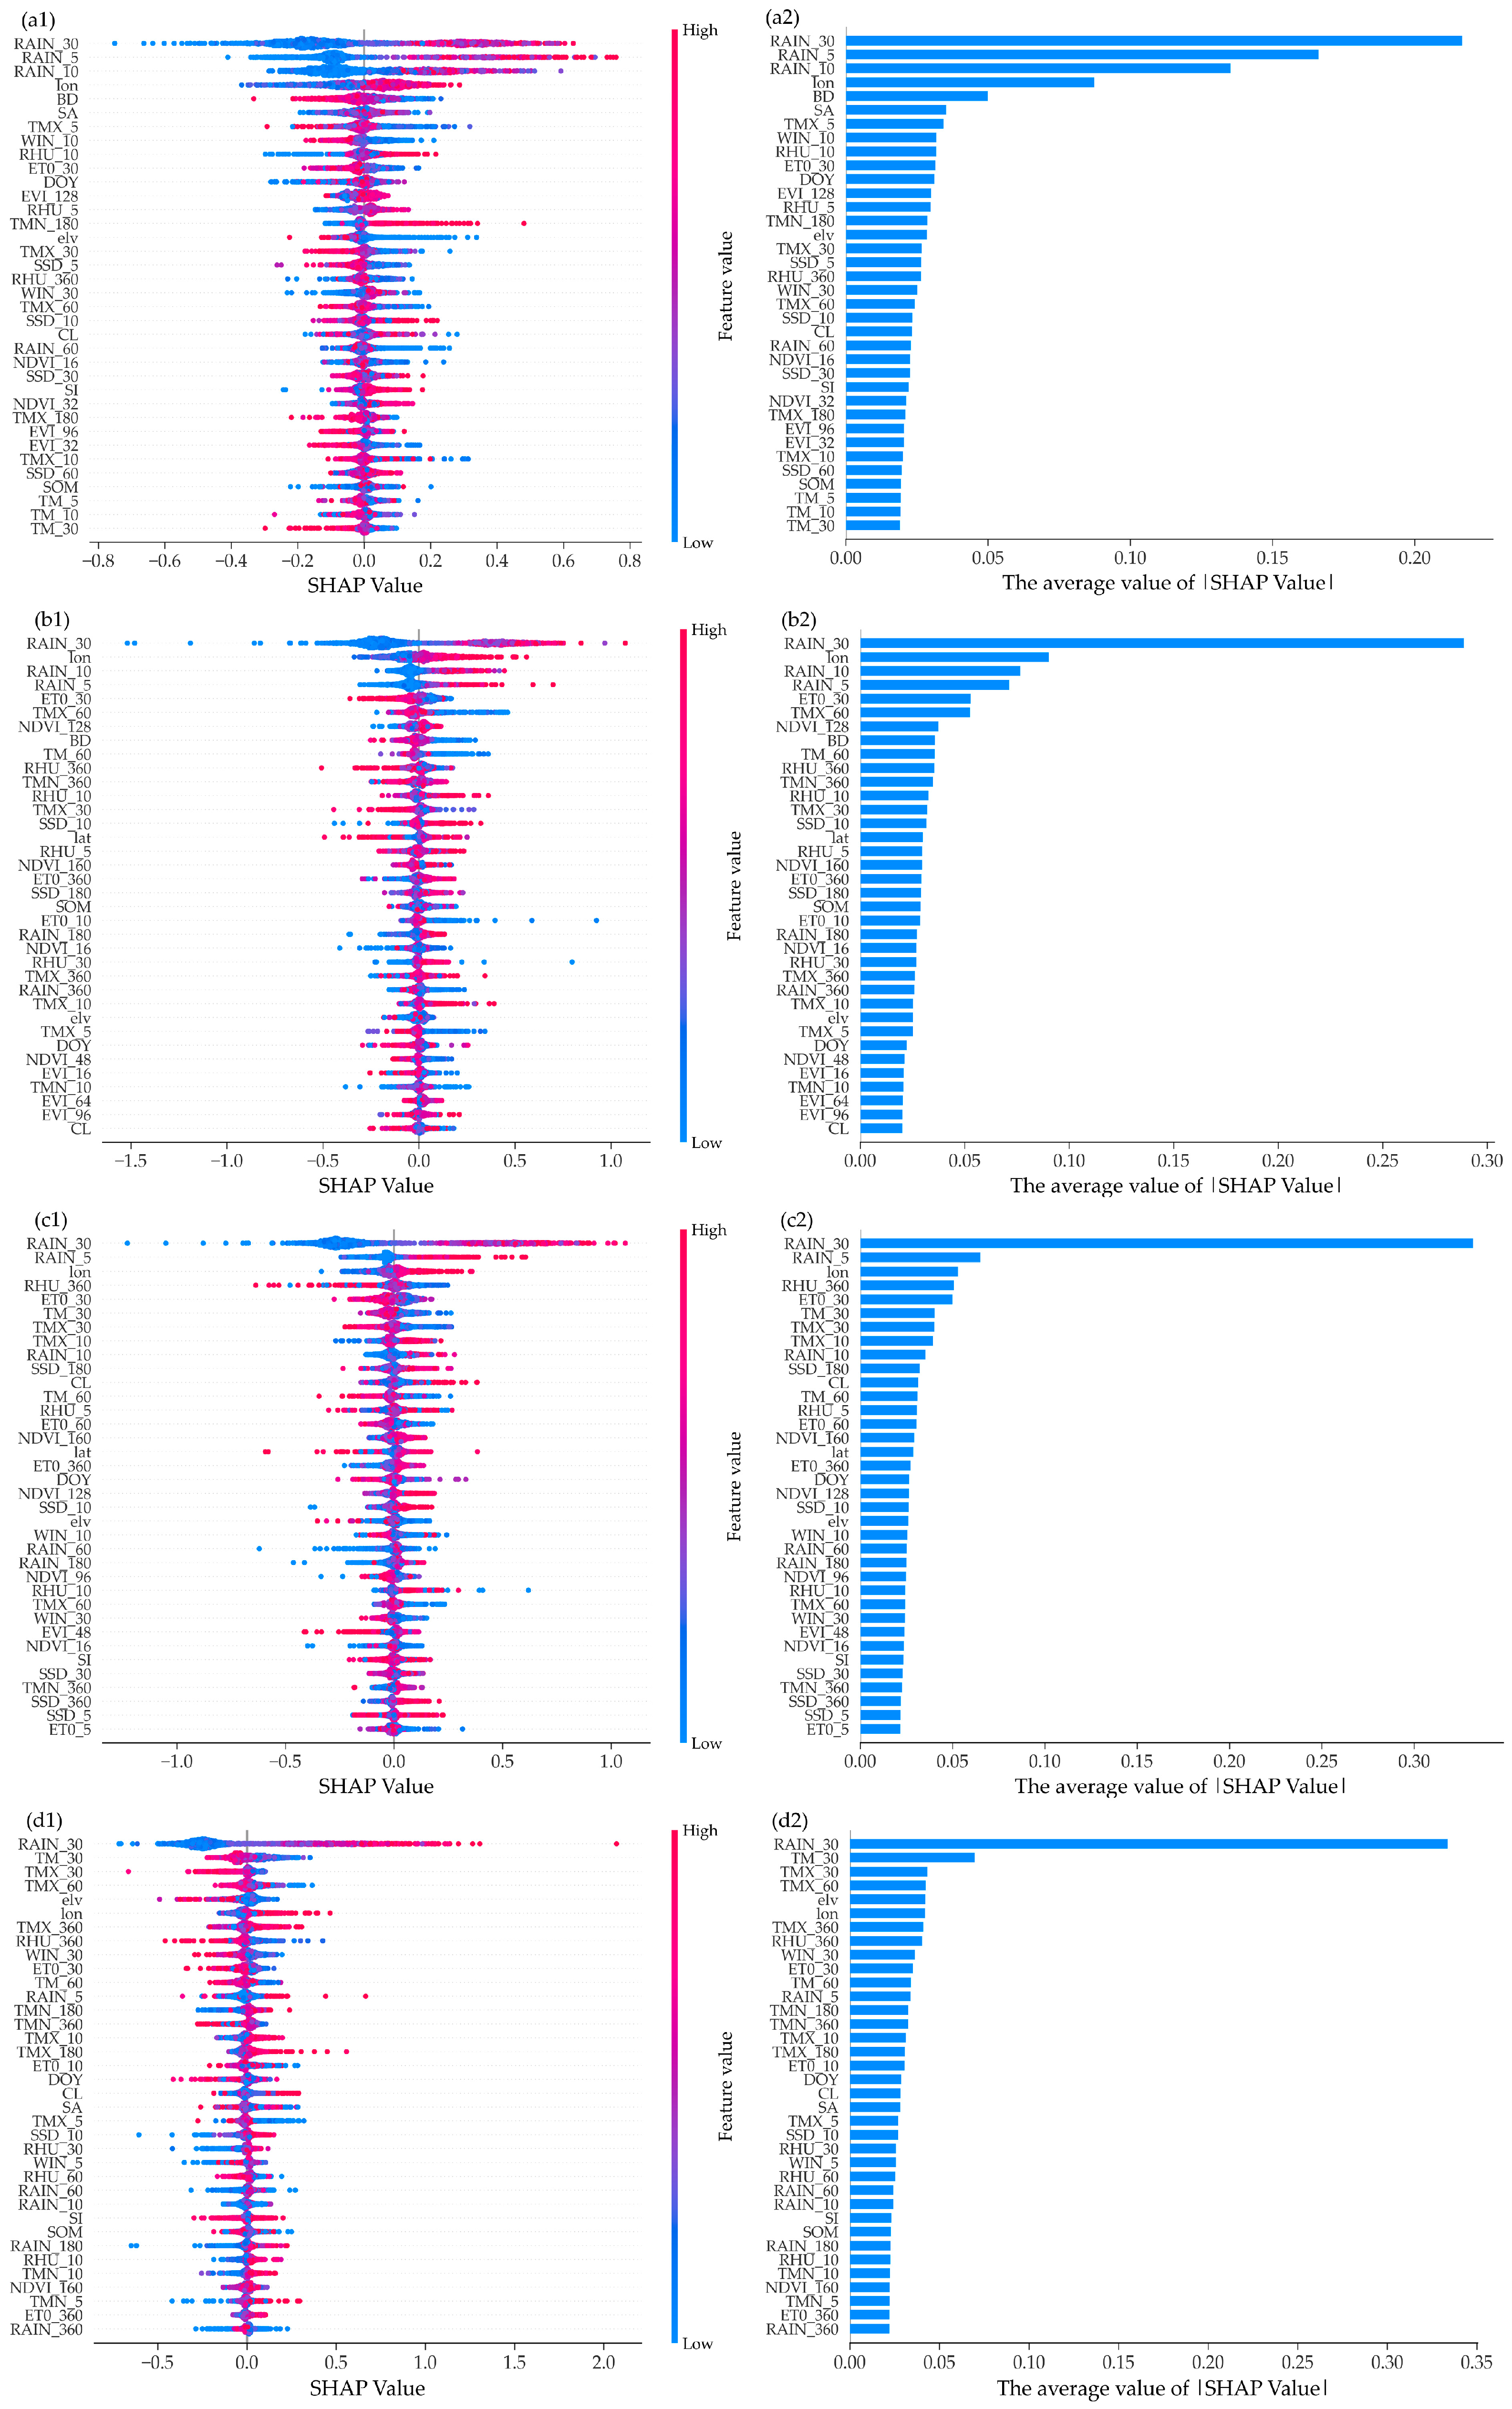
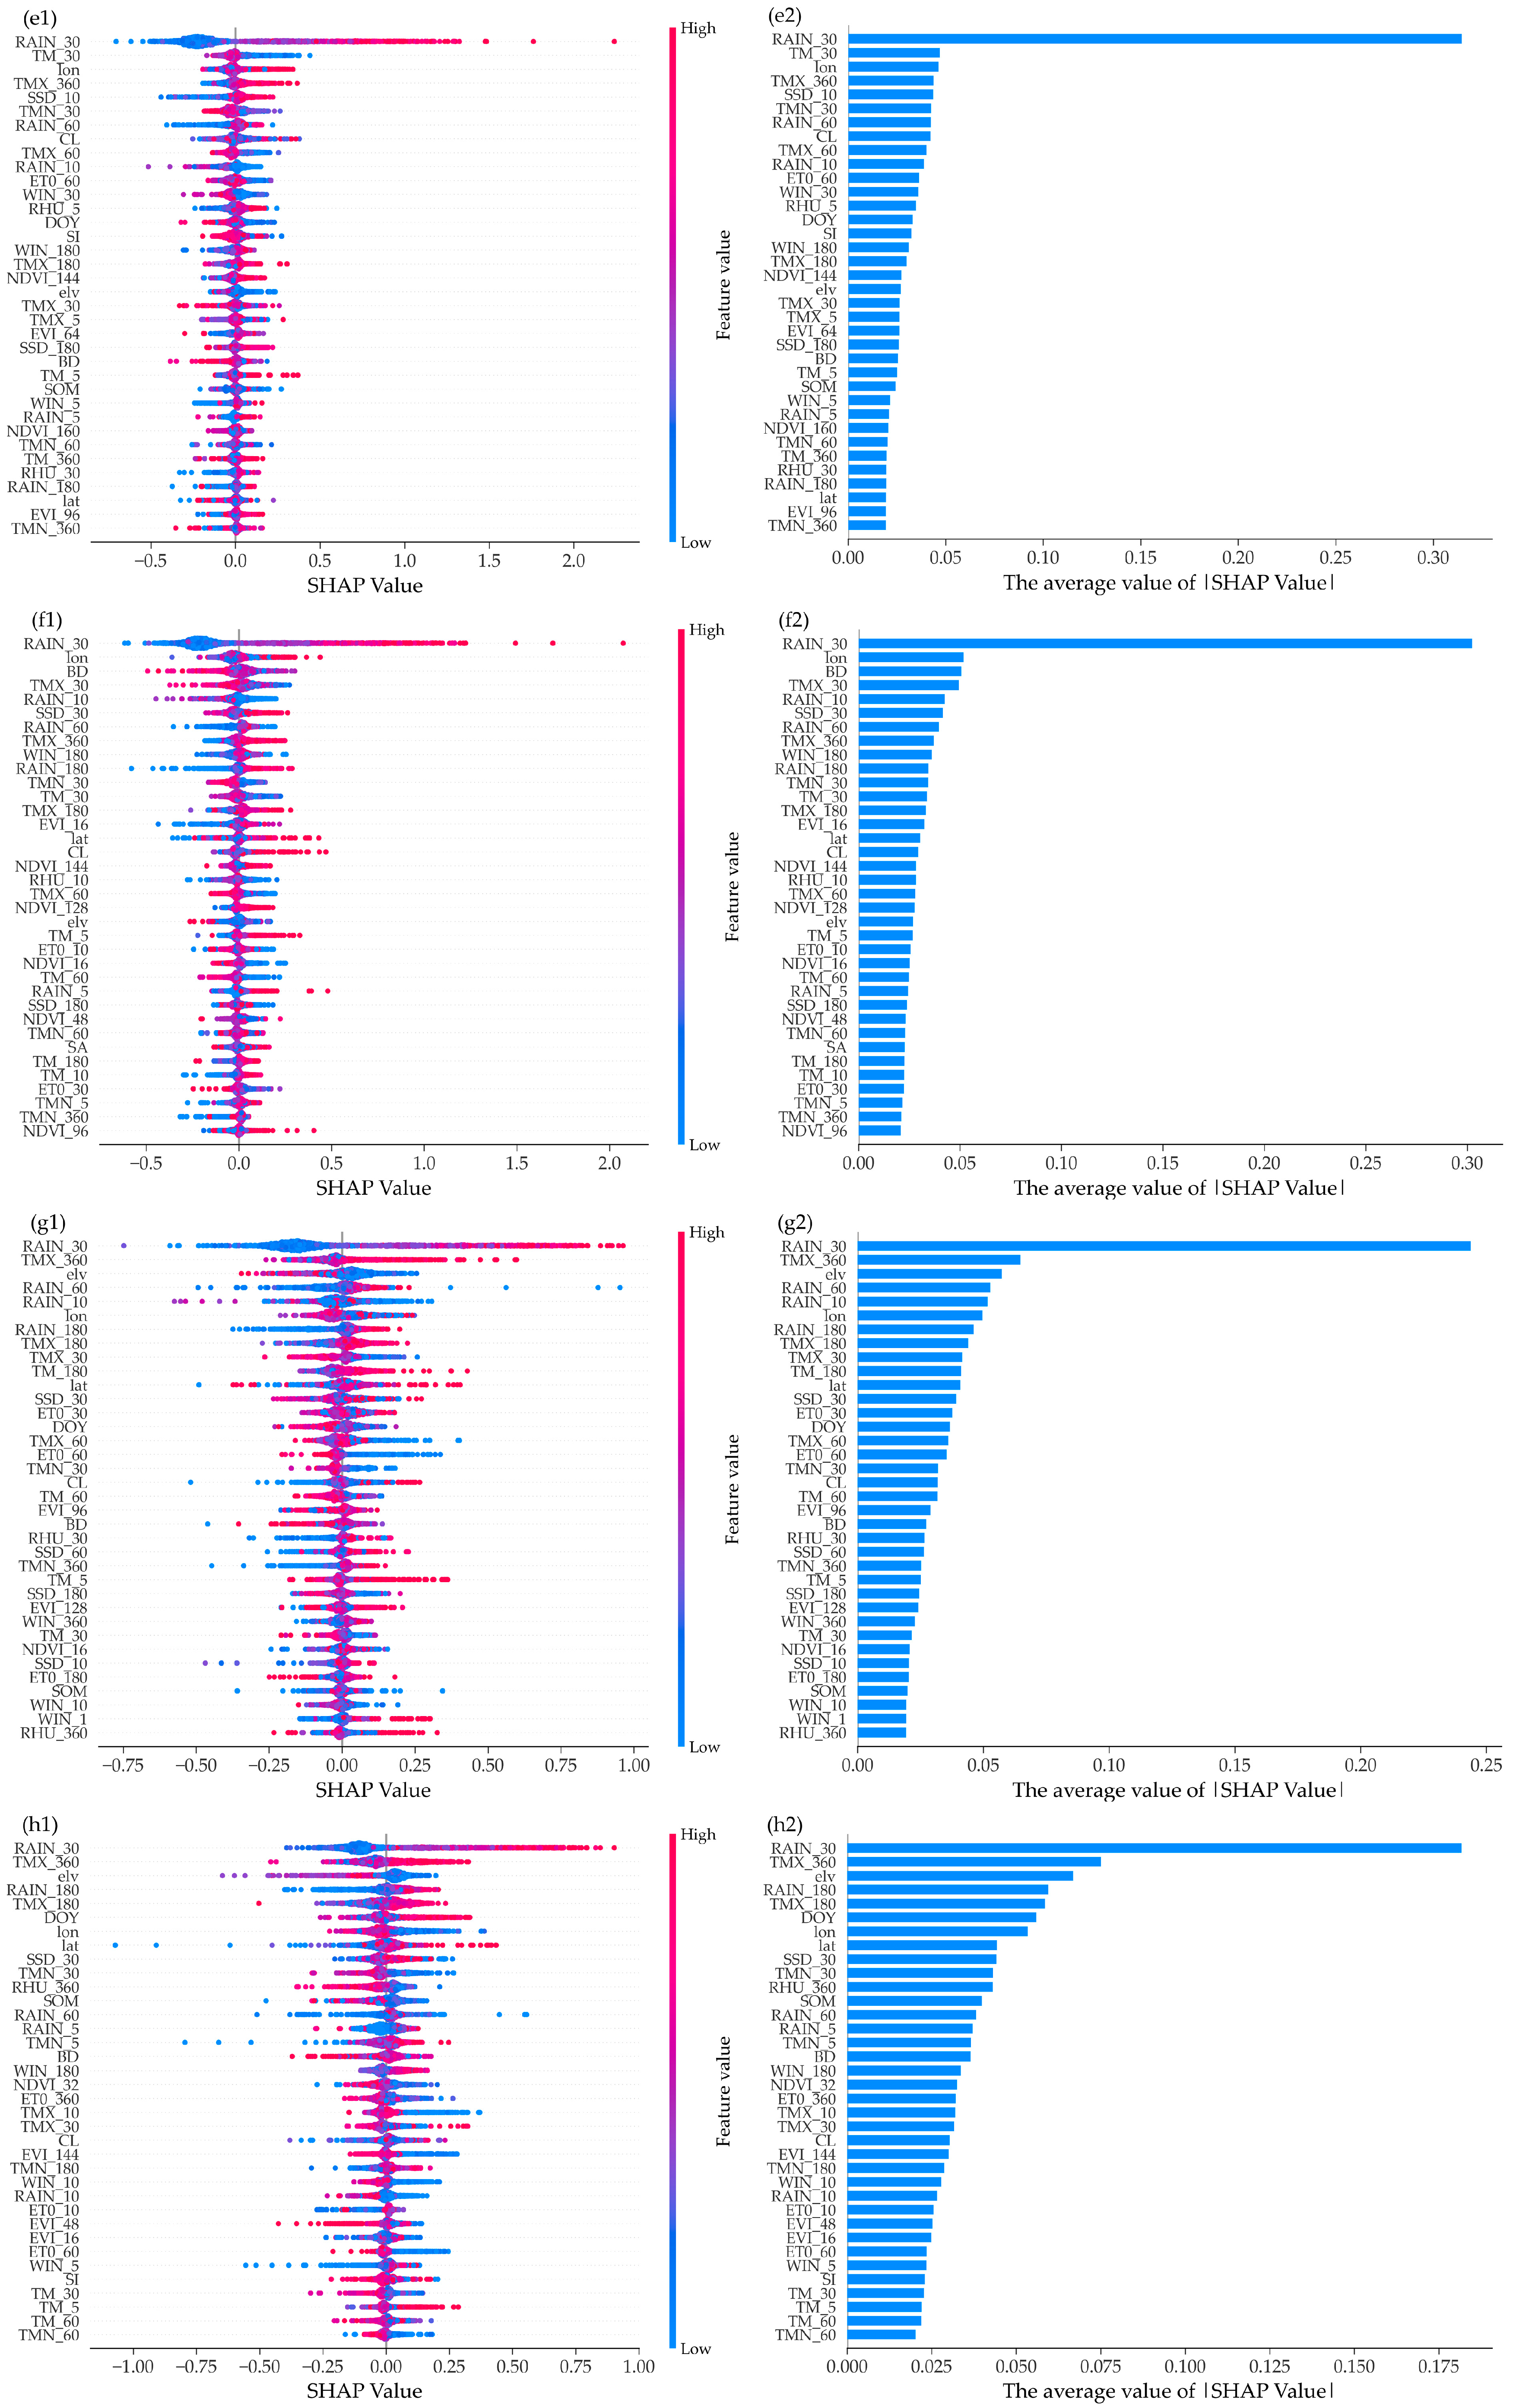
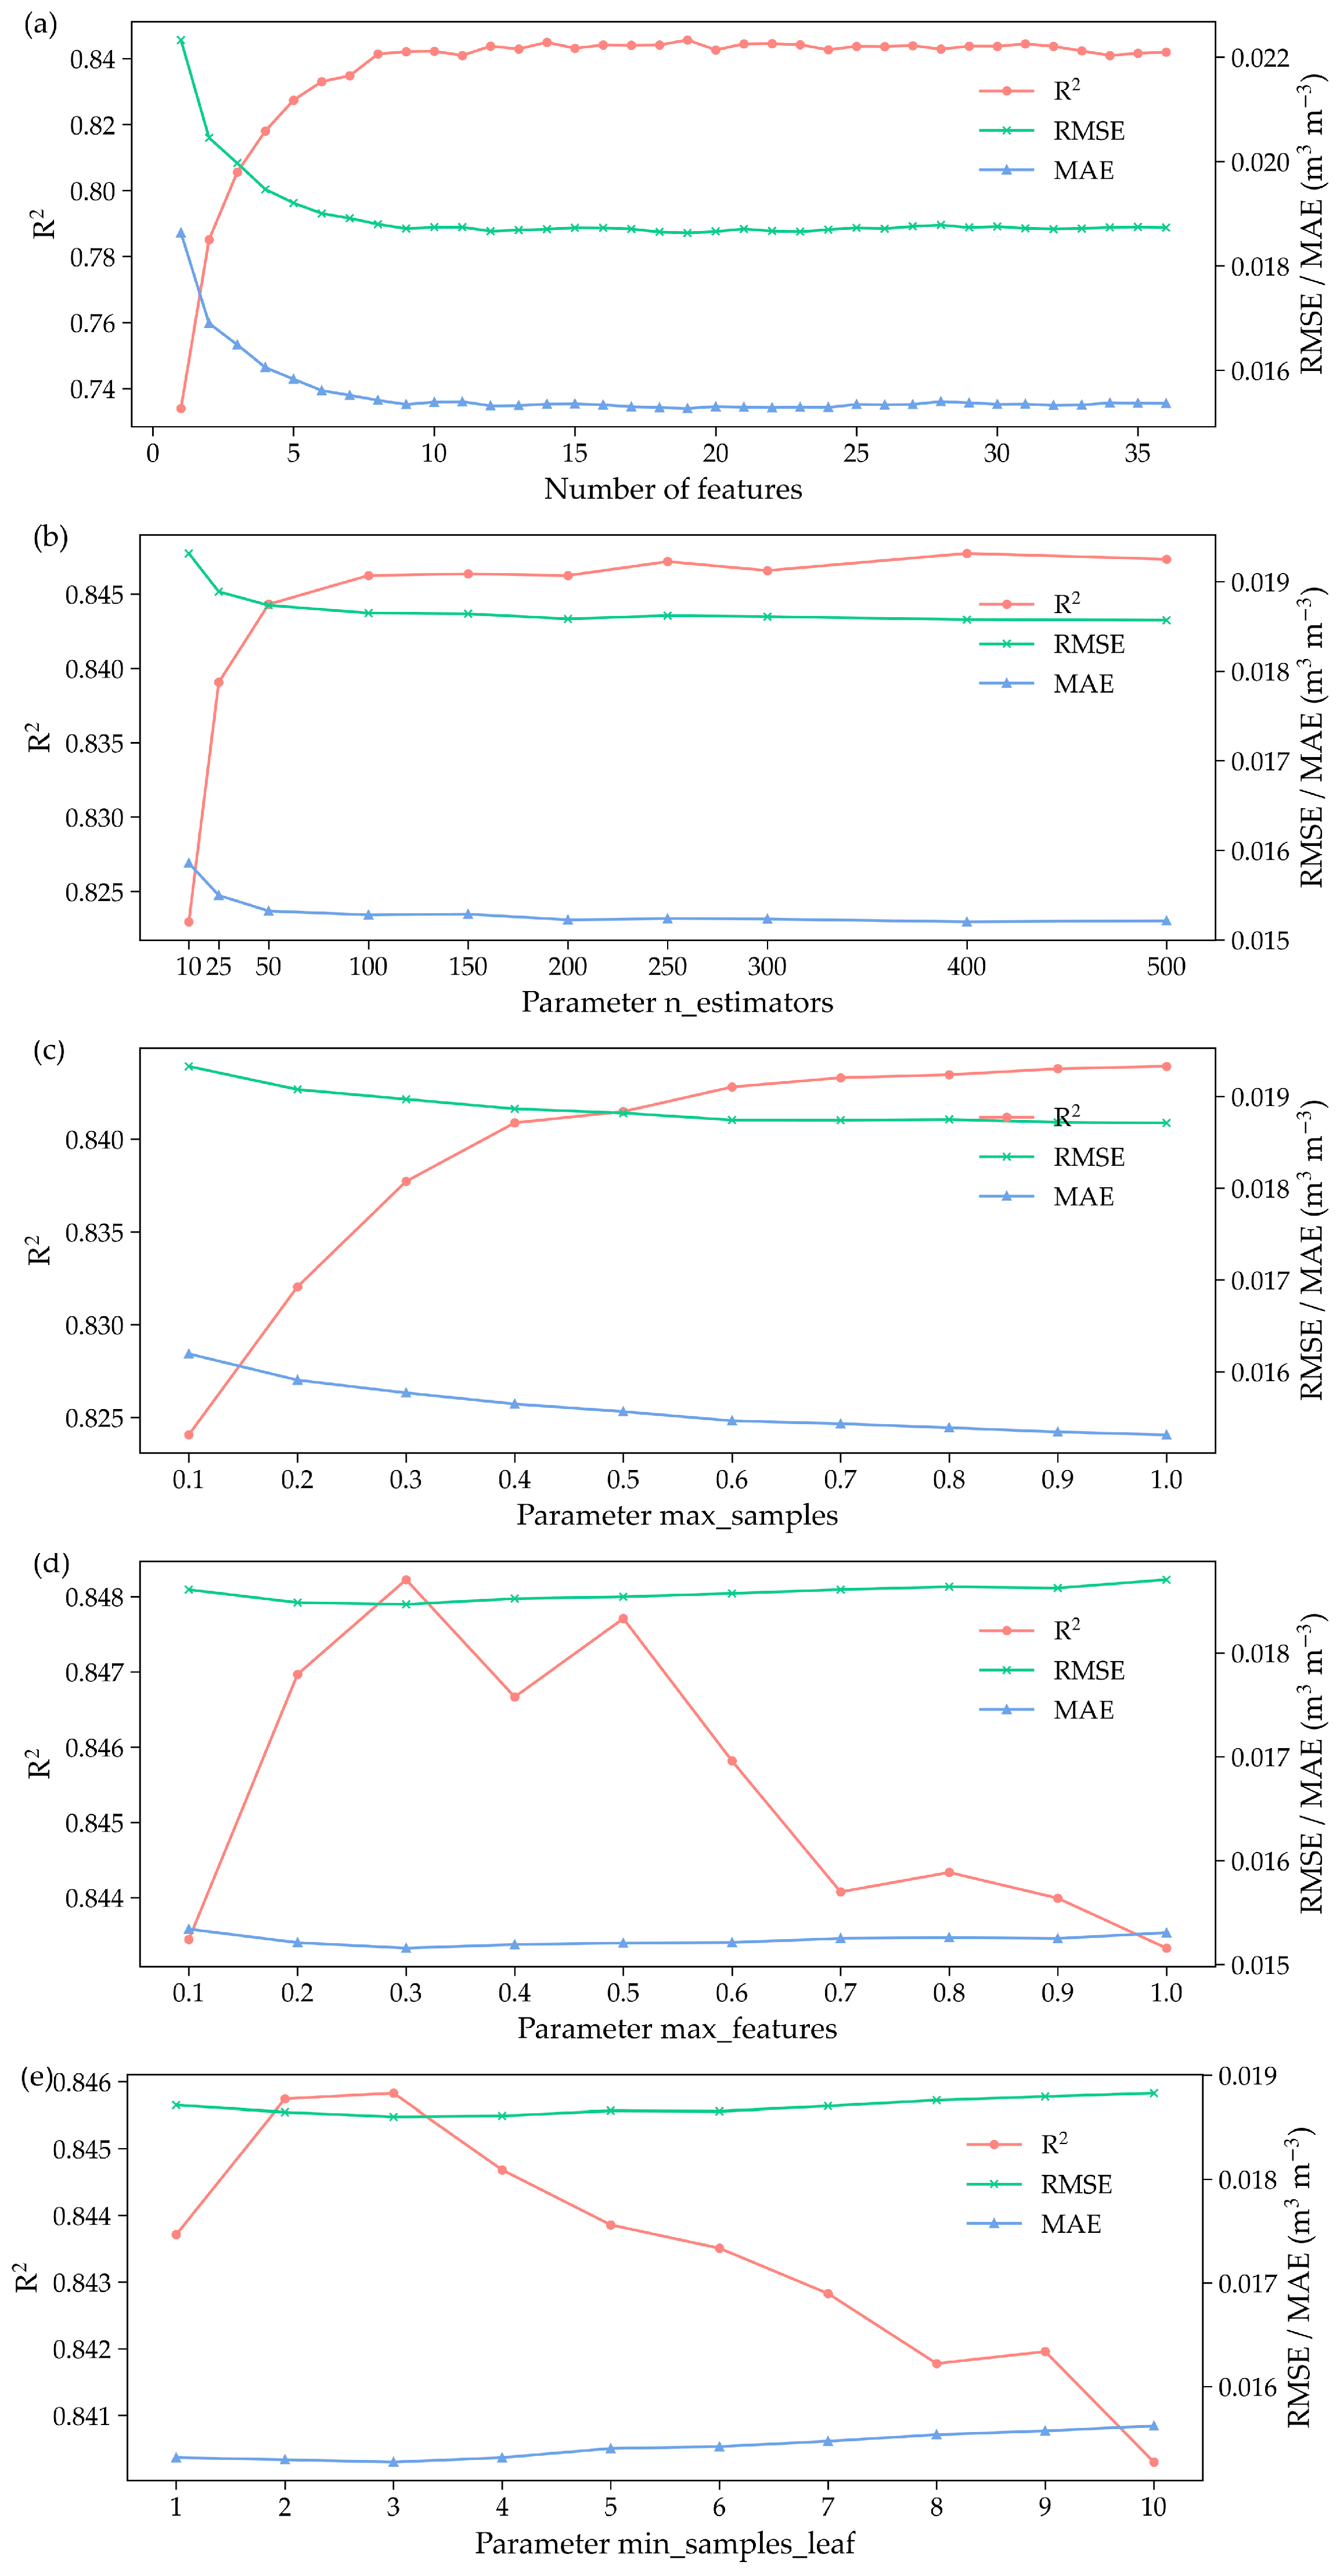
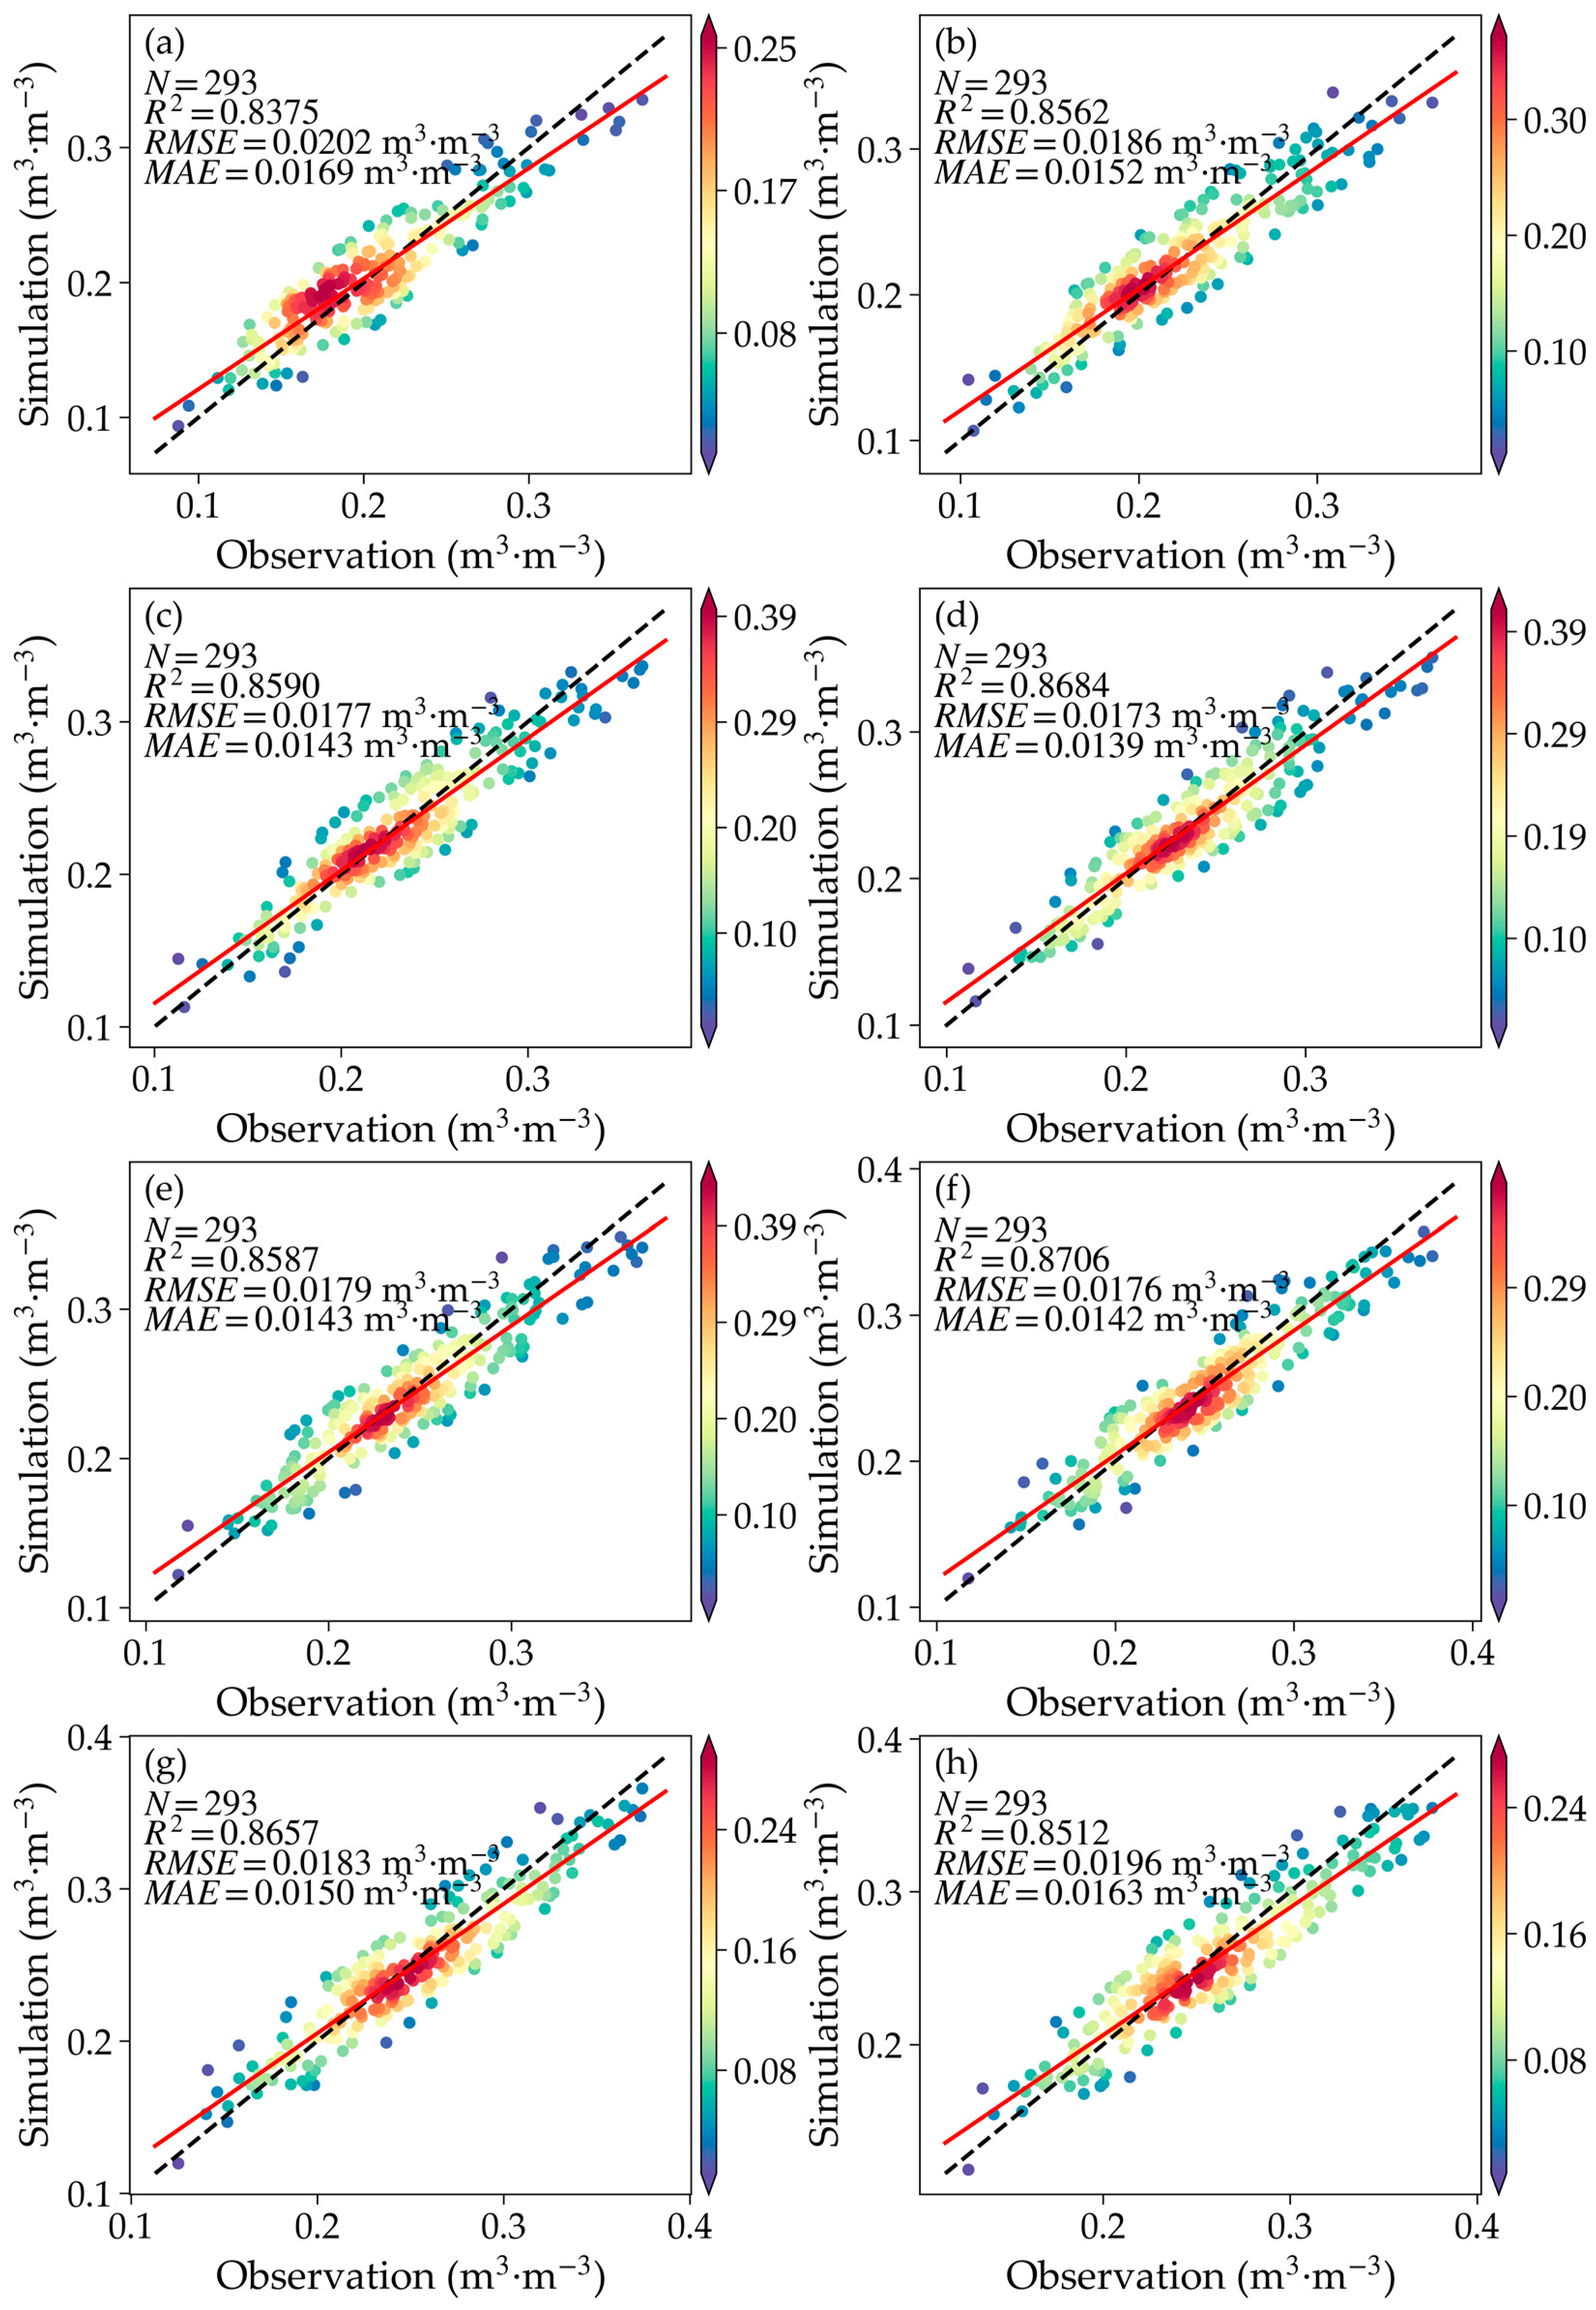
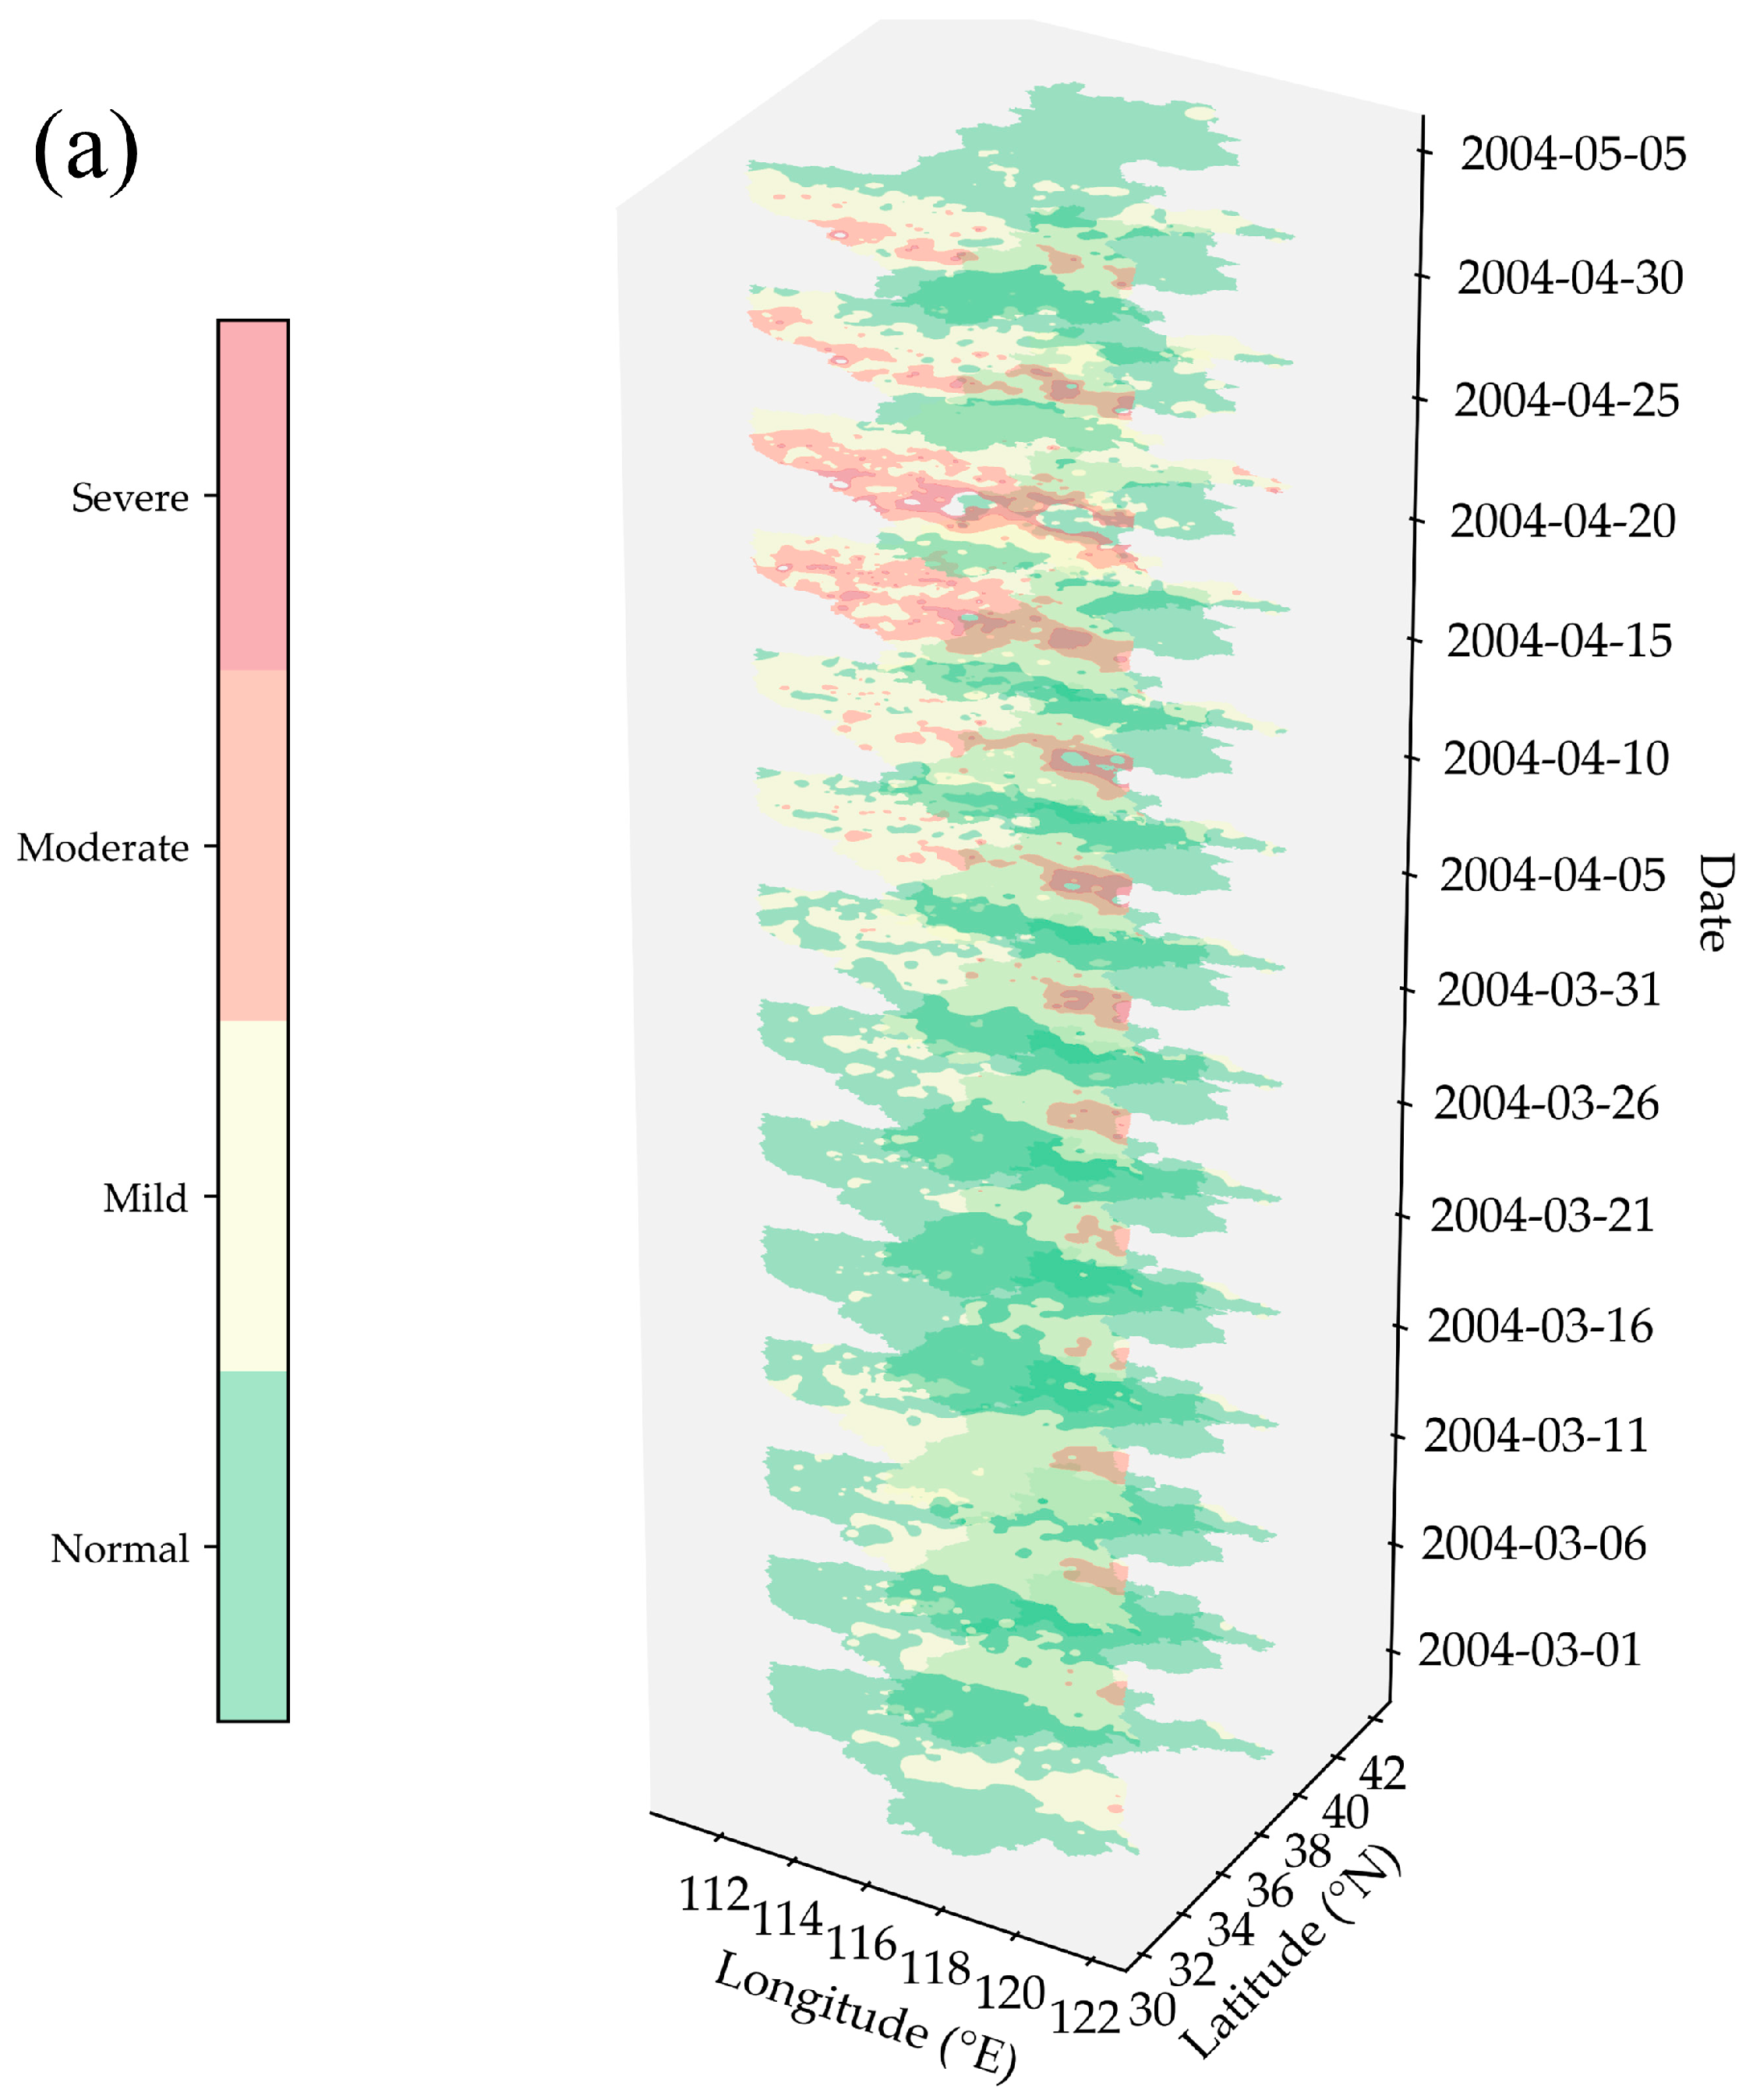
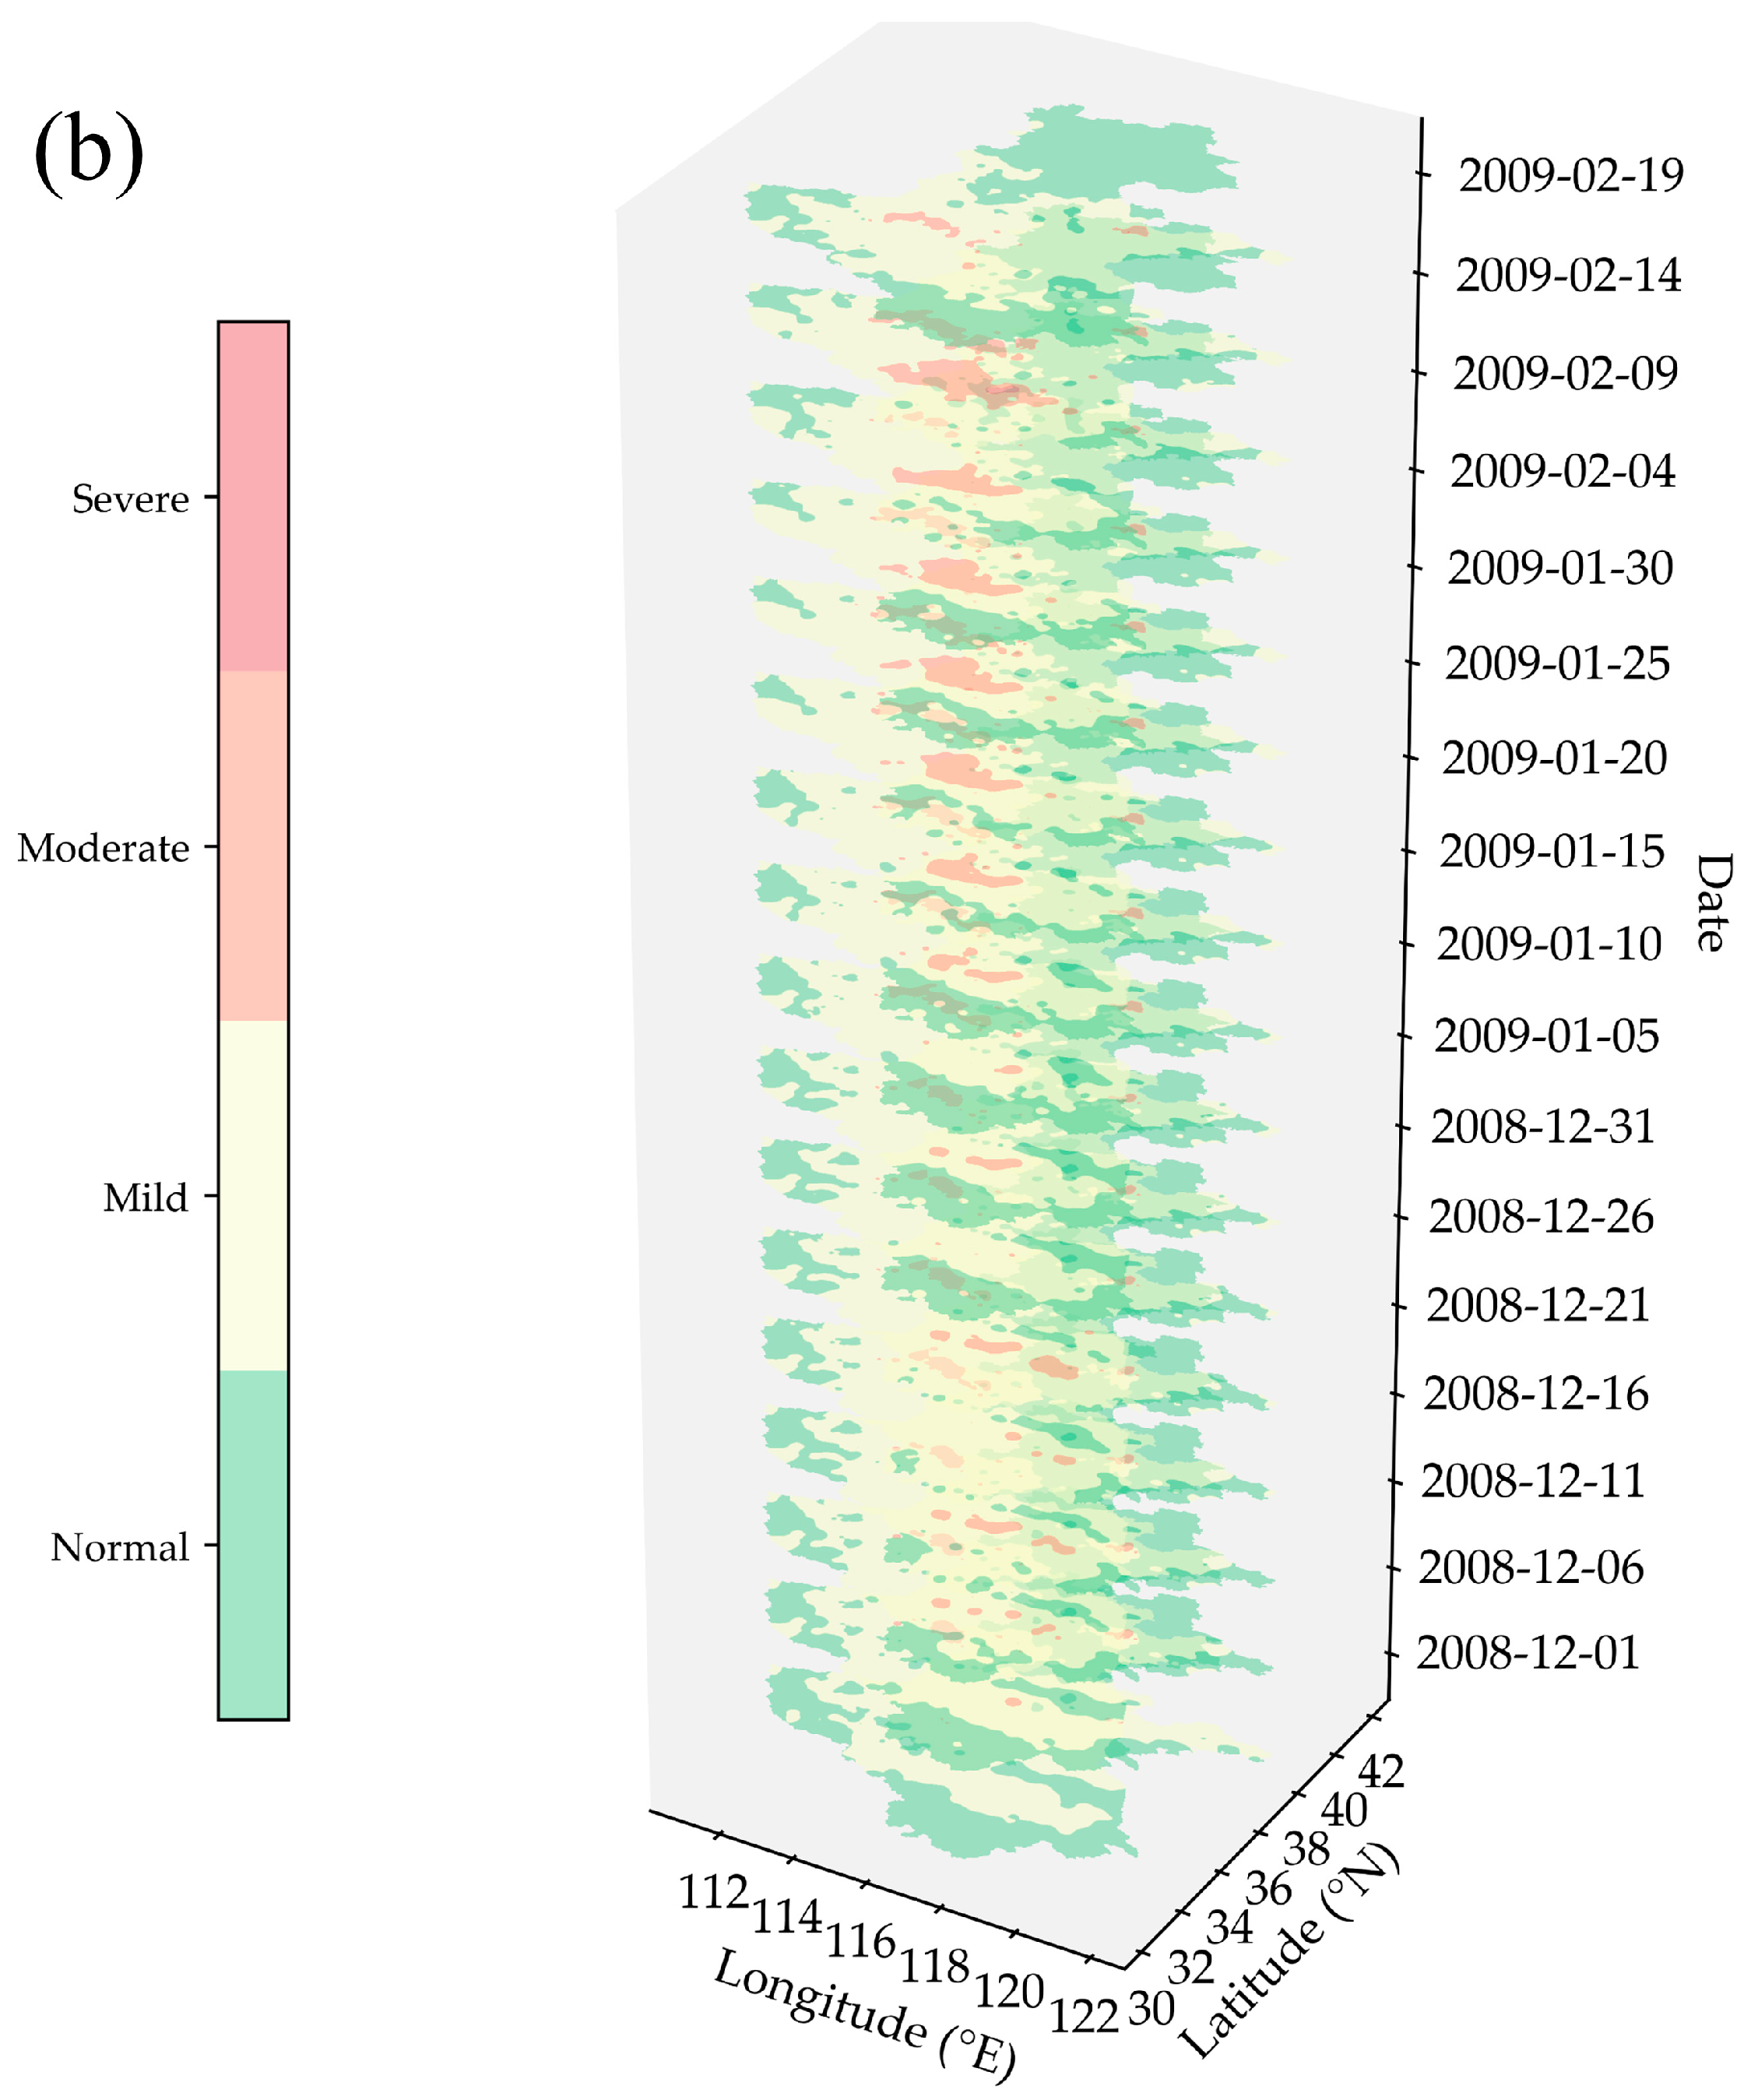

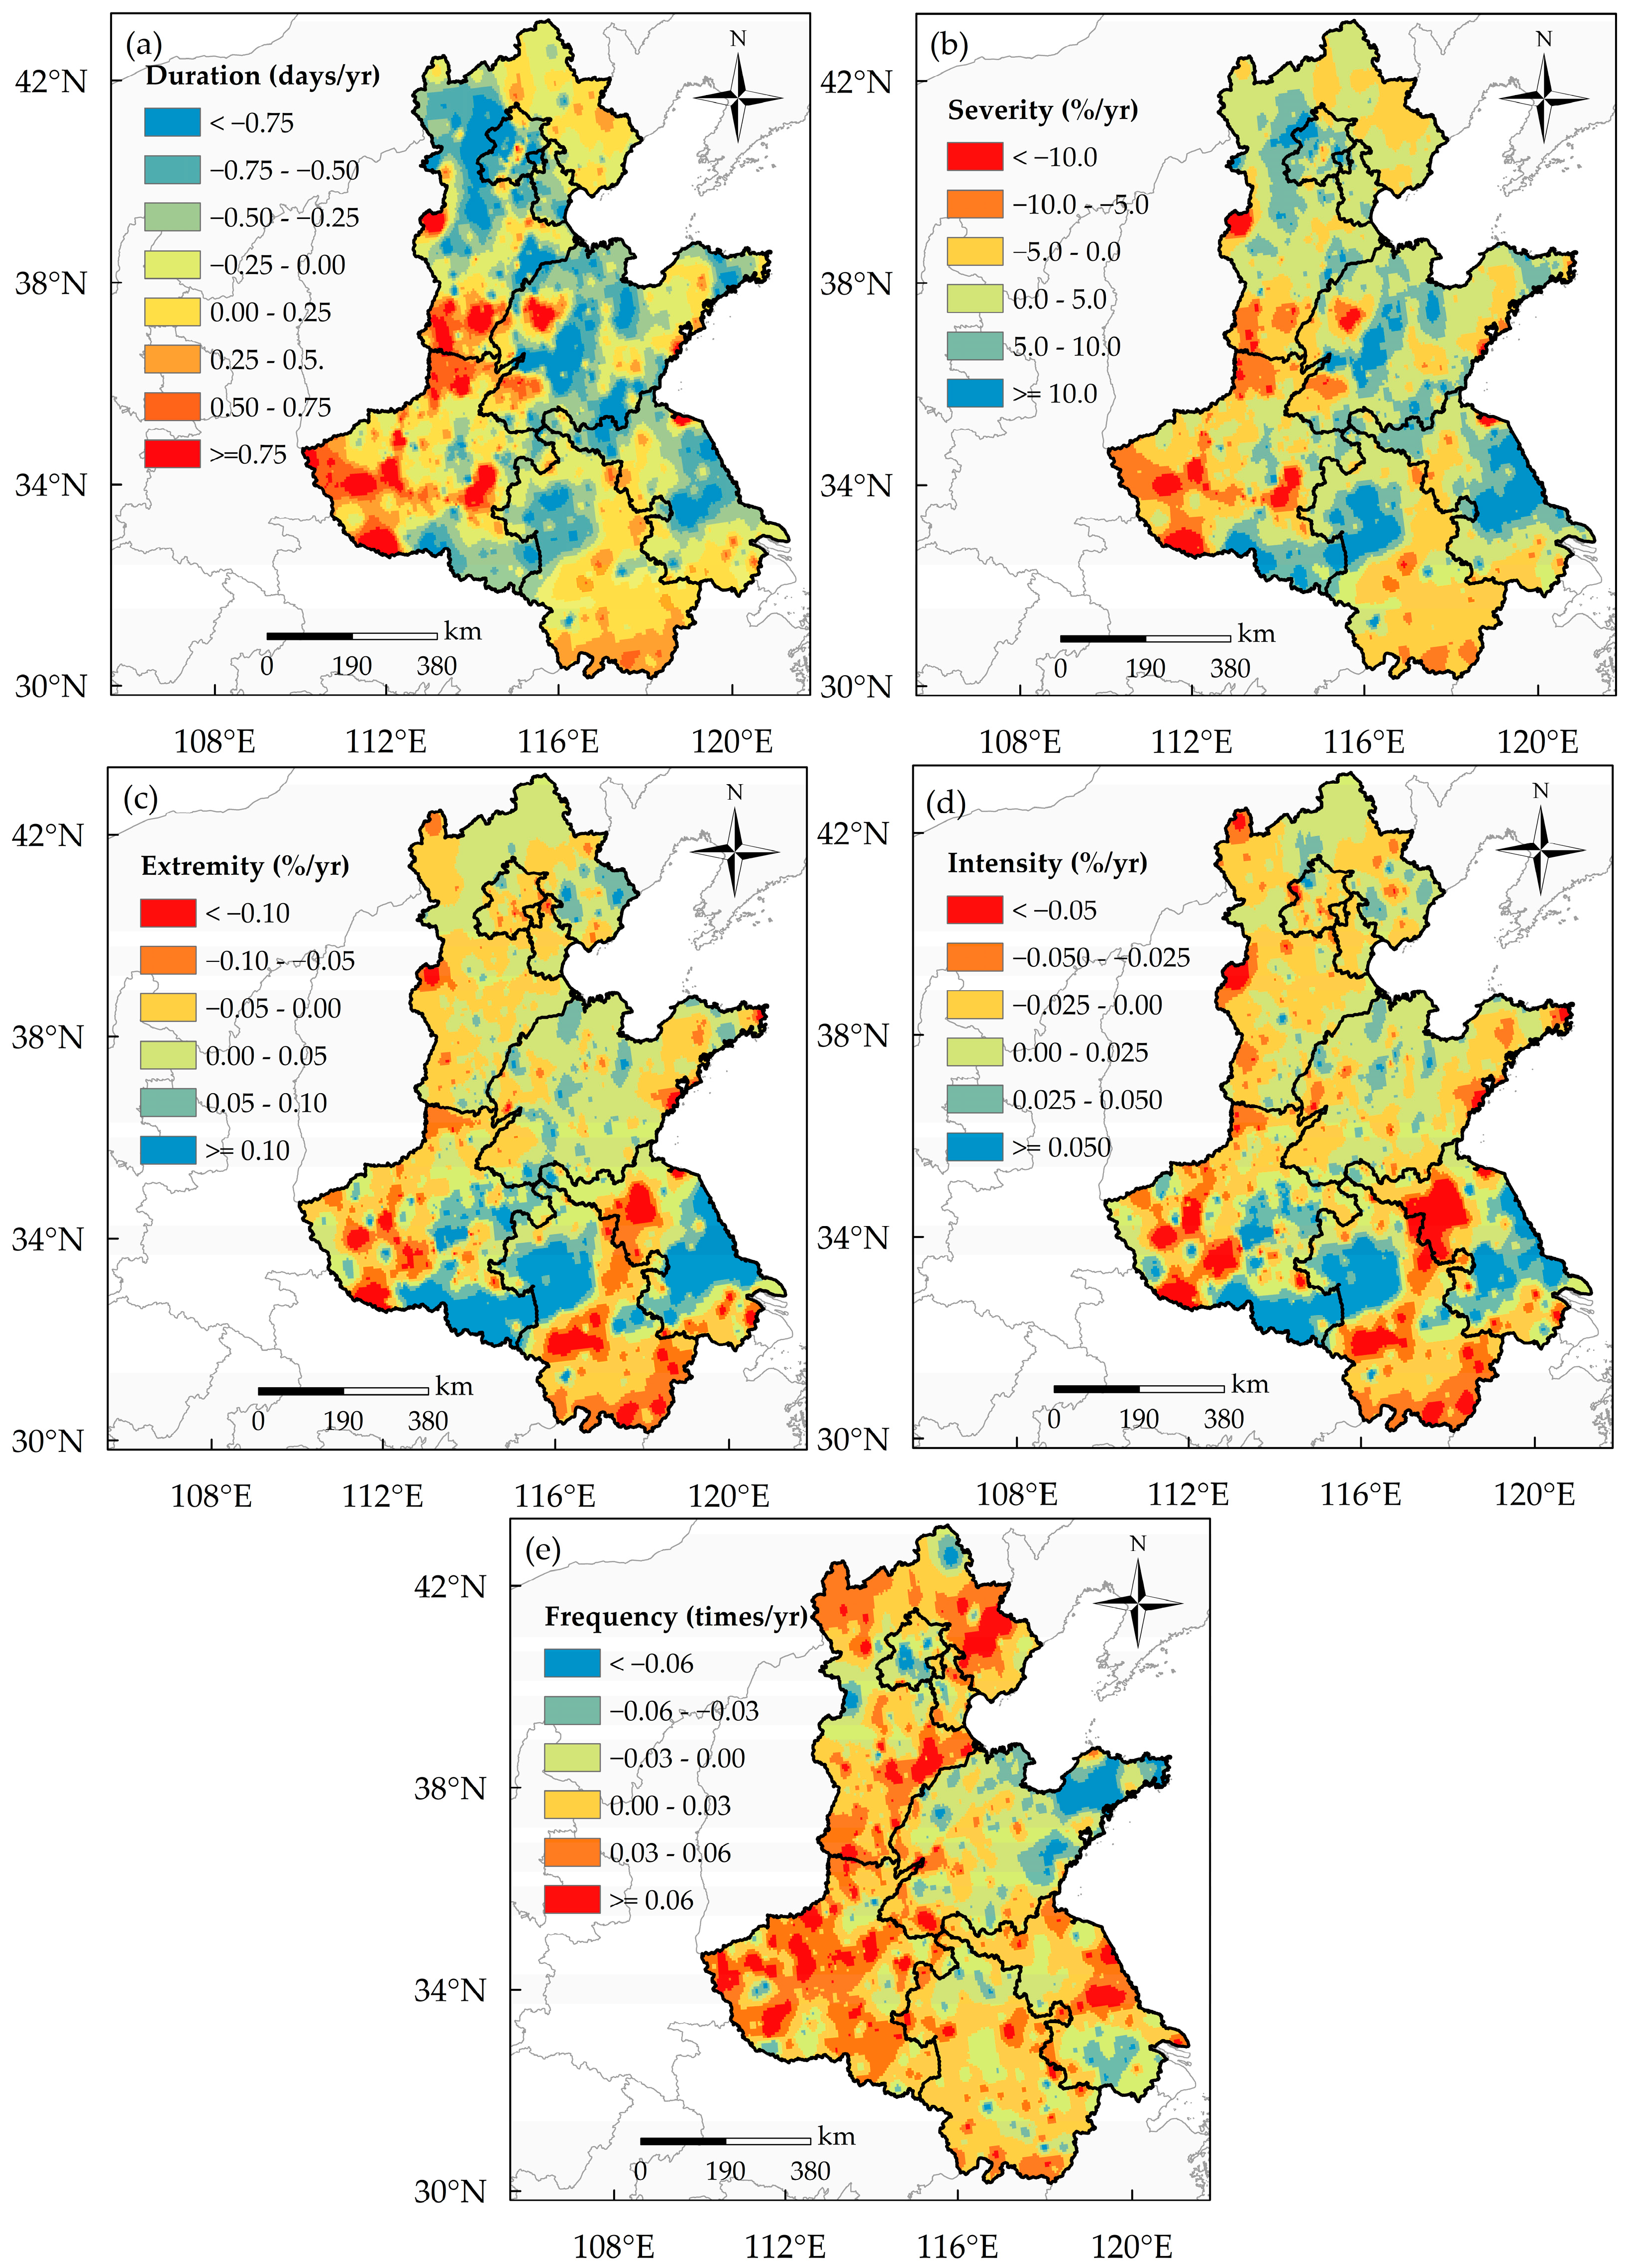
Disclaimer/Publisher’s Note: The statements, opinions and data contained in all publications are solely those of the individual author(s) and contributor(s) and not of MDPI and/or the editor(s). MDPI and/or the editor(s) disclaim responsibility for any injury to people or property resulting from any ideas, methods, instructions or products referred to in the content. |
© 2025 by the authors. Licensee MDPI, Basel, Switzerland. This article is an open access article distributed under the terms and conditions of the Creative Commons Attribution (CC BY) license (https://creativecommons.org/licenses/by/4.0/).