Article

Developmental Stages of Bell Pepper Influence the Response to Far-Red Light Supplements in a Controlled Environment

by
Awa Marina Mouliom-Ntapnze
,
Georges Yannick Fangue-Yapseu
and
Tagnon D. Missihoun
*
Groupe de Recherche en Biologie Végétale (GRBV), Department of Biochemistry, Chemistry, Physics and Forensic Science, Université du Québec à Trois-Rivières, Québec, QC G8Z 4M3, Canada
*
Author to whom correspondence should be addressed.
Agronomy 2025, 15(3), 732; https://doi.org/10.3390/agronomy15030732
Submission received: 4 February 2025 / Revised: 12 March 2025 / Accepted: 14 March 2025 / Published: 18 March 2025

Abstract

:
Far-red (FR) additions to white or red/blue light resulted in improved dry biomass and fruit nutritional quality. Despite these positive effects, FR supplementation was also found to induce the abortion of flowers and fruits. We hypothesized that the timing and duration of the FR supplements determine the positive or negative effects of the FR supplement on the plant. To examine this hypothesis, we compared the effect of a gradient of FR supplements (5.5, 12, and 18.1 μmol m−2 s−1) on bell pepper plants (Capsicum annuum cv. Margrethe) when they were exposed to the FR supplements at the beginning of their vegetative growth phase to when FR supplementation only began at the generative phase. We found that 12 and 18.1 μmol m−2 s−1 of FR supplements resulted in a higher yield than 5.5 μmol m−2 s−1 of FR supplements, but FR supplementation from the onset of flowering delayed fruit ripening by 5–8 days and decreased fruit yield compared to FR supplementation that began at seedling transplantation. These results indicate that the positive effect of the FR supplements on the pepper plants of the cultivar Margrethe depends on the plant’s stages of development, and a much lower FR intensity may suffice to enhance growth and yield.

1. Introduction

Light quality and intensity control plant growth and development. Variations in the spectral composition of light influence photosynthesis and the metabolism and physiology of plants [1,2]. Light quality for plant growth depends on the light’s spectral composition, i.e., the wavelength of the photons it contains. Photosynthetically active radiation (PAR) has long been accepted for photons from 400 to 700 nm [3]. Still, the contribution of far-red (FR) photons from 700 to 750 nm to photosynthetic activity has been overseen until recently [4]. Shorter wavelengths of FR light also contribute to photosynthesis via the Emerson effect [5,6]. A supplement of FR light ranging from 700 to 750 nm to the white light or red and blue light increased the accumulation of dry plant biomass [7,8] and promoted plant growth and yield [7,8,9,10,11,12,13]. Supplemental FR promoted lettuce yield (Lactuca sativa cv. Expertise RZ) at different planting densities [14]. It also positively impacted the morphology and pigmentation of lettuce and basil seedlings [15]. FR supplementation increased tomato fruit mass [16,17]. The benefit of end-of-day FR supplementation or constant lighting has also been assessed in diverse studies [16,18,19]. The positive effects of FR light on plant growth triggered much interest in its use in greenhouses and other controlled environments for food production [20,21]. However, despite the positive effects of FR on photosynthesis and growth, FR supplementation was also found to induce the abortion of flowers and fruits in peppers [22,23] and to reduce plant resistance to pathogens [20,24,25]. Although the wavelengths (700–750 nm) chosen for the FR supplement are almost identical in those studies, the intensity, timing, and duration of FR supplementation varied from one study to the other. The intensity, duration, and timing of FR supplements to light likely underlie the differences in the reported outcomes. For instance, short-term FR supplementation increased maize (Zea mays) volatile release, whereas prolonged FR supplementation showed the opposite response [26]. Likewise, continuous FR supplementation strongly promoted growth and photosynthesis in different rice (Oryza sativa) varieties, whereas end-of-day FR pulses prevented photosynthesis-promoting effects and elicited shade avoidance responses [27]. Higher FR levels led to more adventitious roots per tiller in wheat, whereas it decreased the adventitious root biomass of fava beans in a mixed stand. Inversely, higher FR levels reduced root depth in wheat but increased it in fava beans [28]. It appeared that the timing and duration of the FR supplements determine the positive or negative effects of the FR supplement on the plant. While the optimal timing might be difficult to define and harmonize for all species, crop development invariably encompasses a vegetative phase, where the shoot develops, and a generative phase, which starts at the onset of flowering and when fruits and seeds form. Depending on the crop and the production goals, the growers might adopt practices to boost the shoot growth or the flowering and fruit set. Many studies have focused on the intensity of FR light and the temporal parameters of its application (i.e., short-term, long-term, or at the end of the day). However, the optimal intensity of FR within the overall light spectrum and the assessment of its effects at the beginning of the vegetative cycle versus at the onset of the reproductive cycle have not been the subject of sufficient investigations. Therefore, in this study, we investigated how plant developmental stages influence the response to FR supplements in a controlled environment. For this, we compared the growth of bell pepper plants (Capsicum annuum cv. Margrethe) when they were exposed to FR supplements at the beginning of their vegetative growth phase, i.e., immediately after transplantation, to when FR supplementation only began at the generative phase, i.e., at the onset of flowering. We examined the effect of FR supplements on plant height, flower development, and fruit yield and quality.

2. Materials and Methods

2.1. Plant and Growth Conditions

To examine the effects of FR supplements on the plants, the experiments were conducted in a growth room at the Université du Québec à Trois-Rivières (46°21′1.22″ N, −72°34′20.79″ W, Quebec, QC, Canada). Pepper seeds of Capsicum annuum cv. Margrethe, which is widely cultivated in Quebec and Canada, were obtained from the company Enza Zaden in Canada. The seeds were sown in a plastic tray (40 cells) containing autoclaved soil at 105 °C for 21 min and then were kept in a growth chamber (Conviron GEN1000, Conviron, Winnipeg, MB, Canada) for germination. The seedlings obtained two weeks later were transplanted into individual plastic pots of about 1 liter each in volume (height: 10.5 cm; bottom diameter: 11.50 cm; top diameter: 15.50 cm) and transferred to a growth room. This growth room has been divided into three compartments of 1.84 m2 in area and 1.12 m in height each and separated by white blackout curtains reflecting light (Supplementary Figure S1). Each compartment was designated to represent an FR treatment, with a total of 28 plants arranged in 4 rows of 7 plants each. To account for the light distribution within each compartment, the analysis was conducted exclusively on the 14 central plants, located directly below the light fixtures. The other plants were used as border plants. The photoperiod was 16/8h light/dark. The photosynthetic photon flux density (PPFD) of the light was maintained at 110 μmol m−2 s−1. The temperature was 23/18 °C day/night, and the relative humidity was between 60 and 65%. To ascertain whether the far-red response exhibited by plants of the Margrethe cultivar is associated with the treatment and not with the cultivar itself, we utilized the Liberty Belle and Fresh Bites cultivars as reference.

2.2. Treatments

The plants were grown under white light provided by light-emitting diode (LED) fixtures (SF3, Sollum Technologies Inc., Quebec, QC, Canada) supplemented with three (03) different proportions of FR (Figure 1). The proportions of FR that were used were as follows: control treatment M1 (5.5 μmol m−2 s−1), treatment M2 (12 μmol m−2 s−1), and treatment M3 (18.1 μmol m−2 s−1) (Table 1). FR supplements were applied either to seedlings immediately after transplanting into individual pots at their early vegetative stage or as soon as a first flower appeared on a plant, i.e., at the onset of the generative phase. The two far-red application stages were carried out independently. The experiment with far-red application at the vegetative stage was repeated three times, and the one with far-red application at the reproductive stage was performed two times. Each experiment lasted about 120 days from the transplantation of the seedlings to individual pots to the harvesting of mature fruits and was repeated with a new batch of sown seeds. For each experiment, there were three levels of FR (three treatments), one level in one compartment at a time. Prior to the application of treatments at the reproductive stage, seedlings were first subjected to 5.5 μmol m−2 s−1 of FR for vegetative development in all three compartments. Then, as soon as the first flower appeared in one of the compartments, the treatments corresponding to M2 (12 μmol m−2 s−1) and M3 (18.1 μmol m−2 s−1) were separately applied in two compartments. As shown in Supplementary Figure S1, zone 1 represented the compartment with 5.5 μmol m−2 s−1 of FR supplement (M1), zone 2 for 12 μmol m−2 s−1 of FR supplement (M2), and zone 3 for 18.1 μmol m−2 s−1 of FR supplement (M3). Each compartment was 1.84 m2 (151 cm × 122 cm) in area with a height of 1.12 m and contained 28 plants (7 plants/row × 4 rows), with 14 central plants that served as experimental plants. To ascertain the impact of FR supplements administered during the reproductive stage on the flowering of plants, all flowers that had appeared prior to the application of the treatments were manually removed. The photon flux density (PFD) at the canopy level was monitored with a spectroradiometer (Li-180, LI-COR, Lincoln, NE, USA) and then adjusted weekly in each compartment throughout the production cycle to maintain a PPFD of 110 μmol m−2 s−1. At the end of the production cycle, pepper fruits of full red hue were deemed mature and were collected, diced into 50 mL Falcon tubes, and stored at −80 °C for biochemical analyses.

2.3. Photosynthetic Activity

The light and CO2 response curves were measured using the method described in [29], with some modifications. The Li-6800 (LI-COR, Lincoln, NE, USA) portable photosynthesis system simultaneously recorded photosynthetic gas exchange. CO2 flux and photosynthetic light were measured by clipping part of the leaf. Temperature and relative humidity were maintained at 25 °C and 50–55%, respectively. CO2 content was adjusted to maintain an inner chamber of 433 µmol CO2 m−2 s−l ambient level. The light source (88R:12B) supplied by the equipment and activated for automatic photon flux density (PFD) changes, with 120 to 240 s intervals, was used for photosynthetic measurements. Maximum assimilation rates (Amax) at saturated light and CO2 were calculated, respectively, from the A vs. PPFD and A vs. Ci curves by non-linear regression to hyperbolic function (y = yo + a × x/(b + x)). A represents the assimilation at each PPFD, and Ci represents the intracellular CO2 level estimated by Li-COR 6800 from the specified CO2 level in the surroundings of the leaf in the leaf chamber. The maximum quantum yield (α) and carboxylation efficiency (ε), the dark compensation point for CO2 (DCP) and light compensation point (LCP), and dark and light respiration (DR and LR) were estimated by the linear regression (y = mx + b) of the first curve points, respectively, as the initial slope of A vs. PPFD and A vs. Ci and the intersection with the x and y axes. Concerning the CO2 response curve, the various CO2 concentrations were obtained from the portable CO2/air mixture tank, automatically controlled by a CO2 injector. CO2 uptake rates were first measured at CO2 concentration levels close to 400, 300, 200, and 100 and later at 50, 100, 200, 300, 400, 600, 800, 1000, 1200, 1500, and 1800 µmol CO2 m−2 s−1. Light intensity was fixed at 1500 µmol CO2 m−2 s−1. Concerning the light response curve, the rate of light assimilation was measured at different intensities of 0, 20, 40, 60, 100, 200, 300, 600, 900, 1200, and 1500 µmol m−2 s−1.

2.4. Evaluation of Growth Parameters

The plant growth parameters were measured every week, starting from two weeks after the beginning of FR treatments. The recorded parameters included the plant height and internode length taken with a measuring tape, stem diameter measured with a caliper (MasterCraft, 6″ 150 mm), the number of leaves and nodes, and the leaf area of the 8th leaf determined by using the following formula [30]:
L A = 0.5   ( L × W )
where LA is the leaf area (cm2), L is the length of leaf, and W is the maximum width.
At the end of a production campaign (experiment), three plants per treatment were selected for root profile analysis. The roots were washed to remove soil, rapidly blotted in water-absorbing papers to remove the dripping water, and weighed. The root length was measured using a graduated ruler. Then, the roots were dehydrated at 80 °C for 48 h to determine their dry mass.

2.5. Flower Monitoring and Production Yield Determination

To examine the effect of FR on flowering in each FR treatment (compartment), the frequence of flower appearance was monitored for the first 14 days after the first flower appeared in the compartment. Every new flower during this period was tagged, the date of appearance was noted, and the tagged flowers were monitored for abortion or fruit formation, fruit growth, and time to maturation until fruit harvest. At maturation (time of full red hue; see Section 4), the fruits were harvested, weighed, and stored at −80 °C. This process enabled us to determine the frequency of flower production for 14 days after the first flower appeared in the compartment, the frequency of abortion, the average time to flowering, fruit set and ripening, and the fruit set rate for each treatment. To assess the impact of FR treatment, mature and immature fruits remaining on the fourteen experimental plants of the compartment were harvested and weighed at the end of the production campaign. Their weight was added to the weight of fruits that ripened and were collected earlier during the experiment to obtain the fruit yield. The yields were reported in kilograms for 14 plants (Kg/14 plants), and this was performed separately for each compartment (treatment) during an experiment. Every experiment lasted 120 days after seedling transplantation into individual pots. The two far-red application stages were performed independently for a total duration of about two years. The experiment with far-red application at the vegetative stage was repeated three times (first campaign: September 2022–January 2023; second campaign: July 2023–November 2023; and third campaign: June 2024–November 2024), and the one with far-red application at the reproductive stage was performed two times (first campaign: February 2023–June 2023 and second campaign: December 2023–April 2024).

2.6. Volume, Dry Matter, Thickness

Fruit volume (V) was calculated for all fruits based on the fruit length (l) and diameter (d) and by using Equation (2), assuming a cylindrical fruit shape.
V = 1 4 × π × l × d 2
The dry matter (dm) content of the fruit was assessed from 100 g of fresh matter of mature fruits harvested in each treatment. These fruits were diced and dehydrated using an incubator (Heratherm oven, Thermo Scientific, Mississauga, ON, Canada) at 65 °C for 48 h. The dry mass (Ps) obtained has been reported to the fresh weight of the initial fruit (Ph) to determine the dry matter according to Equation (3).
d m = P s P h × 100
The thickness of the fruit flesh was measured. For this, the lobes of the fruit were separated, and, using the caliper (Master Craft, 6″ 150 mm), measurements were taken at three different locations to obtain an average ± standard deviation of the thickness.

2.7. Soluble Sugar Contents

Total sugars were quantified by spectrophotometry according to the protocol described in [31]. The absorbance of the reaction was read at 490 nm with a spectrophotometer (UV-1280, Shimadzu Mandel, Guelph, ON, Canada). The quantification of sucrose, fructose, and glucose by High Performance Liquid Chromatography (HPLC) was performed by Innofibre (CEGEP Trois-Rivières, QC, Canada). The metabolite extraction was performed using solid–liquid separation followed by the injection of the samples into the HPLC machine (Ultimate 3000, Thermo Fisher Scientific, Waltham, MA, USA) with a detector system (Charged Aerosol Detection, Thermo Fisher Scientific, Waltham, MA, USA). Briefly, 1 g of fruit was crushed with mortar and pestle, as described above. After centrifugation at 15,000× g at 4 °C for 10 min, the supernatant was filtered with a 0.45 μm filter (Fisherbrand, Ottawa, ON, Canada). An equal volume of the filtered supernatant and 100% Optima Fisher grade acetonitrile (elution solvent) were mixed, transferred to 2 mL vials, and placed in the apparatus for analysis. The stationary phase consisted of a precolumn/column (Asahipak 4.6 × 10 mm/Asahipak 4.6 × 250 mm, Shodex HPLC columns, New York, NY, USA) at 20 °C. The mobile phase was composed of 100% milli-Q water (solvent A) and 100% acetonitrile (solvent B), and the flow rate was set at 1.3 mL/min. The elution of the compounds was performed in isocratic mode in the proportion of 15% A and 85% B. Chromeleon console software (Thermo Fisher Scientific, Waltham, MA, USA) was used for the chromatogram analysis and quantification of sugar concentrations (Supplementary Figure S2). Results were expressed in g L−1 g−1 fresh material as the mean ± standard deviation of three sample replicates.

2.8. Phenolic Content

The quantification of total polyphenols was conducted by the spectrophotometric method described in [32]. The absorbance of the reaction was read at 760 nm. A catechin solution of 50 mg mL−1 was used to make a standard curve (linear regression coefficient R = 0.993) that served to determine the polyphenols content of the extract as equivalent amounts of catechin concentration.

2.9. Ascorbic Acid Content

Vitamin C was measured by HPLC with a Diode Array Detector (Ultimate 3000, Thermo Fisher Scientific, Waltham, MA, USA). Briefly, the extraction of vitamin C was carried out from 1 g of fruit crushed in 80% methanol. After centrifugation at 15,000× g for 10 min at 4 °C, the supernatant was filtered with a 0.45 μm filter (Fisherbrand, Ottawa, ON, Canada) and transferred to 2 mL HPLC injection vials. The stationary phase was a C18 column (Kinetex 150 × 2.1 mm, 5 μM, Phenomenex columns, Torrance, CA, USA) at 40 °C. The mobile phase was composed of 0.1% formic acid in milli-Q water (solvent A) and 100% acetonitrile grade HPLC (solvent B), and the flow rate was set at 1 mL min−1. The elution of the compounds was performed in gradient mode in the starting proportion of 90% A and 10% B. The retention peak and maximum UV absorption bands of pure standards served to identify the compound. Chromeleon console software (Version 7.3, Thermo Fisher Scientific, Waltham, MA, USA) was used for chromatogram analysis and the quantification of vitamin C concentration. Results were expressed in grams per liter (g L−1) per gram of fresh material as the mean ± standard deviation of three replicates.

2.10. Lycopene Content

Lycopene was quantified by a spectrophotometric method described in [33]. The absorbance (A) of the extract was measured at 472 nm, and the amount of lycopene content was calculated with Equation (4):
C = A × F . d × 10 6 × V e × 100 × P
where C is the concentration in μg g−1 of fresh material, A is the absorbance at 472 nm, F.d is the dilution factor, Ve is the volume of the total extract, ε is the molar extinction coefficient of hexane (3450 M−1 cm−1), and P is the weight (in gram) of fruit used for total extract.

2.11. Antioxidant Activities

The antioxidant compounds were extracted from 1 g of fresh fruit crushed in 1.5 mL of 80% methanol. The mixture was centrifuged, and the supernatant was used to determine the antioxidant activities of the fruit. The antioxidant ability of the extract to scavenge 2,2-diphenyl-1-picryhydrazyl (DPPH) free radicals was assessed by the method of [34], with modifications. In this assay, the strength of the antioxidant activity of the extract corresponds to the degree of discoloration of the DPPH solution by the extract. Fifty microliters (50 µL) of the extract were mixed with 1450 µL of a methanolic solution of DPPH radicals (6 × 10⁻⁵ mol L−1) (Sigma-Aldrich, Oakville, ON, Canada). The mixture was vigorously stirred and left in the dark at room temperature for 60 min until stable absorbance values were obtained. The absorbance of the reaction was read at 517 nm with a spectrophotometer (UV-1280, Shimadzu Mandel, Guelph, ON, Canada). The antioxidant activity was expressed as the ratio of the absorbance of the solution containing the extract to the absorbance of the DPPH solution without the extract.
The antioxidant ability of the extract to scavenge 2,2′-azinobis-(3-ethylbenzothiazoline-6-sulfonic acid) free radicals (ABTS•+) was assessed by the method of Samaniego et al. (2007) [35], with some modifications. The radical ABTS•+ was generated by mixing an equal volume of a potassium persulphate solution with ABTS•+ (Thermo Scientific, Mississauga, ON, USA). After agitation, the mixture was placed in darkness for 12 to 16 h. The solution obtained was diluted with PBS (phosphate-buffered saline) to an absorbance of 0.70 ± 0.02, λ = 734 nm. For the reaction, the methanolic extract 50 µL was added to 1450 µL of the ABTS•+ solution. The mixture was stirred vigorously and incubated at room temperature in the dark for 10 min. The absorbance of the reaction mixture was read at 734 nm with a spectrophotometer against a blank (ABTS•+ solution). The percentage of scavenged free radicals was expressed as the ratio of the absorbance of the solution containing the extract to the absorbance of the ABTS•+ solution without the extract.

2.12. Statistical Analysis

The data were expressed as mean ± standard deviation. Analysis of variances (one factor) of the data and comparison of means were performed using Tukey’s post hoc test at the 5% probability level (p < 0.05) using GraphPad Prism 8.0 software.

3. Results

3.1. Photosynthesis Rate Remains Similar for FR Supplements During the Vegetative and the Reproductive Phases

To compare the influence of FR supplements before and after flowering on plants, bell pepper plants (Capsicum annuum var. Margrethe) were illuminated with a full spectrum white light supplemented with far-red light at three levels: 5.5 μmol m−2 s−1 (M1), 12 μmol m−2 s−1 (M2), or 18.1 μmol m−2 s−1 (M3). M1 was taken as a reference for FR treatment. When FR supplements were started early in the vegetative phase, the plant photosynthesis, maximum quantum yield, and respiration levels in response to the photosynthetic light intensity were similar in all three FR treatments (Table 2 and Table 3, Supplementary Figure S3). There was only a slight photosynthesis increase in response to CO2 in the M2 treatment. In contrast, when FR supplements were delayed and given upon the appearance of the first flower bud, the maximum quantum yield of the plants in response to the light intensity was superior in the M1 treatment compared to M2 and M3 treatments, whereas the efficiency of carboxylation in response to CO2 was similar for M1 and M3 but low in M2. The rates (Amax) of CO2 assimilation were identical in all FR treatments either in response to light intensity or CO2. These data indicated that FR supplements during the vegetative or upon flowering only had minor impacts on photosynthesis in our study.

3.2. FR Supplements to the Lighting Stimulated Sweet Pepper Growth Both During the Vegetative Growth and the Reproductive Growth Phases

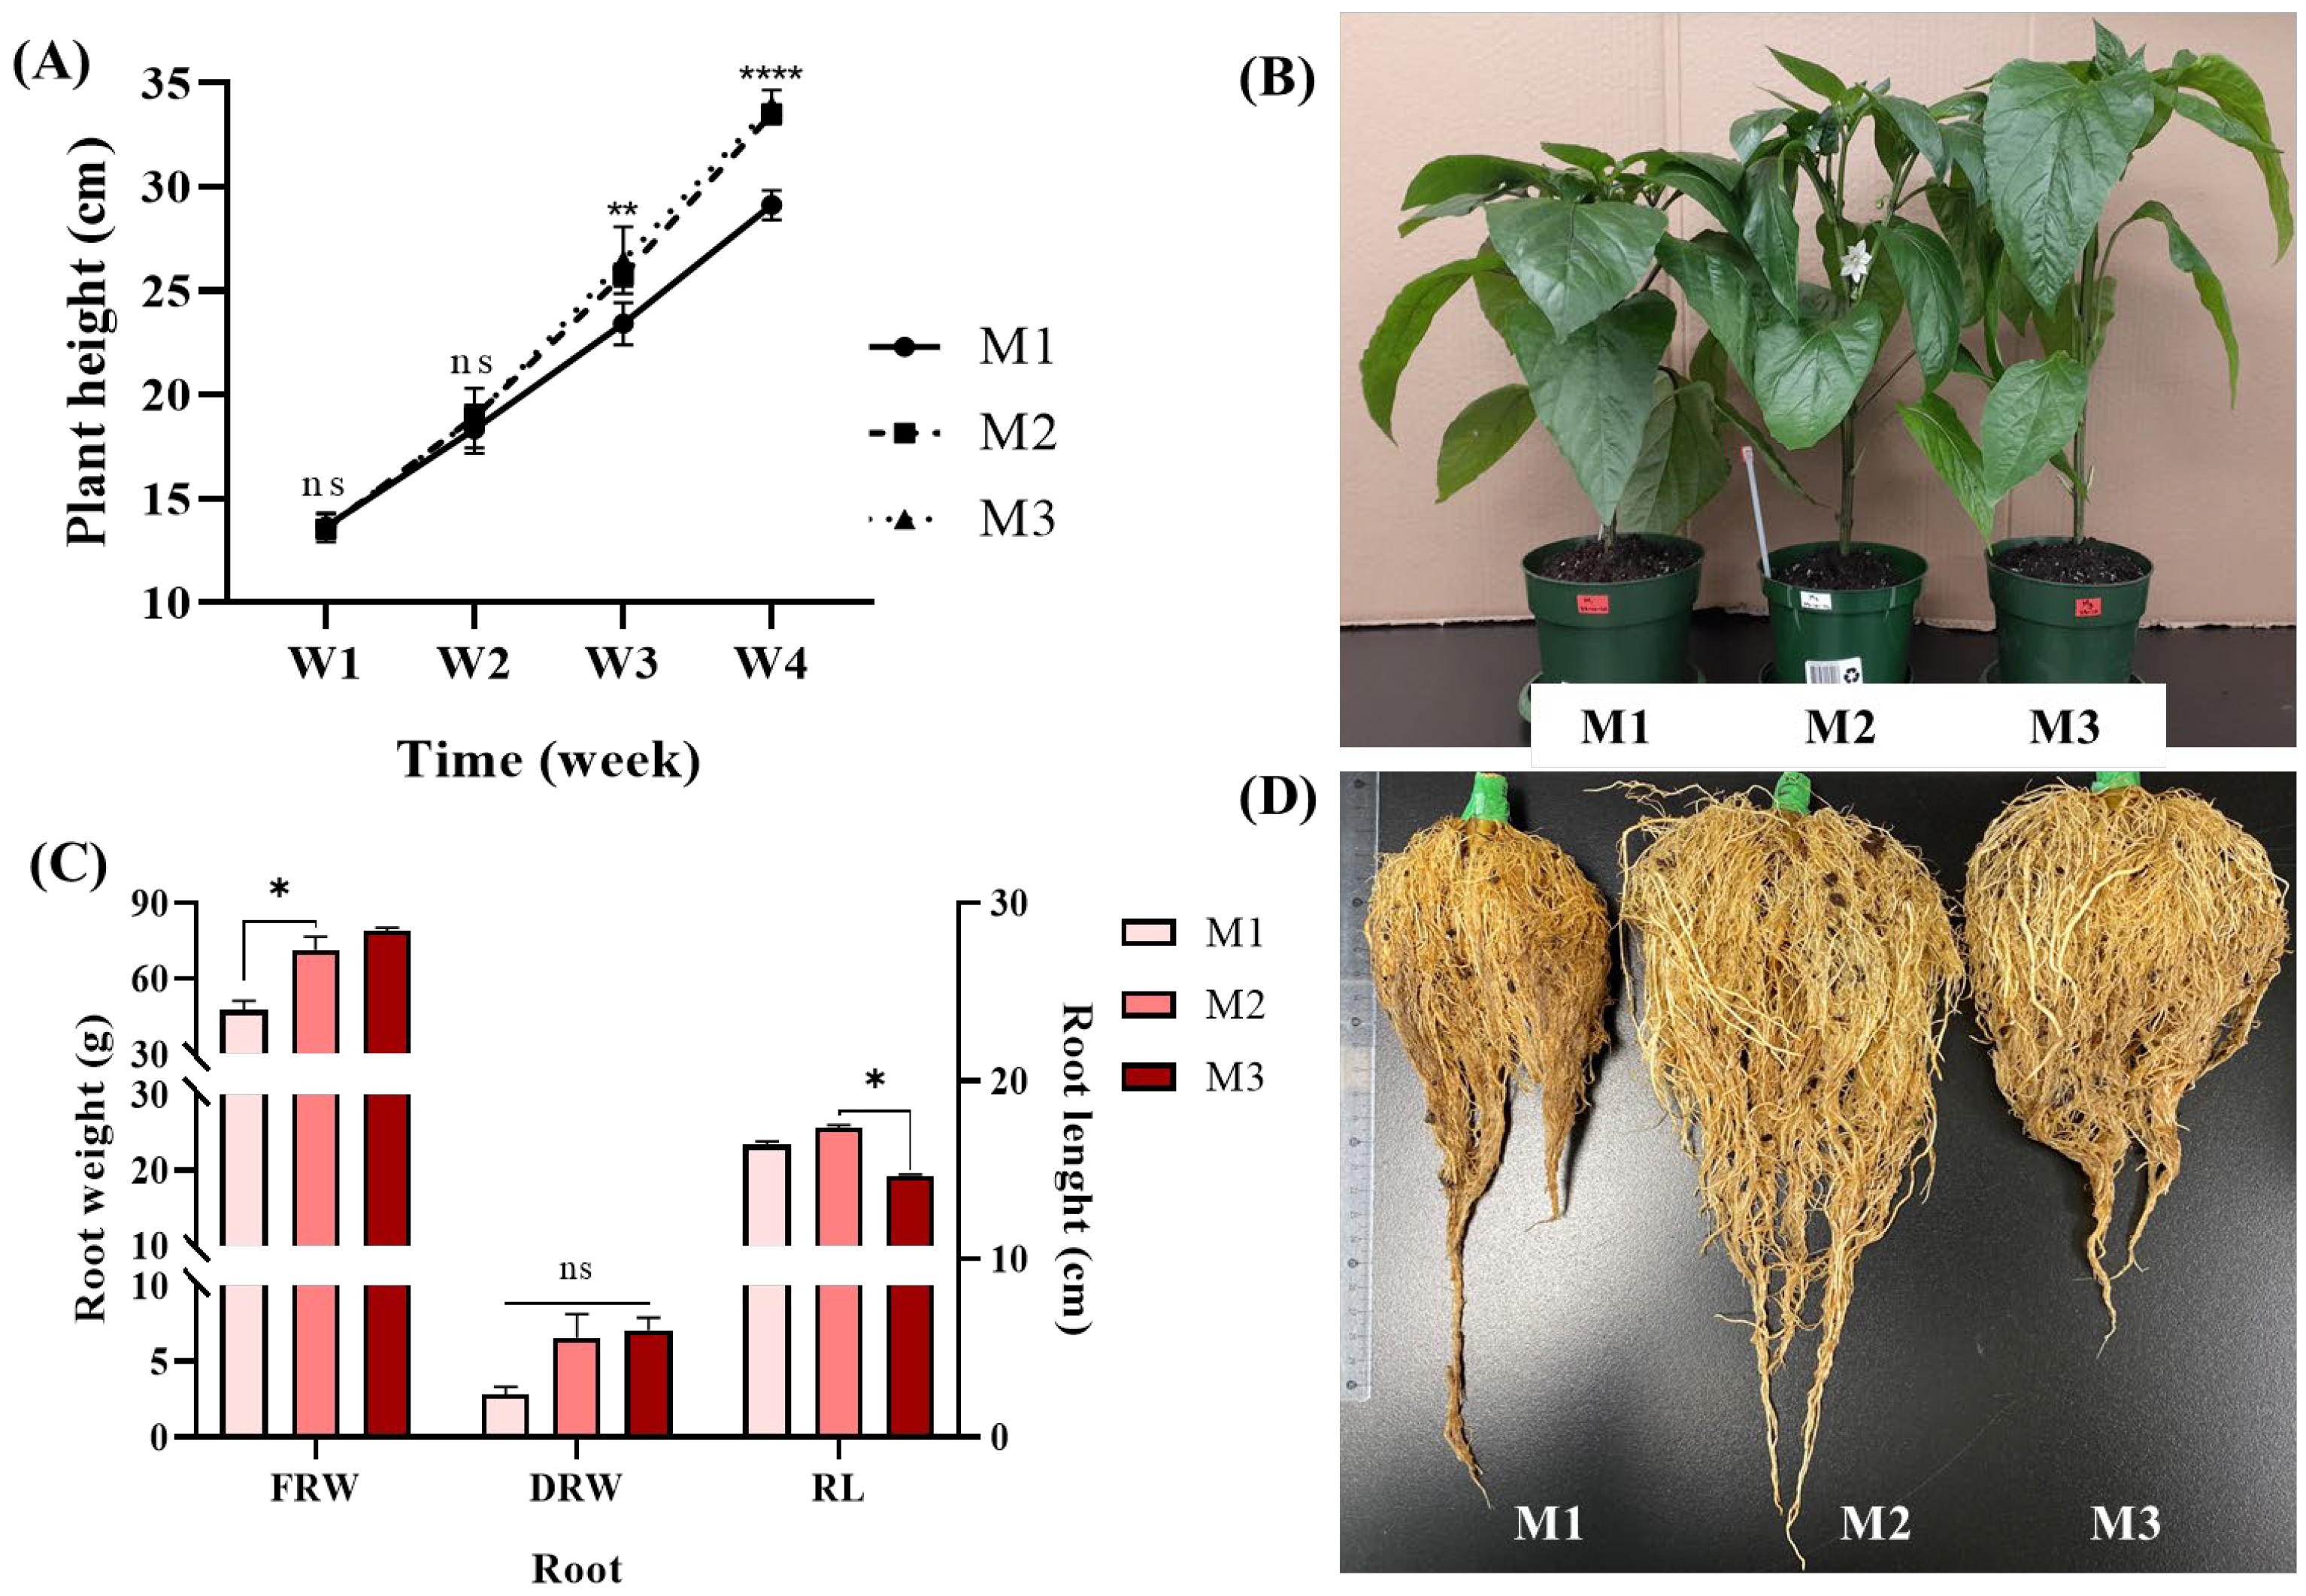
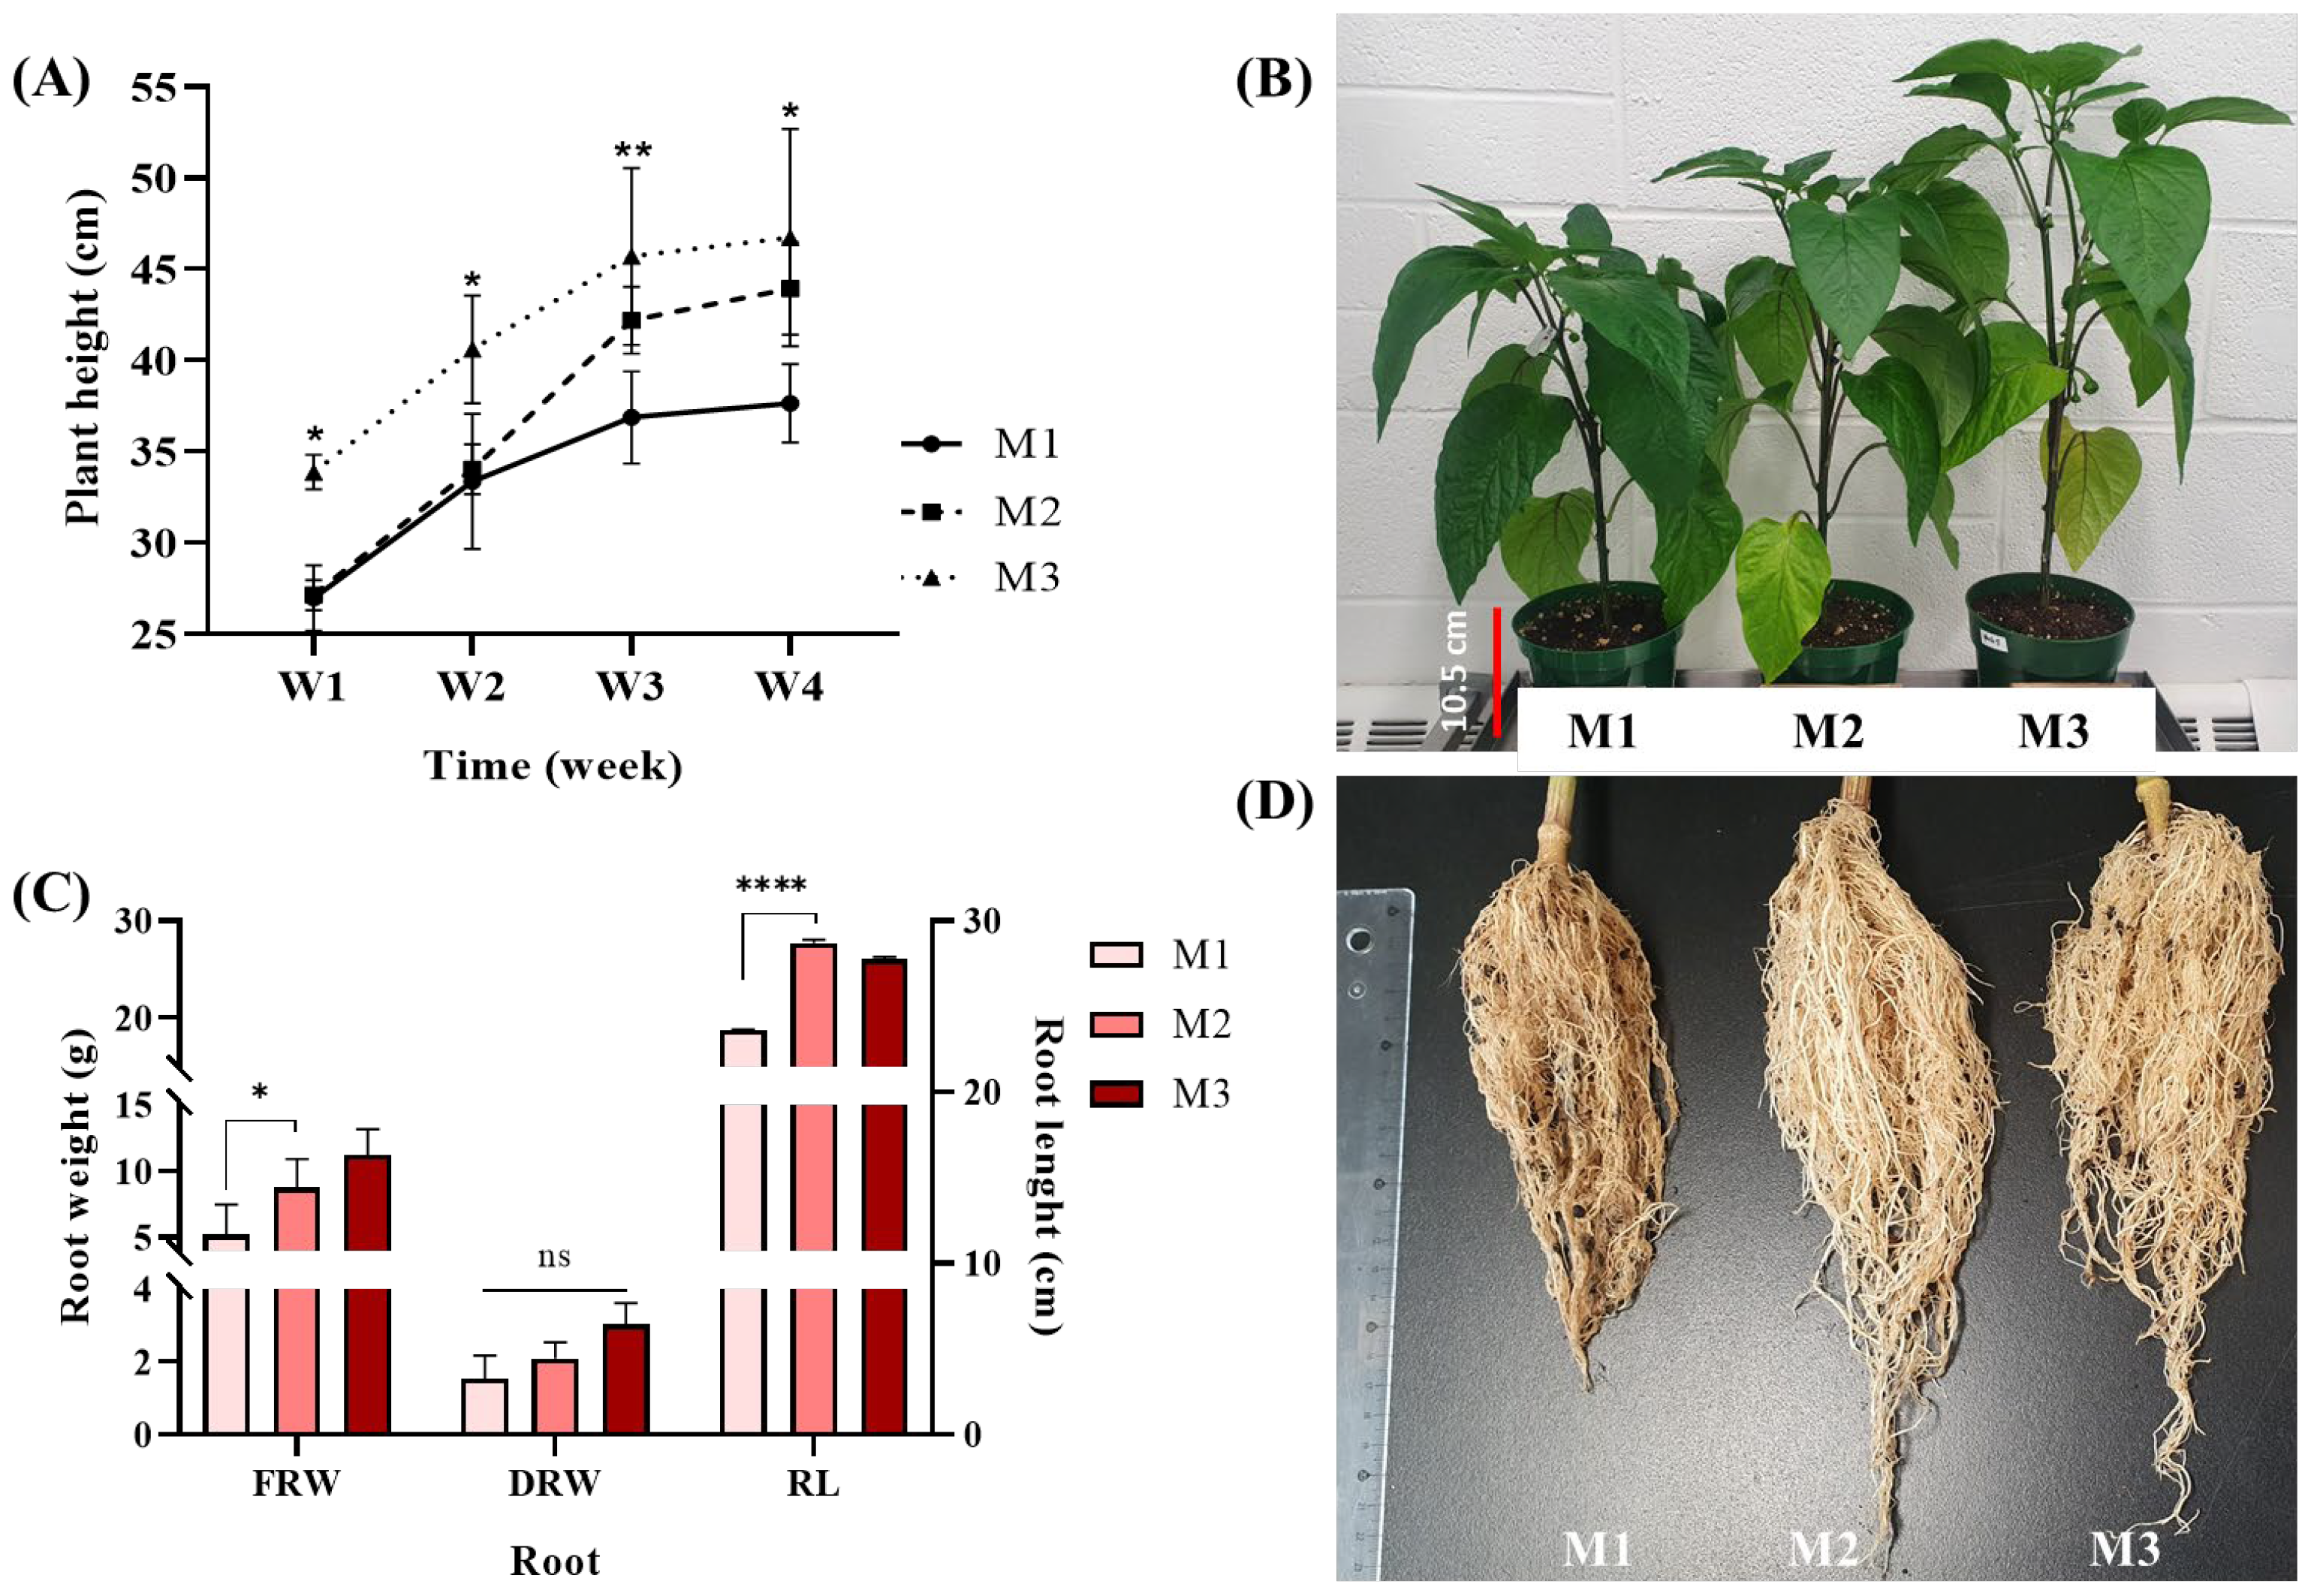
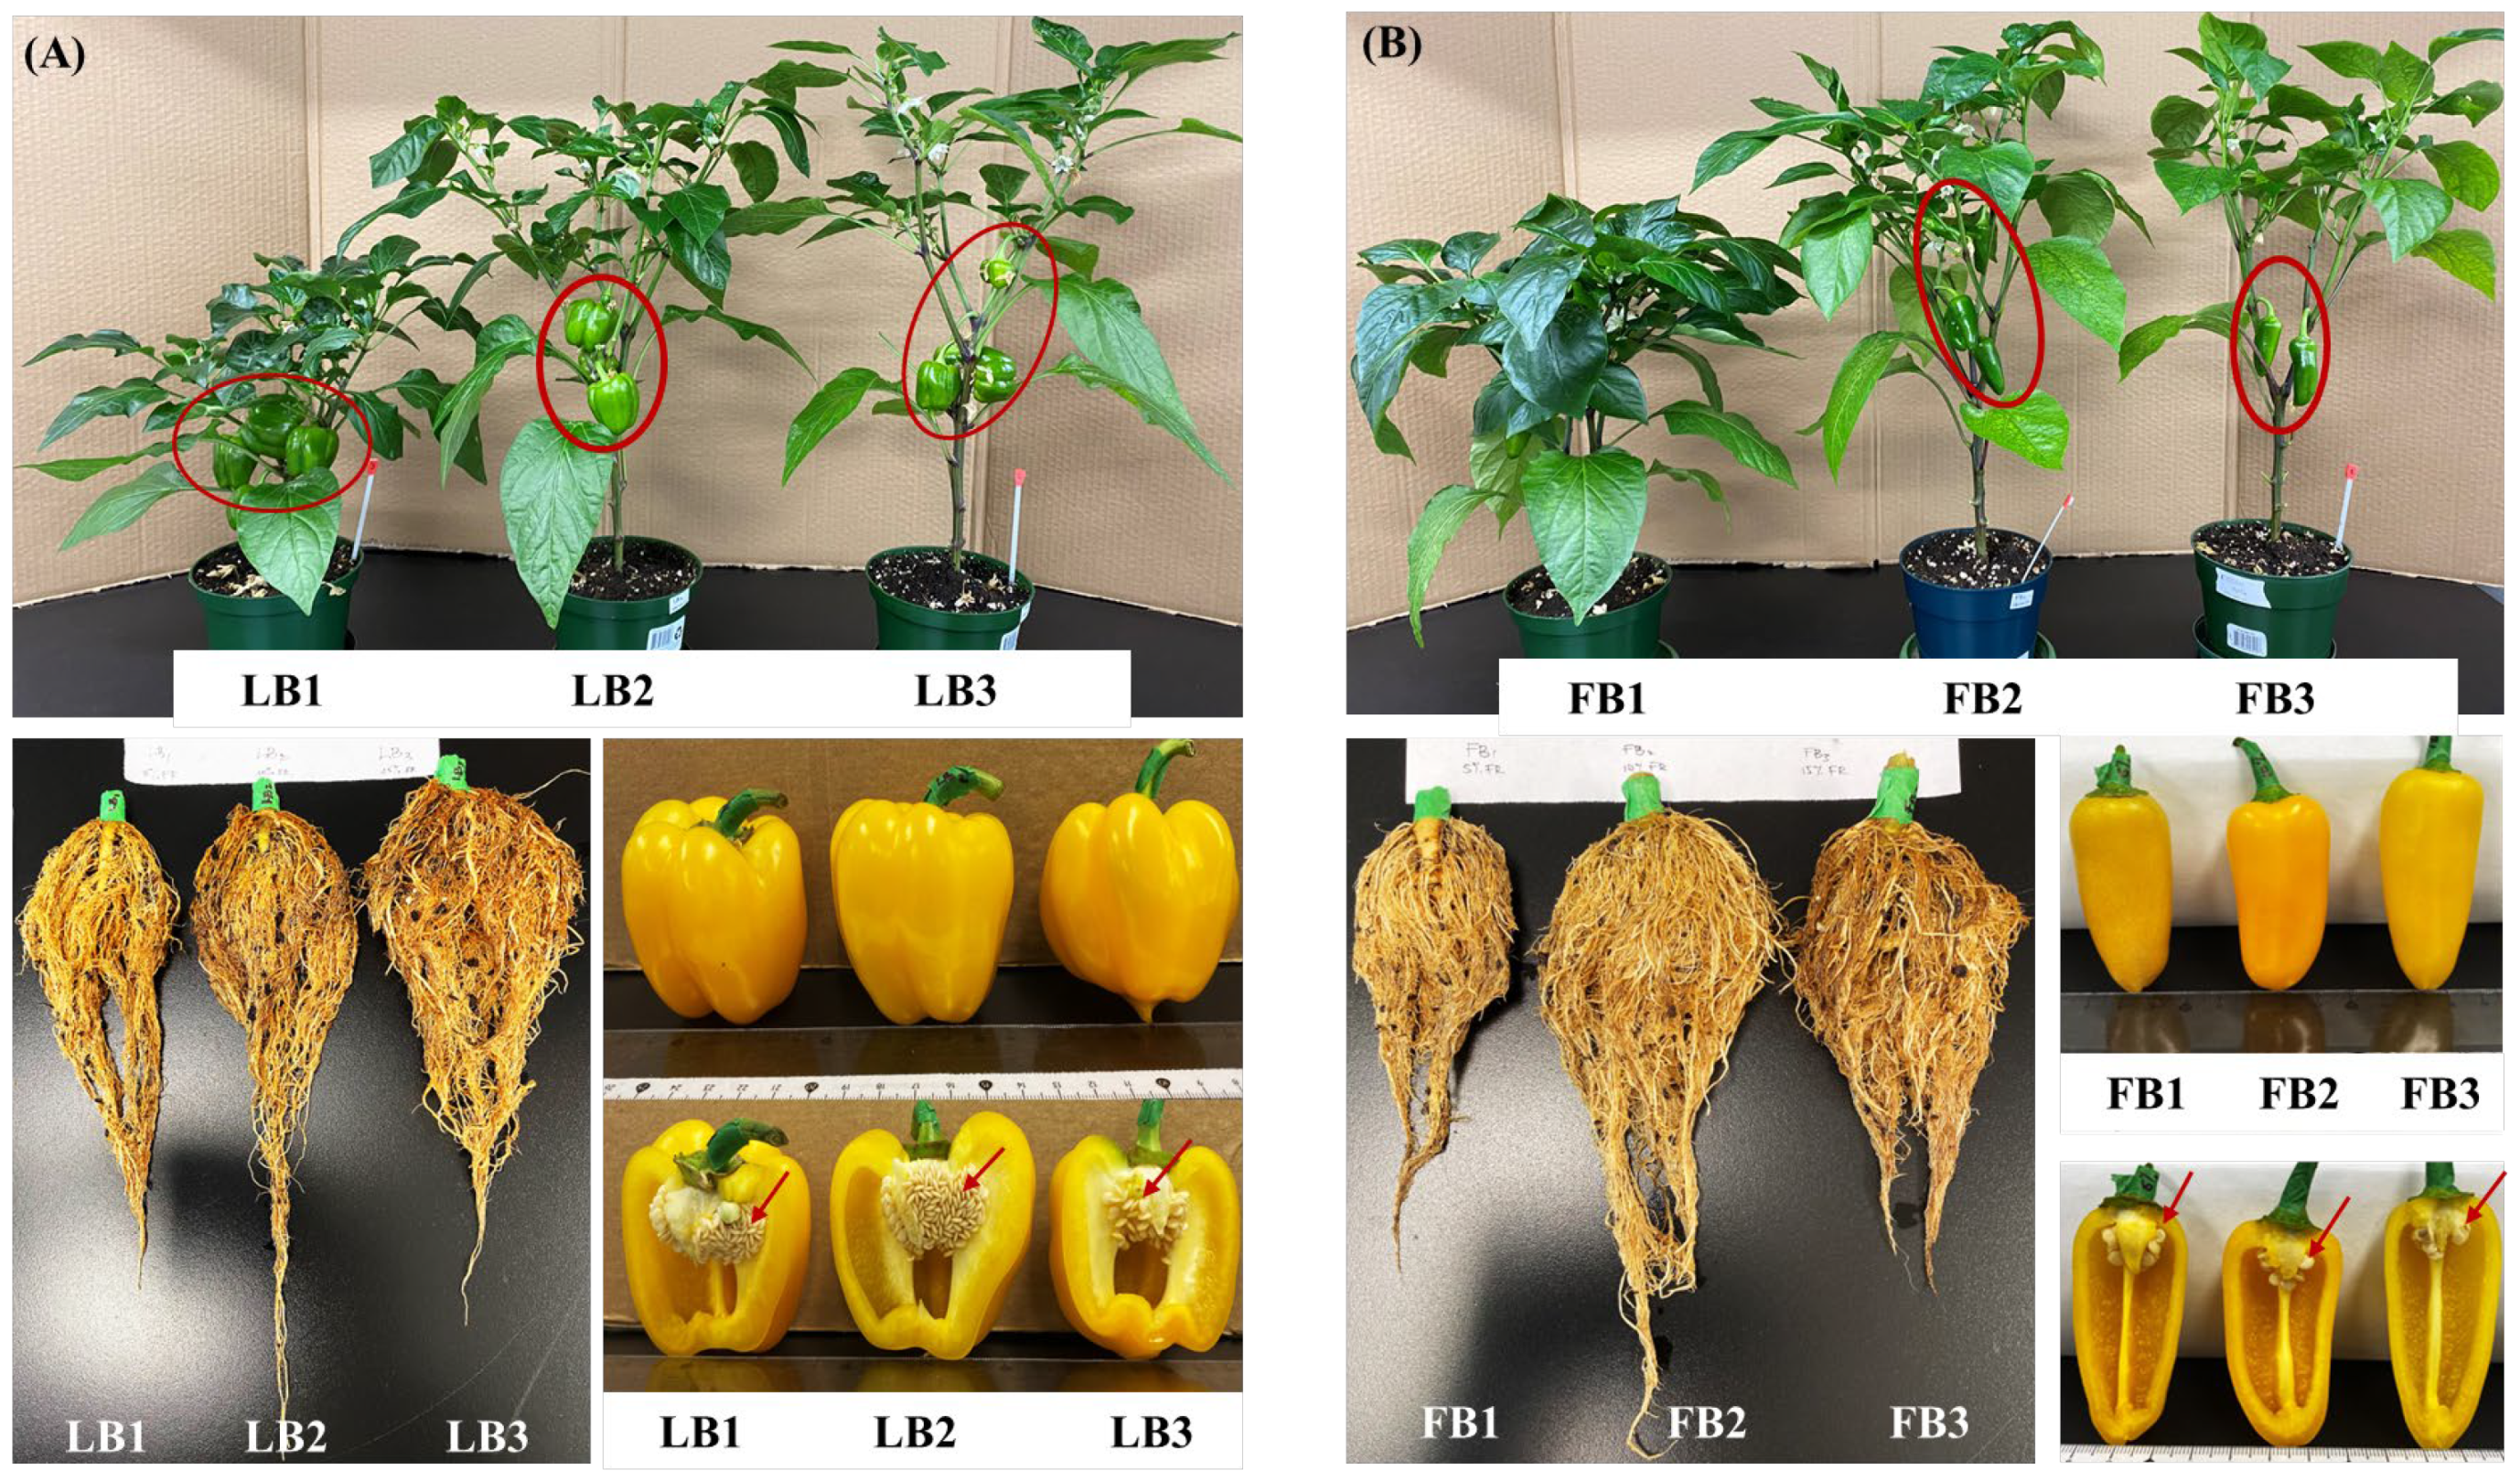
We compared the influence of FR supplements on plant growth during the vegetative phase or after flowering. When FR supplements were started early in the vegetative phase, we analyzed the aerial growth of the plants for four consecutive weeks and the root biomass at the end of the production cycle (Figure 2). M2 and M3 FR supplements significantly increased plant height and internode elongation, whereas M3 reduced the leaf number compared to M1. None of the FR treatments significantly impacted stem diameter, but there was a slight decrease in leaf area in M2 and M3 treatments compared to M1 (Table 4). In addition, M2 and M3 treatments significantly increased the root fresh weight compared to M1 (Figure 2). The positive effect of FR treatment on the roots was stronger for M2 than for M3 (31.84 ± 1.00 cm versus 23.61 ± 0.85 cm). Likewise, when FR supplements began only upon the appearance of the first flower bud, M2 and M3 treatments significantly increased plant height, although the effect on internode lengthening was somewhat less strong than in the case of lighting during the vegetative growth phase. Fresh weight and root length were also higher in the M2 and M3 treatments (Figure 3; Table 4). These data indicated that FR supplements to sweet pepper increased plant height, internode length, and root biomass during vegetative and reproductive growth phases. Similar results were also obtained with two additional cultivars of pepper, indicating that the FR supplements enhanced the growth independently of the plant cultivar (Figure 4).

3.3. The Plant Developmental Stage Influences Fruit Yield and Time to Maturation in Response to FR Supplements

We compared the influence of FR supplements on flower development and fruit yield. Starting from the appearance of the first flower, the number of subsequent flowers and their frequency to set fruits were monitored for 14 days. Fruits were counted and monitored on each plant until fruit maturity. When FR supplements were given early in the vegetative growth phase, the number of flowers during the first 14 days of flowering was lower for both M2 and M3 treatments compared to M1 treatment (Table 5). However, the proportion of flowers that successfully set fruit remained statistically similar in all treatments, with a slight improvement in the M2 treatment. The time to fruit set was the same in all three treatments, but the time to fruit maturation was approximately 5 days shorter in the M3 than in the M2 and M1 FR treatments. Fifty-six fruits were harvested (8.2 kg) in the M2 treatment compared to forty fruits (4.7 kg) and forty-two fruits (6.2 kg) in the M1 and M3 treatments, respectively (Table 5). When FR supplements were given only upon the appearance of the first flower bud, fewer flowers formed on plants exposed to M2 and M3 FR supplements compared to plants exposed to M1 FR supplement over the first 14 days after anthesis (Table 5). M2 and M3 FR supplements also lengthened the time to abortion of some of the fruits. There was no difference between FR treatments for the time to fruit set and fruit set rate. However, the time to fruit ripening was 5–8 days longer in the M2 and M3 FR treatments compared to plants exposed to the M1 FR treatment. Forty-six fruits (5.4 kg) were harvested for the M2 FR treatment compared to thirty-eight fruits (3.6 kg) and thirty-six fruits (4.3 kg) in the M1 and M3 FR treatments, respectively (Table 5). In conclusion, the M2 and M3 FR supplements resulted in an 23.9–25.9% increase in the fresh weight of ripe fruit harvested per plant regardless of the FR application phase. The positive effect of FR supplements appeared to decrease when FR supplements were given only at the onset of flowering compared to when FR supplements were given early in vegetative growth. Although both M2 and M3 FR levels resulted in higher yields than the M1 FR level, late FR supplementation to the lighting, i.e., from flowering, delayed fruit ripening by 5–8 days and decreased the harvested fruit yield compared to FR supplementation starting at seedling transplant.

3.4. FR Modulates Bell Pepper Fruit Size and Morphology

We examined how FR supplements influence the morphology of bell pepper fruits in each treatment during the vegetative and reproductive phases. When FR supplements were started early in the vegetative phase, FR at 12 μmol m−2 s−1 (M2 treatment, 146.89 ± 5.48 g) and 18.1 μmol m−2 s−1 (M3 treatment, 146.90 ± 5.59 g) significantly increased individual fruit fresh weight by 25.22% and 25.23%, respectively, compared with FR at 5.5 μmol m−2 s−1 (M1 treatment, 117.30 ± 2.66 g). This was also the case when the FR supplement started at the onset of flowering in the reproductive phase, whereby the M2 (117.06 ± 2.75 g) and M3 (118.91 ± 1.64 g) treatments increased individual fruit fresh weight by 23.9% and 25.9%, respectively, compared with the M1 (94.47 ± 5.43 g) treatment. Fruit volume tended to be higher in the M2 (184.20 ± 33.43 cm3) and M3 treatments (181.79 ± 35.72 cm3) compared to the M1 treatment (129.06 ± 24.01 cm3) when FR supplements were started early in the vegetative phase. However, the differences in fruit volume were not statistically significant due to the large standard errors of the mean values. Similar observations were made on the fruit volume when FR supplements began at the onset of flowering. Regardless of the time of FR application, none of the treatments affected fruit dry matter content. However, the thickness of the fruit flesh was notably lower (p < 0.05) in the M3 treatment compared to the M1 and M2 treatments (Table 6).

3.5. FR Increased Sugar, Phenolic Levels, and Vitamin C in Sweet Pepper Fruits Independently of the Plant Growth Phase at the Time of FR Addition to the Lighting

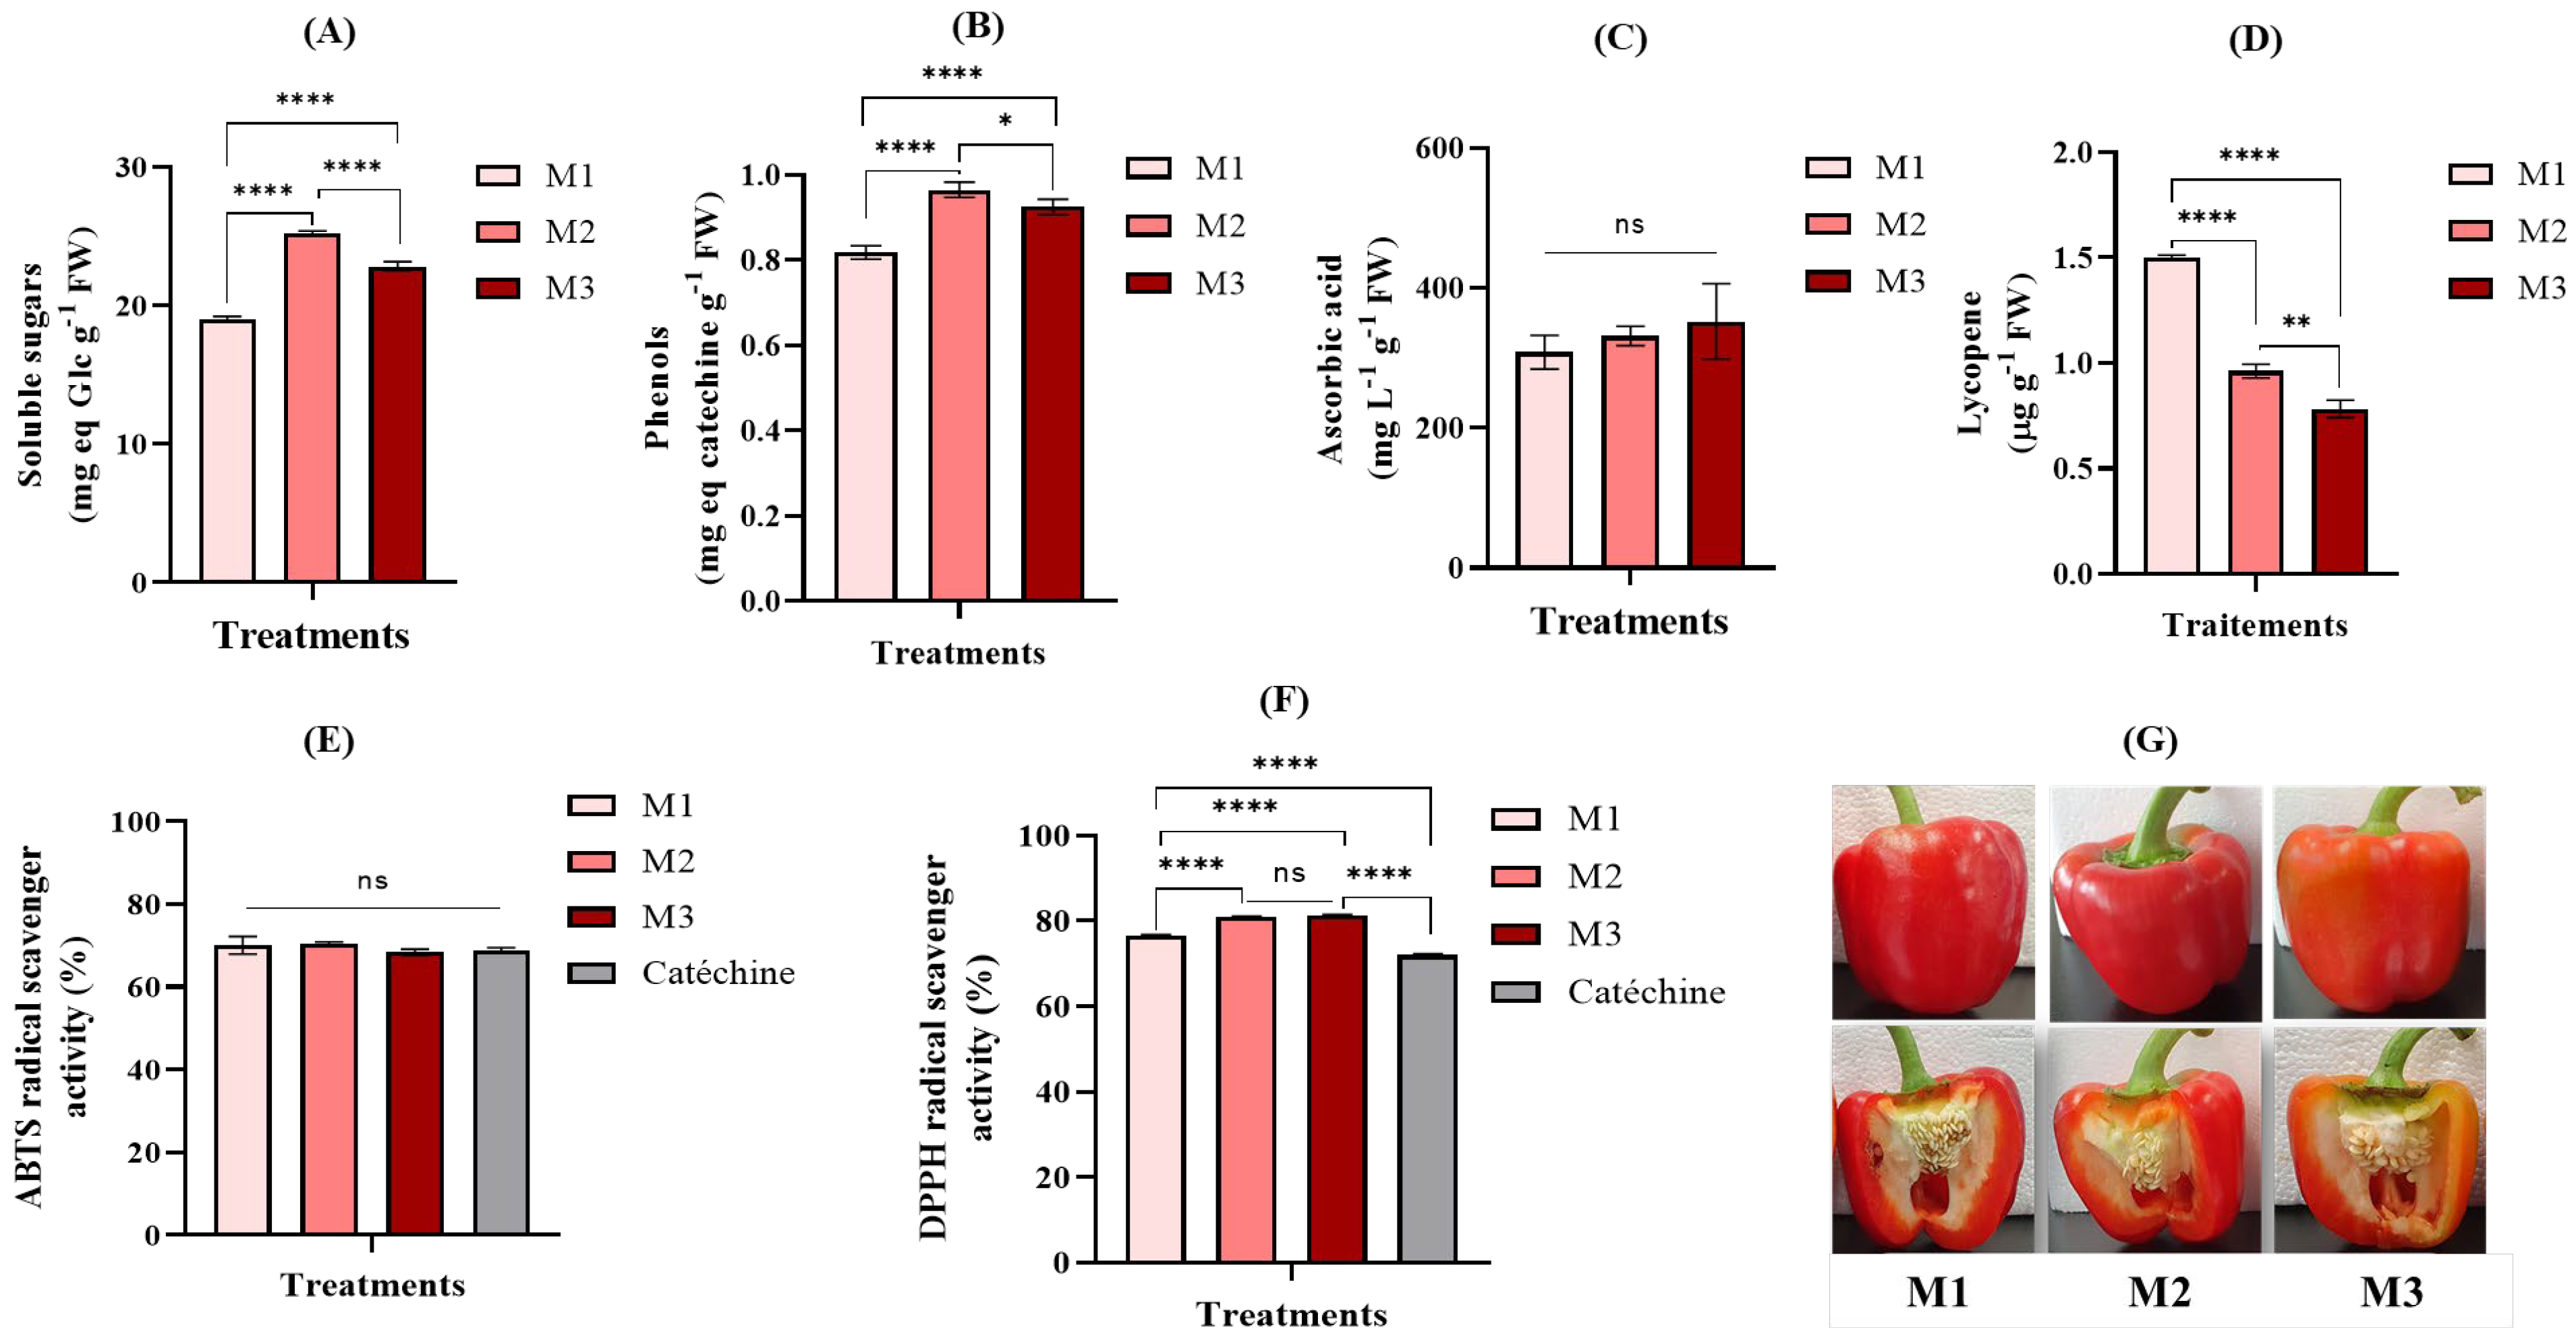
The fruit soluble sugars, phenolic contents, and extracts’ antioxidant capacity were examined to assess the fruit quality. We compared the influence of FR supplements on fruit sugar and phenolic contents during the vegetative phase or after flowering. The mature fruits were weighed before the soluble sugars and phenolic compounds were determined. When FR supplements were given early in the vegetative growth phase, the soluble sugar content of the fruits and the accumulation of phenolic compounds were significantly higher for the M2 and M3 compared to the M1 FR treatments (Figure 5A,B and Table 7). Likewise, when FR supplements were given only upon the appearance of the first flower bud, the total soluble sugar content was 24% and 20% higher in the fruits of M2 and M3 FR treatments, respectively, compared to the fruits harvested from the M1 treatment. The fruit phenolic contents increased by 17% and 31% in the M2 and M3 FR supplements, respectively, compared to fruits in M1 (Figure 6A,B and Table 7). In addition, the M2 and M3 FR supplements led to a slight increase in ascorbic acid and a net decrease in lycopene in fruits (Figure 5C,D and Figure 6C,D). In sum, the M2 and M3 FR supplements increased the soluble sugars and phenolic contents of fruits, independently of the plant growth phase at the time of FR addition to the lighting.
To examine the antioxidant activities in fruits, the methanolic extracts of the mature fruits collected in each treatment were analyzed with respect to the scavenging of DPPH and ABTS•+. Compared to the M1 treatment, no significant difference was observed in the scavenging capacity of the ABTS•+ radical (Figure 5E and Figure 6E). However, the fruit extracts analyzed in the M2 and M3 treatments had a high DPPH free radical scavenging capacity when FR supplements were given early in the vegetative growth phase (68%, 88.5%, and 86.9% for M1, M2, and M3, respectively) and when FR supplements were given only upon the appearance of the first flower bud (76.5%, 81%, and 81.4% for M1, M2, and M3, respectively) (Figure 5F and Figure 6F).

4. Discussion

In this study, we investigated whether crop response to FR supplements to the lighting depends on the plant developmental stage when the supplement begins. Knowing the appropriate time of adding FR supplements to lighting might help save energy, especially when constant or everyday FR supplement during the crop life cycle is not necessary for the yield. We thus compared the growth of bell pepper plants (Capsicum annuum cv. Margrethe) when they were exposed to FR supplements immediately after seedling transplantation to when FR supplementation began at the onset of flowering by testing three doses of FR (5.5, 12, and 18.1 µmol m−2 s−1 FR denoted as M1, M2, and M3 treatments, respectively). We found that supplementing FR from the time of transplanting seedlings improves fruit growth and development more than when it is started at the flowering stage (Table 5). In the latter case, a slowdown in fruit ripening and a decrease in fruit yield were observed, although both M2 and M3 FR levels resulted in higher yields than the M1 FR level. In greenhouses and other controlled environments, turning on additional light bulbs for light supplementation or increasing the output of a light bulb would lead to increased energy consumption. Our results on pepper plants of the cultivar Margrethe suggest that attempts to delay FR supplementation to the flowering stage to save some energy may be counterproductive. However, the effects on the yield and the delayed flowering may depend on the growth conditions used and on the cultivars, varieties, or plant species. For example, Xia and Mattson [36] found that additional FR on Petunia liners resulted in earlier and faster flowering. Similarly, Owen et al. [37] reported that the effect of FR on flowering would depend on the photosynthetic daily light integral (DLI). Under low DLIs, long-day plants petunia and snapdragon flowered early under mixed red + white + FR lighting, whereas under high DLIs, flowering could be promoted to the same degree in the absence of FR. Thus, the effects of FR supplements are species-specific and depend on the overall lighting conditions.
Flower numbers were lower in the treatments with higher FR levels, and fruit set was similar among the three FR levels. However, total fruit number harvested was significantly higher in M2 FR level (Table 5). This seems contradictory, but two elements contributed to the higher yield in M2. There was a delay in the flowering for the first fourteen days, but this delay progressively disappeared later in M2 and M3. This was observed in all experimental repeats. Also, the appearance of flowers was almost continuous in M2 and M3, whereas it was rather periodic and discontinuous in M1. These two effects were present regardless of the type of experiment, i.e., FR application at the vegetative stage or reproductive stage, and we would assume that they were the two major contributing factors to the total fruit yield, particularly in M2. The reduced number of flowers within the first 14 days of flowering of plants that received a lower R:FR ratio (M2 and M3 treatments) regardless of when the FR supplement was applied (Table 5) might result from the effect of the FR receptor, phytochrome B (phyB), on flowering. FR radiation is perceived by the photoreceptor phyB, which exists in its active form Pfr and inactive form Pr. FR light turns Pfr into Pr, whereas red light turns Pr into Pfr [38]. In Arabidopsis, the stabilization of the rhythmically expressed CONSTANS (CO) is necessary for the activation of FLOWERING LOCUS T (FT), resulting in the initiation of flowering [39]. The CONSTITUTIVE PHOTOMORPHOGENIC 1-SUPPRESSOR OF PHYA-105 1 (COP1-SPA1) ubiquitin ligase complex promotes the turnover of CO [40,41,42]. Hadju et al. [43] showed that the induction of FT requires phyB Pfr, the light-activated Pfr form of phyB, which inhibits the function of the COP1-SPA1 complex by physical interactions and causes CO protein to accumulate [44,45]. Indeed, the biochemical and genetic depletion of Pfr in the night reversed the inhibitory effect of phyB on COP1, and far-red pulses (that convert active Pfr to inactive Pr) eliminated the FT peak in wild-type Arabidopsis plants [43]. Since FR supplements accelerate the conversion of Pfr to Pr in A. thaliana, the delay of flowering observed in our M2 and M3 treatments might result from increased COP1-SPA1 activity and reduced CO and FT accumulation. This hypothesis shall be validated experimentally. In comparison to the fruit yield in M2 and M3 treatments when FR supplementation begins at the vegetative phase (Table 5), we hypothesize that the lower yield in M2 and M3 treatments and delayed fruit maturation we noticed when FR supplementation began at the onset of flowering could stem from FR light repression on the metabolic activities in the growing sink organs. For example, in tomato fruits in the red ripe stage, knockout mutations of the phyA, phyB1, and phyB2 genes impaired ripening-associated carotenoid accumulation [46,47], and tomato PHYB1 and PHYB2 were found to have a greater impact on ripening-associated methylation reprogramming (the inhibition of the transcription) across gene-rich genomic regions in tomato fruits [48]. In agreement with this, we noticed that the fruits harvested in the M2 and M3 treatments were red pale compared to the dark red fruits collected in the M1 treatment (Figure 5G and Figure 6G).
Although flowering was delayed for a few days in plants supplemented with 12 (M2) or 18.1 (M3) µmol m−2 s−1 FR, the percentage of fruit set tended to be higher (but not statistically significant) for the M2 plants than for plants in M1 and M3 FR treatments (Table 5). This also contributed to the higher fruit yield of M2-treated plants. In [49,50], it was found that fruit set is influenced by the plant’s genetic background and fruit size and that fruit set was lower in pepper cultivars with large fruits than in cultivars with small fruit, owing to the higher sink demand and competition between the growing large fruits. We tested two additional pepper cultivars: Liberty Belle producing big fruits and Fresh Bites producing small-elongated fruits. We repeatedly observed better development and yield in plants exposed to the M2 treatment than in the M3 treatment (Figure 4). Our observation that merely 12 µmol m−2 s−1 FR led to more fruits than 18.1 µmol m−2 s−1 FR supplement seemed independent of the genetic backgrounds of the cultivars used. Compared to previous studies, 5–10-fold higher levels of FR have been used to supplement the lighting growth [22,23,24,51]. Accordingly, adverse effects of FR supplements were reported, including more susceptibility to stress factors and reduced fruit set [20,22,23,24,25]. Our dose–response analysis of the FR-supplemented plants indicated that as small as 12 µmol m−2 s−1 FR supplement may be sufficient to boost yield in pepper, whereas 18.1 µmol m−2 s−1 FR supplement compared to 5.5 µmol m−2 s−1 FR supplement could accelerate ripening when the light treatment was applied during the vegetative stage or could delay ripening when the light treatment was given at the onset of flowering (Table 5).
The sugar content of sweet pepper gives the fruit a sweet flavor to spicy taste. We found that the exposure of pepper plants to 12 (M2) or 18.1 (M3) µmol m−2 s−1 FR supplement resulted in a significant increase in fructose and total soluble sugars (Table 7). Similar results were also reported in tomatoes [52], demonstrating the effectiveness of FR in increasing total sugar levels in tomato and pepper. As shown in tomato, the induction of genes involved in sugar transport and metabolism by FR light explained this effect [52]. One caveat is that the fruits were considered mature in our study when they had a total red hue. This undoubtedly bears some subjectivity. Accordingly, the difference observed in the sugar content between the two stages of treatment (vegetative and reproductive; Figure 5A and Figure 6A) might indeed be due to the fruits selected for the analysis, with the two types of experiment not having been carried out at the same time during the year. A PPFD of 110 µmol m−2 s−1 that was used in this study is suboptimal for bell pepper. However, the study was undertaken in the context of growing pepper in greenhouses during the Canadian and Quebec winter season, when average daily light integral (DLI) varies between 4 and 8 mol m−2 d−1.
We did not examine the susceptibility of plants exposed to FR supplements to biotic stress factors. Several reports indicated that while FR may boost plant growth and yield, it also increases plant susceptibility to pathogens [20,24,25]. Considering the outcomes of our dose–response analysis of FR supplementation, we are currently examining how plants exposed to rather low levels of FR would respond to pathogen attack or abiotic stress factors. Similarly, the molecular mechanisms that underlie the observations reported in this study are being investigated.

5. Conclusions

This study aimed to examine the effect of FR supplements on pepper at two plant developmental stages in a controlled environment: the vegetative growth phase and the generative growth phase. We found that both 12 and 18.1 μmol m−2 s−1 FR supplements resulted in a 23.9–25.9% increase in the fruit fresh weight per plant, increased plant size, and enhanced soluble sugars and phenolic compounds content of fruits. However, the fruit set and yield were better with 12 µmol m−2 s−1 FR supplement than with 18.1 µmol m−2 s−1 FR supplement. Moreover, the positive effect of FR supplement on the pepper cultivar Margrethe appeared to depend on the plant’s growth phase: late FR supplementation, i.e., from flowering, delayed fruit ripening by 5–8 days and decreased fruit yield compared to FR supplementation that began at seedling transplant, whereas early FR supplementation did not. It should be noted that other cultivars or varieties may respond differently to FR, depending on the light intensity used and the plant genetic background. As a consequence, the economic trade-offs between the genotype’s yield improvement by FR and the costs of the additional materials and energy required for FR supplement starting from the crop vegetative growth stage should first be examined.

Supplementary Materials

The following supporting information can be downloaded at https://www.mdpi.com/article/10.3390/agronomy15030732/s1, Figure S1. Representative images of bell pepper plants in the three treatment compartments of the growth room. Figure S2. HPLC chromatogram and integration data of the analyses of selected sugar molecules. Figure S3. Photosynthetic activity response.

Author Contributions

Conceptualization, A.M.M.-N., G.Y.F.-Y. and T.D.M.; methodology, A.M.M.-N., G.Y.F.-Y. and T.D.M.; formal analysis, A.M.M.-N. and G.Y.F.-Y.; investigation, A.M.M.-N. and G.Y.F.-Y.; resources, T.D.M.; writing—original draft preparation, A.M.M.-N. and T.D.M.; writing—review and editing, A.M.M.-N., G.Y.F.-Y. and T.D.M.; supervision, T.D.M.; funding acquisition, T.D.M. All authors have read and agreed to the published version of the manuscript.

Funding

This Project is funded through the Innov’Action Agri-Food Program, under the Canadian Partnership for Agriculture, an agreement between the Governments of Canada and Quebec. Grant number IA121714.

Data Availability Statement

The original contributions presented in this study are included in the article/Supplementary Materials. Further inquiries can be directed to the corresponding author.

Acknowledgments

The authors wholeheartedly thank (i) Enza Zaden for providing the seeds of Capsicum annuum var. Margrethe, (ii) Gen-V Inc. and its personnel for helping with the experiments in their greenhouses, (iii) Rose Séguin, Marco Lafond, and Jonathan Bélanger from Sollum Technologies Inc. for their agronomic and technical support, and (iv) La Zone Agtech du Québec for their support. The authors also thank Vincent Maire and Martine Dorais for their collaboration and input in the completion of the study and (v) Alexandre Custeau for ascorbic acid analysis in the Desgagné-Penix’s Lab.

Conflicts of Interest

The authors declare no conflicts of interest. The funders had no role in the design of the study; in the collection, analyses, or interpretation of data; in the writing of the manuscript; or in the decision to publish the results.

Abbreviations

The following abbreviations are used in this manuscript:
AAssimilation
ABTS•+2,2′-azinobis-(3-ethylbenzothiazoline-6-sulfonic acid) free radicals
AmaxMaximum assimilation
CiIntracellular CO2
DCPDark compensation point
DLIDaily light integral
DPPH2,2-diphenyl-1-picryhydrazyl
DRDark respiration
DRWDry root weight
FBFresh Bites
FRFar-red
FRWFresh root weight
HPLCHigh Performance Liquid Chromatography
LALeaf area
LBLiberty Belle
LCPLight compensation point
LEDsLight emitting diodes
LRLight respiration
M15.5 µmol m−2 s−1 far-red supplement
M212 µmol m−2 s−1 far-red supplement
M318.1 µmol m−2 s−1 far-red supplement
PFDPhoton flux density
PPFDPhotosynthetic photon flux density (μmol m−2 s−1)
R:FRPhotonic irradiance (666–775 nm)/photonic irradiance (725–735 nm)
RLRoot length
αApparent quantum yield
ƐCarboxylation efficiency

References

  1. Dueck, T.; Ieperen, V.W.; Taulavuori, K. Light perception, signalling and plant responses to spectral quality and photoperiod in natural and horticultural environments. Env. Exp. Bot. 2016, 121, 1–3. [Google Scholar] [CrossRef]
  2. De Wit, M.; Galvão, V.C.; Fankhauser, C. Light-Mediated Hormonal Regulation of Plant Growth and Development. Ann. Rev. Plant. Biol. 2016, 67, 513–537. [Google Scholar] [CrossRef]
  3. Mccree, K.J. Test of current definitions of photosynthetically active radiation against leaf photosynthesis data. Agric. Meteorol. 1972, 10, 444–453. [Google Scholar] [CrossRef]
  4. Zhen, S.; Iersel, M.V.; Bugbee, B. Why Far-Red Photons Should Be Included in the Definition of Photosynthetic Photons and the Measurement of Horticultural Fixture Efficacy. Front. Plant Sci. 2021, 12, 693445. [Google Scholar] [CrossRef]
  5. Zhen, S.; Iersel, V.M.; Bugbee, B. Photosynthesis in sun and shade: The surprising importance of far-red photons. New Phytol. 2022, 236, 538–546. [Google Scholar] [CrossRef] [PubMed]
  6. Zhen, S.; Haidekker, M.; Iersel, V.M. Far-red light enhances photochemical efficiency in a wavelength-dependent manner. Physiol. Plant 2019, 167, 21–33. [Google Scholar] [CrossRef] [PubMed]
  7. Zhen, S.; Iersel, V.M. Far-red light is needed for efficient photochemistry and photosynthesis. J. Plant Physiol. 2017, 209, 115–122. [Google Scholar] [CrossRef]
  8. Mitchell, C.A. Academic Research Perspective of LEDs for the Horticulture Industry. HortScience 2015, 50, 1293–1296. [Google Scholar] [CrossRef]
  9. Kim, D.; Moon, T.; Kwon, S.; Hwang, I.; Son, J.E. Supplemental inter-lighting with additional far-red to red and blue light increases the growth and yield of greenhouse sweet peppers (Capsicum annuum L.) in winter. Hortic. Environ. Biotechnol. 2023, 64, 83–95. [Google Scholar] [CrossRef]
  10. Li, Y.; Jiang, H.; Gao, M.; Liu, R.H.; Su, W.; Liu, H. Far-Red-Light-Induced Morphology Changes, Phytohormone, and Transcriptome Reprogramming of Chinese Kale (Brassica alboglabra Bailey). Int. J. Mol. Sci. 2023, 24, 5563. [Google Scholar] [CrossRef]
  11. Li, Q.; Kubota, C. Effects of supplemental light quality on growth and phytochemicals of baby leaf lettuce. Environ. Exp. Bot. 2009, 67, 59–64. [Google Scholar] [CrossRef]
  12. Park, Y.; Runkle, E.S. Far-red radiation promotes growth of seedlings by increasing leaf expansion and whole-plant net assimilation. Environ. Exp. Bot. 2017, 136, 41–49. [Google Scholar] [CrossRef]
  13. Zhen, S.; Bugbee, B. Far-red photons have equivalent efficiency to traditional photosynthetic photons: Implications for redefining photosynthetically active radiation. Plant Cell Environ. 2020, 43, 1259–1272. [Google Scholar] [CrossRef]
  14. Jin, W.; Urbina, J.L.; Heuvelink, E.; Marcelis, L.F. Adding Far-Red to Red-Blue Light-Emitting Diode Light Promotes Yield of Lettuce at Different Planting Densities. Front. Plant. Sci. 2021, 11, 609977. [Google Scholar] [CrossRef]
  15. Meng, Q.; Runkle, E.S. Far-red radiation interacts with relative and absolute blue and red photon flux densities to regulate growth, morphology, and pigmentation of lettuce and basil seedlings. Sci. Hortic. 2019, 255, 269–280. [Google Scholar] [CrossRef]
  16. Kalaitzoglou, P.; Ieperen, W.V.; Harbinson, J.; Meer, M.V.D.; Martinakos, S.; Weerheim, K.; Nicole, C.C.S.; Marcelis, L.F.M. Effects of continuous or end-of-day far-red light on tomato plant growth, morphology, light absorption, and fruit production. Front. Plant Sci 2019, 10, 322. [Google Scholar] [CrossRef] [PubMed]
  17. Kim, H.J.; Lin, M.Y.; Mitchell, C.A. Light spectral and thermal properties govern biomass allocation in tomato through morphological and physiological changes. Environ. Exp. Bot. 2019, 157, 228–240. [Google Scholar] [CrossRef]
  18. Kasperbauer, M.J.; Tso, T.C.; Soromn, T.P. Effects of end-of-day red and far-red radiation on free sugars, organic acids and amino acids of tobacco. Phytochemistry 1970, 9, 2091–2095. [Google Scholar] [CrossRef]
  19. Lanoue, J.; Little, C.; Hao, X. The Power of Far-Red Light at Night: Photomorphogenic, Physiological, and Yield Response in Pepper During Dynamic 24-Hour Lighting. Front. Plant Sci. 2022, 13, 857616. [Google Scholar] [CrossRef]
  20. Lazzarin, M.; Meisenburg, M.; Meijer, D.; van Ieperen, W.; Marcelis, L.F.M.; Kappers, I.F.; van der Krol, A.R.; van Loon, J.J.A.; Dicke, M. LEDs Make It Resilient: Effects on Plant Growth and Defense. Trends Plant Sci. 2021, 26, 496–508. [Google Scholar] [CrossRef]
  21. Stamford, J.D.; Stevens, J.; Mullineaux, P.M.; Lawson, T. LED Lighting: A Grower’s Guide to Light Spectra. Hort. Sci. 2023, 58, 180–196. [Google Scholar] [CrossRef]
  22. Chen, S.; Marcelis, L.F.M.; Heuvelink, E. Far-red radiation increases flower and fruit abortion in sweet pepper (Capsicum annuum L.). Sci. Hortic. 2022, 305, 111386. [Google Scholar] [CrossRef]
  23. Chen, S.; Marcelis, L.F.; Offringa, R.; Kohlen, W.; Heuvelink, E. Far-red light-enhanced apical dominance stimulates flower and fruit abortion in sweet pepper. Plant Physiol. 2024, 195, 924–939. [Google Scholar] [CrossRef] [PubMed]
  24. Ji, Y.; Ouzounis, T.; Courbier, S.; Kaisier, E.; Nguyen, P.T.; Schouten, H.J.; Visser, R.G.; Pierick, R.; Marcelis, L.F.; Heuvelink, E. Far-red radiation increases dry mass partitioning to fruits but reduces Botrytis cinerea resistance in tomato. Environ. Exp. Bot. 2019, 168, 103889. [Google Scholar] [CrossRef]
  25. Courbier, S.; Snoek, B.L.; Kajala, K.; Li, L.; Wees, V.S.; Pierik, R. Mechanisms of far-red light-mediated dampening of defense against Botrytis cinerea in tomato leaves. Plant Physiol. 2021, 187, 1250–1266. [Google Scholar] [CrossRef]
  26. Escobar-Bravo, R.; Schimmel, B.C.; Zhang, Y.; Wang, L.; Robert, C.A.; Glauser, G.; Ballare, C.L.; Erb, M. Far-red light increases maize volatile emissions in response to volatile cues from neighbouring plants. Plant Cell Environ. 2024, 47, 3979–3998. [Google Scholar] [CrossRef]
  27. Huber, M.; De Boer, H.J.; Romanowski, A.; Veen, H.V.; Buti, S.; Kahlon, P.S.; Meijden, J.V.; Koch, J.; Pierick, R. Far-red light enrichment affects gene expression and architecture as well as growth and photosynthesis in rice. Plant Cell Environ. 2024, 47, 2936–2953. [Google Scholar] [CrossRef]
  28. Wang, J.L.; Evers, J.B.; Anten, N.P.; Yang, L.Y.; Douma, J.C.; Schneider, H.M. Far-red light perception by the shoot influences root growth and development in cereal-legume crop mixtures. Plant Soil 2024, 1–18. [Google Scholar] [CrossRef]
  29. Escalona, J.M.; Flexas, J.; Medrano, H. Stomatal and non-stomatal limitations of photosynthesis under water stress in field-grown grapevines. Funct. Plant Biol. 2000, 27, 87. [Google Scholar] [CrossRef]
  30. Pearcy, R.W.; Ehleringer, J.R.; Mooney, H.A.; Rundel, P.W. Field Methods and Intrumentation. In Plant Physiological Ecology; Chapman and Hall: London, UK, 1989; p. 457. Available online: https://ecophys.utah.edu/uploads/3/1/8/3/31835701/106.pdf (accessed on 23 December 2024).
  31. Dubois, M.; Gilles, K.; Hamilton, J.K.; Rebers, P.A.; Smith, F. Colorimetric Method for Determination of Sugars and Related Substances. Nature 1951, 168, 167. [Google Scholar] [CrossRef]
  32. Marigo, G. Méthode de fractionnement et d’estimation des composés phénoliques chez les végétaux. Analysis 1973, 2, 106–110. [Google Scholar]
  33. Benakmoum, A. Effet du lycopène sur certains paramètres structuraux et fonctionnels chez le rat en croissance. Ph.D. Thesis, École Nationale Supérieure Agronomique El Harrach Alger, Oued Smar, Algeria, 2009; p. 114. [Google Scholar]
  34. Ghasemnezhad, M.; Sherafati, M.; Payvast, G.A. Variation in phenolic compounds, ascorbic acid and antioxidant activity of five coloured bell pepper (Capsicum annum) fruits at two different harvest times. J. Funct. Foods 2011, 3, 44–49. [Google Scholar] [CrossRef]
  35. Samaniego, S.C.; González, T.A.; García-Parrilla, M.C.; Granados, Q.J.; López García de la Serrana, H.; Martínez, L. Different radical scavenging tests in virgin olive oil and their relation to the total phenol content. Anal. Chim. Acta 2007, 593, 103–107. [Google Scholar] [CrossRef]
  36. Xia, J.; Mattson, N. Daily Light Integral and Far-Red Radiation Influence Morphology and Quality of Liners and Subsequent Flowering and Development of Petunia in Controlled Greenhouses. Horticulturae 2024, 10, 1106. [Google Scholar] [CrossRef]
  37. Owen, W.G.; Meng, Q.; Lopez, R.G. Promotion of Flowering from Far-red Radiation Depends on the Photosynthetic Daily Light Integral. HortScience Horts 2018, 53, 465–471. [Google Scholar] [CrossRef]
  38. Rockwell, N.C.; Su, Y.S.; Lagarias, J.C. Phytochrome structure and signaling mechanisms. Ann. Rev. Plant Biol. 2006, 57, 837–858. [Google Scholar] [CrossRef]
  39. Samach, A.; Onouchi, H.; Gold, S.E.; Ditta, G.S.; Schwarz-Sommer, Z.; Yanofsky, M.F.; Coupland, G. Distinct Roles of CONSTANS Target Genes in Reproductive Development of Arabidopsis. Science 2000, 288, 1613–1616. [Google Scholar] [CrossRef] [PubMed]
  40. Zhu, D.; Maier, A.; Lee, J.-H.; Laubinger, S.; Saijo, Y.; Wang, H.; Qu, L.-J.; Hoecker, U.; Deng, X.W. Biochemical characterization of Arabidopsis complexes containing constitutively photomorphogenic1 and suppressor of PHYA proteins in light control of plant development. Plant Cell 2008, 20, 2307–2323. [Google Scholar] [CrossRef]
  41. Lian, H.L.; He, S.-B.; Zhang, Y.-C.; Zhu, D.-M.; Zhang, J.-Y.; Jia, K.-P.; Sun, S.-X.; Li, L.; Yang, H.-Q. Blue-light-dependent interaction of cryptochrome 1 with SPA1 defines a dynamic signaling mechanism. Genes Dev. 2011, 25, 1023–1028. [Google Scholar] [CrossRef]
  42. Zuo, Z.; Liu, H.; Liu, B.; Liu, X.; Lin, C. Blue light-dependent interaction of CRY2 with SPA1 regulates COP1 activity and floral initiation in Arabidopsis. Curr. Biol. 2011, 21, 841–847. [Google Scholar] [CrossRef]
  43. Hajdu, A.; Adam, E.; Sheerin, D.J.; Dobos, O.; Bernula, P.; Hiltbrunner, A.; Kozma-Bognar, L.; Nagy, F. High-level expression and phosphorylation of phytochrome B modulates flowering time in Arabidopsis. Plant J. 2015, 83, 794–805. [Google Scholar] [CrossRef] [PubMed]
  44. Valverde, F.; Mouradov, A.; Soppe, W.; Ravenscroft, D.; Samach, A.; Coupland, G. Photoreceptor Regulation of CONSTANS Protein in Photoperiodic Flowering. Science 1979, 303, 1003–1006. [Google Scholar] [CrossRef] [PubMed]
  45. Sheerin, D.J.; Menon, C.; Oven-Krockhaus, S.Z.; Enderle, B.; Zhu, L.; Johnen, P.; Schleifenbaum, F.; Stierhof, Y.-D.; Huq, E.; Hiltbrunner, A. Light-activated phytochrome A and B interact with members of the SPA family to promote photomorphogenesis in Arabidopsis by reorganizing the COP1/SPA complex. Plant Cell 2015, 27, 189–201. [Google Scholar] [CrossRef] [PubMed]
  46. Weller, J.L.; Schreuder, M.E.; Smith, H.; Koornneef, M.; Kendrick, R.E. Physiological interactions of phytochromes A, B1 and B2 in the control of development in tomato. Plant J. 2000, 24, 345–356. [Google Scholar] [CrossRef]
  47. Bianchetti, E.R.; Lira, B.S.; Monteiro, S.S.; Demarco, D.; Purgatto, E.; Rothan, C.; Rossi, M.; Freschi, L. Fruit-localized phytochromes regulate plastid biogenesis, starch synthesis, and carotenoid metabolism in tomato. J. Exp. Bot. 2018, 69, 3573–3586. [Google Scholar] [CrossRef]
  48. Bianchetti, R.; Bellora, N.; De Haro, L.A.; Zuccarelli, R.; Rosado, D.; Freschi, L.; Rossi, M.; Bermudez, L. Phytochrome-Mediated Light Perception Affects Fruit Development and Ripening Through Epigenetic Mechanisms. Front Plant Sci. 2022, 13, 870974. [Google Scholar] [CrossRef]
  49. Wubs, A.M.; Ma, Y.; Heuvelink, E. Fruit Set and Yield Patterns in Six Capsicum Cultivars. HortScience 2009, 44, 1296–1301. [Google Scholar] [CrossRef]
  50. Wubs, A.M.; Ma, Y.; Heuvelink, E.; Marcelis, L.F. Genetic differences in fruit-set patterns are determined by differences in fruit sink strength and a source: Sink threshold for fruit set. Ann. Bot. 2009, 104, 957–964. [Google Scholar] [CrossRef]
  51. Hu, C.; Nawrocki, W.J.; Croce, R. Long-term adaptation of Arabidopsis thaliana to far-red light. Plant Cell Environ. 2021, 44, 3002–3014. [Google Scholar] [CrossRef]
  52. Ji, Y.; Nuñez Ocaña, D.; Choe, D.; Larsen, D.H.; Marcelis, L.F.; Heuvelink, E. Far-red radiation stimulates dry mass partitioning to fruits by increasing fruit sink strength in tomato. New Phytol. 2020, 228, 1914–1925. [Google Scholar] [CrossRef]
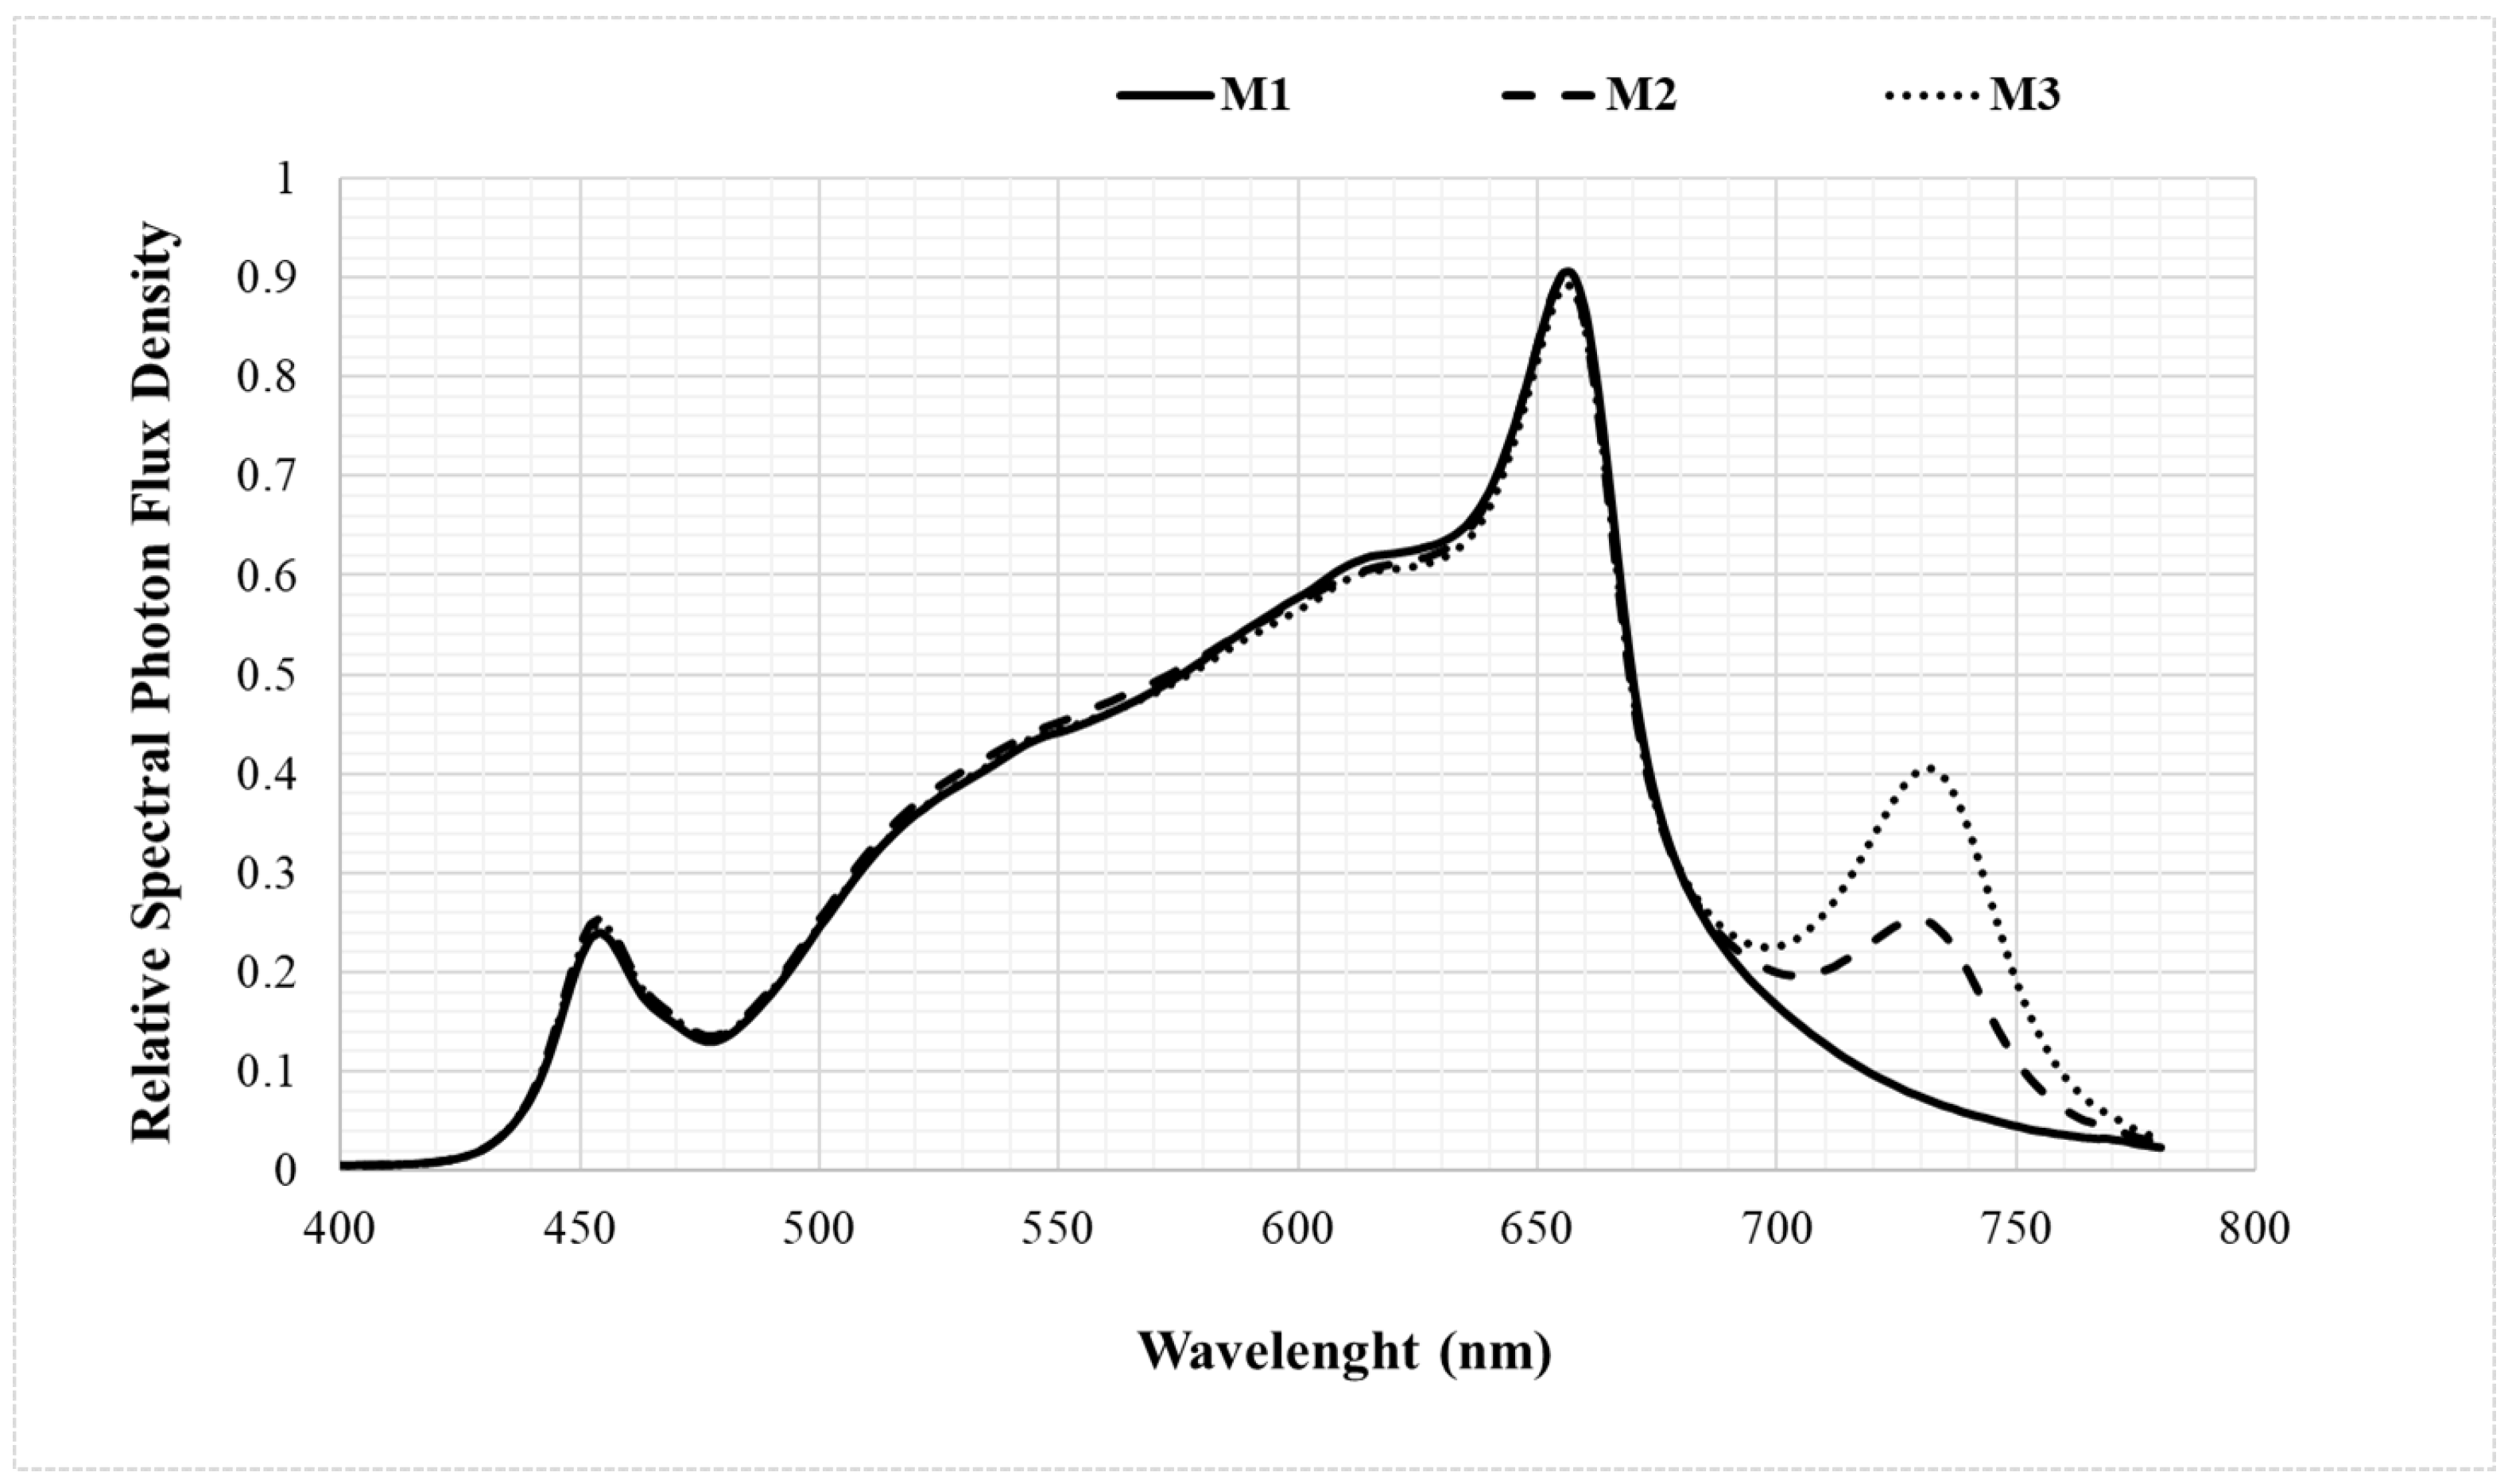
Figure 1. The experimental light spectrum with the far-red supplements. Blue (400–500 nm), green (500–600 nm), red (600–700 nm), and far-red (700–780 nm). The treatments M1, M2, and M3 denote 5.5 µmol m−2 s−1, 12 µmol m−2 s−1, and 18.1 µmol m−2 s−1 of the far-red supplement, respectively.
Agronomy 15 00732 g001
Figure 2. FR supplements stimulated the vegetative growth of sweet pepper. (A) plant height; (B) representative images of plants in the three treatments; (C) fresh root weight (FRW), dry root weight (DRW), and root length (RL); (D) representative images of roots in the three treatments. W1, W2, W3, and W4: 1, 2, 3, and 4 weeks after the treatments started. M1, M2, and M3: 5.5 µmol m−2 s−1, 12 µmol m−2 s−1, and 18.1 µmol m−2 s−1 of far-red supplements, respectively. One, two, and four asterisks denote statistical significance at p < 0.05, p < 0.01 and p < 0.0001, respectively; one-way ANOVA, Tukey’s post hoc test. ns: not significant.
Agronomy 15 00732 g002
Figure 3. FR supplements stimulated the growth of sweet pepper plants during flowering. (A) plant height; (B) representative images of plants in the three treatments; (C) fresh root weight (RFW), dry root weight (DRW), and root length (RL); (D) representative images of roots in the three treatments. W1, W2, W3, and W4: 1, 2, 3, and 4 weeks after treatments started. M1, M2, and M3: 5.5 µmol m−2 s−1; 12 µmol m−2 s−1, and 18.1 µmol m−2 s−1 of far-red supplements, respectively. One, two and four asterisks denote statistical significance at p < 0.05, p < 0.01, and p < 0.0001, respectively; one-way ANOVA, Tukey’s post hoc test. ns: not significant.
Agronomy 15 00732 g003
Figure 4. Representative images of roots and fruits of bell pepper plants in response to a gradient of far-red supplements. Plant treatments with far-red light were started after seedling transplantation, i.e., early in the vegetative stage. (A) Capsicum annuum cv. Liberty Belle (LB); (B) Capsicum annuum cv. Fresh Bites (FB). LB1, LB2, and LB3 as well as FB1, FB2, and FB3 represent 5.5 µmol m−2 s−1; 12 µmol m−2 s−1; and 18.1 µmol m−2 s−1 far-red supplements, respectively.
Agronomy 15 00732 g004
Figure 5. Nutritional quality of bell pepper plants in response to a gradient of far-red supplements early in the vegetative stage. Total soluble sugar content (A), phenolic content (B), ascorbic acid (C), lycopene (D), ABTS (E), DPPH (F), and representative images of fruit in the three treatments (G). M1, M2, and M3: 5.5 µmol m−2 s−1; 12 µmol m−2 s−1, and 18.1 µmol m−2 s−1 of far-red supplements, respectively. One, two, three, and four asterisks denote statistical significance at p < 0.05, p < 0.01, p < 0.001, and p < 0.0001, respectively; one-way ANOVA, Tukey’s post hoc test. ns: not significant.
Agronomy 15 00732 g005
Figure 6. Nutritional quality of bell pepper plants exposed to far-red supplements at the onset of the first flower bud. Total soluble sugar content (A), phenolic content (B), ascorbic acid (C), lycopene (D), ABTS (E), DPPH (F), and representative images of fruit in the three treatments (G). M1, M,2 and M3: 5.5 µmol m−2 s−1; 12 µmol m−2 s−1; and 18.1 µmol m−2 s−1 of far-red, respectively. One, two, and four asterisks denote statistical significance at p < 0.05, p < 0.01, and p < 0.0001, respectively; one-way ANOVA, Tukey’s post hoc test. ns: not significant.
Agronomy 15 00732 g006
Table 1. Light spectrum intensity of different light treatments M1, M2, and M3.
Light TreatmentsPPFD 2
(μmol m−2 s−1)
PFD 3
(μmol m−2 s−1)
PFD (μmol m−2 s−1)R:BR:FR 4R:G
Blue GreenRedFR 1
M1110.7116.311.043.556.35.55.110.21.3
M2110.5123.711.544.255.812.04.84.61.3
M3110.4128.611.343.455.718.14.93.11.3
1 M1, M2, and M3 represent light sources that were supplemented with 5.5, 12, and 18.1 μmol m−2 s−1 of far-red (FR) radiation, respectively. 2 PPFD, photosynthetic photon flux density (μmol m−2 s−1). 3 PFD, photon flux density to 400 at 780 nm. 4 Ratio R:FR, photon irradiance (666–775 nm)/photonic irradiance (725–735 nm).
Table 2. Photosynthesis parameters determined from light–response curves obtained from plant leaves exposed to a gradient of far-red supplements at different growth stages.
AmaxLCPLRα
Vegetative phase
M111.32 ± 0.30a24.45 ± 6.70a−1.19 ± 0.36a0.049 ± 0.001a
M213.30 ± 1.05a24.72 ± 3.35a−1.22 ± 0.17a0.049 ± 0.001a
M312.11 ± 1.33a24.34 ± 0.84a−1.12 ± 0.01a0.046 ± 0.001b
Reproductive phase
M18.70 ± 1.70a13.61 ± 2.84a−0.70 ± 0.14a0.052 ± 0.002a
M29.01 ± 1.64a08.56 ± 3.74a−0.15 ± 3.78a0.039 ± 0.005b
M39.96 ± 0.90a12.65 ± 1.09a−0.60 ± 0.11a0.047 ± 0.006ab
Far-red light was applied to plants when seedlings were transplanted (vegetative phase) or upon the appearance of the first flower bud (reproductive phase). Data were collected 28 days after treatment. The light compensation point (LCP, µmol m−2 s−1), light respiration (LR, µmol CO2 m−2 s−1), and apparent quantum yield (α, µmol CO2 m−2 s−1/µmol m−2 s−1) were calculated from a regression line (y = mx + b) fitted to the values between the PAR values of 0–120 µmol m−2 s−1. The maximum assimilation (Amax, µmol CO2 m−2 s−1) was calculated from y = yo + a × x/(b + x). Values ± SE of the means are representative of n = 3 samples collected during one representative whole experimental repeat. The experiment with far-red application at the vegetative stage was repeated three times, and the one with far-red application at the reproductive stage was performed two times (see further details in Section 2). M1, M2, and M3: 5.5 µmol m−2 s−1, 12 µmol m−2 s−1, and 18.1 µmol m−2 s−1 of far-red supplements, respectively. Significantly different mean values are indicated by different letters; p < 0.05, one-way ANOVA, Tukey’s post hoc test.
Table 3. Photosynthesis parameters derived from CO2–response curves obtained from plant leaves exposed to a gradient of far-red supplements at different growth stages.
AmaxDCPDRƐ
Vegetative phase
M113.30 ± 1.22a57.76 ± 0.09a−1.25 ± 0.14a0.022 ± 0.002a
M216.06 ± 0.00a70.90 ± 5.96a−1.60 ± 0.09a0.023 ± 0.003a
M313.45 ± 2.76a66.74 ± 7.04a−1.48 ± 0.10a0.022 ± 0.004a
Reproductive phase
M113.74 ± 0.40a51.55 ± 1.54a−1.04 ± 0.10a0.020 ± 0.002a
M213.57 ± 1.39a51.32 ± 2.62a−0.78 ± 0.28a0.015 ± 0.005b
M313.95 ± 0.78a51.62 ± 6.01a−0.58 ± 1.16a0.021 ± 0.006a
Far-red light was applied to plants when seedlings were transplanted (vegetative phase) or upon the appearance of the first flower bud (reproductive phase). Data were collected 28 days after treatment. The dark compensation point (DCP, µmol m−2 s−1), dark respiration (DR, µmol CO2 m−2 s−1), and carboxylation efficiency (ɛ, µmol CO2 m−2 s−1/µmol m−2 s−1) were calculated from a regression line (y = mx + b) fitted to the values between the CO2 values of 50–300 µmol m−2 s−1. The maximum assimilation (Amax, µmol CO2 m−2 s−1) was calculated from y = yo + a × x/(b + x). Values ± SE of the means are representative of n = 3 collected during one representative whole experimental repeat. The experiment with far-red application at the vegetative stage was repeated three times, and the one with far-red application at the reproductive stage was performed two times (see further details in Section 2). M1, M2, and M3: 5.5 µmol m−2 s−1, 12 µmol m−2 s−1, and 18.1 µmol m−2 s−1 of far-red supplements, respectively. Significantly different mean values are indicated by different letters; p < 0.05, one-way ANOVA, Tukey’s post hoc test.
Table 4. Agro-morphological characteristics of bell pepper plants in response to a gradient of far-red supplements.
Vegetative StageReproductive Stage
M1M2M3M1M2M3
Plant height (cm)29.1 ± 0.71b33.48 ± 0.47a33.88 ± 0.76a37.63 ± 2.16b43.93 ± 2.54a46.73 ± 5.96a
Leaf number42.5 ± 2.38a41.75 ± 1.26a33.0 ± 0.82bN/AN/AN/A
Leaf area (cm2)101.1 ± 12.52a96.87 ± 9.88a90.1 ± 9.49aN/AN/AN/A
Stem diameter (mm)8.39 ± 0.35a8.71 ± 0.51a8.64 ± 0.23a8.36 ± 0.63a8.89 ± 0.45a8.83 ± 0.19a
Nodes number8.25 ± 0.50a8.5 ± 0.58a9.00 ± 0.0a20.33 ± 0.58a19.33 ± 2.31a17.0 ± 1.0a
Internodes length (cm)2.92 ± 0.07b3.32 ± 0.16a3.37 ± 0.09a1.78 ± 0.11a2.08 ± 0.28a2.53 ± 0.55a
The treatments M1, M2, and M3 denote 5.5 µmol m−2 s−1; 12 µmol m−2 s−1, and 18.1 µmol m−2 s−1 of the far-red supplement, respectively. N/A denotes “non applicable”. The FR supplements were applied to plants when seedlings were transplanted (vegetative phase) or upon the appearance of the first flower bud (reproductive phase). Data were collected 28 days after treatment. Values ± SE of the means are representative of n = 4 collected during one representative whole experimental repeat. The experiment with far-red application at the vegetative stage was repeated three times, and the one with far-red application at the reproductive stage was performed two times (see further details in Section 2). Significantly different mean values are indicated by different letters; p < 0.05, one-way ANOVA, Tukey’s post hoc test.
Table 5. Effects of far-red supplements on the growth of bell pepper (Capsicum annuum cv. Margrethe).
Vegetative StageReproductive Stage
M1M2M3M1M2M3
Time to flowering (days) 146.25 ± 0.50c49.5 ± 1.0b55.75 ± 1.5aN/AN/AN/A
Number of flowers 210.25 ± 1.26a7.5 ± 1.29b3.5 ± 1.29c9.33 ± 0.58a3.33 ± 0.58c5.67 ± 0.58b
Survival time of fallen flowers (days) 27.67 ± 1.16b13.67 ± 1.53a13.67 ± 0.58a7.75 ± 1.26b12.25 ± 0.96a11.0 ± 3.56ab
Fruits set (%) 236.36 ± 8.17a50.0 ± 5.77a33.3 ± 5.0a33.3 ± 11.5a26.7 ± 5.8a40.0 ± 10.0a
Time to fruit set (days) 23.50 ± 0.58a4.0 ± 0.82a3.25 ± 0.5a4.67 ± 0.58a4.67 ± 0.58a4.33 ± 0.58a
Ripening time (days) 259.75 ± 1.26a59.75 ± 0.96a54.5 ± 1.92b63.67 ± 0.58b69.67 ± 2.52ab72.0 ± 2.65a
Fruits collected 3405642384636
Yields (kg/14 plants) 34.6928.2266.16983.5905.3854.281
1 Determined from 4 bell pepper plants (n = 4); 2 only flowers counted during the first 14 days were monitored; 3 results obtained from 14 bell pepper plants (n = 14). Values ± SE of the means are representative of n = 4 or 14 collected during one representative whole experimental repeat. The experiment with far-red application at the vegetative stage was repeated three times, and the one with far-red application at the reproductive stage was performed two times (see further details in Section 2) with similar results. M1, M2, and M3: 5.5 µmol m−2 s−1; 12 µmol m−2 s−1; and 18.1 µmol m−2 s−1 of far-red supplements, respectively. Significantly different mean values are indicated by different letters; p < 0.05, one-way ANOVA, Tukey’s post hoc test.
Table 6. Effects of far-red supplements on thickness, volume, dry matter content, and fresh weight of fruit bell pepper (Capsicum annuum cv. Margrethe).
FR Treatment:Beginning at Vegetative StageBeginning at Reproductive Stage
M1M2M3M1M2M3
Thickness (mm)9.80 ± 0.44ab10.90 ± 0.82a8.80 ± 0.45b8.95 ± 0.34a8.33 ± 0.60a5.40 ± 0.25b
Volume (cm3)129.06 ± 24.01a184.20 ± 33.43a181.79 ± 35.72a121.41 ± 12.09a151.73 ± 13.16a158.77 ± 28.24a
Dry matter (%)7.85 ± 0.55a7.46 ± 0.56a6.77 ± 0.68a8.30 ± 0.14a6.64 ± 0.05a6.98 ± 0.37a
Weight (g)117.30 ± 2.66b146.89 ± 5.48a146.90 ± 5.59a94.47 ± 5.43b117.06 ± 2.75a118.91 ± 1.64a
Values ± SE of the means are representative of n = 4 samples collected in one representative whole experimental repeat. The experiment with far-red application at the vegetative stage was repeated three times, and the one with far-red application at the reproductive stage was performed two times (see further details in Section 2) with similar results. M1, M2 and M3: 5.5 µmol m−2 s−1, 12 µmol m−2 s−1, and 18.1 µmol m−2 s−1 of far-red supplements, respectively. Significantly different mean values are indicated by different letters; p < 0.05, one-way ANOVA, Tukey’s post hoc test.
Table 7. Effects of far-red supplements on bell pepper (Capsicum annuum cv. Margrethe) fruit quality.
FR Treatments:Beginning at Vegetative StageBeginning at Reproductive Stage
M1M2M3M1M2M3
Glucose (mg g−1 MF)18.96 ± 0.50b19.70 ± 0.18a18.50 ± 0.09b17.52 ± 1.03a16.77 ± 0.65a16.56 ± 0.01a
Fructose (mg g−1 MF)16.55 ± 0.08b18.49 ± 0.04a16.23 ± 0.10b14.96 ± 1.06a15.89 ± 0.78a14.26 ± 0.15a
Sucrose (mg g−1 MF)0.73 ± 0.13a0.77 ± 0.19a0.38 ± 0.02b0.70 ± 0.07a0.81 ± 0.10a0.55 ± 0.01b
Values ± SE of the means are representative of n = 4 collected in one representative whole experimental repeat. The experiment with far-red application at the vegetative stage was repeated three times, and the one with far-red application at the reproductive stage was performed two times (see further details in Section 2) with similar results. M1, M2, and M3: 5.5 µmol m−2 s−1, 12 µmol m−2 s−1, and 18.1 µmol m−2 s−1 of far-red supplements, respectively. Significantly different mean values are indicated by different letters; p < 0.05, one-way ANOVA, Tukey’s post hoc test.
Disclaimer/Publisher’s Note: The statements, opinions and data contained in all publications are solely those of the individual author(s) and contributor(s) and not of MDPI and/or the editor(s). MDPI and/or the editor(s) disclaim responsibility for any injury to people or property resulting from any ideas, methods, instructions or products referred to in the content.