Article

The Half-Heading Stage May Represent the Optimal Harvest Time for the First Cut of Tall Wheatgrass

by
Wei Li
1,2,
Qiang Xiao
2,3,
Zhengwu Fang
1,*,
Qi Zheng
2,
Hongwei Li
2,* and
Zhensheng Li
2
1
MARA Key Laboratory of Sustainable Crop Production in the Middle Reaches of the Yangtze River (Co-Construction by Ministry and Province), College of Agriculture, Yangtze University, Jingzhou 434025, China
2
Key Laboratory of Seed Innovation, Institute of Genetics and Developmental Biology, Chinese Academy of Sciences, Beijing 100101, China
3
School of Agricultural Sciences, Jiangxi Agricultural University, Nanchang 330045, China
*
Authors to whom correspondence should be addressed.
Agronomy 2025, 15(4), 763; https://doi.org/10.3390/agronomy15040763
Submission received: 1 March 2025 / Revised: 16 March 2025 / Accepted: 17 March 2025 / Published: 21 March 2025

Abstract

:
Timely harvest is pivotal for the pasture management of tall wheatgrass, which has recently been suggested for coastal saline and alkaline soils. In this work, different culm parts in the top three internodes of tall wheatgrass during various heading stages were investigated to explore the precise harvesting time for the first cut, factors influencing forage quality, and correlations between the expression levels of genes involved in cellulose and lignin biosynthesis and forage nutritive value. The results show that the culms clipped at the half heading stage produced the highest crude protein (CP) yield. The top three leaves contributed the greatest proportion of total culm CP yield, accounting for 49%, 40%, and 30% of total culm CP yield at the just, half, and full heading stages, respectively. By contrast, the leaves and spikes produced lower yields of neutral detergent fiber (NDF), acid detergent fiber (ADF), acid detergent lignin (ADL), crude cellulose (CC), and hemicellulose (HC) than leaf sheaths and stems, indicating that the leaf/stem ratio can be used as an index for the cultivation and genetic improvement of tall wheatgrass. The lignin and cellulose biosynthesis genes expressed differentially in different culm parts of tall wheatgrass in response to the heading stage. The expression levels of HCT, encoding a hydroxycinnamoyl CoA:shikimate hydroxycinnamoyl transferase, were negatively correlated with the CP content and relative feed value, but positively correlated with the yields of dry matter, NDF, ADF, CC, and HC, suggesting that it may be used as a marker gene linked to the forage quality of tall wheatgrass.

1. Introduction

Tall wheatgrass (Elytrigia elongata (Host) Nevski = Thinopyrum ponticum (Podp.) Z.W. Liu and R.C. Wang, 2n = 10x = 70), which originated in southern Europe, Asia Minor, and southern Russia, is a perennial cool-season bunchgrass. It has been extensively cultivated in America, Canada, Argentina, Australia, and some European countries as a saline pasture, soil reclamation, and energy crop for over half a century [1,2]. Tall wheatgrass confers a high level of tolerance to salt–alkali and other stresses such as drought, waterlogging, and diseases, which makes it valuable as a forage crop in saline and alkaline soils [2,3]. It can avoid competition with food crops for arable land and water resources to grow salt–alkali-tolerant forage crops in saline and alkaline soils. Recently, for instance, it has been recommended for the construction of a “Coastal Grass Belt” around the Bohai Sea region [3,4,5,6,7], which is unprofitable for food crops.
Tall wheatgrass has gained a reputation for its coarser and less palatable forage compared with other wheatgrasses [1]. For instance, an early study showed that cows preferred intermediate wheatgrass (Thinopyrum intermedium) and smooth bromegrass (Bromus inermis) over tall wheatgrass, which produced less milk per unit pasture [8]. Warren and Casson (1992) [9] reported that sheep grazing on tall wheatgrass lost more body weight than those on tall wheatgrass plots with a mix of Atriplex lentiformis or A. undulata over a 56-day experiment. A recent study also demonstrated that both cows and calves gained less weight on seeded tall wheatgrass than in native rangelands and on seeded western wheatgrass (Pascopyrum smithii) [10]. Furthermore, Castellaro et al. (2018) [11] found that both sheep and goats were prone to Festuca arundinacea and Bromus hordeaceus but rejected tall wheatgrass when given free choice. However, an earlier study indicated that beef cattle gains on tall wheatgrass were equivalent to those on intermediate wheatgrass and smooth bromegrass [12]. In spite of its coarse leaves and stems, tall wheatgrass remains quite palatable, and its protein and digestibility are sustained relatively well during late summer in Nebraska, accounting for a potential grazing period of 11–12 weeks [13].
The herbage quality of tall wheatgrass is determined by harvesting time and frequency, as well as genetic variance. For instance, its crude protein (CP) content was 20.47%, 14.07%, 6.94%, 6.31%, and 25.68% at the stem elongation, heading, flowering, seed maturity, and regrowth stages, respectively [14]. In Oklahoma, the CP content ranged from 20.3% to 22.3%, from 16.4% to 18.6%, and from 11.1% to 16.8% in April, May, and June, respectively [15]. On average, the CP content in 22 Iranian tall wheatgrass populations was 20.5%, 16.0%, 10.8%, 11.6%, 13.4%, and 13.0% at the vegetation, stem elongation, heading, anthesis, seed milky, and seed maturity stages, respectively [16]. In addition, the CP contents of 50 tall wheatgrass accessions ranged from 6.6% to 11.0% and from 20.8% to 26.3% at the first (July) and second cut (October), respectively [17], while the IVDMD (in vitro dry matter digestibility) varied from 41.8% to 54.8% and from 57.6% to 72.2% at the first and second harvest, respectively, which is indicative of large genetic variance in the USDA’s tall wheatgrass collections. The forage of tall wheatgrass can be of high quality in the vegetative stage for grazing, hay, and silage. For instance, from mid-April to mid-June, it can provide high-quality forage for livestock in New Mexico, while from summer to fall, the forage quality declines drastically once in the reproductive stage [17,18]. Therefore, it is essential to harvest tall wheatgrass at the optimal time when considering both forage yield and quality. Recently, Li et al. (2024) [19] suggested that two cuts per year may be acceptable for tall wheatgrass in the “Coastal Grass Belt” targeted region around the Bohai Sea. Furthermore, the authors recommended the end of May as the optimal harvesting time for the first cut and the end of October for the second cut. However, such calendar dates are usually rough and imprecise, as plant growth status may vary due to soil salinity, water deficiency, and latitude. Currently, the precise harvesting time and index for the first cut of tall wheatgrass are still unclear.
The concentrations of plant cell wall components, mainly consisting of cellulose, hemicellulose, and lignin, determine forage intake, digestibility, and thus quality [20]. The amount of cellulose, hemicellulose, and lignin can be estimated as neutral detergent fiber (NDF), while that of cellulose and lignin can be quantified as acid detergent fiber (ADF). NDF content, an estimate of the cell wall content, affects forage intake, while ADF level, an estimate of the more lignified cell wall content, influences forage digestibility [21]. Lignin content can be determined as acid detergent lignin (ADL), which also influences forage digestibility. The contents of crude cellulose (CC) and hemicellulose (HC) can be computed from NDF, ADF, and ADL. As the digestion of CC and HC in the livestock rumen is much slower than that of starch [22], higher contents of NDF, ADF, and ADL represent lower forage quality. The relative feed value (RFV), computed based on NDF and ADF, and the CP/NDF ratio are commonly used to evaluate forage quality. As tall wheatgrass matures, the contents of NDF, ADF, and ADL increase, while the CP content decreases [18], leading to a reduction in dry matter (DM) intake, digestibility, and consequently forage quality. The forage nutritive value of tall wheatgrass is determined by the proportion of leaves, leaf sheaths, stems, and spikes, each containing different concentrations of CP, NDF, ADF, and ADL. However, the contents and yields of CP, NDF, and ADF in different culm parts of tall wheatgrass in response to the heading stage remain elusive, thereby limiting the understanding of the end-product forage quality of tall wheatgrass.
At maturity, lignified plant cell walls reduce the digestibility of cell walls and DM [23]. In the cell wall, lignin crosslinks with cellulosic polysaccharides and proteins, thereby blocking the access of these polymers to cell wall-degrading enzymes and restricting the amount of total digestible energy available to herbivores. One potential approach to enhance cell wall digestibility is to reduce lignin content through the regulation of the expression levels of lignin biosynthesis genes [23,24,25]. Lignin polymers are primarily composed of monolignols, including guaiacyl (G), syringyl (S), and p-hydroxyphenyl (H) units, respectively [26]. The monolignol biosynthesis pathway involves a series of enzymes, including phenylalanine ammonia lyase (PAL), cinnamate 4-hydroxylase (C4H), 4-coumarate:CoA ligase (4CL), p-coumarate 3-hydroxylase (C3H), p-hydroxycinnamoyl CoA:shikimate hydroxycinnamoyl transferase (HCT), ferulate-5-hydroxylase (F5H), caffeic acid 3-O-methyltransferase (COMT), caffeoyl-CoA O-methyltransferase (CCoAOMT), cinnamoyl-CoA reductase (CCR) and cinnamyl alcohol dehydrogenase (CAD). The regulation of lignin biosynthesis gene expression also contributes to pathogen-induced lignification [27]. Several studies have demonstrated that the downregulation of PAL, C4H, or 4CL results in reduced lignin content in both Arabidopsis and Populus [28,29,30,31]. Additionally, the reduced expression of SbCAD has been shown to lead to a reduction in lignin content and the spontaneous brown midrib (bmr) phenotype in sorghum (Sorghum bicolor (L.) Moench) [32]. To date, there are no reports on the expression levels of the lignin and cellulose biosynthesis genes in relation to the heading stage in tall wheatgrass. The objectives of this work were to determine: (1) the precise harvesting time for the first cut of tall wheatgrass; (2) the factors influencing the forage quality of tall wheatgrass; (3) the correlation between gene expression levels and forage nutritive value.

2. Materials and Methods

2.1. Plant Material and Growth

The tall wheatgrass line Zhongyan 1 was used in this study. The experiments were conducted at the Agricultural Experiment Station for Saline–Alkaline Land in the Yellow River Delta Region (118°84′03″ E, 37°68′74″ N), Institute of Genetics and Developmental Biology, Chinese Academy of Sciences. On 6 March 2021, seeds were germinated in darkness at 26 °C for 3 days, after which they were planted in 98-cell plastic trays (540 × 280 mm). Each cell contained one seedling, and the growth medium consisted of a 4:1 mixture of commercial substrate (0–10 mm, Pindstrup, Kongerslev, Denmark) and locally sourced field soil. An additional 15 mg kg−1 diammonium phosphate was applied in the medium. Seedlings were maintained in a greenhouse for over one month before being moved outdoors on 6 April 2021. Field transplantation was performed on 12 April 2021, using a 4-row transplanter (2ZBX-4, Chengfan Agricultural Equipment Co., Ltd., Weifang, China), with 0.3 m spacing between plants and 0.9–1.0 m intervals between the 4-row plots.
Third-year tall wheatgrass plants were selected to investigate the effects of the heading stage on first cut forage yield and quality. On 18 June 2024, culms at three distinct heading stages (just heading—spike tip 2–3 cm emerged; half heading—1/2 spike emerged; full heading—complete spike emergence) were cut from the same plants with a 15 cm stubble height left, corresponding primarily to the fourth internodes. For each heading stage, >10 culms were collected. Spikes, leaves, leaf sheaths, and stems in the top three internodes were hand-sectioned and assayed for dry weight, forage nutritive value, and gene expression profiling. In the Yellow River Delta Region, the tall wheatgrass at the first cut (168 days from 1 January) experiences approximately 120 mm accumulated precipitation, 1860 accumulating growing degree days, and 1460 sunshine hours [19].

2.2. DM and Forage Nutritive Value Measurement

The lengths and fresh weight of spikes, leaves, leaf sheaths, and stems were measured prior to oven-drying at 65 °C for 72 h. DM was calculated by multiplying the ratio of fresh to dry weight and fresh weight. The contents of CP, NDF, ADF, and ADL were assayed as described by Li et al. (2024) [19]. The relative feed value (RFV) and the contents of crude cellulose (CC) and hemicellulose (HC) were computed as follows:
RFV = DDM × DMI/1.29;
Digestible dry matter (DDM) = 88.9 − (0.779 × ADF);
Dry matter intake (DMI) = 120/NDF;
HC = NDF − ADF;
CC = ADF − ADL.
The forage nutritive value was computed as the product of the nutritive content and DM of each part of the culms.

2.3. RNA Extraction and First Strand cDNA Synthesis

Total RNA from all samples was extracted using the TRIzol Reagent (Thermo Fisher Scientific, Waltham, MA, USA) according to the manufacturer’s instructions. The RNA concentration was determined with a Nanodrop 2000 spectrophotometer (Thermo Fisher Scientific, USA). Then, after genomic DNA was removed with the TransScript One-Step gDNA Removal Kit (TransGen Biotech Co., Ltd., Beijing, China), 2 μg of total RNA was reverse-transcribed into first-strand cDNA using the TransScript cDNA Synthesis SuperMix kit (TransGen Biotech Co., Ltd., Beijing, China) in a 20 μL reaction volume. The cDNA product was diluted to 60 μL with H2O before being used for the assaying of gene expression levels.

2.4. Gene Expression Analysis

According to the full-length cDNA sequencing data of tall wheatgrass line Zhongyan 1, an actin gene ACT4 that was used as the internal reference gene and the gene-specific quantitative polymerase chain reaction (qPCR) primers for 26 genes were designed. The qPCR primer sequences are listed in Table S1. The qPCR reaction was performed following a three-step program with a StepOnePlus™ Real-Time PCR System (Thermo Fisher Scientific, USA). The 10 μL reaction mixture contained 1.5 μL cDNA, 5 μL 2× PowerUp SYBR Green Master Mix (Thermo Fisher Scientific, USA), and 0.3 μL of each 10 μM gene-specific primer. The expression levels of five genes including CSLD2, CSLH7, PAL1, 4CLL1, and HCT were determined in all samples. Also, the expression levels of an additional 21 genes were assayed in culms at the half heading stage. Four replicates were conducted for each sample. Relative gene expression levels were quantified according to the CT relative quantification method [33]. Heatmap visualization and clustering were generated with the pheatmap package (version 1.0.12) in R script (version 4.2.2) [34].

2.5. Data Summary and Statistics

Statistical analyses, including one-way analysis of variance (ANOVA) and post hoc multiple comparisons (least significant difference, LSD test), were performed using the software package SPSS (version 19.0, IBM, Armonk, NY, USA). Linear correlation analyses were conducted with Microsoft Excel 2016 (IBM, Armonk, NY, USA). Data are presented as mean ± standard deviation (SD) and were visualized using ggplot2 [35] and Microsoft Excel 2016.

3. Results

3.1. The Length and DM in Different Culm Parts During Heading Stage

The heights of clipped culms averaged 87.7, 106.2, and 121.8 cm at the just, half, and full heading stages, respectively. The lengths of spike, stem 2, and stem 3 accounted for 31.4–38.1%, 27.9–31.5%, and 21.1–30.4% of the total culm height, whereas stem 1 accounted for the lowest proportion (Figure 1a). The largest increment in stem height was ascribed to stem 1 from the half to full heading stage, indicating that the elongation of stem 1 plays a key role in determining culm height.
The DM yield in spike, all stems, and leaf sheaths 2 and 3 progressively increased from the just to half and full heading stages (Figure 1b). However, it declined in the flag leaf sheath and leaf 3 from the half to the full heading stage. Spike showed the highest proportion of total culm DM yield at the half and full heading stages, while stem 3 dominated at the just heading stage (Figure S1a). The contribution of leaves to DM yield declined, whereas spikes and stems showed an increasing trend with advancing heading stages (Figure S1b). Meanwhile, the proportion of leaf sheath to DM yield remained stable. The first internode contributed the largest proportion of DM yield, which increased with the progression of heading (Figure S1c).

3.2. The Content and Yield of CP in Different Culm Parts During Heading Stage

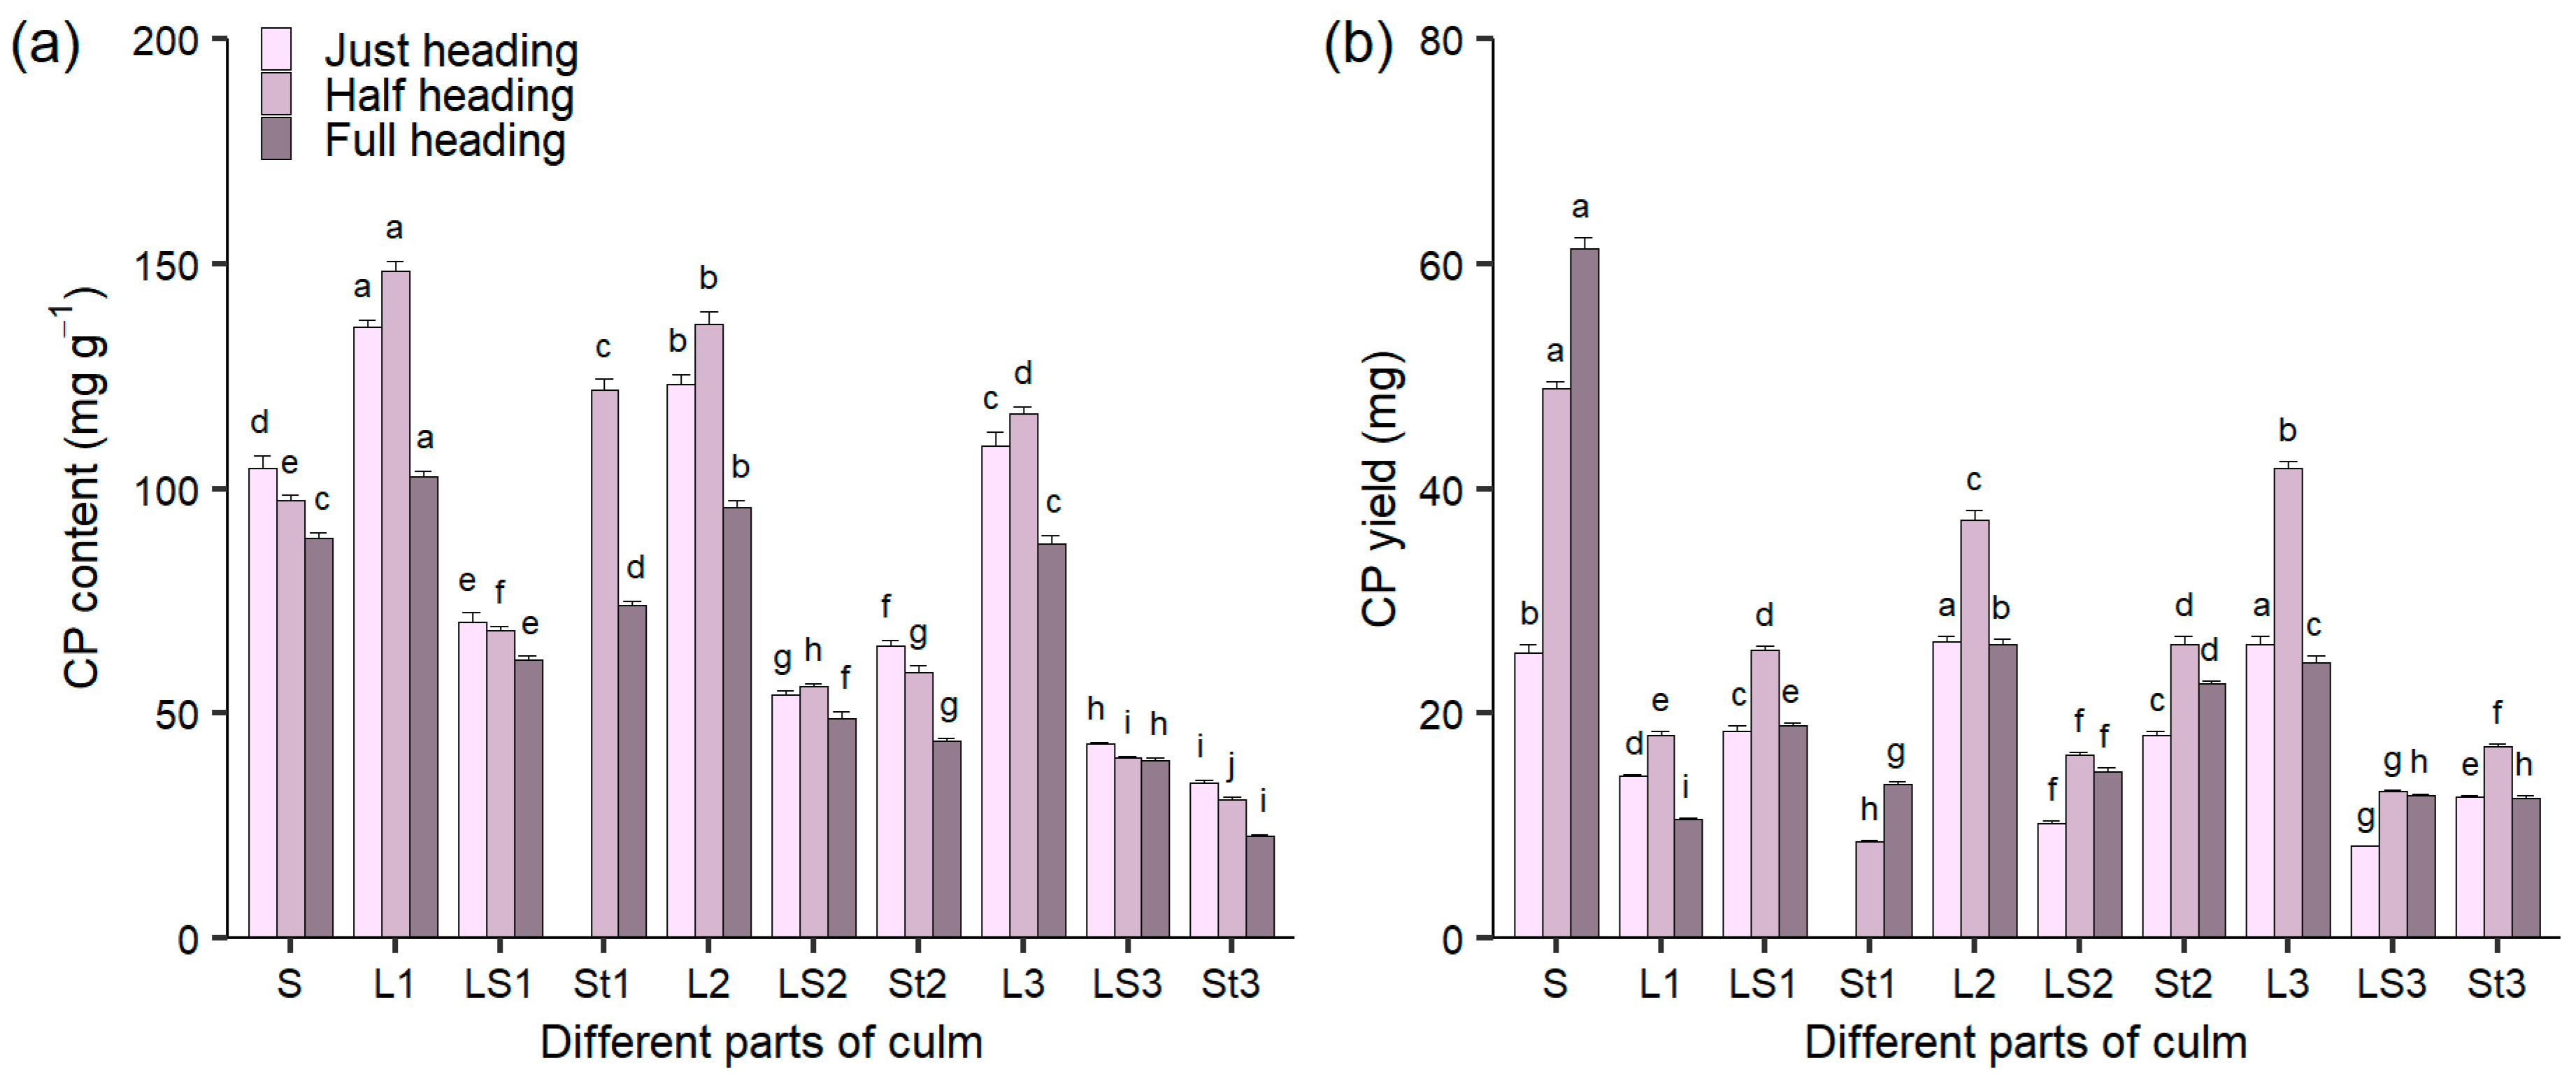
As shown in Figure 2a, the highest CP content was found in leaf 1 (flag leaf) while the lowest was observed in stem 3, regardless of the heading stages. It was higher in the top three leaves, followed by spike, compared to leaf sheaths and stems. The CP content increased from the lower to the upper positions in the leaves, leaf sheaths, and stems. For all parts, it decreased with advancing heading stages. Meanwhile, the CP content in stem 1 was higher than that in leaf sheaths and other stems, indicating that stem 1 can offer high-quality forage during the heading stage. Taken together, the top three leaves, spike, and stem 1 appear to have high CP content throughout the heading stage.
With the progression of heading, the CP yield in the spike increased markedly. It reached the highest value in the spike compared to the other parts at both half and full heading stages, followed by leaf 2 and leaf 3 (Figure 2b). In contrast, it declined from the half to the full heading stage in flag leaf, flag leaf sheath, leaf 2, leaf sheath 2, stem 2, leaf 3, and stem 3. At the just heading stage, comparable CP yields were observed in the spike, leaf 2, and leaf 3, which were significantly higher than those in other parts. The top three leaves and the spike showed the greatest proportions of total CP yield at the just and half heading stages, while the spike dominated at the full heading stage (Figure S2a). The percentage of CP yield in spikes and stems increased, while that in leaves decreased, with the progression of heading (Figure S2b). The first internode showed the greatest proportion of CP yield among all internodes (Figure S2c). Overall, the maximum CP yield per culm occurred at the half heading stage, indicating this stage as the optimal harvesting time.

3.3. The Content of Fiber and Cellulose in Different Culm Parts During Heading Stage

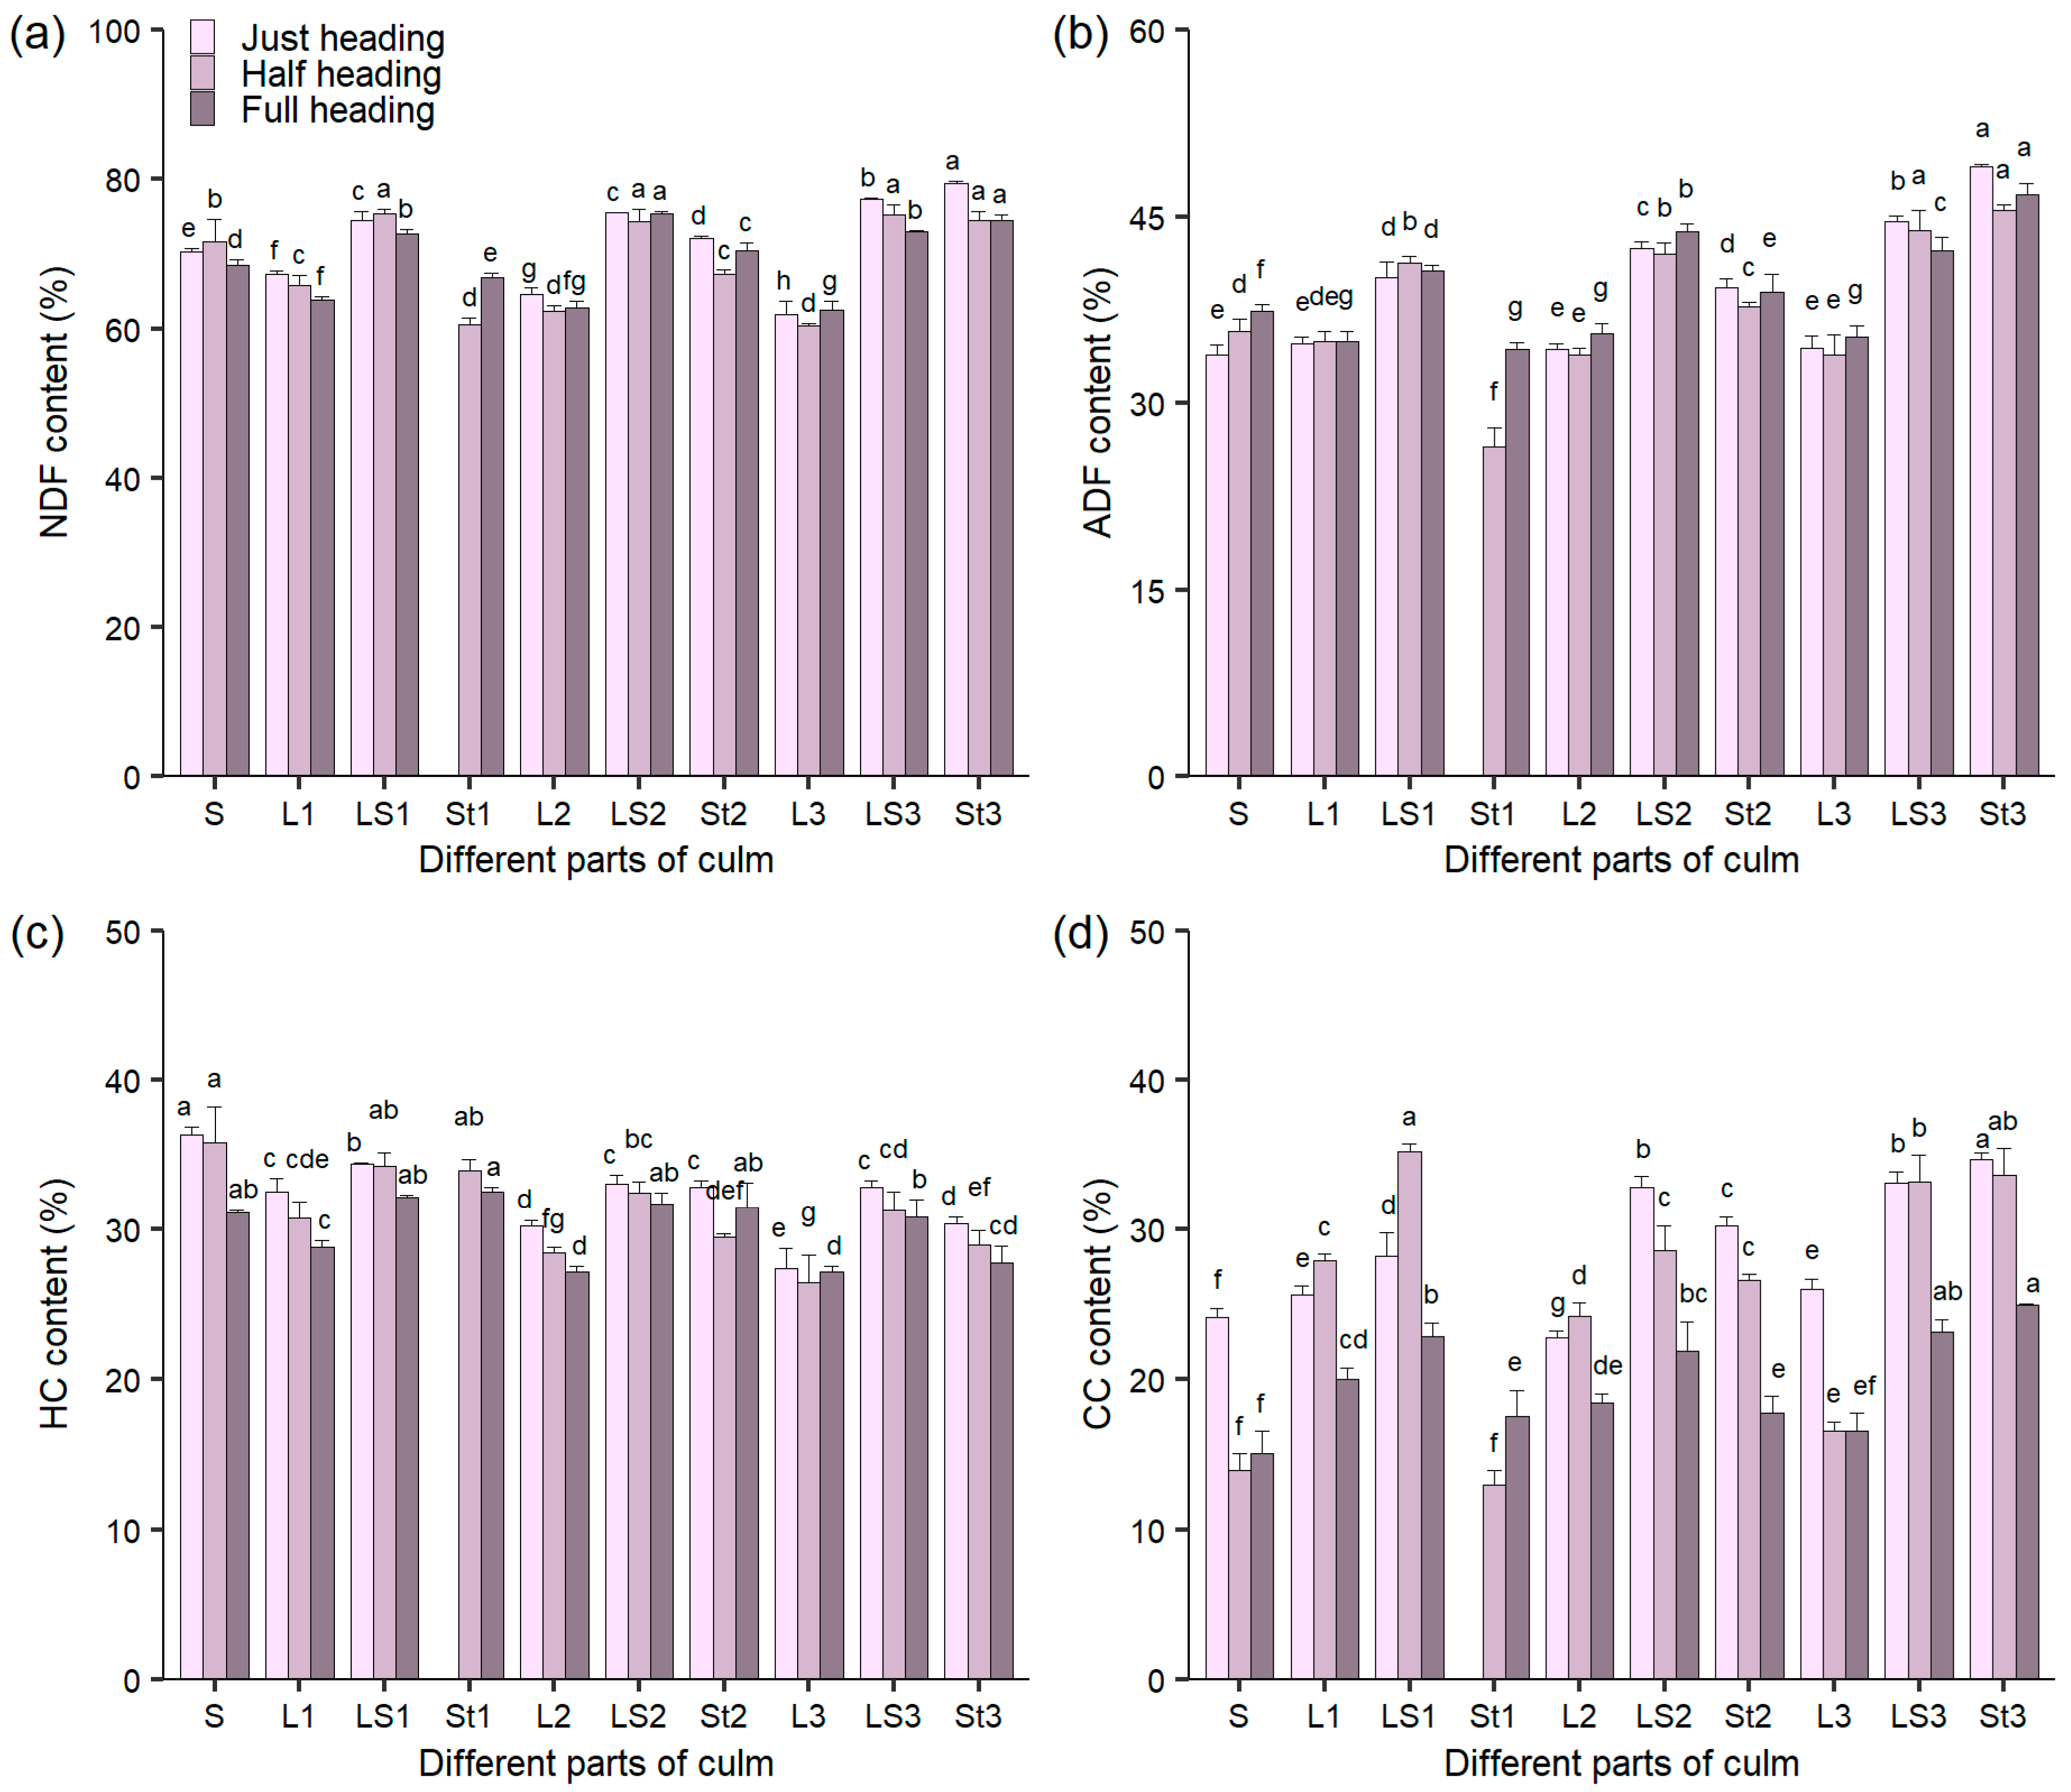
The contents of NDF, ADF, HC, and CC in different culm parts are shown in Figure 3. The NDF content was lower in the top three leaves and stem 1 than that in the other parts regardless of the heading stages. Meanwhile, it was higher in leaf sheaths, stem 2, and stem 3 than that in the spike (Figure 3a). The ADF content was lower in the spike, the top three leaves, and stem 1 relative to other culm parts (Figure 3b). Stem 3 exhibited the highest ADF content at the just heading stage, while stem 1 showed the lowest at the half heading stage. The HC content declined progressively from the just to the full heading stage, with leaf 3 consistently displaying the lowest values (Figure 3c). In the spike and leaf 3, the CC content showed a sharp reduction from the just to half heading stages, followed by declines in flag leaf, leaf 2, leaf 3, and stem 3 from the half to the full heading stage. At the half heading stage, the CC content reached its peak in the flag leaf sheath but decreased continuously in leaf sheath 2 and stem 2 from the just to the full heading stages (Figure 3d).

3.4. The Yields of Fiber and Cellulose in Different Culm Parts During Heading Stage

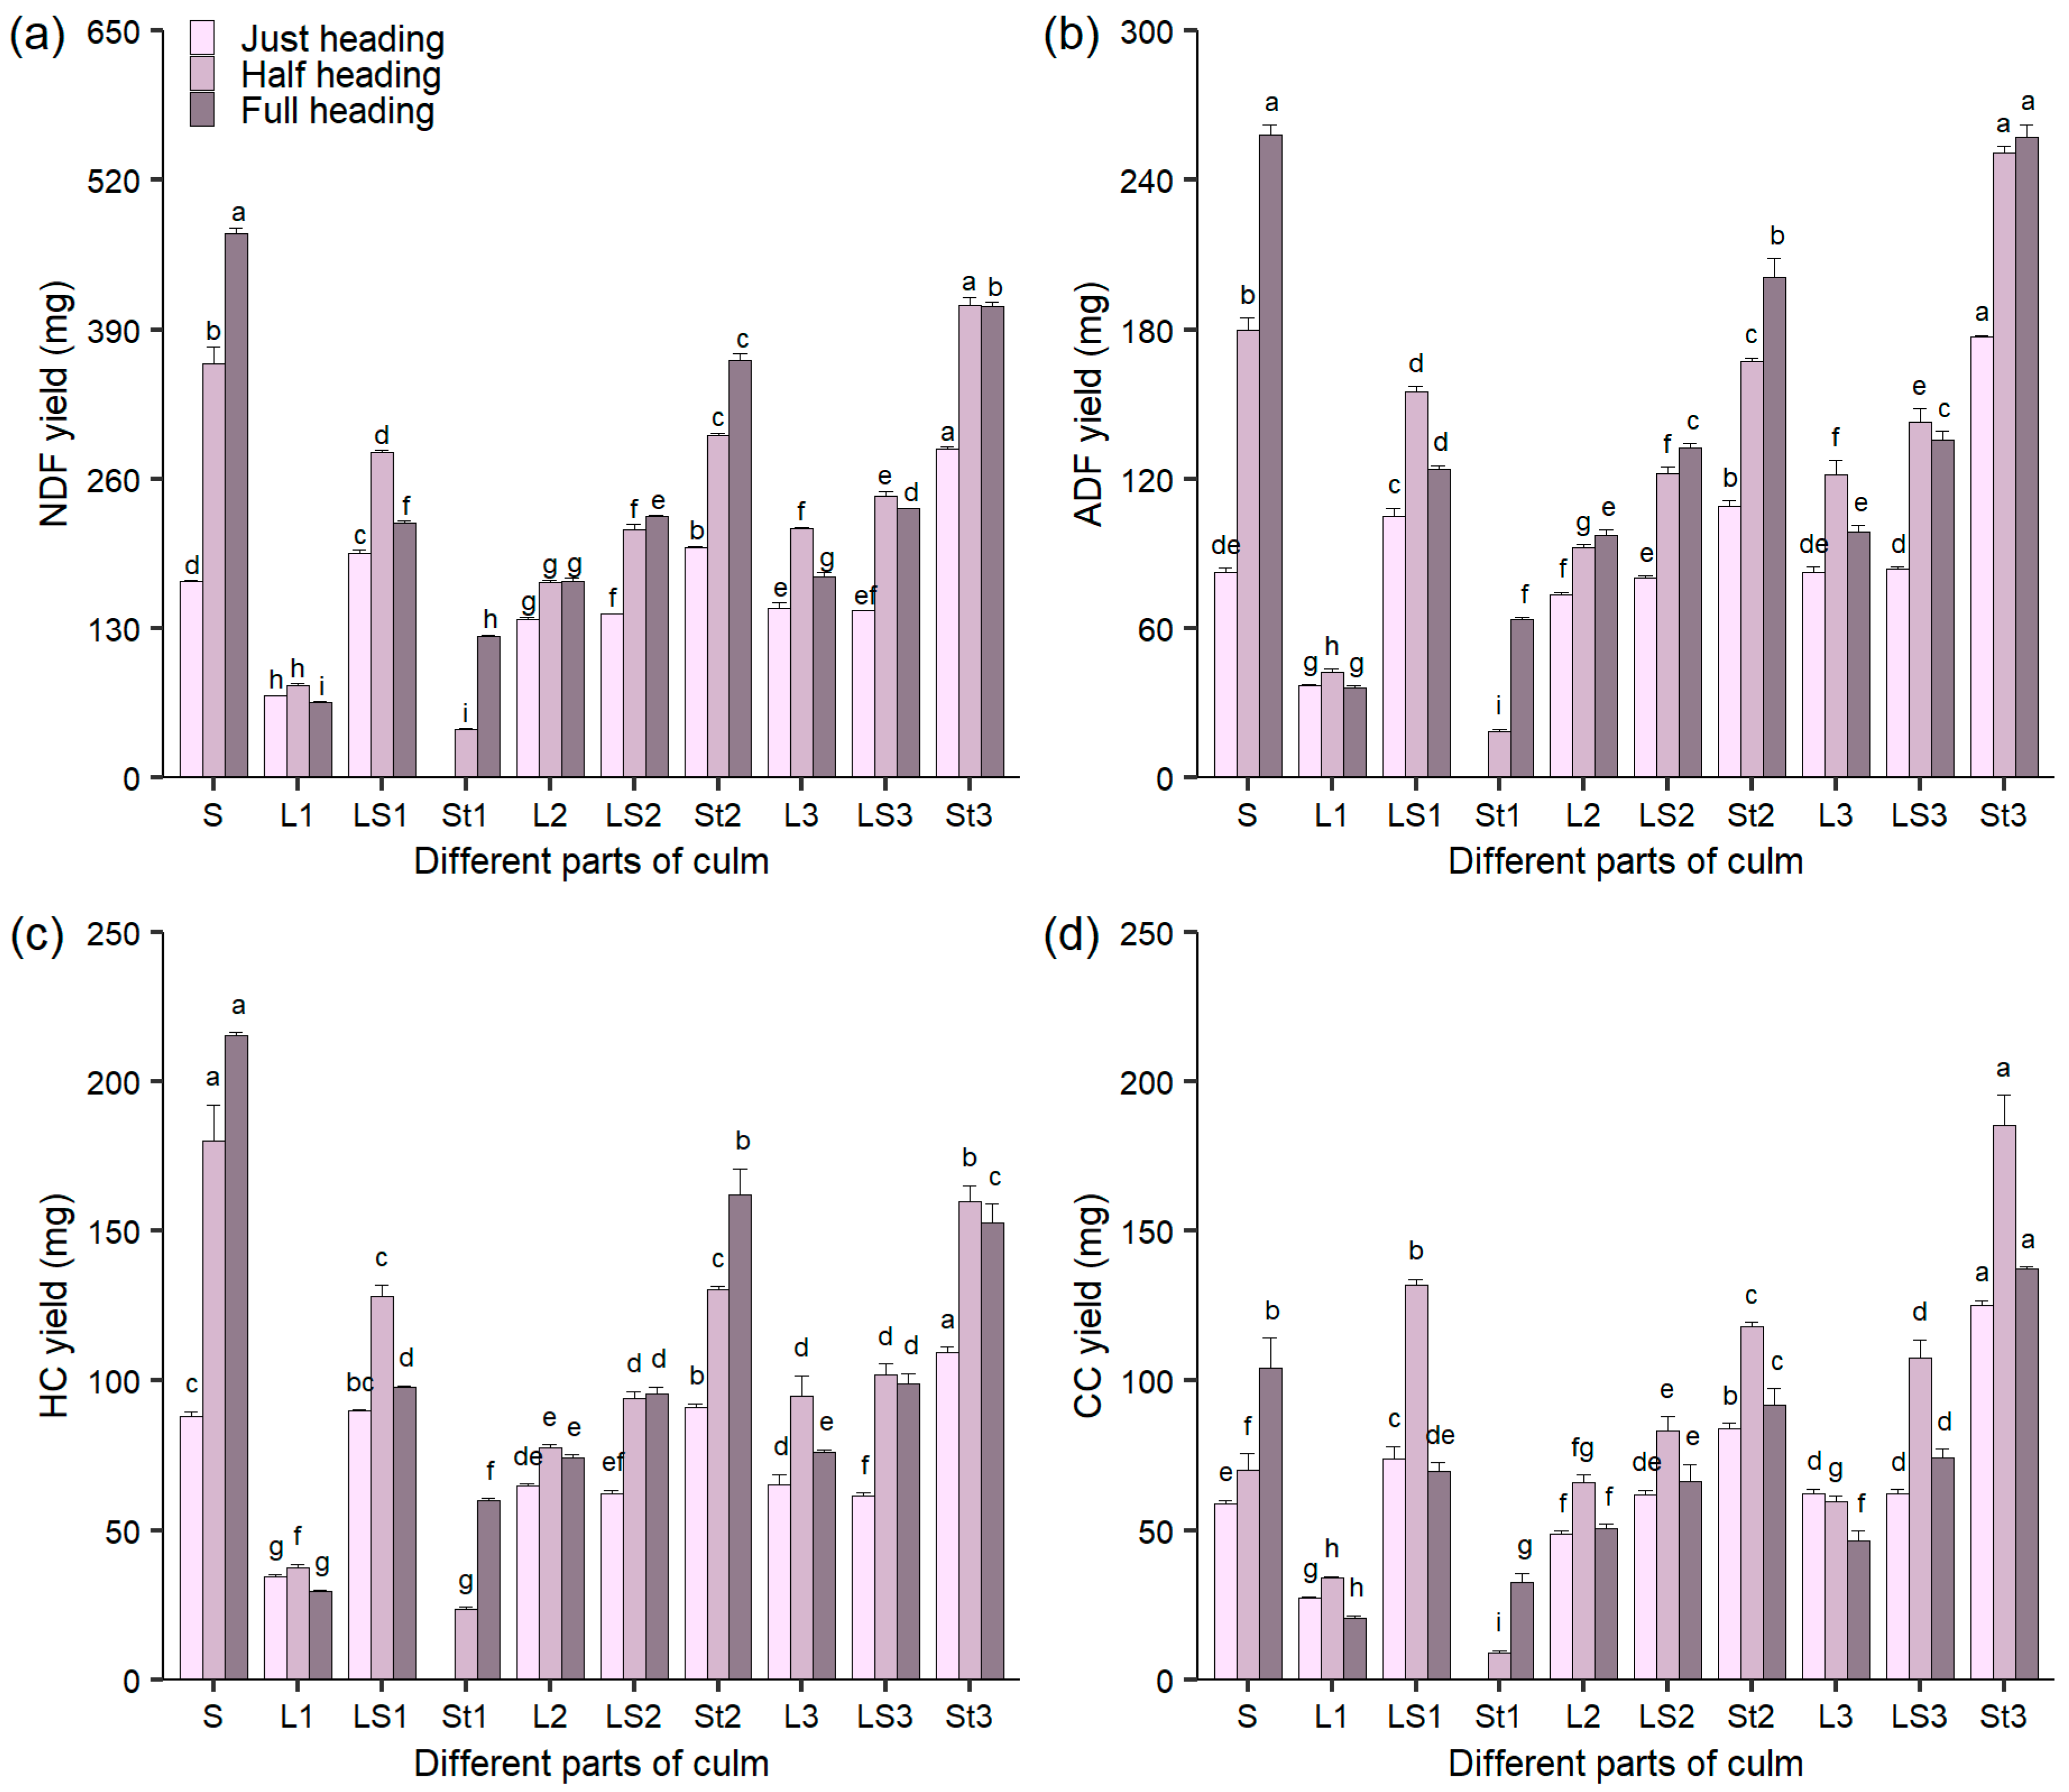
Significant differences were observed in fiber and cellulose yields between different culm parts and across heading stages (Figure 4). In most parts, with the exception of the flag leaf, flag leaf sheath, and leaf 3, the NDF yield increased from the just to the half and full heading stage. However, in the flag leaf sheath and leaf 3, it decreased from the half to the full heading stage (Figure 4a). The highest NDF yield was observed in stem 3 at the just and half heading stages, whereas the spike showed the highest yield at the full heading stage; the flag leaf consistently exhibited the lowest values regardless of heading stages. Additionally, ADF and HC yields followed a similar trend to NDF across heading stage (Figure 4b,c). The CC yield markedly declined from the half to the full heading stages in flag leaf sheath, leaf 2, leaf sheath 2, stem 2, leaf sheath 3, and stem 3 (Figure 4d). Collectively, the flag leaf exhibited the lowest yields of NDF, ADF, HC, and CC, followed by stem 1, suggesting superior forage quality.

3.5. The Content and Yield of ADL in Different Culm Parts During Heading Stage

For each of the investigated culm parts, the ADL content peaked at the full heading stage, compared with that at the just and half heading stages (Figure 5a). At the half heading stage, it reached the highest values in spike, followed by leaf 3, and was the lowest in the flag leaf sheath regardless of the heading stage. The ADL yield in all parts increased progressively from the just to the half and full heading stages (Figure 5b). It was the lowest in the flag leaf independent of the heading stage, while it was the highest in stem 3 at the just heading stage, and in the spike at both half and full heading stages.

3.6. RFV and the Ratios of CP/NDF and ADL/NDF in Different Parts of Culms During the Heading Stage

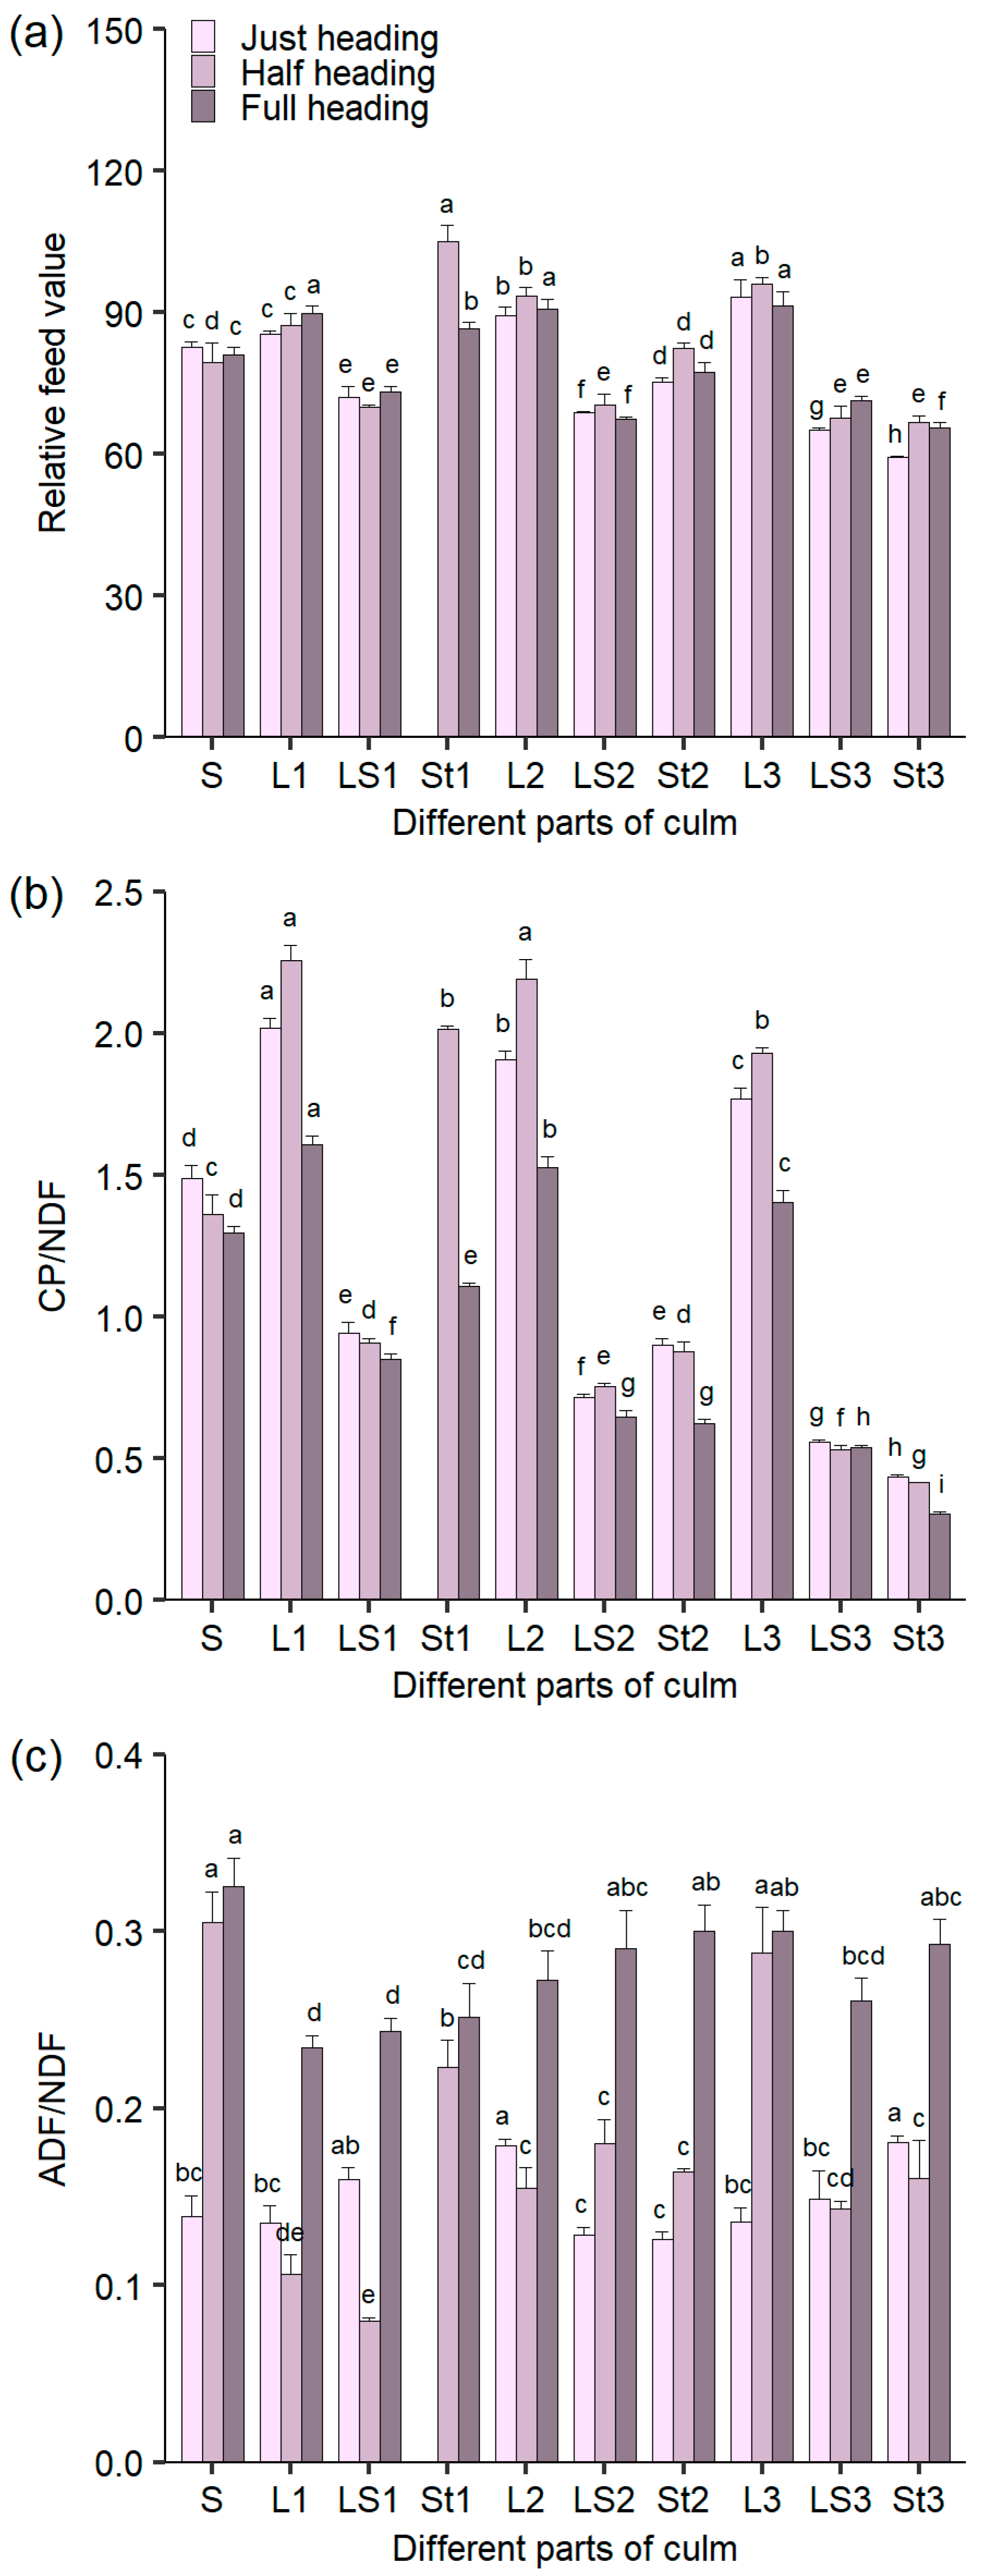
The RFV values in the top three leaves, stem 1, and spike were higher than those in the flag leaf sheath, leaf sheath 2, leaf sheath 3, and stem 3 (Figure 6a). From the just to full heading stages, the RFV increased in the flag leaf, leaf sheath 3, and stem 3, whereas it peaked in stem 1, leaf 2, and stem 2 at the half heading stage. For all the investigated parts except leaf sheath 3, the CP/NDF ratio declined from the just to full heading stage (Figure 6b). The top three leaves exhibited higher CP/NDF ratios than other parts across all heading stages. Stem 1 showed elevated RFV and CP/NDF ratio, specifically at the half heading stage. In spike, stem 1, and leaf 3, the ADL/NDF ratio increased markedly from the just to the full heading stage, while in the other parts, it increased substantially from the half to the full heading stage (Figure 6c). Hence, it appeared that the spike, stem 1, and leaf 3 were more sensitive to lignin deposition from the just to the half heading stage.

3.7. Expressional Responses of the Lignin and Cellulose Biosynthesis Genes in Different Culm Parts to Heading Stage

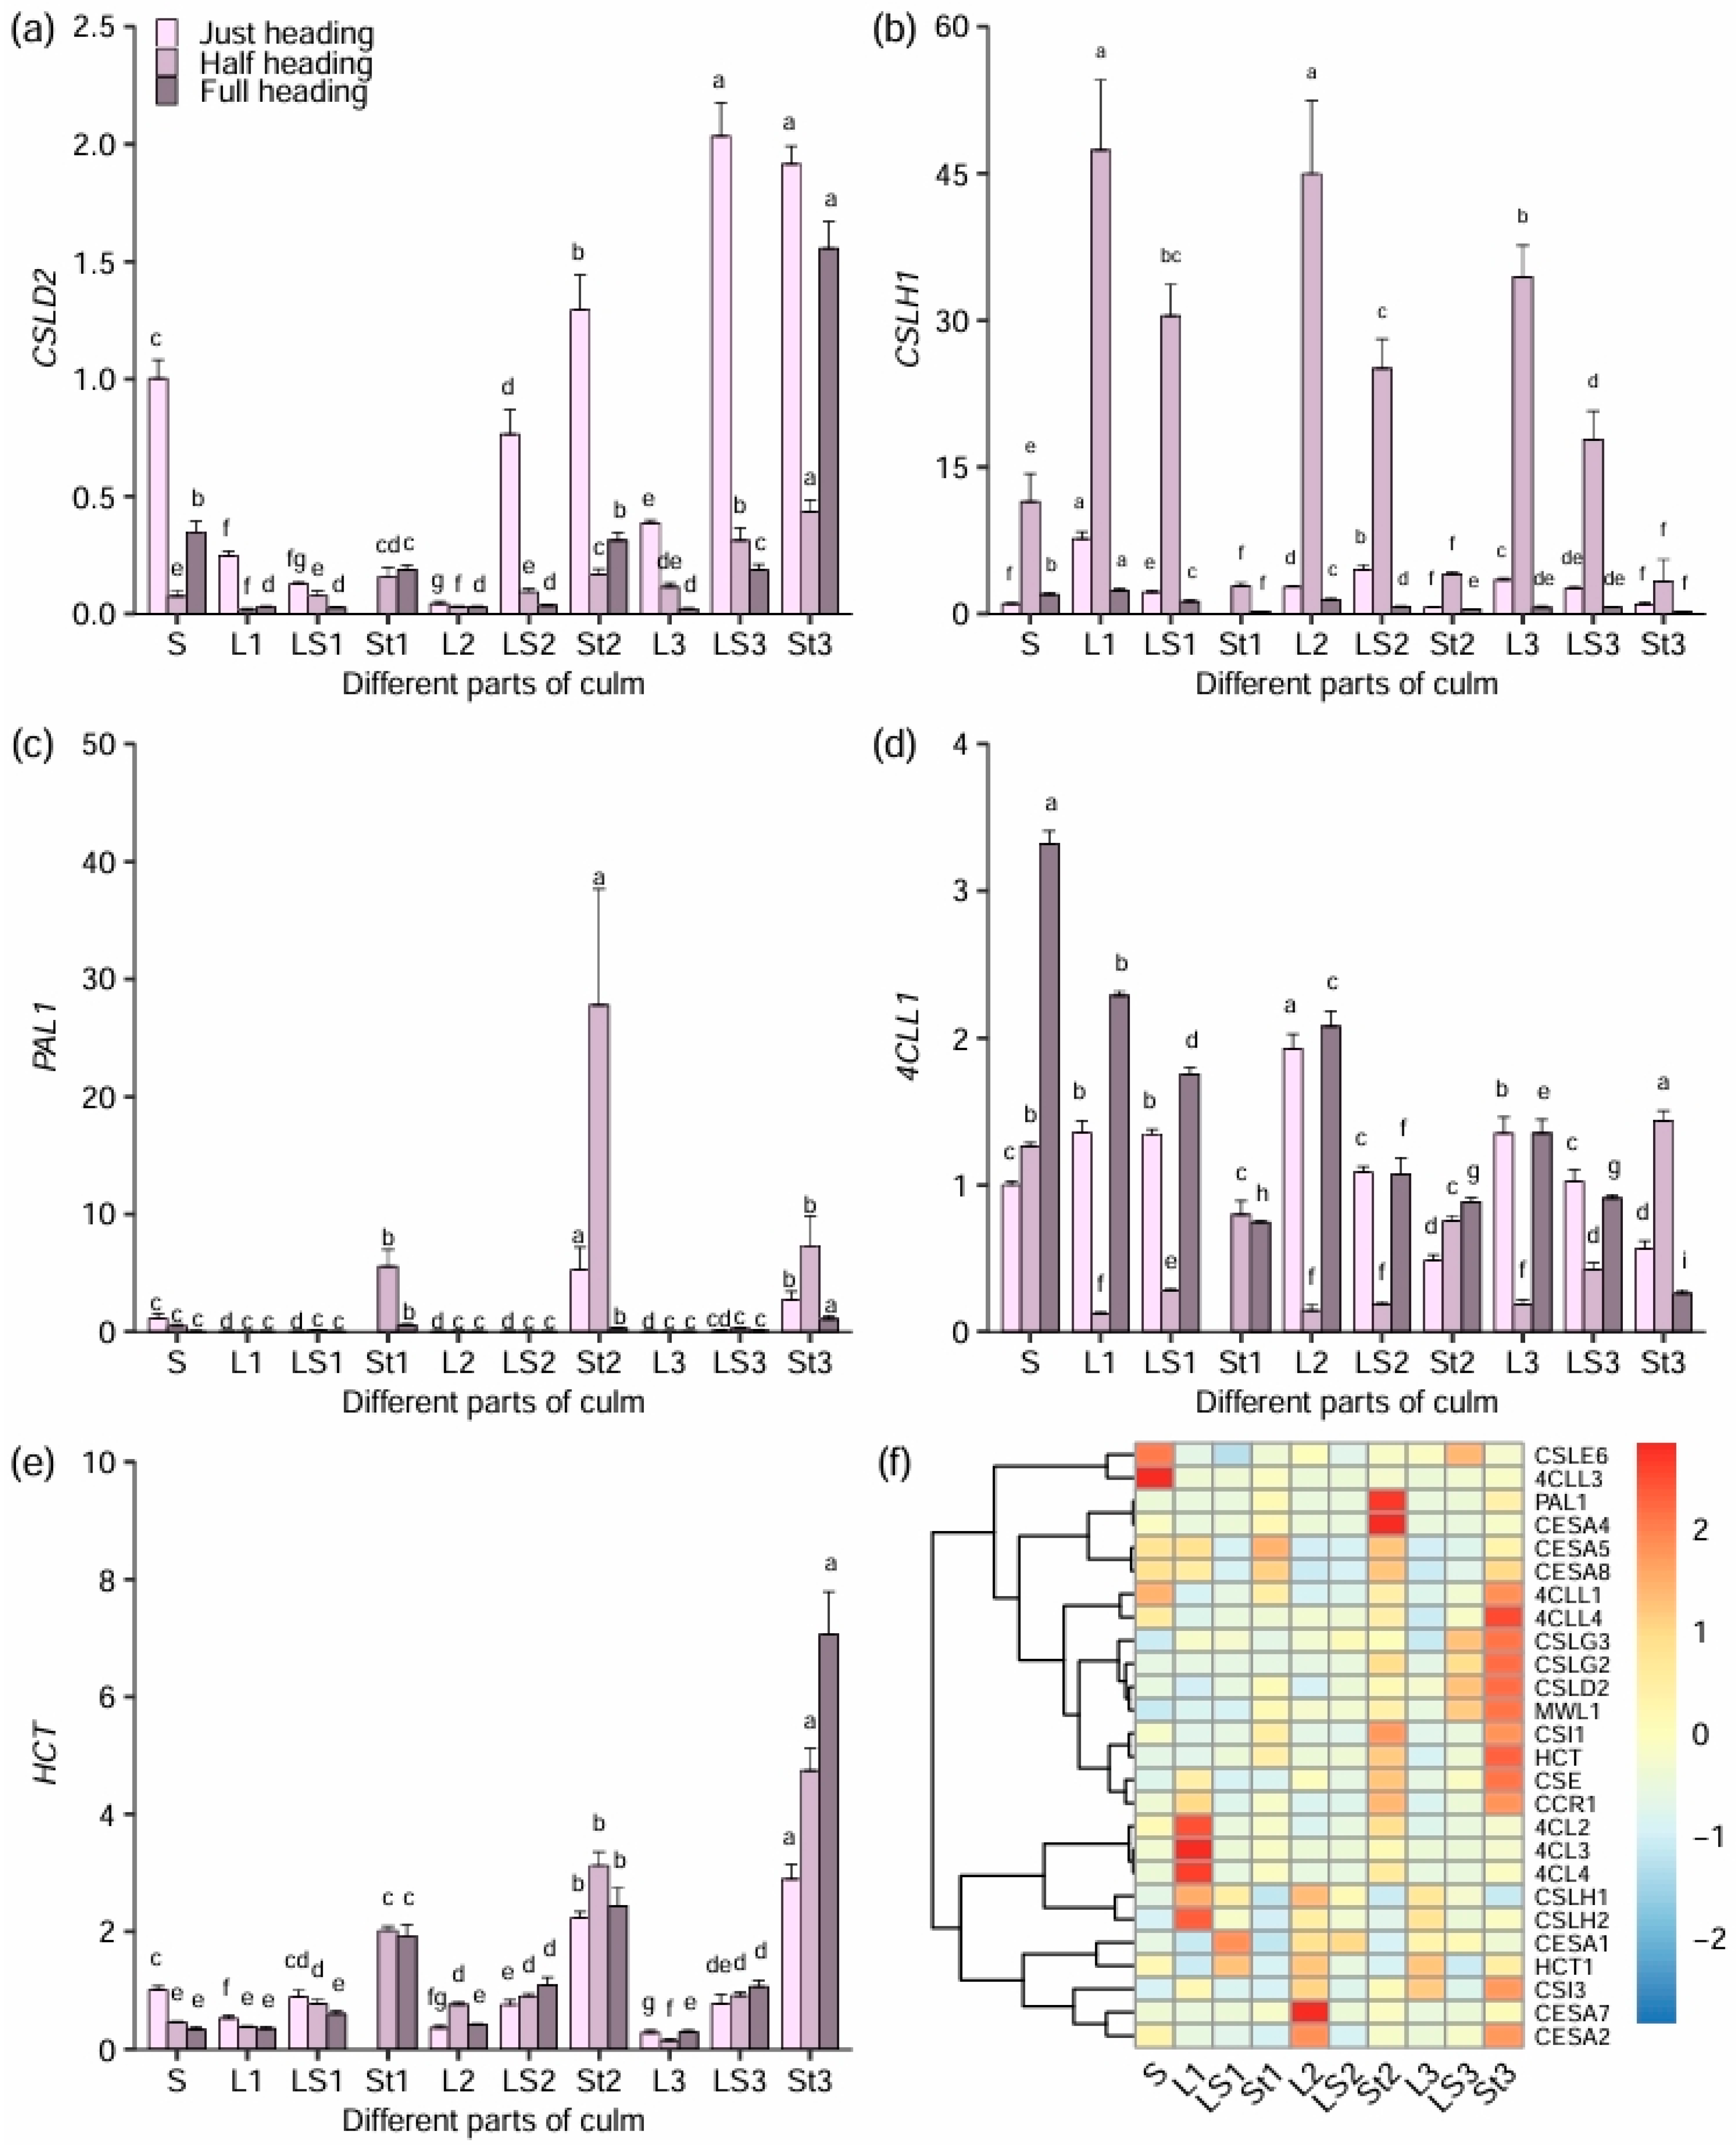
The expression levels of two cellulose biosynthesis genes (CSLD2 and CSLH7) and three lignin biosynthesis genes (PAL1, 4CLL1, and HCT) were assayed in different culm parts of tall wheatgrass in response to heading stages. At the just heading stage, the expression level of CSLD2 in spike, flag leaf, leaf sheath 2, stem 2, leaf 3, and leaf sheath 3 was higher than that at both the half and full heading stages. It was the lowest in the spike, stem 2, and stem 3 at the half heading stage compared with the just and full heading stages (Figure 7a). However, the expression level of CSLH1 was higher in all the investigated parts at the half heading stage relative to the just and full heading stages. At the half heading stage, the mRNA transcripts of CSLH1 peaked in the top three leaves, followed by leaf sheaths (Figure 7b). By contrast, the transcripts of PAL1 peaked in the stems in comparison with spike, top three leaves, and leaf sheaths, which were pronounced at the half heading stage instead of the just and full heading stages (Figure 7c). In the top three leaves and leaf sheaths, the transcripts of 4CLL1 reduced to a valley, but they peaked in stem 3 at the half heading stage relative to the other two heading stages. They were higher in the spike, flag leaf, and leaf sheath 1 at the full heading stage than at the just and half heading stages (Figure 7d). The transcripts of HCT were higher in the stems than in the other parts, but then decreased in the stems (Figure 7e). In stem 3, the expression of HCT was drastically increased, while in the spike it was slightly repressed, with the advancing of the heading stage.
In addition, the expression levels of a total of 26 cellulose and lignin biosynthesis genes, including the above-mentioned five genes, were also detected in different culm parts of tall wheatgrass at the half heading stage (Figure 7f). The transcripts of CSLE6 and 4CLL3 peaked in the spike, while those of 4CL2, 4CL3, 4CL4, CSLH1, and CSLH2 peaked in the flag leaf. The expression level of CESA1 peaked in the flag leaf sheath, while that of HCT1 was higher in the flag leaf sheath, leaf 2, and leaf 3. Furthermore, the transcripts of PAL1 and CESA4 peaked in stem 2, while those of CESA7 peaked in leaf 2. The expression levels of CESA2 were upregulated in leaf 2 and stem 3, while those of CESA5 and CESA8 were enriched in the spike, flag leaf, stem 1, stem 2, and stem 3. The transcripts of 12 genes including 4CLL1, 4CLL4, CSLG3, CSLG2, CSLD2, MWL1, CSI1, HCT, CSE, CCR1, and CSI3 peaked in stem 3, likely contributing to its accumulation of ADL and ADF.

3.8. Correlations Between Expression Levels of Cellulose and Lignin Biosynthesis Genes and Forage Nutrient Value During Heading Stage

Weak but significant correlations were found between the expression levels of cellulose and lignin biosynthesis genes and the forage nutritive value. For instance, the expression level of HCT was positively correlated with the CP content, RFV, and CP/NDF ratio. In addition, the expression level of HCT was also positively correlated with the yields of DM, NDF, ADF, CC, and HC. The strongest correlation was found between the HCT expression level and CC yield, suggesting that the expression level of HCT may serve as a marker gene for CC yield (Figure 8). In addition, the expression level of CSLD2 was positively correlated with the content of NDF and CC but negatively correlated with the CP content, RFV, and CP/NDF ratio. Similarly, the expression level of CSLH1 was positively correlated with the CP content and CP/NDF ratio, but negatively correlated with the ADL content (Figure S3). Moreover, the expression level of 4CLL1 was found to be negatively correlated with the CC content.
In contrast, strong correlations were found among forage nutritive value-related traits (Table 1). For instance, the CP content was positively correlated with RFV but negatively correlated with the contents of ADF, NDF, CC, and ADL. RFV was negatively correlated with the contents of NDF, ADF, CC, and HC. Positive and significant correlations were observed among the contents of NDF, ADF, and CC. Additionally, the NDF content was also positively correlated with the HC content, while the CC content was negatively correlated with the ADL content. Therefore, the high-quality forage of tall wheatgrass should be characterized by high CP content and RFV, but low contents of NDF, ADF, CC, HC, and ADL.

4. Discussion

4.1. Half Heading Stage May Represent the Optimal Harvesting Time for the First Cut of Tall Wheatgrass

Multiple studies have demonstrated that tall wheatgrass forage during the vegetative phase exhibits high quality; however, it becomes coarser and less palatable upon entering the reproductive phase [17,18]. Harvesting too early results in low herbage yield, while delayed harvesting leads to coarser and unpalatable low-quality forage. Therefore, determining the optimal harvest timing is critical to achieve a balance between forage quality and yield. Previous research has established that a two-cut annual regime is suitable for tall wheatgrass cultivated in the “Coastal Grass Belt” targeted region around the Bohai Sea [19]. The first cut here accounted for more than 80% of the annual forage yield of tall wheatgrass [17,19]. Li et al. (2024) [19] suggested that late May represents the optimal timing for the first cut, corresponding to the preheading stage of tall wheatgrass. Moreover, a plant height threshold of 100–110 cm has been suggested as a practical indicator for initiating the first cut. However, relying solely on fixed calendar dates or plant height metrics may inadequately reflect the precise harvesting time, as these parameters are subject to variability due to plant growth dynamics, soil conditions (e.g., salinity, moisture availability, and nutrient limitations), and site-specific edaphoclimatic interactions. To elucidate the mechanisms underlying forage quality formation, investigating DM accumulation patterns and nutritive value in distinct culm parts—particularly the top three internodes—during the heading stage is imperative.
In this study, culms harvested at the half heading stage exhibited the highest CP yield compared to those at the just and full heading stages. Furthermore, culms at the half heading stage demonstrated a 37.2% increase in DM yield relative to the just heading stage, while they produced 6.4% lower yields than those at the full heading stage. Notably, six out of the ten analyzed culm parts at the half heading stage displayed higher RFV than counterparts from other stages, suggesting superior forage quality. Collectively, these findings indicate that the half heading stage may serve as a reliable indicator for determining the optimal harvesting time for the first cut of tall wheatgrass in the “Coastal Grass Belt” targeted region. Under field conditions, maximizing the proportion of culms at the half heading stage while minimizing those at the full heading stage could synergistically enhance both the yield and quality of tall wheatgrass.

4.2. Leaf/Stem Ratio Reflects Forage Nutritive Value of Tall Wheatgrass

The forage nutritive value of the leaf blades is higher than that of leaf sheaths and stems [36,37]. In alfalfa, herbage digestibility declines with advancing maturity, while cell wall components accumulate more rapidly in stems than in leaves [38,39]. Additionally, the proportion of leaves to total DM decreases, whereas stem proportion increases during maturation, resulting in a reduced leaf/stem ratio and diminished herbage quality [39]. In this study, the contributions of the top three leaves to the yields of DM, CP, NDF, ADF, ADL, CC, and HC exhibited consistent declines from the just to half and full heading stages (Figures S1, S2 and S4). In rice straw, leaf blades were found to have higher ADL concentrations than leaf sheaths and stems [40]. However, in this study, relative to leaf sheaths and stems, the top three leaves had a higher proportion of CP yield but a lower proportion of the yields of NDF, ADF, ADL, CC, and HC independent of the heading stage (Figures S2 and S4). In contrast, the spike had a higher CP content but a lower proportion of the yields of NDF and ADF than leaf sheaths and stems, except stem 1, independent of the heading stage. In addition, the RFV and CP/NDF ratio in the spikes and leaves were relatively higher than those in stems and leaf sheaths, demonstrating that leaves and spikes of tall wheatgrass have good nutrient value. The ratio of leaf + spike to leaf sheath + stem, here denoted as leaf/stem for brevity, declined from the just to half heading stage (Figure S5). The first internode contributed the highest proportion of CP yield. Meanwhile, internode 3 produced the lowest proportion of CP yield but the highest proportion of the yields of ADF and CC regardless of the heading stage (Figure S6). In addition, the first internode had the highest leaf/stem ratio related to the contribution of spikes, while internode 3 showed the lowest (Figure S5). Collectively, it appears that the leaf/stem ratio or leaf proportion can be used as an index for high-quality tall wheatgrass forage. Prickle hairs in leaf blades were suggested as a feature to estimate the percent of leaf blade fragments in herbivore diets [41], which may be used to evaluate the forage quality of tall wheatgrass.

4.3. Cellulose and Lignin Biosynthesis Genes Expressed Differentially in Different Culm Parts of Tall Wheatgrass During Heading Stage

As maturity advances, cellulose and lignin biosynthesis genes exhibit differential expression patterns across the culm parts and heading stages. Among the 26 investigated, nearly half were upregulated in stem 3, which may explain its elevated concentration of NDF and ADF. In Arabidopsis, CESA1, CESA3, and CESA6-like proteins (CESA2, CESA5, CESA6, and CESA9) regulate primary cell wall cellulose synthesis, whereas CESA4, CESA7, and CESA8 participate in secondary cell wall synthesis [42,43]. In plants, HC polysaccharide backbones are synthesized by the cellulose synthase-like (CSL) enzymes. Notably, even genes within the same family encoding identical enzymes displayed distinct expression in responses to different culm parts. For instance, six cellulose synthase genes (CESA1, CESA2, CESA5, CESA4, CESA7, and CESA8) and six CLS protein-coding genes (CSLD2, CSLE6, CSLG2, CSLG3, CSLH1, and CSLH2) were differentially expressed in culm parts during the heading stage. CESA1 expression was highest in the flag leaf sheath, followed by leaf 2 and leaf sheath 2. CESA2 showed high expression in leaf 2 and stem 3, whereas CESA5 was highly expressed in the spike, flag leaf, stem 1, and stem 2. CESA4 expression peaked in stem 2, while CESA7 peaked in leaf 2. The expression level of CESA8 was higher in spikes and stems. However, three 4-coumarate-CoA ligase-encoding genes (4CL2, 4CL3, and 4CL4) were consistently upregulated in the flag leaf, while three 4-coumarate-CoA ligase-like encoding genes (4CLL1, 4CLL3, and 4CLL4) displayed differential expression across culm parts in the heading stage. For instance, 4CLL1 was highly expressed in the spike and stem 3. The expression level of 4CLL3 peaked in the spike, while that of 4CCL4 peaked in stem 3. Higher expressions of 4CLL1 and 4CLL3 may be associated with a high accumulation of ADL in the spike.
Correlations analyses between cellulose and lignin biosynthesis gene expression levels suggest their potential use as targets for the genetic improvement of tall wheatgrass forage quality. For instance, HCT expression was negatively correlated with CP content and RFV, but positively correlated with DM, NDF, ADF, CC, and HC yields. Additionally, another 11 of the 25 genes (including 4CLL4, CSLG2, CSLG3, CSLD2, MWL1, CSI1, CSI3, HCT, CSE, CCR1, and CESA2) were induced substantially in stem 3, potentially driving its ADL accumulation. Further investigation is required to elucidate the gene regulatory network controlling cellulose and lignin accumulation in tall wheatgrass [44].

4.4. Low Lignin Content May Be an Index for Tall Wheatgrass Genetic Improvement for High-Quality Forage

Lignin is a primary determinant of cell wall digestibility, and low lignin content is desirable in forage crops. In this study, ADL content appeared highly sensitive to maturity. Notably, ADL content in the spike, stem 1, and leaf 3 increased sharply from the just to the half heading stage, indicating the greater sensitivity of these parts to heading progression compared to other parts. At the full heading stage, ADL content reached its peak across all plant parts relative to earlier stages (just and half heading), suggesting a decline in cell wall digestibility. From the just to half heading stage, the spike’s contribution to total culm ADL yield increased, whereas contributions from leaf sheath and stem decreased. These findings highlight the need for genetic improvement strategies to develop tall wheatgrass lines with reduced lignin content and enhanced forage nutritive value.
Several plant species with reduced lignin content were developed by suppressing lignin biosynthesis genes. For instance, the inhibition of Os4CL3 in rice (Oryza sativa) significantly decreased lignin content and plant height [45]. Similarly, the suppression of 4CL expression in Pinus radiata reduced lignin content by 36–50%, though constitutive repression adversely affected plant growth [46]. The downregulation of HCT, a downstream gene in the lignin biosynthesis pathway, also lowered lignin content in alfalfa [47] and cotton (Gossypium barbadense L.) [48]. Furthermore, mutants with reduced lignin have been developed; in maize (Zea mays) and sorghum, bmr (brown midrib) mutants exhibiting brown vascular tissue in leaves and stems showed reduced lignin content and improved DM digestibility [32,49,50,51]. However, these bmr mutants with improved forage quality also affect DM accumulation negatively [52]. Furthermore, Grev et al. (2017) [53] reported that the reduced lignin alfalfa cultivar 54HVX41 contained 8% less ADL and 10% higher NDF digestibility than conventional cultivars, while maintaining comparable CP and NDF concentrations. Additionally, stems of low-lignin alfalfa exhibited a decrease in ADL and increased NDF digestibility [25]. These studies suggest the feasibility of developing tall wheatgrass lines with reduced lignin through targeted genetic modification.

5. Conclusions

The culms of tall wheatgrass achieved a maximum CP yield when harvested at the half heading stage. The top three leaves and spikes exhibited a higher CP content and RFV, but lower NDF and ADF contents, compared to leaf sheaths and stems. Additionally, stem 1 demonstrated superior herbage quality relative to leaf sheaths and other stems. The leaf/stem ratio could serve as a practical index for genetic improvement targeting enhanced forage nutritive value in tall wheatgrass. Genes associated with lignin and cellulose biosynthesis displayed differential expression patterns across culm parts in the top three internodes during heading stage. Weak but statistically significant correlations were observed between the expression levels of these genes and forage nutritive parameters. For example, HCT expression levels showed negative correlations with CP content and RFV, but positive correlations with DM, NDF, ADF, CC, and HC yields. The first internodes of tall wheatgrass culms contributed the highest DM and CP yields. Meanwhile, the third internode exhibited the lowest CP yield and leaf/stem ratio. Stem 3 produced the highest DM and contents of NDF and ADF, but the lowest CP content, RFV, and CP/NDF ratio. Future research should prioritize genetic improvement strategies to enhance tall wheatgrass nutritive value, such as a targeted reduction in lignin content through gene editing or breeding.

Supplementary Materials

The following supporting information can be downloaded at: https://www.mdpi.com/article/10.3390/agronomy15040763/s1, Table S1: The sequences of gene specific primers used for qPCR in this study; Figure S1: The mean percentage contributions of different culm parts to the dry matter yield per culm; Figure S2: The mean percentage contributions of different culm parts to the crude protein yield per culm; Figure S3: Correlations between gene expression levels and forage nutritive value of tall wheatgrass; Figure S4: The mean percentage contributions of spike, leaves, and stems of tall wheatgrass to the NDFY, ADFY, ADLY, CCY, and HCY; Figure S5: The mean ratio of leaf to stems of tall wheatgrass at different heading stage; Figure S6: The mean percentage contributions of the top three internodes of tall wheatgrass to the NDFY, ADFY, ADLY, CCY, and HCY.

Author Contributions

Conceptualization, H.L. and Z.L.; methodology, W.L.; validation, W.L.; formal analysis, W.L.; investigation, W.L., Q.X., Z.F. and Q.Z.; data curation, W.L.; writing—original draft preparation, H.L.; writing—review and editing, H.L.; visualization, W.L.; supervision, Z.L.; project administration, H.L.; funding acquisition, Z.F. and H.L. All authors have read and agreed to the published version of the manuscript.

Funding

This research was funded by the Strategic Priority Research Program of the Chinese Academy of Sciences (No. XDA26040105) and the Key Research and Development Program of Hubei Province (No. 2024BBB004).

Data Availability Statement

The original contributions presented in this study are included in the article/Supplementary Materials. Further inquiries can be directed to the corresponding authors.

Conflicts of Interest

The authors declare no conflicts of interest.

Abbreviations

The following abbreviations are used in this manuscript:
CPcrude protein
NDFneutral detergent fiber
ADFacid detergent fiber
ADLacid detergent lignin
CCcrude cellulose
HChemicellulose
DMdry matter
RFVrelative feed value
DDMdigestible dry matter
DMIdry matter intake
DMYdry matter yield
NDFYneutral detergent fiber yield
ADFYacid detergent fiber yield
HCYhemicellulose yield
CCYcrude cellulose yield

References

  1. Asay, K.H.; Jensen, K.B. Wheatgrasses. In Cool-Season Forage Grasses; Moser, L.E., Buxton, D.R., Casler, M.D., Eds.; American Society of Agronomy (ASA): Madison, WI, USA, 1996; pp. 691–724. [Google Scholar] [CrossRef]
  2. Andrioli, R.J. Adaptive mechanisms of tall wheatgrass to salinity and alkalinity stress. Grass Forage Sci. 2023, 78, 23–36. [Google Scholar] [CrossRef]
  3. Li, H.; Zheng, Q.; Wang, J.; Sun, H.; Zhang, K.; Fang, H.; Xing, X.; Yang, W.; Cao, X.; Liu, X. Industrialization of tall wheatgrass for construction of “Coastal Grass Belt”. Bull. Chin. Acad. Sci. 2023, 38, 622–631. [Google Scholar] [CrossRef]
  4. Hou, R.; Ouyang, Z.; Liu, Z.; Lai, J.; Sun, Z.; Li, Y.; Li, H.; Li, Z.; Li, J. “Coastal Grass Belt” as paradigm for grass-based livestock husbandry around Bohai bay. Bull. Chin. Acad. Sci. 2021, 36, 652–659. [Google Scholar] [CrossRef]
  5. Li, H.; Zheng, Q.; Li, B.; Zhao, M.; Li, Z. Progress in research on tall wheatgrass as a salt-alkali tolerant forage grass. Acta Pratacult. Sin. 2022, 31, 190–199. [Google Scholar] [CrossRef]
  6. Wang, T.; Cao, L.; Liu, Z.; Yang, Q.; Chen, L.; Chen, M.; Jing, H. Forage grass basic biology of constructing Coastal Grass Belt. Chin. Bull. Bot. 2022, 57, 837–847. [Google Scholar] [CrossRef]
  7. Xu, W.; Wang, J.; Liu, X.; Xie, Q.; Yang, W.; Cao, X.; Li, Z. Scientific and technological reasons, contents and corresponding policies of constructing “Coastal Grass Belt”. Bull. Chin. Acad. Sci. 2022, 37, 238–245. [Google Scholar] [CrossRef]
  8. Rumery, M.G.; Ramig, R.E.; Somerhalder, B.R. Irrigated Bromegrass, Intermediate, and Tall Wheatgrass Pastures for Dairy Cows; University of Nebraska: Lincoln, NE, USA, 1964. [Google Scholar]
  9. Warren, B.E.; Casson, T. Performance of sheep grazing salt tolerant forages on revegetated salt land. Proc. Aust. Soc. 1992, 19, 237. [Google Scholar]
  10. Harmoney, K.; Jaeger, J. Tall wheatgrass and western wheatgrass used for complementary cool-season forage systems. Crop Forage Turfgrass Manag. 2019, 5, 180065. [Google Scholar] [CrossRef]
  11. Castellaro, G.; Giorgio, L.; Urra, A.; Hernán, A.; Hidalgo, A.; Javier, A.; Orellana, M.; Carla, L.; Escanilla, C.; Juan, P. Sheep and goat grazing diets on an annual Mediterranean grassland containing tall wheatgrass (Thinopyrum ponticum (PODP.)). Cienc. Investig. Agrar. 2018, 45, 240–250. [Google Scholar] [CrossRef]
  12. Conard, E.C.; Clanton, D.C. Cool-season, warm-season pastures needed. In Beef Cattle Progress Report; Animal Husbandry Department, College of Agriculture, University of Nebraska: Lincoln, NE, USA, 1963; pp. 11–13. [Google Scholar]
  13. Newell, L.C.; Moline, W.J. Forage quality evaluations of twelve grasses in relation to season of grazing. Agric. Food Sci. 1978. [Google Scholar]
  14. Ma, Z. An investigation on the economic characteristic and nutrient components of grasses. Chin. J. Grassl. 1986, 2, 48–51. [Google Scholar]
  15. Gillen, R.; Berg, W. Response of perennial cool-season grasses to clipping in the southern plains. Agron. J. 2005, 97, 125–130. [Google Scholar] [CrossRef]
  16. Jafari, A.A.; Anvari, H.; Nakhjavan, S.; Rahmani, E. Effects of phenological stages on yield and quality traits in 22 populations of tall wheatgrass Agropyron elongatum grown in Lorestan, Iran. J. Rangel. Sci. 2010, 1, 9–16. [Google Scholar] [CrossRef]
  17. Vogel, K.P.; Moore, K.J. Forage yield and quality of tall wheatgrass accessions in the USDA germplasm collection. Crop Sci. 1998, 38, 509–512. [Google Scholar] [CrossRef]
  18. Holechek, J.L.; Estell, R.E.; Kuykendall, C.B.; Valdez, R.; Cardenas, M.; Hernández, G.H. Seeded wheatgrass yield and nutritive quality on New Mexico big sagebrush range. J. Range Manag. 1989, 42, 118–122. [Google Scholar] [CrossRef]
  19. Li, W.; Xiao, Q.; Li, H.; Chang, H.; Zheng, Q.; Li, B.; Li, Z. Two cut system suggested for tall wheatgrass to balance herbage yield and quality in the coastal saline–alkaline land around the Bohai Sea. Grassl. Res. 2024, 3, 132–146. [Google Scholar] [CrossRef]
  20. Chen, H. Chemical Composition and Structure of Natural Lignocellulose In Biotechnology of Lignocellulose: Theory and Practice; Springer: Dordrecht, The Netherlands, 2014; pp. 25–71. [Google Scholar] [CrossRef]
  21. Lemaire, G.; Belanger, G. Allometries in Plants as Drivers of Forage Nutritive Value: A Review. Agriculture 2020, 10, 5. [Google Scholar] [CrossRef]
  22. Weimer, P.J. Why Don’t Ruminal Bacteria Digest Cellulose Faster? J. Dairy Sci. 1996, 79, 1496–1502. [Google Scholar] [CrossRef]
  23. Jung, H.; Samac, D.A.; Sarath, G. Modifying crops to increase cell wall digestibility. Plant Sci. 2012, 185–186, 65–77. [Google Scholar] [CrossRef]
  24. Liu, Q.; Luo, L.; Zheng, L. Lignins: Biosynthesis and Biological Functions in Plants. Int. J. Mol. Sci. 2018, 19, 335. [Google Scholar] [CrossRef]
  25. Grev, A.M.; Wells, M.S.; Catalano, D.N.; Martinson, K.L.; Jungers, J.M.; Sheaffer, C.C. Stem and leaf forage nutritive value and morphology of reduced lignin alfalfa. Agron. J. 2020, 112, 406–417. [Google Scholar] [CrossRef]
  26. Boerjan, W.; Ralph, J.; Baucher, M. Lignin biosynthesis. Annu. Rev. Plant Biol. 2003, 54, 519–546. [Google Scholar] [CrossRef] [PubMed]
  27. Kim, S.H.; Lam, P.Y.; Lee, M.H.; Jeon, H.S.; Tobimatsu, Y.; Park, O.K. The Arabidopsis R2R3 MYB Transcription Factor MYB15 Is a Key Regulator of Lignin Biosynthesis in Effector-Triggered Immunity. Front. Plant Sci. 2020, 11, 583153. [Google Scholar] [CrossRef]
  28. Rohde, A.; Morreel, K.; Ralph, J.; Goeminne, G.; Hostyn, V.; De Rycke, R.; Kushnir, S.; Van Doorsselaere, J.; Joseleau, J.P.; Vuylsteke, M.; et al. Molecular phenotyping of the pal1 and pal2 mutants of Arabidopsis thaliana reveals far-reaching consequences on phenylpropanoid, amino acid, and carbohydrate metabolism. Plant Cell 2004, 16, 2749–2771. [Google Scholar] [CrossRef]
  29. Chen, F.; Srinivasa Reddy, M.S.; Temple, S.; Jackson, L.; Shadle, G.; Dixon, R.A. Multi-site genetic modulation of monolignol biosynthesis suggests new routes for formation of syringyl lignin and wall-bound ferulic acid in alfalfa (Medicago sativa L.). Plant J. 2006, 48, 113–124. [Google Scholar] [CrossRef]
  30. Vanholme, R.; Morreel, K.; Ralph, J.; Boerjan, W. Lignin engineering. Curr. Opin. Plant Biol. 2008, 11, 278–285. [Google Scholar] [CrossRef]
  31. Wang, J.P.; Matthews, M.L.; Williams, C.M.; Shi, R.; Yang, C.; Tunlaya-Anukit, S.; Chen, H.C.; Li, Q.; Liu, J.; Lin, C.Y.; et al. Improving wood properties for wood utilization through multi-omics integration in lignin biosynthesis. Nat. Commun. 2018, 9, 1579. [Google Scholar] [CrossRef]
  32. Li, H.; Huang, Y. Expression of brown-midrib in a spontaneous sorghum mutant is linked to a 5′-UTR deletion in lignin biosynthesis gene SbCAD2. Sci. Rep. 2017, 7, 11664. [Google Scholar] [CrossRef]
  33. Schmittgen, T.D.; Livak, K.J. Analyzing real-time PCR data by the comparative CT method. Nat. Protoc. 2008, 3, 1101–1108. [Google Scholar] [CrossRef]
  34. Kolde, R. Pheatmap: Pretty Heatmaps, R Package Version 1.0.12. 2018. Available online: https://github.com/raivokolde/pheatmap (accessed on 16 March 2025).
  35. Wickham, H. Ggplot2: Elegant Graphics for Data Analysis; Springer: Berlin/Heidelberg, Germany, 2016; ISBN 978-3-319-24277-4. Available online: https://ggplot2.tidyverse.org (accessed on 16 March 2025).
  36. Wilson, J. Variation of leaf characteristics with level of insertion on a grass tiller. 1. Development rate, chemical composition and dry matter digestibility. Crop Pasture Sci. 1976, 27, 343–354. [Google Scholar] [CrossRef]
  37. Norton, B.W. Limitations caused by chemical composition and digestibility. In Nutritional Limits to Animal Production from Pastures; Hacker, J.B., Ed.; Commonwealth Agricultural Bureaux: Farnham Royal, UK, 1984; pp. 87–110. [Google Scholar]
  38. Albrecht, K.A.; Wedin, W.F.; Buxton, D.R. Cell-wall composition and digestibility of alfalfa stems and leaves. Crop Sci. 1987, 27, 735–741. [Google Scholar] [CrossRef]
  39. Sheaffer, C.C.; Martin, N.P.; Lamb, J.; Cuomo, G.R.; Jewett, J.G.; Quering, S.R. Leaf and stem properties of alfalfa entries. Agron. J. 2000, 92, 733–739. [Google Scholar] [CrossRef]
  40. Ghasemi, E.; Ghorbani, G.R.; Khorvash, M.; Emami, M.R.; Karimi, K. Chemical composition, cell wall features and degradability of stem, leaf blade and sheath in untreated and alkali-treated rice straw. Animal 2013, 7, 1106–1112. [Google Scholar] [CrossRef] [PubMed]
  41. Sierra, P.; Cid, M.; Brizuela, M.; Ferri, C. Microhistological estimation of grass leaf blade percentages in pastures and diets. Rangel. Ecol. Manag. 2005, 58, 207–214. [Google Scholar] [CrossRef]
  42. Desprez, T.; Juraniec, M.; Crowell, E.F.; Jouy, H.; Pochylova, Z.; Parcy, F.; Höfte, H.; Gonneau, M.; Vernhettes, S. Organization of cellulose synthase complexes involved in primary cell wall synthesis in Arabidopsis thaliana. Proc. Natl. Acad. Sci. USA 2007, 104, 15572–15577. [Google Scholar] [CrossRef]
  43. Persson, S.; Paredez, R.A.; Carroll, A.; Palsdottir, H.; Doblin, M.; Poindexter, P.; Khitrov, N.; Auer, M.; Somerville, R.C. Genetic evidence for three unique components in primary cell-wall cellulose synthase complexes in Arabidopsis. Proc. Natl. Acad. Sci. USA 2007, 104, 15566–15571. [Google Scholar] [CrossRef]
  44. Zhao, Q.; Dixon, R.A. Transcriptional networks for lignin biosynthesis: More complex than we thought? Trends Plant Sci. 2011, 16, 227–233. [Google Scholar] [CrossRef]
  45. Gui, J.; Shen, J.; Li, L. Functional characterization of evolutionarily divergent 4-coumarate:coenzyme a ligases in rice. Plant Physiol. 2011, 157, 574–586. [Google Scholar] [CrossRef]
  46. Yang, J.; Chen, F.; Yu, O.; Beachy, R.N. Controlled silencing of 4-coumarate:CoA ligase alters lignocellulose composition without affecting stem growth. Plant Physiol. Biochem. 2011, 49, 103–109. [Google Scholar] [CrossRef]
  47. Bhattarai, K.K.; Rajasekar, S.; Dixon, R.A.; Monteros, M.J. Agronomic Performance and Lignin Content of HCT Down-Regulated Alfalfa (Medicago sativa L.). Bioenergy Res. 2018, 11, 505–515. [Google Scholar] [CrossRef]
  48. Zheng, K.; Cai, Y.; Qu, Y.; Teng, L.; Wang, C.; Gao, J.; Chen, Q. Effect of the HCT Gene on Lignin Synthesis and Fiber Development in Gossypium barbadense. Plant Sci. 2023, 338, 111914. [Google Scholar] [CrossRef]
  49. Vignols, F.; Rigau, J.; Torres, M.A.; Capellades, M.; Puigdomènech, P. The brown midrib3 (bm3) mutation in maize occurs in the gene encoding caffeic acid O-methyltransferase. Plant Cell 1995, 7, 407–416. [Google Scholar] [CrossRef] [PubMed]
  50. Vermerris, W.; Thompson, K.J.; McIntyre, L.M. The maize Brown midrib1 locus affects cell wall composition and plant development in a dose-dependent manner. Heredity 2002, 88, 450–457. [Google Scholar] [CrossRef] [PubMed]
  51. Kolkman, J.M.; Moreta, D.E.; Repka, A.; Bradbury, P.; Nelson, R.J. Brown midrib mutant and genome-wide association analysis uncover lignin genes for disease resistance in maize. Plant Genome 2023, 16, e20278. [Google Scholar] [CrossRef]
  52. Li, X.; Chapple, C. Understanding lignification: Challenges beyond monolignol biosynthesis. Plant Physiol. 2010, 154, 449–452. [Google Scholar] [CrossRef]
  53. Grev, A.M.; Wells, M.S.; Samac, D.A.; Martinson, K.L.; Sheaffer, C.C. Forage accumulation and nutritive value of reduced lignin and reference alfalfa cultivars. Agron. J. 2017, 109, 2749–2761. [Google Scholar] [CrossRef]
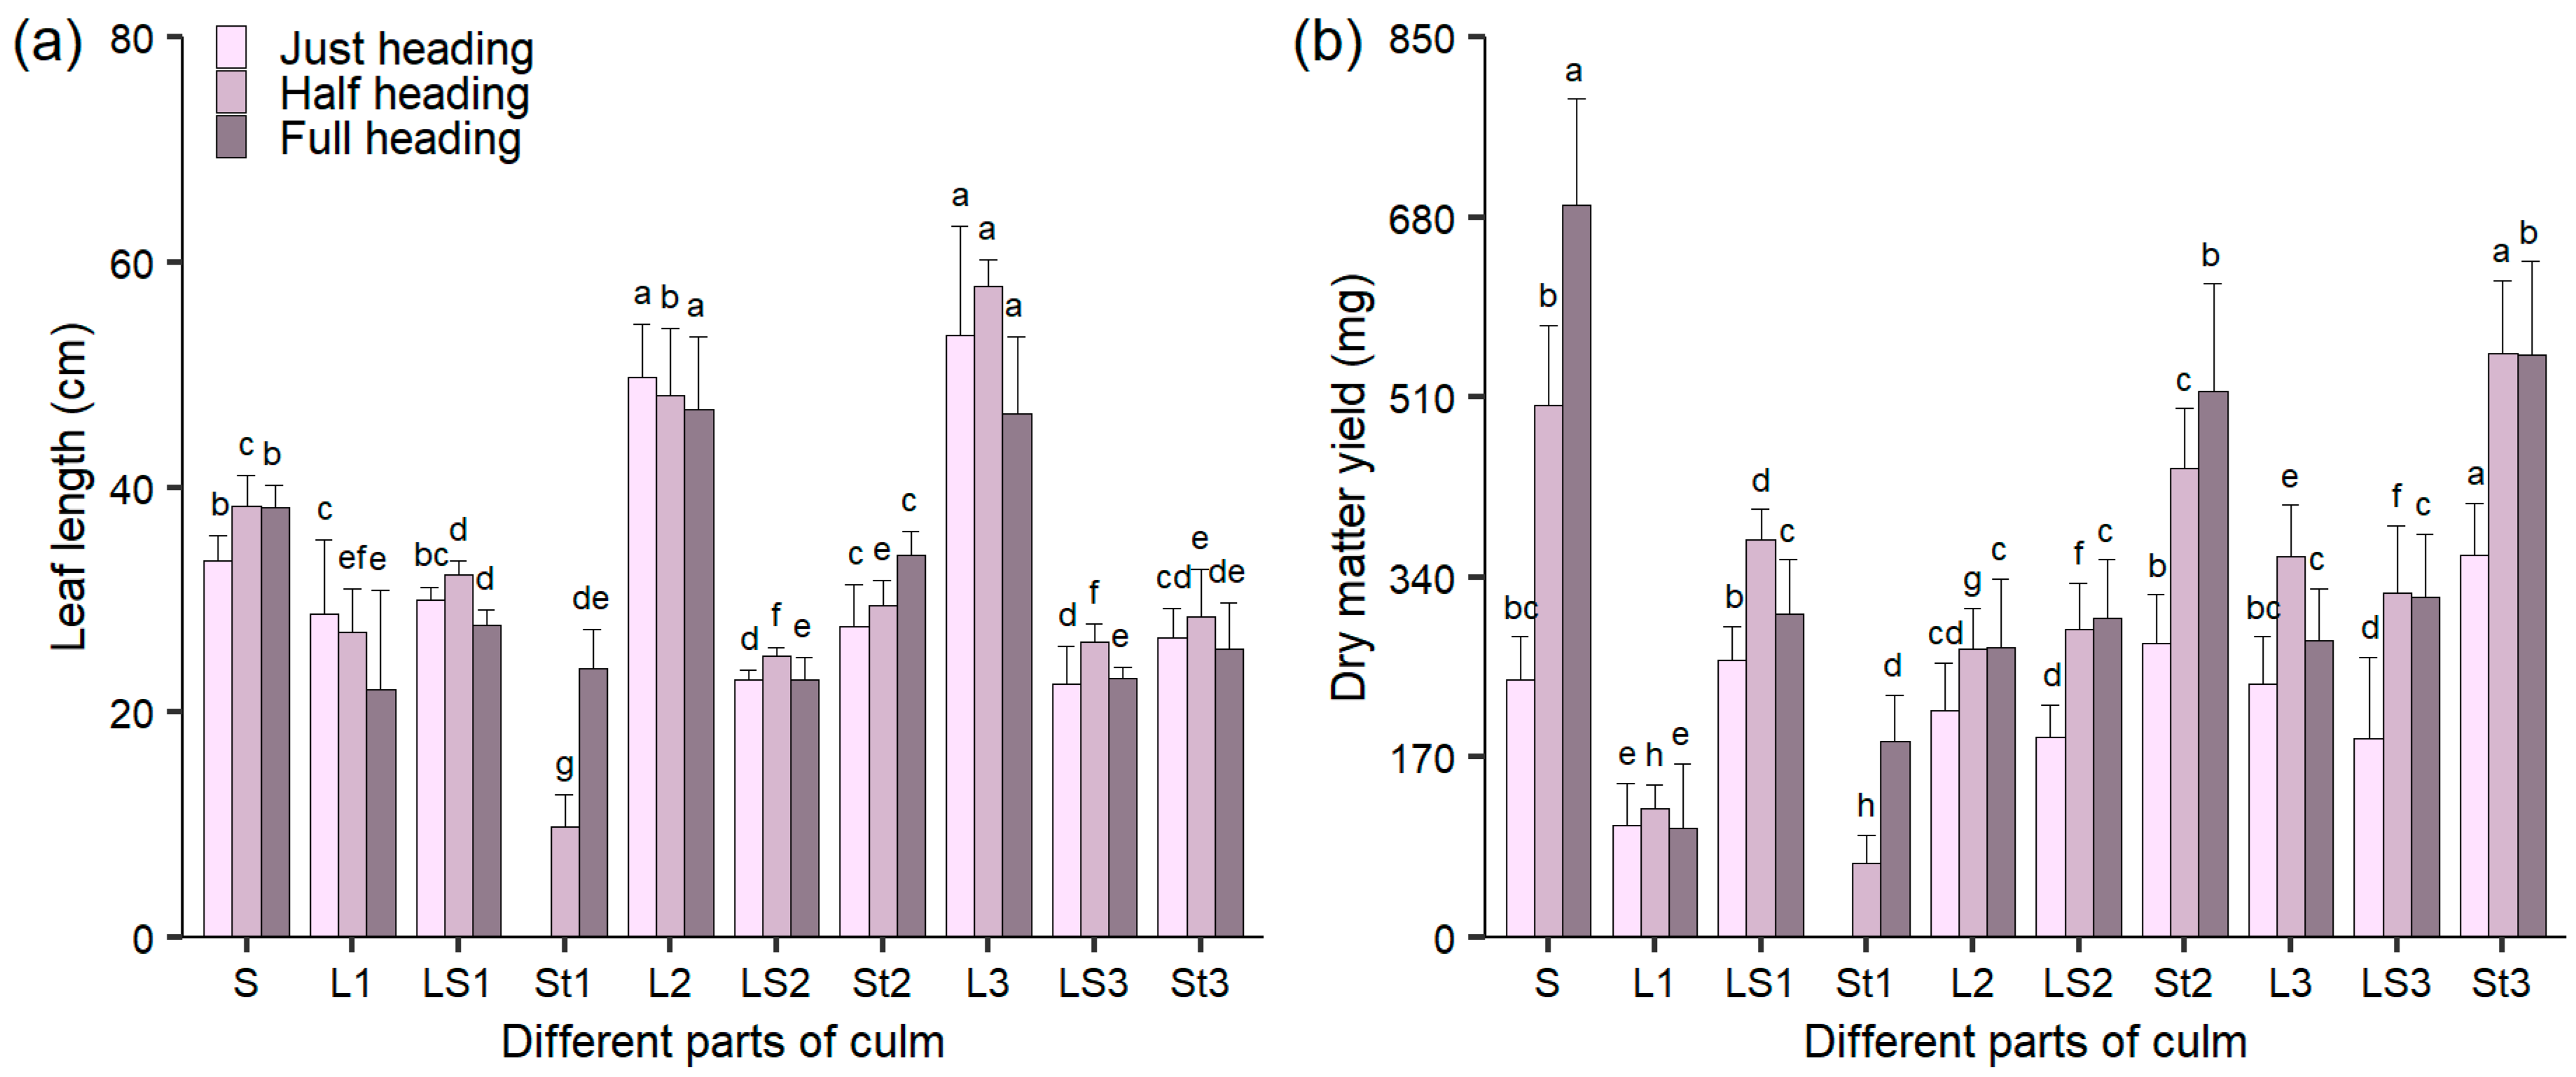
Figure 1. The length (a) and dry matter yield (b) in different parts of the top three internodes in tall wheatgrass at different heading stages. Data are represented as mean ± SD. Different letters indicate significant differences among different culm parts at p < 0.05. S = spike; L = leaf; LS = leaf sheath; St = stem; 1–3 = positions from top to bottom.
Agronomy 15 00763 g001
Figure 2. The crude protein (CP) contents (a) and CP yields (b) in different parts of the top three internodes of tall wheatgrass at different heading stages. Data are represented as mean ± SD. Different letters indicate significant differences among different culm parts at p < 0.05. S = spike; L = leaf; LS = leaf sheath; St = stem; 1–3 = positions from top to bottom.
Agronomy 15 00763 g002
Figure 3. The contents of neutral detergent fiber (NDF, (a)), acid detergent fiber (ADF, (b)), hemicellulose (HC, (c)), and crude cellulose (CC, (d)) in different parts of top three internodes of tall wheatgrass at different heading stages. Data are represented as mean ± SD. Different letters indicate significant differences among different culm parts at p < 0.05. S = spike; L = leaf; LS = leaf sheath; St = stem; 1–3 = positions from top to bottom.
Agronomy 15 00763 g003
Figure 4. The yields of neutral detergent fiber (NDF, (a)), acid detergent fiber (ADF, (b)), hemicellulose (HC, (c)), and crude cellulose (CC, (d)) in different parts of top three internodes of tall wheatgrass at different heading stages. Data are represented as mean ± SD. Different letters indicate significant differences among different culm parts at p < 0.05. S = spike; L = leaf; LS = leaf sheath; St = stem; 1–3 = positions from top to bottom.
Agronomy 15 00763 g004
Figure 5. The acid detergent lignin (ADL) content (a) and yield (b) in different parts of the top three internodes of tall wheatgrass at different heading stages. Data are represented as mean ± SD. Different letters indicate significant differences among different culm parts at p < 0.05. S = spike; L = leaf; LS = leaf sheath; St = stem; 1–3 = positions from top to bottom.
Agronomy 15 00763 g005
Figure 6. The relative feed value (RFV, (a)), the ratio of crude protein content to the neutral detergent fiber content (CP/NDF, (b)), and the ratio of acid detergent lignin content to the neutral detergent fiber content (ADL/NDF, (c)) in different parts of the top three internodes of tall wheatgrass at different heading stages. Data are represented as mean ± SD. Different letters indicate significant differences among different culm parts at p < 0.05. S = spike; L = leaf; LS = leaf sheath; St = stem; 1–3 = positions from top to bottom.
Agronomy 15 00763 g006
Figure 7. The relative expressions of cellulose and lignin biosynthesis genes in different parts of the top three internodes of tall wheatgrass at different heading stages. (ae) Relative expressions of CSLD2, CSLH1, PAL1, 4CLL1, and HCT at three heading stages. (f) Heatmap of the expression levels of 26 genes at the half heading stage. Data are represented as mean ± SD. Different letters indicate significant differences among different culm parts at p < 0.05. S = spike; L = leaf; LS = leaf sheath; St = stem; 1–3 = positions from top to bottom.
Agronomy 15 00763 g007
Figure 8. The correlations of the HCT expression levels and crude protein (CP) contents (a), relative feed value (RFV, (b)), the ratio of CP to neutral detergent fiber (NDF) (CP/NDF, (c)), dry matter yield (DMY, (d)), NDF yield (NDFY, (e)), acid detergent fiber yield (ADFY, (f)), hemicellulose yield (HCY, (g)), and crude cellulose yield (CCY, (h)).
Agronomy 15 00763 g008
Table 1. Correlation coefficients among forage nutrient value parameters in tall wheatgrass.
RFVADFNDFCCADLHC
CP0.832 **−0.851 **−0.781 **−0.420 **−0.302 **−0.054
RFV −0.954 **−0.977 **−0.671 **−0.072−0.271 *
ADF 0.878 **0.670 **0.120−0.021
NDF 0.651 **0.0210.460 **
CC −0.657 **0.118
ADL −0.181
CP = crude protein content; NDF = neutral detergent fiber content; ADF = acid detergent fiber content; ADL = acid detergent lignin content; CC = crude cellulose content; RFV = relative feed value; HC = hemicellulose content. * and ** denote significant level at p < 0.05 and p < 0.01, respectively.
Disclaimer/Publisher’s Note: The statements, opinions and data contained in all publications are solely those of the individual author(s) and contributor(s) and not of MDPI and/or the editor(s). MDPI and/or the editor(s) disclaim responsibility for any injury to people or property resulting from any ideas, methods, instructions or products referred to in the content.