Article

Environmental Sustainability of Brewers’ Spent Grains Composting: Effect of Turning Strategies and Mixtures Composition on Greenhouse Gas Emissions

1
Institute of Sciences and Technologies for Sustainable Energy and Mobility (STEMS), National Research Council of Italy (CNR), Strada delle Cacce 73, 10135 Turin, Italy
2
Research Institute on Terrestrial Ecosystems (IRET), National Research Council of Italy (CNR), Via Madonna del Piano 10, 50019 Sesto Fiorentino, Florence, Italy
3
Department of Agricultural Sciences of University of Sassari, Viale Italia 39/a, 07100 Sassari, Italy
*
Author to whom correspondence should be addressed.
Associated member of the JRU MIRRI-IT.
Agronomy 2025, 15(4), 771; https://doi.org/10.3390/agronomy15040771
Submission received: 29 January 2025 / Revised: 17 March 2025 / Accepted: 19 March 2025 / Published: 21 March 2025
(This article belongs to the Section Farming Sustainability)

Abstract

:
The global production of brewers’ spent grains (BSG) is 37 million tons yearly. Composting represents an eco-friendly method to manage and valorize organic by-products in a circular economy model. This project aims to compare two BSG bin-composting mixtures (BSG and wheat straw with pig slurry solid fraction, MIX1, or sheep manure, MIX2) and approaches (manual turning, MT, and static composting, ST). The two mixtures’ physicochemical characteristics and greenhouse gas (GHG) emissions were assessed during the process. The evolution of physicochemical properties is reported in detail. Headspace samples of GHG emissions were collected and analyzed with gas chromatography coupled with specific detectors. Carbon dioxide (CO2) emissions were 34.3 ± 0.03 and 31.0 ± 0.06 g C kg−1 fresh matter (FM) for MIX1-MT and MIX2-MT, and 28.8 ± 0.01 and 31.2 ± 0.02 g Ckg−1 FM for MIX1-ST and MIX2-ST. Methane emissions were negligible (all conditions < 0.086 ± 0.00 mg C kg−1 FM). Nitrous oxide (N2O) emissions from composting are affected by the substrate, bulking material, pile dimension, and manure. Particularly, the total emissions of N2O, estimated as CO2 equivalents, were 45.8 ± 0.2 and 63.0 ± 0.4 g CO2 eq kg−1 FM for MIX1-MT and MIX1-ST, respectively. In both composting approaches, MIX2 showed a low CO2 equivalent (1.8 ± 0.02 and 9.9 ± 0.05 g CO2 eq kg−1 FM for MT and ST), likely due to incomplete decomposition. The bin-composting process represents a solution for recycling and reusing organic waste and livestock manure in small to medium-sized breweries. The solid fraction of the pig slurry resulted in the most suitable manure.

1. Introduction

During the late 1980s, there was a swift rise in beer’s market share within the global alcohol market, coinciding with the surge of craft brewing in the United States (US), subsequently spreading to other parts of the world [1]. Craft beers are produced by small/medium and independent breweries, typically in quantities of several thousand hectoliters (with the maximum volume allowed determined by national laws and regulations). This definition starkly contrasts with the production of “mainstream” beers, brewed in millions of hectoliters by industries like Anheuser-Busch and MillerCoors in the US [2]. According to the latest Barth report 2023–2024, worldwide beer production has been estimated at 1884 million hectoliters, while 625, 574, and 511 million hectoliters were produced in the American, Asian, and European continents, respectively [3]. At the same time, the brewing industry can generate significant quantities of by-products, including spent hops, yeast, and spent grain, with the latter constituting 85% of the total brewing industry solid by-products [4]. Specifically, for every 100 L of beer produced, 20 kg of brewers’ spent grain (BSG) are generated [5,6]. Therefore, the worldwide annual production of BSG was calculated at approximately 37 million tons [7], among which 12.5, 11.5, and 10.2 million tons were generated in the American, Asian, and European continents, respectively [3]. Many authors [8,9,10] have stated that the disposal of BSG poses a significant challenge for the brewing industry, primarily due to the large volumes produced, its low market value, and the high moisture content that favors microbial fermentations that adversely impact storage. To reduce landfill disposal and move toward a circular economy, considerable research has been undertaken to investigate various methods for recycling BSG. Currently, BSG is commonly recycled in the animal feeding sector [11], often resulting in low or even zero economic benefits for breweries [12]. BSG has also been explored for various alternative uses, including producing value-added compounds like xylitol [13] and lactic acid [14], cultivating microorganisms [15], or serving as a raw material for extracting sugars, proteins, acids, and antioxidants [16]. Moreover, Bianco et al. [17] emphasized that BSG can be effectively utilized to accelerate waste decomposition due to the growth of fungal and bacterial species naturally associated with BSG.
Composting involves the controlled decomposition of organic matter (OM) through regulated temperature, moisture, and aeration, serving as a recycling technique [18]. This process leads to the production of a stabilized final product that is free of phytotoxicity and pathogens and rich in humic compounds [19,20]. Furthermore, several authors have affirmed the effectiveness of composted OM as a valuable asset for enhancing [21,22] and conditioning soil [23]. This offers a feasible substitute for costly chemical fertilizers, ultimately decreasing the overall expenses linked with crop production [24,25]. However, composting has the disadvantage of generating and releasing greenhouse gases (GHGs) [26]. During the process, oxygen (O2) is consumed, and carbon dioxide (CO2) is released, along with methane (CH4), nitrous oxide (N2O), and other volatile substances, such as ammonia (NH3) [27]. Furthermore, aiming to obtain an organic fertilizer, Assandri et al. [9] explored the potential of recycling BSG through the composting process in bins. More in detail, they proposed two different composting mixtures utilizing the solid fraction of pig slurry and sheep manure as the starting material, coupled with wheat straw as a bulking agent [28].
Despite the extensive literature on composting, there is a lack of studies explicitly focusing on the environmental sustainability of BSG composting. Additionally, the impact of the turning operation on GHG emissions during BSG composting remains largely unexplored. Therefore, the aim of this study was to investigate the BSG composting mixtures proposed by Assandri et al. [29] and compare two different bin-composting strategies (turned and not turned) in terms of physicochemical characteristics and GHG (CO2, CH4, and N2O) emissions. Moreover, this research evaluated if the bin-composting approach is a suitable method to optimize the by-products produced by breweries while obtaining compost for organic fertilization, resulting in sustainable waste management within the circular economy framework.

2. Materials and Methods

The trial was carried out at the Institute of Sciences and Technologies for Sustainable Energy and Mobility (STEMS)—Italian National Research Council (CNR)—in Turin, Italy (44°57′ N, 7°36′ E, 245 m above sea level). BSG was obtained from a middle-sized brewery in Piedmont. The BSG composting mixtures—MIX1 and MIX2—proposed by Assandri et al. [29] have been investigated. The PSF was obtained from a fattening pig farm in Piedmont (Italy) at the end of a separation process (with a screw press Chior, mod. COM300/600), and the SM was collected in a farm in Piedmont (Italy) where sheep are raised in paddocks with a slow change in the litter (about 4 times per year). The mixtures were obtained by blending BSG and wheat straw (WS) with the solid fraction of pig slurry (PSF) for MIX1 and sheep manure (SM) for MIX2. Specifically, MIX1 comprised 48% BSG, 15% WS, and 37% PSF, while MIX2 consisted of 42% BSG, 18% WS, and 40% SM. All the above percentages refer to the weight of fresh matter. Table 1 shows the average physicochemical characteristics of the initial mixtures. These physicochemical characteristics influence the composting process. In the literature, the optimum moisture range values for composting have quite a variability, with several authors agreeing on a 60–65% water content [30]. The starting moisture levels of the mixtures were a bit elevated for optimal conditions, possibly leading to anaerobic conditions. The pH values of this study were within the suitable ranges for good microbial activity (pH 6.7–9.0) [31]. The C/N ratio initial levels of both mixtures were approximately in the optimum range for composting (ratio between 20 and 30), as highlighted by Assandri et al. [9]. In general, these initial parameters are more suitable for composting.
The composting process occurred within identical 300 L polyethylene bins (with a base diameter of 600 mm, top diameter of 700 mm, and height of 880 mm), as described and designed by Assandri et al. [29] in their previous study. During the experimental period, two different composting strategies were compared: turning composting, with the manual turning of the mass (MT), and static composting, without turning operations (ST). For the manual turning of the compost, in the MT strategy, the bin containing the pile of compost was turned upside down, and then the compost was turned with a shovel before being reintroduced into the bin. For each condition, three replicates were tested, resulting in a total of twelve bins (three bins for MIX1-ST, three for MIX1-MT, three for MIX2-ST, and three for MIX2-MT). Throughout the entire composting duration, the MT strategy bins underwent seven turns, with a turn on days 5, 12, 17, 21, 26, 33, and 46. During the composting trial, the temperature of each bin was consistently monitored using a Type K thermocouple probe connected to a multichannel acquisition system (Testo 176 T4, Milan, Italy). The probe was positioned in the center of the composting mass to avoid influences from the surrounding environment, and the temperature was recorded once per hour in each bin. The average daily temperature for each condition (n = 3) was then calculated. The ambient air temperature was measured in two different places in the area where the experimental system was stored. The device type was the same as the one used for the bins, a type K thermocouple probe connected to a multichannel acquisition system (Testo 176 T4).

2.1. Gaseous Emission Measurements

The greenhouse gas emissions (CO2, CH4, and N2O) were measured throughout the composting process (104 days), including the maturation phase. The sampling frequency was adjusted according to the composting trend, gradually decreasing as gaseous fluxes diminished. More detailed measurements were conducted three times a week during the first four weeks and then once or twice a week for the remaining period. All gas sample replicates (n = 3 for each condition) were collected simultaneously, following the approach employed by Peyron et al. [32] and Pittelkow et al. [33]. Throughout each turning operation, gaseous emission rates from the MT strategy were assessed before turning. The emissions were also measured after the turning but are not reported in this paper as they are negligible. Emissions were measured using a non-steady-state closed chamber technique adapted for this study from Livingston and Hutchinson [34]. Each lid was equipped with a pressure vent valve to maintain pressure equilibrium designed according to Hutchinson and Mosier [35] and diametrically opposite to the gas sampling port (Figure 1). The gases’ concentrations built up under the lid of composting bins. Before measuring the GHG emissions, the air of the composting units was exchanged to start the sampling as close as possible to ambient concentrations [36]. Air-tight 30 mL propylene syringes (Sigma-Aldrich, Milan, Italy) were used to collect the inside headspace gas samples from the sampling port (Figure 2) to evaluate gas fluxes. At every sampling event, three gas samples were collected from each bin at 0, 10, and 20 min after the lids were closed and sealed. Before sampling, all holes, including the drainage one, were closed (Figure 2).
Thirty mL air samples were collected and injected into twelve mL evacuated vials closed with butyl rubber septa (Exetainer®®® vial from Labco Limited, Lampeter, UK) [37]. A fully automated gas chromatograph (Agilent 7890A) with a Gerstel Maestro MPS2 autosampler was used to determine the gas concentration in the collected samples. After the injection (injector temperature 70 °C), the sample is split into two lines for gas detection; line 1 is equipped with two packed columns (Supelco Sigma Aldrich Porapack Q; Milan, Italy, and Porapak QS, Milan, Italy) kept at 80 °C and with a thermal conductivity detector (TCD) for CO2 detection and a flame ionization detector (FID) for CH4 quantification, placed in-line. On this line, He is used as carrier gas at 30 mL/min flow. Operating temperatures are 200 °C for the TCD and 250 °C for FID. Line 2 is equipped with two packed columns (Sigma Aldrich Porapack Q) and with an electron capture detector (ECD) for N2O quantification; on this line, a 5% argon-CH4 mix is used both as carrier and makeup gas (30 mL/min). The ECD operating temperature is 350 °C. All detectors are from Agilent Technologies (Agilent Technologies, Waldbronn, Germany). Each line is preceded by a 500 μL loop for sample volume determination; the system allows sample edge and tail cutting by a two-valve system to limit time analysis at nearly six minutes. Minimum detectable concentrations for each gas are as follows: 110 ppb for CH4, 16.5 ppm for CO2, 10 ppb for N2O. Fluxes were calculated based on the increasing concentration in the chamber headspace over time. The concentration increase was assessed using either a linear or nonlinear method based on the observed emission pattern. The calculation method was based on the recommendations of Hutchinson and Mosier [35] and Livingston and Hutchinson [34] and with atmospheric pressure and temperature corrections [38].
The global warming potential (GWP) was calculated to assess the potential future impacts of emissions from different gases upon the climate system in a comparative way [27]. GWP is a relative measure, reflecting a greenhouse gas’s capability to trap heat in the atmosphere. It compares the heat retention of a specific mass of the gas in question to that of a comparable mass of CO2 [39]. In this study, the GWP estimation was calculated according to the Intergovernmental Panel on Climate Change (IPCC) [40]. The global heating potential over a 100-year timespan of a GHG is calculated by the ratio of the greenhouse effect of one kilogram of the considered GHG with that of one kilogram of CO2. The GWP of CH4 is 27 and the GWP of N2O is 273.

2.2. Physicochemical Analyses

For the analyses of the physicochemical properties, five sub-samples (100 g) were collected from each bin and mixed to form a composite sample of 500 g. Each condition was tested three times (once for each bin), yielding three replicates of the composite samples per condition per sampling. The total set of composite samples collected for the physicochemical analyses were five for each condition: one on day zero, one on day 104, and three intermediate samples set at days 13, 46, and 74 to explore the progression of the mixtures during the composting process. The moisture content was determined using a gravimetric method, which involved measuring the weight loss after drying the samples at 105 °C in a ventilated oven until a constant weight was achieved for 24 h [21]. The pH of water extracts, prepared at the ratio 1:10 (w/v), was measured using a Hanna HI 9026 portable pH meter (Hanna Instruments, Woonsocket, RI, USA) fitted with a glass electrode and combined with a thermal automatic compensation system [41]. Samples for the total organic carbon (TOC) analysis were prepared by treating the dried samples with sulfuric acid (H2SO4; Sigma-Aldrich, Milan, Italy) to eliminate any inorganic carbon (C). The samples were then analyzed by a C analyzer (Carlo Erba Instruments, Rodano, Milan, Italy) [42]. Total Kjeldahl nitrogen (TKN), total ammoniacal nitrogen (NH4+-N), and nitrate nitrogen (NO3-N) were determined using the Kjeldahl standard method. The OM-percentage loss (OM loss %) by mineralization was calculated through the initial (Xi) and final (Xf) ash concentrations according to the following Equation (1) [43]. The ashes’ content was obtained by incineration of the dry matter at 500 °C for ca. 2 h [44].
OM loss (%) = 100 − 100 [Xi (100 − Xf)]/[Xf (100 − Xi)]

2.3. Statistical Analyses

The data of physicochemical parameters and differences in cumulative gas emissions were collected as three replicates per condition and subjected to an analysis of variance (ANOVA). Before the ANOVA analysis, the data underwent assessment for normal distribution using the Shapiro–Wilk test. When required, appropriate transformations, such as log transformation, were applied to enhance the distribution of residuals and ensure the homogeneity of variance. Differences between means were subsequently determined using the Bonferroni post hoc test (α = 0.05). The statistical analyses were conducted using R statistical software version 4.4.0 (24 April 2024 ucrt). The results are reported as mean value ± standard deviation (SD).

3. Results and Discussion

3.1. Composting Trial

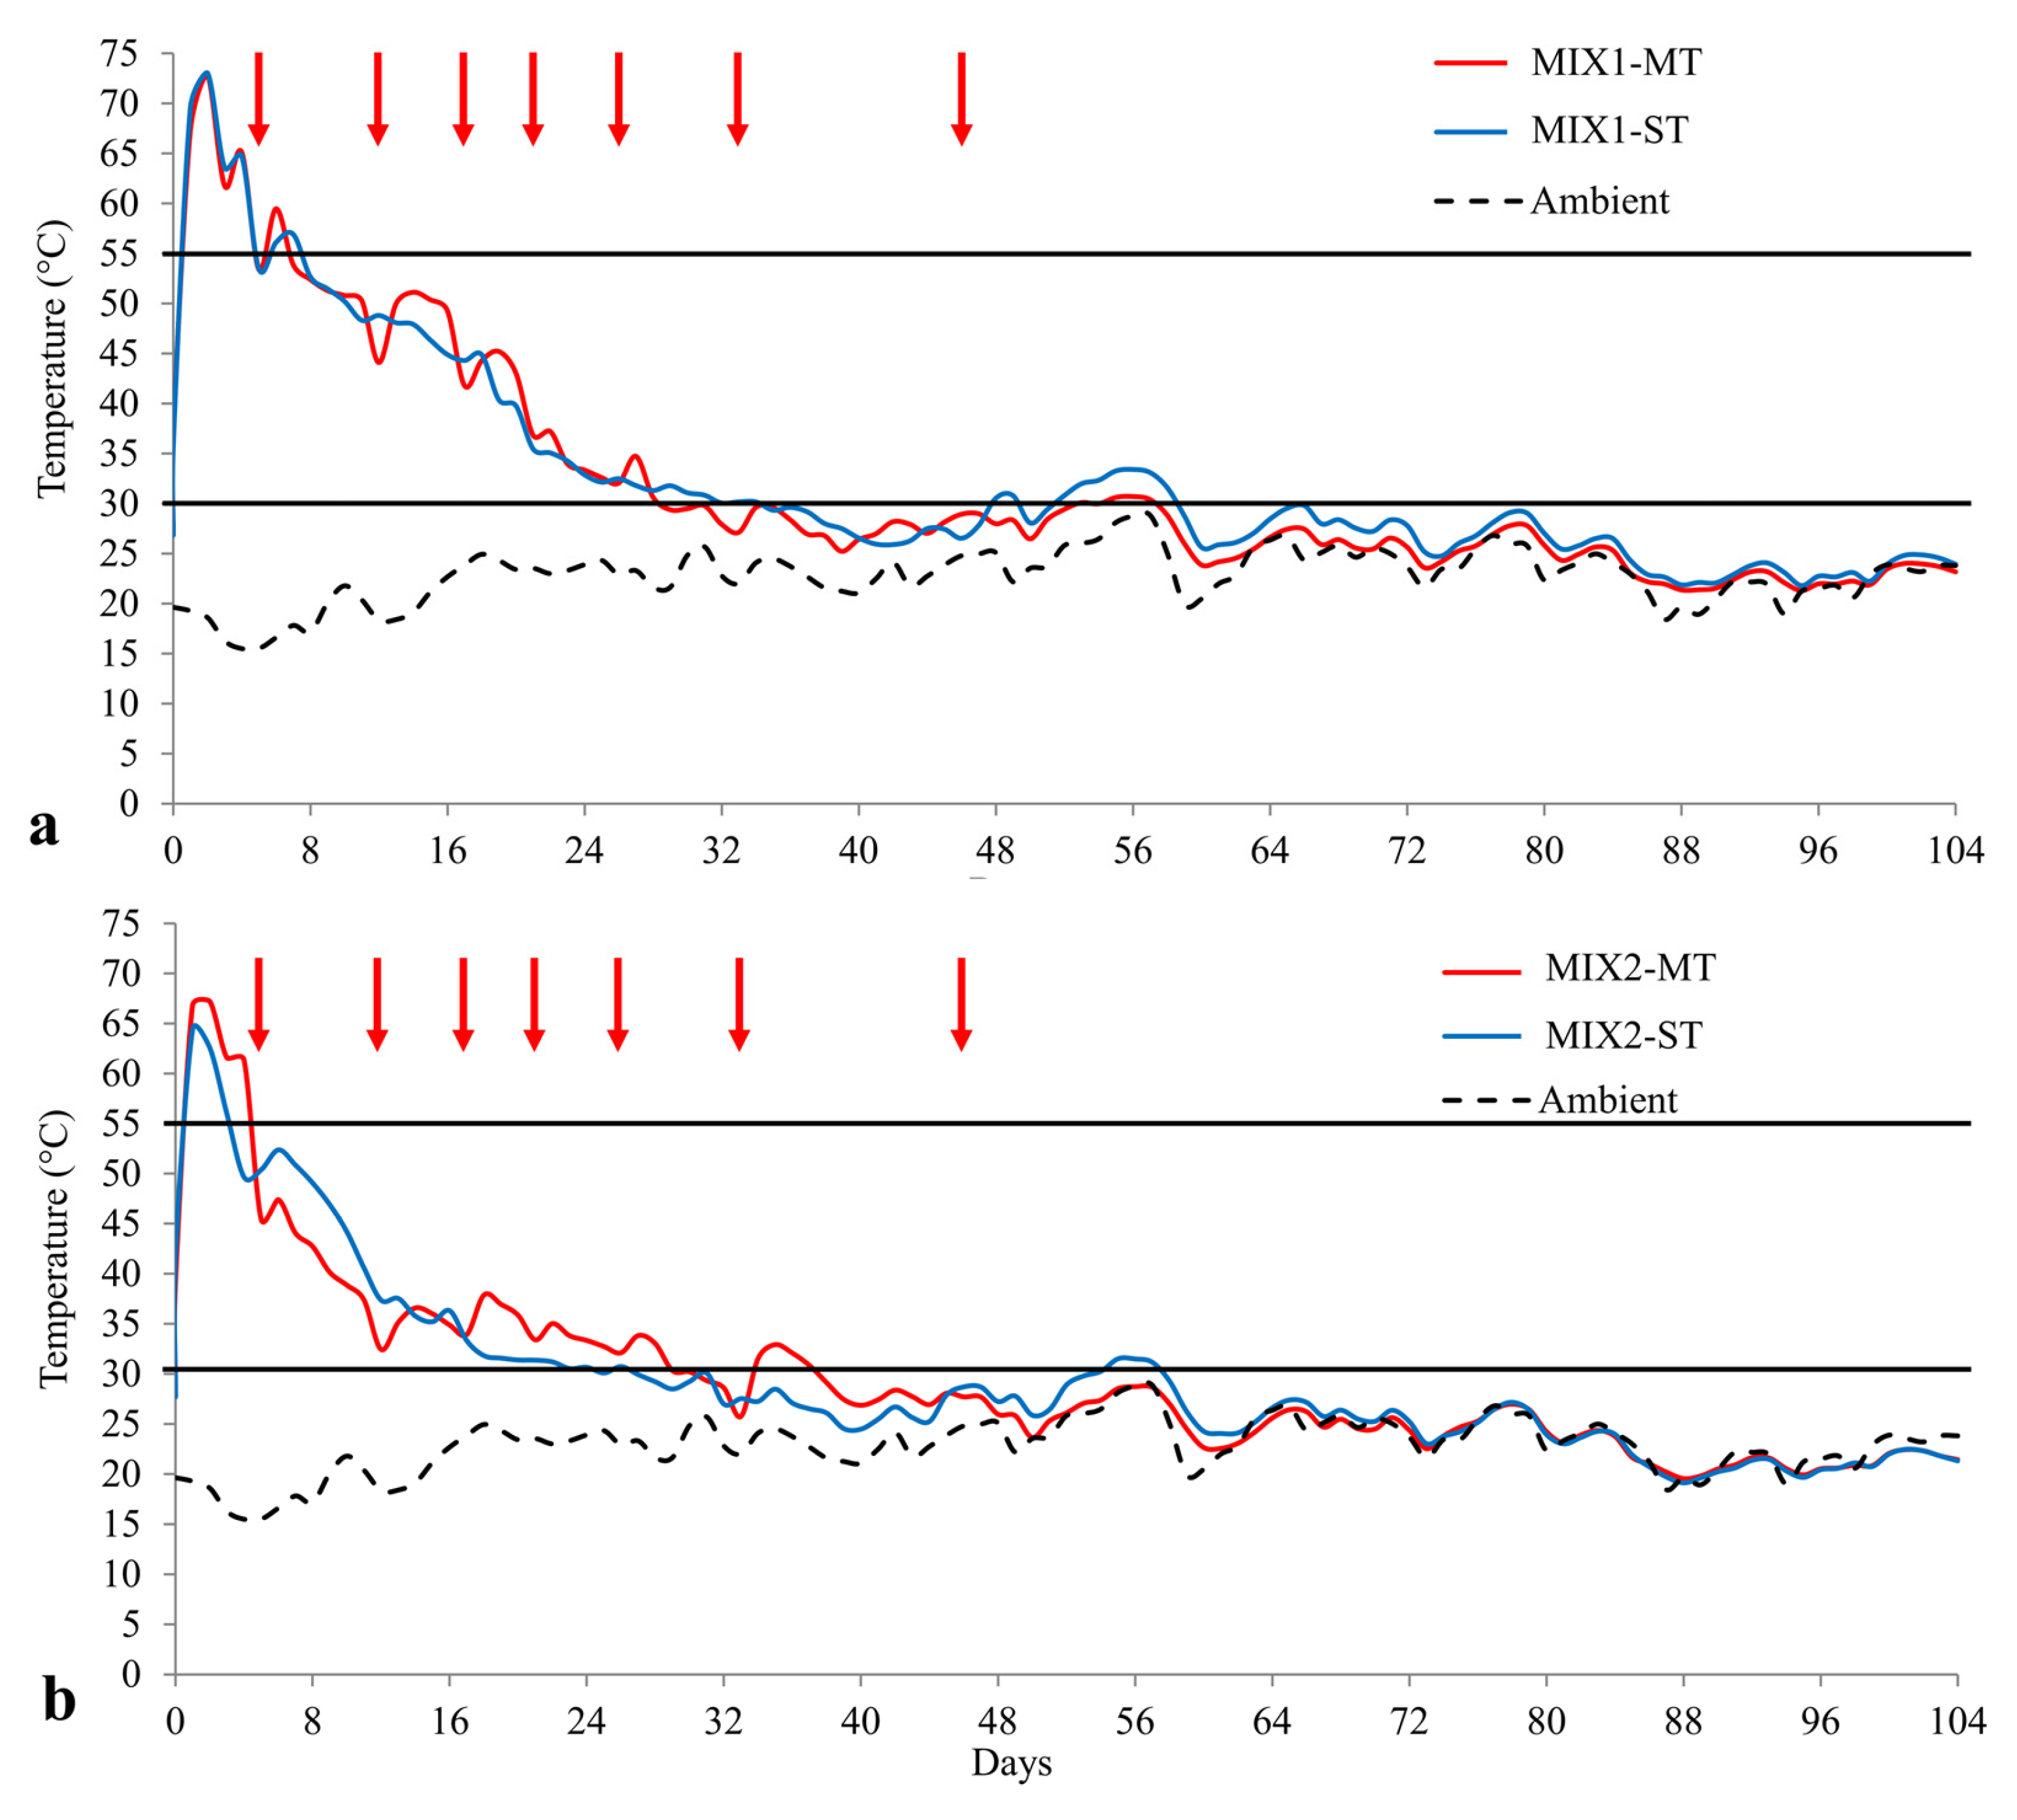
3.1.1. Temperature Trends

The temperature patterns are shown in Figure 3a (MIX1) and Figure 3b (MIX2). The temperature trend reflects microbial activity and the progression of the composting process [31,45] and classifies the composting phases [46]. Several authors [47,48,49,50,51] agree that temperatures above 55 °C for 3 to 5 days are required to achieve proper compost sanitization, while temperatures between 35 and 40 °C create optimal conditions for microbial diversification [52]. At the beginning of the composting process, the thermophilic phase was achieved under all conditions 6–7 h after the bins were closed. This rapid increase in temperature indicates that brewery by-products, when combined with livestock manure, supply readily available nutrients to the microorganisms involved in the composting process [18]. Considering MIX1, temperatures remained above 55 °C for 6 and 7 days for the MT and ST strategies, respectively. In contrast, for MIX2, the number of days was reduced to 3 and 4 days for the ST and MT strategies, respectively. The temperatures for MIX1 dropped below 40 °C on the 21st day in both strategies. For MIX2, the temperatures went below 40 °C on the 10th and 12th days for the MT and ST strategies, respectively. As suggested by Tang et al. [53], values below 30 °C indicate the end of the mesophilic phase. In our study, this phase ended on the 29th and 36th days for MIX1 in MT and ST strategies, respectively. Meanwhile, for MIX2, the mesophilic phase ended 31st for MT and 28th for ST. In general, the MT strategy increases oxygen levels within the mixtures, stimulating microbial activity and causing temperatures to rise again [54]. This was also observed in our study, where temperatures increased up to and including the penultimate turning (33rd day). Subsequently, temperature trends aligned with the ambient temperature pattern. After the final turning operation (day 46), temperatures in both mixtures remained stable, indicating the end of the active process phase.

3.1.2. Physicochemical Properties

The evolution of the physicochemical properties during the composting process is reported in Table 2. The data in Table 2 demonstrate a gradual decrease in moisture content over time, which is ascribed to metabolic heat generation [55]. Despite both composting strategies employing sealed bins throughout the experiment, from the 13th day onward, MIX1 displayed significantly higher moisture levels than MIX2, with statistical significance (p < 0.05). This difference is likely due to the two investigated manures’ different physical compositions and particle sizes.
Due to the different raw materials used, MIX1 exhibited an initial pH value of 8.3 ± 0.06, while MIX2 had an initial pH value of 8.7 ± 0.12 (Table 1). As composting progressed, the pH of MIX1 decreased rapidly after 46 days in both experimental conditions, stabilizing at final pH values of 6.2 ± 0.06 and 6.0 ± 0.12 for the MT and ST strategies, respectively (Table 2). On the other hand, MIX2 retained alkaline pH values throughout both composting approaches until the end of the process. The differences in pH can also be correlated with the animals’ diet: herbivores (sheep) or omnivores (pigs). There are not only differences in the chemical contents of the diets (higher protein amounts for omnivores and higher cellulose substances for herbivores) but also a distinction in animals’ gut microbiomes, resulting in different nitrogen metabolic processes and the bacterial and fungal composition of the compost [56,57,58]. Consistent with the results mentioned above, this study showed a decrease in pH for MIX1 (pigs) and an increase for MIX2 (sheep).
According to Equation (1), OM mineralization led to a decrease in OM concentration by 56.9% ± 1.73 and 53.9% ± 1.64 for MIX1 and MIX2 in the MT strategy and 55.7% ± 1.37 and 41.7% ± 9.41 for MIX1 and MIX2 in the ST strategy. The statistical analysis revealed significant differences (p < 0.05) between MIX1 and MIX2, suggesting variations in their composting behavior, while the strategies approach only influenced MIX2 significantly (Table 2). According to Santos et al. [43], the higher OM loss observed in MIX1 might be attributed to increased microbial activity during the initial phases of the process. This may arise from the presence of readily degradable materials originating from the solid fraction of pig slurry. On the contrary, in MIX2, the lower loss of OM can be ascribed to the larger amount of recalcitrant compounds, especially those rich in lignin, provided by the wheat straw [20,59]. The mineralization of OM was also verified through the decrease in TOC concentrations in both composting strategies and for both mixtures. The MT strategy exhibited an average reduction of 17.7% and 12.9% for MIX1 and MIX2, respectively. Meanwhile, under the ST strategy, the reduction amounted to 12.8% for MIX1 and 7.6% for MIX2. Similar values were reported in similar composting conditions by Guo et al. [54].
The minor TOC reduction observed in MIX2 may be attributed to its higher proportion of wheat straw, which possesses greater lignification and resistance to degradation. In the MT strategy, the higher reduction in TOC content observed is attributable to the turning system [43,60,61,62].
The rise in TKN concentrations during composting results from OM oxidation [39,63,64]. At the outset of the composting trial, there were no significant differences (p > 0.05) between strategies. As shown in Table 2, after a 104-day composting period, the TKN concentration in MIX1 was significantly (p < 0.05) higher than in MIX2 (3.7% ± 0.10 compared to 3.1% ± 0.13 for MT and 3.5% ± 0.17 compared to 2.9% ± 0.04 for ST).
The NH4+-N concentration decreased during the composting process in all treatments. Simultaneously, the content of NO3-N increased, mainly due to the nitrification process promoted by nitrifying bacteria such as Nitrosomonas spp. and Nitrobacter spp. The highest concentrations of NH4+-N were observed in static composting (ST). The statistical analyses showed a significant difference (p < 0.05) between MT and ST. This variance might be explained by the loss of volatilized NH3 during the turning operations [65]. As expected, NO3-N levels without turning operations were significantly higher (p < 0.05) than those obtained in the MT strategy at the end of the composting process. These results are in accordance with the trends of these two mineral-N forms in other studies [54,66,67].
As presented in Table 2, across all examined mixtures, there was a reduction in the C/N ratio with an increase in composting time. For MIX1, this ratio decreased from 18.2 ± 0.78 to 11.6 ± 0.29 and 12.9 ± 0.64 in MT and ST strategies, respectively. Similarly, MIX2 decreased from 19.1 ± 0.15 to 13.9 ± 0.28 and 15.5 ± 0.21 under MT and ST conditions, with significant differences (p < 0.05) between both mixtures and strategies. This reduction in the C/N ratio primarily resulted from the conversion of organic carbon into CO2 and CH4 [68], coupled with an increase in total nitrogen content [69,70].
As described in previous works [9,29,71,72], BSG-derived compost is a rich nutrient source that can be used as a soil fertilizer, offering a sustainable alternative to chemical fertilizers. However, immature compost can negatively affect plant growth and seed germination, limiting its agricultural use [73,74,75,76,77]. To assess compost maturity, chemical indicators such as nitrification (NH4+-N/NO3-N) [78] and the C/N ratio [79] are commonly used. For these parameters, values indicating good compost maturity are below 1.0 and 20, respectively [79]. In our study, at the end of the composting process (104 days), both values gradually decreased in all treatments and dropped below 0.50 and 15.5, respectively, confirming good compost maturation (see Table 2).

3.2. Greenhouse Gas Emissions

3.2.1. CO2 Emissions

CO2 emissions are representative of microbial activities [80]. As shown in Figure 4, in all treatments, CO2 emissions rapidly increased within the first few days due to the rapid degradation of OM under high temperatures. More in detail, maximum emissions were observed of 2973 mg kg−1 day−1 in MIX2-ST on the 3rd day, 2366 mg kg−1 day−1 in MIX1-MT on the 14th day, 2171 mg kg−1 day−1 in MIX2-MT on the 3rd day, and 1937 mg kg−1 day−1 in MIX1-ST on the 3rd day. After the first peak (day 3rd), during the thermophilic phase, the CO2 emissions declined due to the decreased availability of easily degradable OM [81]. However, after two weeks (day 14th), corresponding to the final part of the mesophilic phase and/or the beginning of the maturation phase, a second CO2 peak was observed under all conditions. This could be due to the presence of newly easily available degradable OM for mesophilic microorganisms [53]. Considering the two composting strategies investigated, the second peak of CO2 emissions was higher than the first in the MT system (for both MIXs), highlighting the positive effect of the turning operations. Conversely, in the ST strategy, the second peak was lower than the first, indicating a progressive decline in microbial activity, a more stable OM, and a reduction in O2 availability due to the absence of turning operations [82]. Finally, the maturation phase is characterized by a lower CO2 emission, with mean values well below 60 mg C kg−1 d−1.

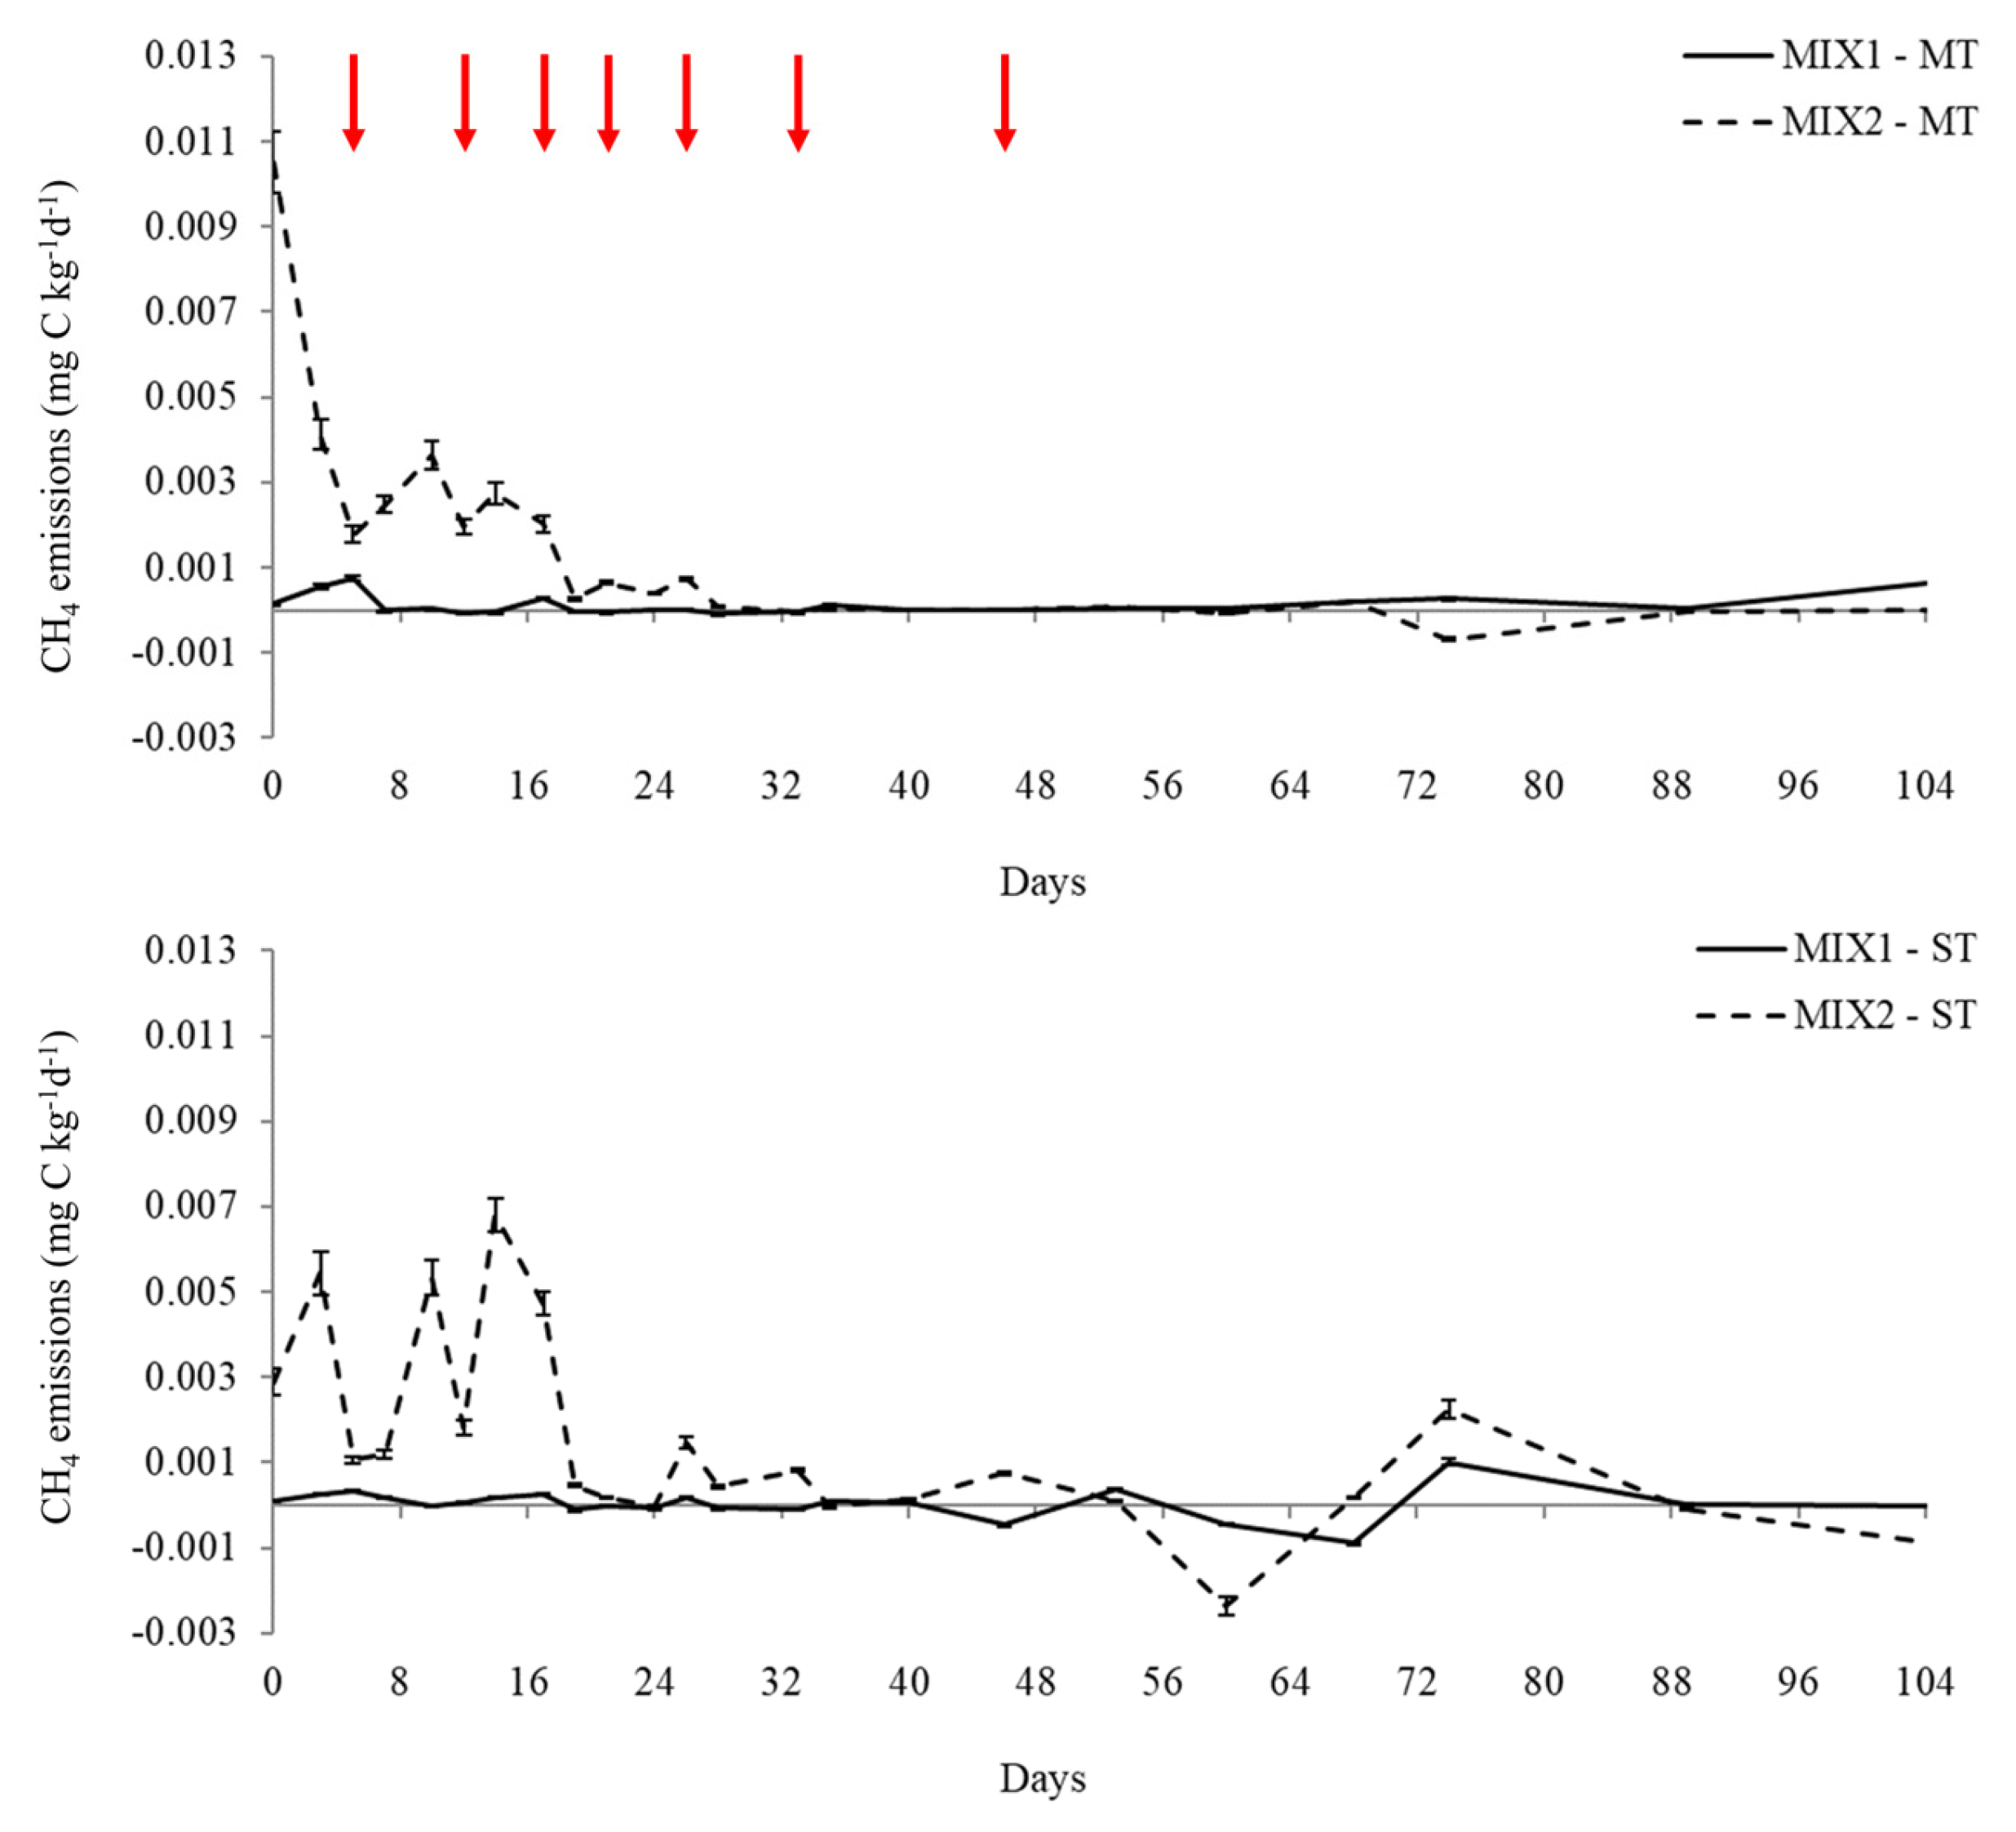
3.2.2. CH4 Emissions

There are several aspects that influence the production of CH4, such as the composting approach, the technology system used (e.g., static or dynamic process, open or closed systems) [83,84], and the waste type and characteristics [85]. In this context, Szanto et al. [86] observed lower N2O and CH4 emissions in turned piles than in static systems. Instead, Ermolaev et al. [87] found that the emissions of CH4 and N2O were low independently of the level of ventilation. CH4 is produced in anaerobic conditions by methanogenic bacteria. These conditions can be generated in anaerobic microsites that occur inside the piles with intense microbial activity and O2 depletion and/or the compaction resulting from an excessive pile height [88]. Therefore, higher emissions of CH4 may indicate inadequate aeration during composting and a different free-air porosity of raw materials [89]. In this investigation, CH4 fluxes were predominantly negligible, with the highest measured value being 0.01 mg kg−1 for MIX2-MT noted at the beginning of the composting process, at 10 and 14 days (Figure 5). Negative CH4 fluxes (−0.002 mg kg−1) were documented in certain instances, suggesting potential methanotrophic bacteria activity. Fukumoto et al. [88] noted that controlling the composting process with smaller piles could assist in reducing CH4 emissions. The peak showed by MIX2–MT at the beginning of the composting process (day zero) can be attributed to the substantial trampling that the sheep manure underwent, leading to compaction and the formation of anaerobic conditions within the mixture. Moreover, the SM remained in the enclosure for a while before being collected; therefore, the composting process was likely already ongoing. The following peaks of MIX2 could be linked to the nature of sheep’s excrement, which is capable of preserving methanogenic microorganisms in comparison to pigs’ manure. These microorganisms are known to favor CH4 production under anaerobic conditions in manure digesters [90]. Vice versa, negative values of emission fluxes, though negligible, can indicate methanotrophic activity, where bacteria use CH4 as a carbon source, reducing emissions [76]. As expected, the CH4 emission dynamics were also influenced by the turning operations. In particular, the CH4 emission rate promptly declined after turning due to the improved aeration of the composting mixtures. However, during the period between turnings, the intense aerobic activity led to a reduction in oxygen concentration, creating conditions conducive to anaerobic processes and, consequently, CH4 production [81]. Fukumoto et al. [88] demonstrated that the anaerobic section within the compost piles diminished and eventually vanished as the composting material matured.

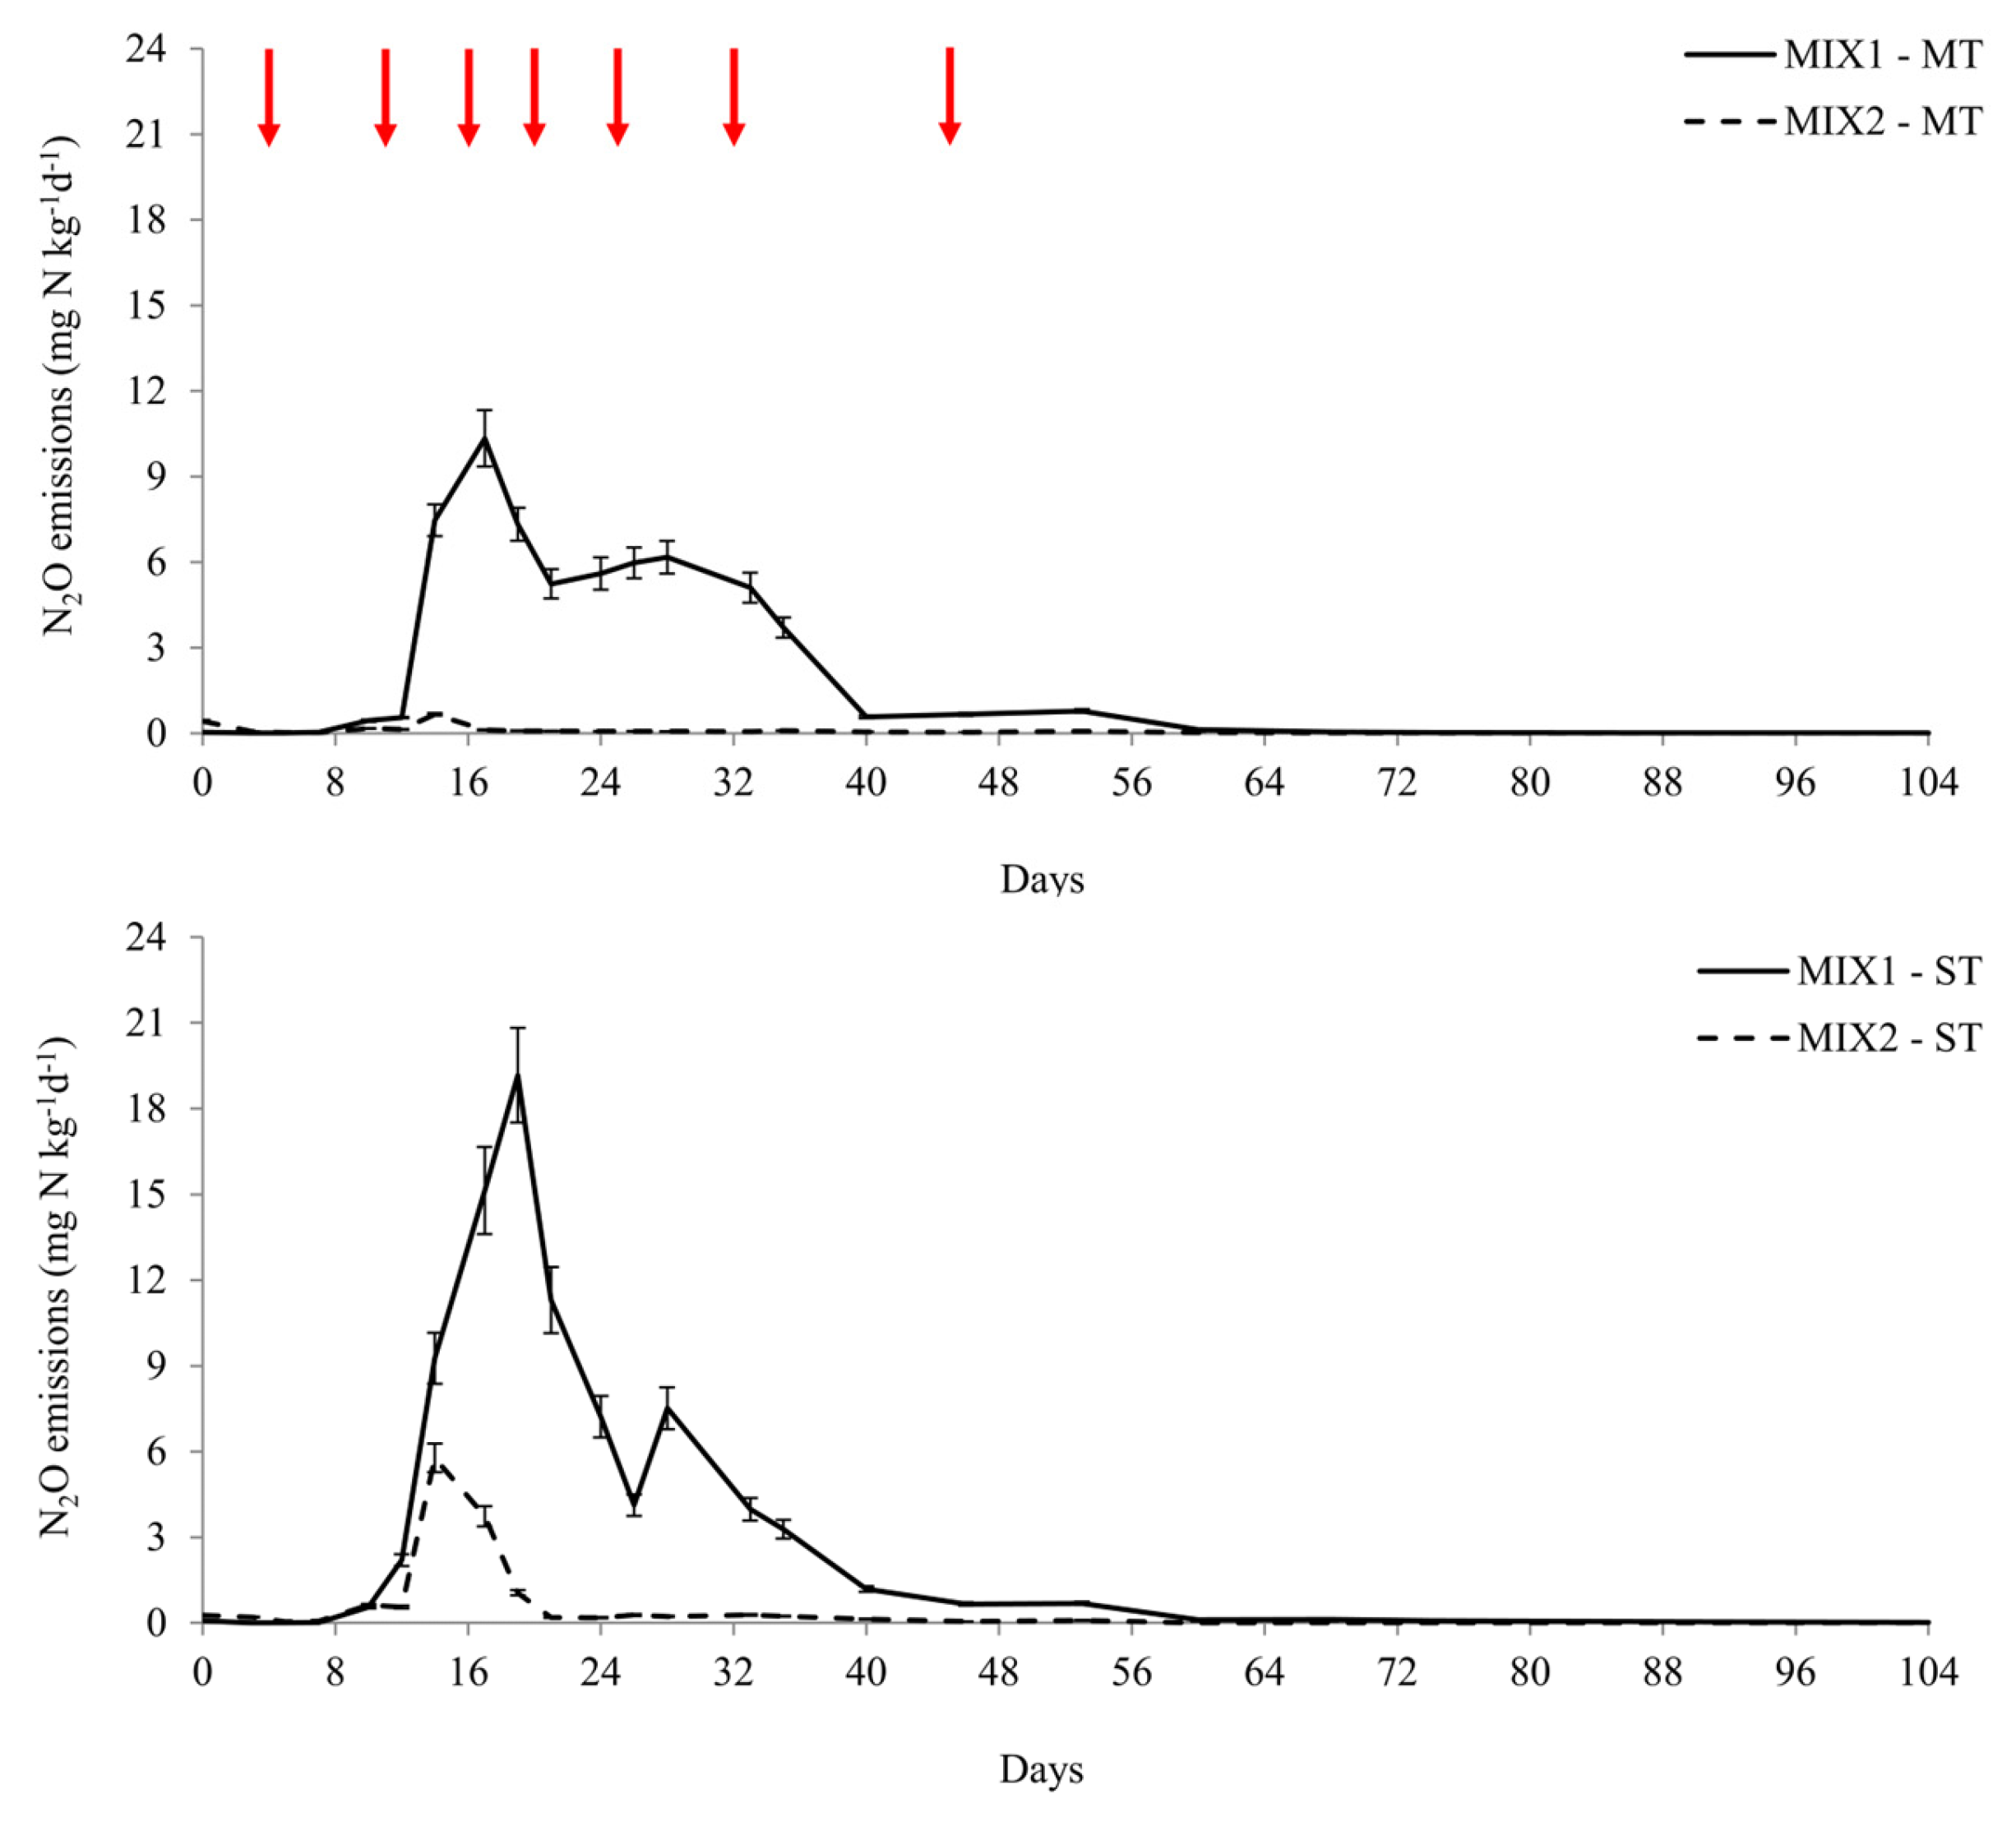
3.2.3. N2O Emissions

The complete nitrification/denitrification process typically converts NH4 into N2, a non-polluting gas [91]. On the contrary, as shown in Figure 6, the production of N2O suggests that during BSG composting, there were incomplete nitrification/denitrification processes. More in detail, nitrification is an aerobic process that initially involves the conversion of NH3 into nitrite (NO2) by NH3-oxidizing bacteria like Nitrospira and Nitrosomonas [92]. This is followed by NO2 oxidation to NO3 by NO2-oxidizing bacteria, such as Nitrobacter [93]. On the other hand, denitrification is primarily responsible for N2O production. It is an anoxic process facilitated by heterotrophic microorganisms, resulting in the reduction of NO3 to N2, with N2O acting as an intermediate product [94,95]. In conclusion, N2O can be produced under both aerobic and anaerobic conditions [91,96]. As presented in Figure 6, the N2O emission peaks were observed between day 12 and day 40, with average temperatures decreasing from 40 °C to 30 °C. Several authors [87,88,97,98,99] have explained the reason for this pattern in their studies: the microorganisms responsible for N2O production are generally mesophilic and do not proliferate at high temperatures; thus, the emissions of this gas tend to increase after the end of the thermophilic phase. There are also authors [91,100,101,102], though, who reported the highest N2O emissions in the first week of composting, when the temperatures inside the piles were higher. As suggested by Szanto et al. [86], the timeframe for N2O emission depends on the specific microorganism involved, since there are methanotrophs capable of ammonium oxidation under thermophilic conditions. An alkaline pH, characteristic of MIX2 (Table 2), inhibits nitrification and promotes the transformation of NH4+ into NH3, which can be lost through volatilization, as reported by Cayuela et al. as well [103]. These factors likely contribute to the reduced N2O emission by MIX2 in both composting strategies (Table 2). Moreover, the N2O emissions are also related to the C/N ratio. In fact, the N2O emissions are higher when the C/N ratio is lower than 17 [103]. Therefore, the C/N ratio of MIX2 (lower than that of MIX1) could contribute to the lower N2O emissions of MIX2. In turned compost piles, improved aeration reduces N₂O emissions compared to unturned mixtures by preventing the formation of anaerobic zones. Conversely, in unturned piles, anaerobic conditions promote heterotrophic denitrification and NO₂⁻ accumulation, leading to N₂O production [104]. Enhanced oxygen availability in turned piles inhibits nitrifier denitrification and hydroxylamine oxidation, which are key pathways for N₂O emissions under aerobic conditions [105]. Additionally, aeration improves the physical structure of the compost, minimizing anoxic regions and supporting aerobic nitrification [106]. Overall, the N2O emission trend reported in this study is similar to those described by other authors [81,88,97].

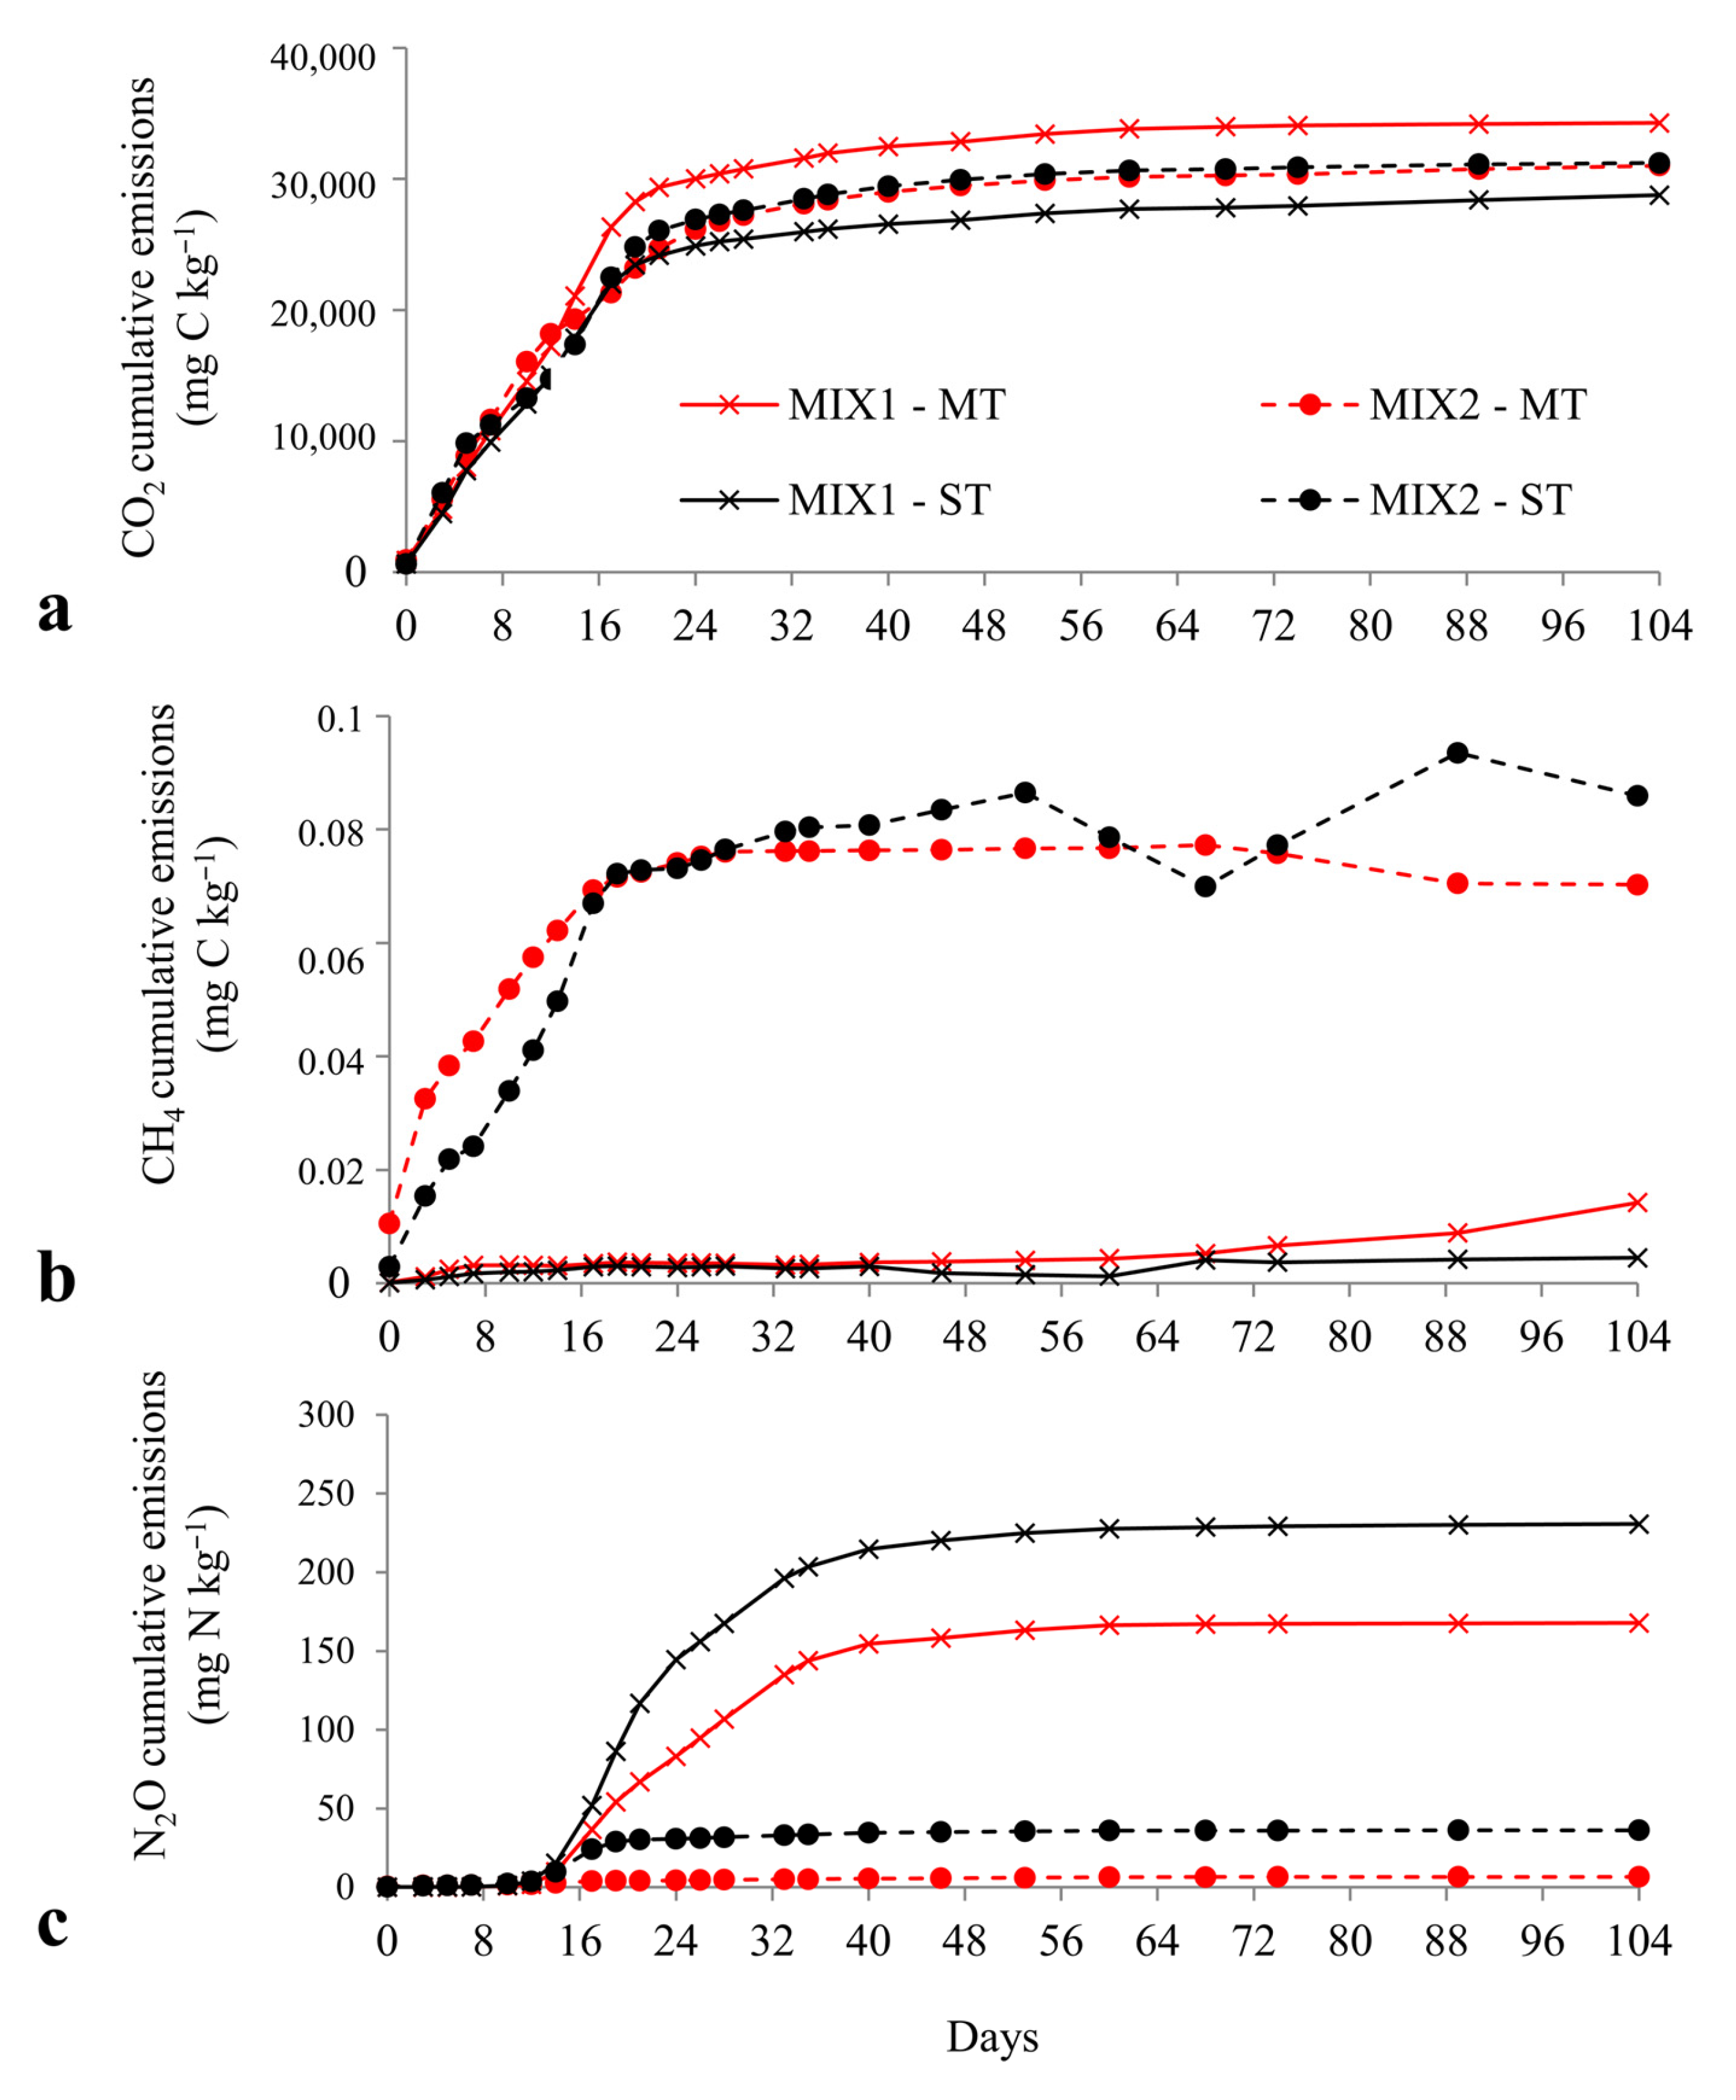
3.2.4. Cumulative Gas Emissions

Data on cumulative GHG emissions are shown in Table 3(a). Due to the turning operations, MIX1-MT showed the highest CO2 emission (34.3 g ± 0.03 C kg−1 FM). Then follows MIX2, likely thanks to the higher presence of a bulking agent (wheat straw) that increases the free-air porosity and air storage useful for microbial activity [91,101], with 31.2 ± 0.02 and 31.0 ± 0.06 g C kg−1 FM for MIX2-ST and MIX2-MT, respectively. The fact that both composting approaches for MIX2 presented comparable CO2 emissions is probably linked to the characteristics of the SM. Both MT and ST have free-air porosity due to WS (lower emissions than MIX1-ST), but since the SM was collected after being trampled on by the livestock, it was compacted, leading to the formation of lumps in the compost and local anaerobic conditions that were not affected by the turning. Finally, the lowest emissions were recorded for MIX1-ST. The turning operation improved the blending of elements like oxygen, nitrogen, carbon, and water, and significantly increased (p < 0.05) the total CO2 emissions observed during the 104-day trial in MIX1–MT compared to MIX1-ST. At the same time, no significant differences were found between the MT and ST strategies for MIX2. Cumulative CO2 emissions (Figure 7a) were similar for all treatments, with the levels of CO2 emission decreasing as the composting process progressed. Overall, the CO2 cumulative emissions were 10 times lower than those reported by Williams et al. [102] with windrows and by Santos et al. [39] in vessels with food and green wastes. The curves showed two different phases of C mineralization: the first phase with a steeper slope, indicative of the rapid decomposition of the most easily biodegradable compounds and a high degree of microbial activity, while in the second phase, the CO2 production stabilizes due to the presence of more resistant compounds, with a consequent reduction in microbial activity [62]. The cumulative emissions of CH4 and N2O are strongly linked to the type of manure. The composting bins with sheep’s manure presented a significantly higher production of CH4 than those with pigs’ slurry (Figure 7b and Table 3a), while the results are reverted for N2O (Figure 7c and Table 3a). For N2O, the composting method influences the gas emissions, too. In fact, both mixtures showed a significantly higher cumulative production of N2O with the ST approach. This result is in accordance with Szanto et al. [86].

3.2.5. Global Warming Potential (GWP)

The CO2 emitted from composting processes is usually accounted for as neutral concerning global warming [107,108]. While CH4 and N2O are strong greenhouse gases, they are 27 and 273 times more potent than CO2 over a 100-year time horizon, respectively. From the total emission of CH4 and N2O, we can estimate a CO2 equivalent emission factor for the whole composting process of 45.8 ± 0.21 g CO2 eq kg−1 FM for MIX1-MT and 63.0 ± 0.39 g CO2 eq kg−1 FM for MIX1-ST (Table 4). These values fall within the range (20 to 65 kg CO2 eq Mg−1) reported by Amlinger et al. [97] for an entire composting process of biowaste and green waste. The CO2 equivalent emissions found for the MIX2 in both strategies were very low, equal to 1.8 ± 0.02 g CO2 eq kg−1 for MIX2-MT and 9.9 ± 0.05 g CO2 eq kg−1 FM for MIX2-ST (Table 4). Amlinger et al. [97] reported that values exceeding the range mentioned above (20 to 65 kg CO2 eq Mg−1) may indicate system mismanagement, such as an unbalanced initial mixture (excessive moisture, high available N sources, low C/N ratio, and air-filled pore space) or insufficient aeration and mechanical mass turning [97]. On the other hand, values below this range (20 to 65 kg CO2 eq Mg−1) suggest the presence of extreme and atypical conditions, such as the composting duration being too short, incomplete decomposition, or a very high C/N ratio [97]. Thus, the very low CO2 equivalent emissions recorded for MIX2 with both strategies suggest that sheep manure is less suitable for composting BSG. This result is likely linked to the fact that the manures of pigs and sheep were collected and prepared differently for composting. Pigs’ slurry was collected continuously and underwent a solid/liquid separation process, and only the solid part was used. Sheep’s manure was collected altogether and after being trampled on and compacted by the livestock. This starting composting characteristics of MIX2 probably led to local (within the composting pile) anaerobic conditions.

4. Conclusions

The compost from BSG and sheep or pigs’ manure represents an effective strategy to manage and valorize breweries’ by-products, obtaining a soil amendment with a high nitrogen content. The emissions of CH4 and N2O from the composting process are affected by several factors, including the characteristics of the initial substrate, the bulking material, and the manure used. The initial characteristics of the by-product play a significant role in determining the degradation potential and consequent availability of C and N during the process. The proportion of the bulking agent in the mixture and the turning frequency of the pile were key factors determining the O2 concentration inside the composting pile. A higher proportion of bulking agents and the mechanical turning of the mass promote aerobic conditions, which decrease CH4 production. Moreover, the dimensions of the piles can also affect the GHG emissions; in fact, the disappearance of the anaerobic portions is indirectly proportional to the amount of mass being composted, meaning that smaller piles can facilitate more efficient decomposition and minimize anaerobic conditions, leading to reduced GHG emissions. Therefore, carrying out an easy-to-implement on-site composting process in small to medium breweries could lead to the valorization of agro-industrial waste (BSG) and, at the same time, minimize the production of greenhouse gases. Thanks to its physicochemical characteristics, the solid fraction of the pig slurry resulted in the most suitable manure for the composting process.

Author Contributions

Conceptualization, D.A., G.G. and A.B.; methodology, D.A., G.G., A.B., M.B. and N.P.; validation, D.A., G.G. and N.P.; formal analysis, D.A., A.B. and M.B.; investigation, D.A., G.G. and N.P.; resources, M.B. and N.P.; writing—original draft preparation, D.A., G.G., A.B. and G.Z.; writing—review and editing, D.A., G.G., A.B., G.Z., M.B. and N.P.; visualization, D.A., G.G. and A.B.; supervision, G.Z., M.B. and N.P.; funding acquisition, M.B. and N.P. All authors have read and agreed to the published version of the manuscript.

Funding

This research was funded by the projects “Sviluppo sostenibile della birra artigianale in Sardegna” BiAr—C.U.P. J84I18000070006. A.B. research technologist grant is financed by the European Commission—NextGenerationEU, Project SUS-MIRRI.IT “Strengthening the MIRRI Italian Research Infrastructure for Sustainable Bioscience and Bioeconomy”, code n. IR0000005, and by the Sardinia Regional Government (art.7 L.R. 16/2014 and art.10 L.R. 194/2015) in the frame of the MicroBiodiverSar project (CUP E77G2200 0470002).

Data Availability Statement

The data presented in this study are available on request from the first author.

Conflicts of Interest

The authors declare no conflicts of interest.

Abbreviations

The following abbreviations are used in this manuscript:
BSGBrewers’ spent grain
CCarbon
C/NCarbon to nitrogen ratio
CH4Methane
CNRItalian National Research Council
CO2Carbon dioxide
GHGGreenhouse gases
GWPGlobal warming potential
H2SO4Sulfuric acid
IPCCIntergovernmental panel on climate change
MTManual turning composting
N2Molecular nitrogen
N2ONitrous oxide
NH3Ammonia
NH4+-NAmmoniacal nitrogen
NO2Nitrite
NO3Nitrate
NO3-NNitrate nitrogen
O2Molecular oxygen
OMOrganic matter
PSFPig slurry solid fraction
SDStandard deviation
SMSheep manure
STStatic composting
STEMSInstitute of Sciences and Technologies for Sustainable Energy and Mobility
TKNTotal Kjeldahl nitrogen
TOCTotal organic carbon
USThe United States
WSWheat straw

References

  1. Vincast Is Wine Losing to Beer? Available online: https://www.forbes.com/sites/auctionforecast/2018/03/02/is-wine-losing-to-beer/ (accessed on 1 January 2025).
  2. Reid, N.; McLaughlin, R.B.; Moore, M.S. From Yellow Fizz to Big Biz: American Craft Beer Comes of Age. Focus Geogr. 2014, 57, 114–125. [Google Scholar] [CrossRef]
  3. Barth-Haas Group. The Barth Report Hops 2023/2024; Barth-Haas: Nürnberg, Germany, 2024. [Google Scholar]
  4. Kerby, C.; Vriesekoop, F. An Overview of the Utilisation of Brewery By-Products as Generated by British Craft Breweries. Beverages 2017, 3, 24. [Google Scholar] [CrossRef]
  5. Devolli, A.; Shahinasi, E.; Stafasani, M.; Feta, D.; Dara, F. Evaluation of Brewery Waste and Its Reduction Methods. Albanian J. Agric. Sci. 2018, 506–513. Available online: https://www.researchgate.net/profile/Ariola-Devolli/publication/329529123_Evaluation_of_brewery_waste_and_its_reduction_methods/links/5c0e3bf44585157ac1b7312c/Evaluation-of-brewery-waste-and-its-reduction-methods.pdf (accessed on 18 March 2025).
  6. Bianco, A.; Budroni, M.; Zara, S.; Mannazzu, I.; Fancello, F.; Zara, G. The Role of Microorganisms on Biotransformation of Brewers’ Spent Grain. Appl. Microbiol. Biotechnol. 2020, 104, 8661–8678. [Google Scholar] [CrossRef]
  7. Cacace, C.; Cocozza, C.; Traversa, A.; Coda, R.; Rizzello, C.G.; Pontonio, E.; De Mastro, F.; Brunetti, G.; Verni, M. Potential of Native and Bioprocessed Brewers’ Spent Grains as Organic Soil Amendments. Front. Sustain. Food Syst. 2022, 6, 1010890. [Google Scholar] [CrossRef]
  8. Xiros, C.; Christakopoulos, P. Biotechnological Potential of Brewers Spent Grain and Its Recent Applications. Waste Biomass Valorization 2012, 3, 213–232. [Google Scholar] [CrossRef]
  9. Assandri, D.; Pampuro, N.; Zara, G.; Cavallo, E.; Budroni, M. Suitability of Composting Process for the Disposal and Valorization of Brewer’s Spent Grain. Agriculture 2020, 11, 2. [Google Scholar] [CrossRef]
  10. Olajire, A.A. The Brewing Industry and Environmental Challenges. J. Clean. Prod. 2020, 256, 102817. [Google Scholar] [CrossRef]
  11. Lao, E.J.; Dimoso, N.; Raymond, J.; Mbega, E.R. The Prebiotic Potential of Brewers’ Spent Grain on Livestock’s Health: A Review. Trop. Anim. Health Prod. 2020, 52, 461–472. [Google Scholar] [CrossRef]
  12. Arranz, J.I.; Miranda, M.T.; Sepúlveda, F.J.; Montero, I.; Rojas, C.V. Analysis of Drying of Brewers’ Spent Grain. Proceedings 2018, 2, 1467. [Google Scholar] [CrossRef]
  13. Mussatto, S.I.; Dragone, G.; Roberto, I.C. Brewers’ Spent Grain: Generation, Characteristics and Potential Applications. J. Cereal Sci. 2006, 43, 1–14. [Google Scholar] [CrossRef]
  14. Gupta, S.; Jaiswal, A.K.; Abu-Ghannam, N. Optimization of Fermentation Conditions for the Utilization of Brewing Waste to Develop a Nutraceutical Rich Liquid Product. Ind. Crops Prod. 2013, 44, 272–282. [Google Scholar] [CrossRef]
  15. Hassan, S.S.; Tiwari, B.K.; Williams, G.A.; Jaiswal, A.K. Bioprocessing of Brewers’ Spent Grain for Production of Xylanopectinolytic Enzymes by Mucor sp. Bioresour. Technol. Rep. 2020, 9, 100371. [Google Scholar] [CrossRef]
  16. Aliyu, S.; Bala, M. Brewer’s Spent Grain: A Review of Its Potentials and Applications. Afr. J. Biotechnol. 2011, 10, 324–331. [Google Scholar]
  17. Bianco, A.; Fancello, F.; Garau, M.; Deroma, M.; Atzori, A.S.; Castaldi, P.; Zara, G.; Budroni, M. Microbial and Chemical Dynamics of Brewers’ Spent Grain during a Low-Input Pre-Vermicomposting Treatment. Sci. Total Environ. 2022, 802, 149792. [Google Scholar] [CrossRef]
  18. Stocks, C.; Barker, A.J.; Guy, S. The Composting of Brewery Sludge. J. Inst. Brew. 2002, 108, 452–458. [Google Scholar] [CrossRef]
  19. Kakabouki, I.; Folina, A.; Efthimiadou, A.; Karydogianni, S.; Zisi, C.; Kouneli, V.; Kapsalis, N.C.; Katsenios, N.; Travlos, I. Evaluation of Processing Tomato Pomace after Composting on Soil Properties, Yield, and Quality of Processing Tomato in Greece. Agronomy 2021, 11, 88. [Google Scholar] [CrossRef]
  20. Nolan, T.; Troy, S.M.; Healy, M.G.; Kwapinski, W.; Leahy, J.J.; Lawlor, P.G. Characterization of Compost Produced from Separated Pig Manure and a Variety of Bulking Agents at Low Initial C/N Ratios. Bioresour. Technol. 2011, 102, 7131–7138. [Google Scholar] [CrossRef]
  21. Moretti, B.; Bertora, C.; Grignani, C.; Lerda, C.; Celi, L.; Sacco, D. Conversion from Mineral Fertilisation to MSW Compost Use: Nitrogen Fertiliser Value in Continuous Maize and Test on Crop Rotation. Sci. Total Environ. 2020, 705, 135308. [Google Scholar] [CrossRef]
  22. Urra, J.; Alkorta, I.; Garbisu, C. Potential Benefits and Risks for Soil Health Derived From the Use of Organic Amendments in Agriculture. Agronomy 2019, 9, 542. [Google Scholar] [CrossRef]
  23. Bhattacharya, S.S.; Kim, K.-H.; Das, S.; Uchimiya, M.; Jeon, B.H.; Kwon, E.; Szulejko, J.E. A Review on the Role of Organic Inputs in Maintaining the Soil Carbon Pool of the Terrestrial Ecosystem. J. Environ. Manag. 2016, 167, 214–227. [Google Scholar] [CrossRef]
  24. Chrysargyris, A.; Saridakis, C.; Tzortzakis, N. Use of Municipal Solid Waste Compost as Growing Medium Component for Melon Seedlings Production. J. Plant Biol. Soil Health 2013, 1, 5. [Google Scholar] [CrossRef]
  25. Papamichalaki, M.; Papadaki, A.; Tzortzakis, N. Substitution of Peat with Municipal Solid Waste Compost in Watermelon Seedling Production Combined with Fertigation. Chil. J. Agric. Res. 2014, 74, 452–459. [Google Scholar] [CrossRef]
  26. Ermolaev, E.; Sundberg, C.; Pell, M.; Jönsson, H. Greenhouse Gas Emissions from Home Composting in Practice. Bioresour. Technol. 2014, 151, 174–182. [Google Scholar] [CrossRef] [PubMed]
  27. Zhu-Barker, X.; Shannon, K.B.; Kyaw Tha Paw, U.; Burger, M.; Horwath, W.R. Greenhouse Gas Emissions from Green Waste Composting Windrow. Waste Manag. 2017, 59, 70–79. [Google Scholar] [CrossRef]
  28. Pampuro, N.; Busato, P.; Cavallo, E. Gaseous Emissions after Soil Application of Pellet Made from Composted Pig Slurry Solid Fraction: Effect of Application Method and Pellet Diameter. Agriculture 2018, 8, 119. [Google Scholar] [CrossRef]
  29. Assandri, D.; Pampuro, N.; Zara, G.; Bianco, A.; Cavallo, E.; Budroni, M. Co-Composting of Brewers’ Spent Grain with Animal Manures and Wheat Straw: Influence of Two Composting Strategies on Compost Quality. Agronomy 2021, 11, 1349. [Google Scholar] [CrossRef]
  30. Vallini, G.; Di Gregorio, S.; Pera, A.; Cunha Queda, A.C. Exploitation of Composting Management for Either Reclamation of Organic Wastes or Solid-Phase Treatment of Contaminated Environmental Matrices. Environ. Rev. 2002, 10, 195–207. [Google Scholar] [CrossRef]
  31. Bernal, M.P.; Alburquerque, J.A.; Moral, R. Composting of Animal Manures and Chemical Criteria for Compost Maturity Assessment. A Review. Bioresour. Technol. 2009, 100, 5444–5453. [Google Scholar] [CrossRef]
  32. Peyron, M.; Bertora, C.; Pelissetti, S.; Said-Pullicino, D.; Celi, L.; Miniotti, E.; Romani, M.; Sacco, D. Greenhouse Gas Emissions as Affected by Different Water Management Practices in Temperate Rice Paddies. Agric. Ecosyst. Environ. 2016, 232, 17–28. [Google Scholar] [CrossRef]
  33. Pittelkow, C.M.; Adviento-Borbe, M.A.; Hill, J.E.; Six, J.; van Kessel, C.; Linquist, B.A. Yield-Scaled Global Warming Potential of Annual Nitrous Oxide and Methane Emissions from Continuously Flooded Rice in Response to Nitrogen Input. Agric. Ecosyst. Environ. 2013, 177, 10–20. [Google Scholar] [CrossRef]
  34. Livingston, G.P.; Hutchinson, G.L. Enclosure-Based Measurement of Trace Gas Exchange: Applications and Sources of Error. In Biogenic Trace Gases: Measuring Emissions from Soil and Water; Matson, P.A., Harris, R.C., Eds.; Blackwell Sci. Ltd.: Oxford, UK, 1995; pp. 14–51. [Google Scholar]
  35. Hutchinson, G.L.; Mosier, A.R. Improved Soil Cover Method for Field Measurement of Nitrous Oxide Fluxes. Soil Sci. Soc. Am. J. 1981, 45, 311–316. [Google Scholar] [CrossRef]
  36. Andersen, J.K.; Boldrin, A.; Christensen, T.H.; Scheutz, C. Greenhouse Gas Emissions from Home Composting of Organic Household Waste. Waste Manag. 2010, 30, 2475–2482. [Google Scholar] [CrossRef] [PubMed]
  37. Bertora, C.; Peyron, M.; Pelissetti, S.; Grignani, C.; Sacco, D. Assessment of Methane and Nitrous Oxide Fluxes from Paddy Field by Means of Static Closed Chambers Maintaining Plants Within Headspace. J. Vis. Exp. 2018, 2018, e56754. [Google Scholar] [CrossRef]
  38. Rochette, P.; Eriksen-Hamel, N.S. Chamber Measurements of Soil Nitrous Oxide Flux: Are Absolute Values Reliable? Soil Sci. Soc. Am. J. 2008, 72, 331–342. [Google Scholar] [CrossRef]
  39. Santos, C.; Goufo, P.; Fonseca, J.; Pereira, J.L.S.; Ferreira, L.; Coutinho, J.; Trindade, H. Effect of Lignocellulosic and Phenolic Compounds on Ammonia, Nitric Oxide and Greenhouse Gas Emissions During Composting. J. Clean. Prod. 2018, 171, 548–556. [Google Scholar] [CrossRef]
  40. Intergovernmental Panel on Climate Change (IPCC). Climate Change 2021—The Physical Science Basis; Cambridge University Press: Cambridge, UK, 2023; ISBN 9781009157896. [Google Scholar]
  41. Pampuro, N.; Bertora, C.; Sacco, D.; Dinuccio, E.; Grignani, C.; Balsari, P.; Cavallo, E.; Bernal, M.P. Fertilizer Value and Greenhouse Gas Emissions from Solid Fraction Pig Slurry Compost Pellets. J. Agric. Sci. 2017, 155, 1646–1658. [Google Scholar] [CrossRef]
  42. Association of Official Analytical Chemists. Official Methods of Analysis, 15th ed.; Association of Official Analytical Chemists: Washington, DC, USA, 1990. [Google Scholar]
  43. Santos, A.; Bustamante, M.A.; Tortosa, G.; Moral, R.; Bernal, M.P. Gaseous Emissions and Process Development during Composting of Pig Slurry: The Influence of the Proportion of Cotton Gin Waste. J. Clean. Prod. 2016, 112, 81–90. [Google Scholar] [CrossRef]
  44. ANPA. Metodi Di Analisi Del Compost; ANPA: Rome, Italy, 2001; ISBN 88-448-0258-9. [Google Scholar]
  45. de Bertoldi, M.; Vallini, G.; Pera, A. The Biology of Composting: A Review. Waste Manag. Res. 1983, 1, 157–176. [Google Scholar] [CrossRef]
  46. Liu, K.; Price, G.W. Evaluation of Three Composting Systems for the Management of Spent Coffee Grounds. Bioresour. Technol. 2011, 102, 7966–7974. [Google Scholar] [CrossRef]
  47. Arrigoni, J.P.; Paladino, G.; Garibaldi, L.A.; Laos, F. Inside the Small-Scale Composting of Kitchen and Garden Wastes: Thermal Performance and Stratification Effect in Vertical Compost Bins. Waste Manag. 2018, 76, 284–293. [Google Scholar] [CrossRef]
  48. Luo, W.; Chen, T.B.; Zheng, G.D.; Gao, D.; Zhang, Y.A.; Gao, W. Effect of Moisture Adjustments on Vertical Temperature Distribution during Forced-Aeration Static-Pile Composting of Sewage Sludge. Resour. Conserv. Recycl. 2008, 52, 635–642. [Google Scholar] [CrossRef]
  49. Isobaev, P.; McCartney, D.; Wichuk, K.M.; Scott, C.; Neumann, N.F. An Enhanced Direct Process Temperature Validation Framework in Composting: Case Study of a Full-Scale Covered Aerated Static Pile. Compost Sci. Util. 2014, 22, 164–178. [Google Scholar] [CrossRef]
  50. Khalib, S.N.B.; Zakarya, I.A.; Izhar, T.N.T. The Effect of Low Initial C:N Ratio during Composting of Rice Straw Ash with Food Waste in Evaluating the Compost Quality. IOP Conf. Ser. Earth Environ. Sci. 2020, 476, 012144. [Google Scholar] [CrossRef]
  51. Zhu, N. Composting of High Moisture Content Swine Manure with Corncob in a Pilot-Scale Aerated Static Bin System. Bioresour. Technol. 2006, 97, 1870–1875. [Google Scholar] [CrossRef] [PubMed]
  52. Stentiford, E.I. Composting Control: Principles and Practice. In The Science of Composting; De Bertoldi, M., Sequi, P., Lemmes, B., Papi, T., Eds.; Springer: Dordrecht, The Netherlands, 1996; pp. 49–59. [Google Scholar] [CrossRef]
  53. Tang, J.C.; Shibata, A.; Zhou, Q.; Katayama, A. Effect of Temperature on Reaction Rate and Microbial Community in Composting of Cattle Manure with Rice Straw. J. Biosci. Bioeng. 2007, 104, 321–328. [Google Scholar] [CrossRef] [PubMed]
  54. Guo, R.; Li, G.; Jiang, T.; Schuchardt, F.; Chen, T.; Zhao, Y.; Shen, Y. Effect of Aeration Rate, C/N Ratio and Moisture Content on the Stability and Maturity of Compost. Bioresour. Technol. 2012, 112, 171–178. [Google Scholar] [CrossRef]
  55. Vázquez, M.A.; De La Varga, D.; Plana, R.; Soto, M. Integrating Liquid Fraction of Pig Manure in the Composting Process for Nutrient Recovery and Water Re-Use. J. Clean. Prod. 2015, 104, 80–89. [Google Scholar] [CrossRef]
  56. Chen, X.; Liu, R.; Hao, J.; Li, D.; Wei, Z.; Teng, R.; Sun, B. Protein and Carbohydrate Drive Microbial Responses in Diverse Ways during Different Animal Manures Composting. Bioresour. Technol. 2019, 271, 482–486. [Google Scholar] [CrossRef]
  57. Pan, I.; Dam, B.; Sen, S.K. Composting of Common Organic Wastes Using Microbial Inoculants. 3 Biotech 2012, 2, 127–134. [Google Scholar] [CrossRef]
  58. Wan, J.; Wang, X.; Yang, T.; Wei, Z.; Banerjee, S.; Friman, V.-P.; Mei, X.; Xu, Y.; Shen, Q. Livestock Manure Type Affects Microbial Community Composition and Assembly During Composting. Front. Microbiol. 2021, 12, 621126. [Google Scholar] [CrossRef]
  59. Doublet, J.; Francou, C.; Poitrenaud, M.; Houot, S. Sewage Sludge Composting: Influence of Initial Mixtures on Organic Matter Evolution and N Availability in the Final Composts. Waste Manag. 2010, 30, 1922–1930. [Google Scholar] [CrossRef] [PubMed]
  60. Getahun, T.; Nigusie, A.; Entele, T.; Van Gerven, T.; Van Der Bruggen, B. Effect of Turning Frequencies on Composting Biodegradable Municipal Solid Waste Quality. Resour. Conserv. Recycl. 2012, 65, 79–84. [Google Scholar] [CrossRef]
  61. Ahmed, M.; Idris, A.; Omar, S.R.S. Physicochemical Characterization of Compost of the Industrial Tannery Sludge. J. Eng. Sci. Technol. 2007, 2, 81–94. [Google Scholar]
  62. Ros, M.; García, C.; Hernández, T. A Full-Scale Study of Treatment of Pig Slurry by Composting: Kinetic Changes in Chemical and Microbial Properties. Waste Manag. 2006, 26, 1108–1118. [Google Scholar] [CrossRef] [PubMed]
  63. Bernal, M.P.; Navarro, A.F.; Roig, A.; Cegarra, J.; Garcìa, D. Carbon and Nitrogen Transformation during Composting of Sweet Sorghum Bagasse. Biol. Fertil. Soils 1996, 22, 141–148. [Google Scholar] [CrossRef]
  64. Huang, G.F.; Fang, M.; Wu, Q.T.; Zhou, L.X.; Liao, X.D.; Wong, J.W.C. Co-Compositing of Pig Manure with Leaves. Environ. Technol. 2001, 22, 1203–1212. [Google Scholar] [CrossRef]
  65. Sánchez-Monedero, M.A.; Roig, A.; Paredes, C.; Bernal, M.P. Nitrogen Transformation during Organic Waste Composting by the Rutgers System and Its Effects on PH, EC and Maturity of the Composting Mixtures. Bioresour. Technol. 2001, 78, 301–308. [Google Scholar] [CrossRef]
  66. Brito, L.M.; Coutinho, J.; Smith, S.R. Methods to Improve the Composting Process of the Solid Fraction of Dairy Cattle Slurry. Bioresour. Technol. 2008, 99, 8955–8960. [Google Scholar] [CrossRef]
  67. Huang, G.F.; Wong, J.W.C.; Wu, Q.T.; Nagar, B.B. Effect of C/N on Composting of Pig Manure with Sawdust. Waste Manag. 2004, 24, 805–813. [Google Scholar] [CrossRef]
  68. Abdoli, M.A.; Omrani, G.; Safa, M.; Samavat, S. Comparison between Aerated Static Piles and Vermicomposting in Producing Co-Compost from Rural Organic Wastes and Cow Manure. Int. J. Environ. Sci. Technol. 2019, 16, 1551–1562. [Google Scholar] [CrossRef]
  69. Paradelo, R.; Prieto, B.; Sandu, R.G.; Barral, M.T.; Moldes, A.B. Can Stability and Maturity Be Evaluated in Finished Composts from Different Sources? Compost Sci. Util. 2010, 18, 22–31. [Google Scholar] [CrossRef]
  70. Huang, D.; Gao, L.; Cheng, M.; Yan, M.; Zhang, G.; Chen, S.; Du, L.; Wang, G.; Li, R.; Tao, J.; et al. Carbon and N Conservation during Composting: A Review. Sci. Total Environ. 2022, 840, 156355. [Google Scholar] [CrossRef] [PubMed]
  71. Assandri, D.; Bianco, A.; Pampuro, N.; Cavallo, E.; Zara, G.; Bardi, L.; Coronas, R.; Budroni, M. Enhancing Fertilizer Effect of Bioprocessed Brewers’ Spent Grain by Microbial Consortium Addition. Agronomy 2023, 13, 2654. [Google Scholar] [CrossRef]
  72. Bianco, A.; Melito, S.; Garau, M.; Giannini, V.; Zara, G.; Assandri, D.; Oufensou, S.; Coronas, R.; Pampuro, N.; Budroni, M. The Potential Use of Brewers’ Spent Grain-Based Substrates as Horticultural Bio-Fertilizers. Front. Sustain. Food Syst. 2024, 8, 1404914. [Google Scholar] [CrossRef]
  73. Montemurro, F.; Ciaccia, C.; Leogrande, R.; Ceglie, F.; Diacono, M. Suitability of Different Organic Amendments from Agro-Industrial Wastes in Organic Lettuce Crops. Nutr. Cycl. Agroecosyst. 2015, 102, 243–252. [Google Scholar] [CrossRef]
  74. Agapios, A.; Andreas, V.; Marinos, S.; Katerina, M.; Antonis, Z.A. Waste Aroma Profile in the Framework of Food Waste Management through Household Composting. J. Clean. Prod. 2020, 257, 120340. [Google Scholar] [CrossRef]
  75. Antil, R.S.; Raj, D.; Abdalla, N.; Inubushi, K. Physical, Chemical and Biological Parameters for Compost Maturity Assessment: A Review. In Composting for Sustainable Agriculture; Springer: Cham, Switzerland, 2014; pp. 83–101. ISBN 9783319080048. [Google Scholar]
  76. Rastogi, M.; Nandal, M.; Khosla, B. Microbes as Vital Additives for Solid Waste Composting. Heliyon 2020, 6, e03343. [Google Scholar] [CrossRef]
  77. Bignami, C.; Reyes, F.; Saccaggi, M.; Pane, C.; Zaccardelli, M.; Ronga, D. Composts from Grapevine and Hazelnut By-Products: A Sustainable Peat Partial Replacement for the Growth of Micropropagated Hazelnut and Raspberry in Containers. Horticulturae 2023, 9, 481. [Google Scholar] [CrossRef]
  78. Sánchez-Monedero, M.A.; Roig, A.; Cegarra, J.; Bernal, M.P.; Noguera, P.; Abad, M.; Antón, A. Composts as Media Constituents for Vegetable Transplant Production. Compost Sci. Util. 2004, 12, 161–168. [Google Scholar] [CrossRef]
  79. Ko, H.J.; Kim, K.Y.; Kim, H.T.; Kim, C.N.; Umeda, M. Evaluation of Maturity Parameters and Heavy Metal Contents in Composts Made from Animal Manure. Waste Manag. 2008, 28, 813–820. [Google Scholar] [CrossRef]
  80. Hwang, H.Y.; Kim, S.H.; Shim, J.; Park, S.J. Composting Process and Gas Emissions during Food Waste Composting under the Effect of Different Additives. Sustainability 2020, 12, 7811. [Google Scholar] [CrossRef]
  81. Chiumenti, A.; Da Borso, F.; Rodar, T.; Chiumenti, R. Swine Manure Composting by Means of Experimental Turning Equipment. Waste Manag. 2007, 27, 1774–1782. [Google Scholar] [CrossRef] [PubMed]
  82. Altieri, R.; Esposito, A.; Nair, T. Novel Static Composting Method for Bioremediation of Olive Mill Waste. Int. Biodeterior. Biodegrad. 2011, 65, 786–789. [Google Scholar] [CrossRef]
  83. Hobson, A.M.; Frederickson, J.; Dise, N.B. CH4 and N2O from Mechanically Turned Windrow and Vermicomposting Systems Following In-Vessel Pre-Treatment. Waste Manag. 2005, 25, 345–352. [Google Scholar] [CrossRef]
  84. Sánchez, A.; Artola, A.; Font, X.; Gea, T.; Barrena, R.; Gabriel, D.; Sánchez-Monedero, M.Á.; Roig, A.; Cayuela, M.L.; Mondini, C. Greenhouse Gas Emissions from Organic Waste Composting. Environ. Chem. Lett. 2015, 13, 223–238. [Google Scholar] [CrossRef]
  85. Nordahl, S.L.; Preble, C.V.; Kirchstetter, T.W.; Scown, C.D. Greenhouse Gas and Air Pollutant Emissions from Composting. Environ. Sci. Technol. 2023, 57, 2235–2247. [Google Scholar] [CrossRef]
  86. Szanto, G.L.; Hamelers, H.V.M.; Rulkens, W.H.; Veeken, A.H.M. NH3, N2O and CH4 Emissions during Passively Aerated Composting of Straw-Rich Pig Manure. Bioresour. Technol. 2007, 98, 2659–2670. [Google Scholar] [CrossRef]
  87. Ermolaev, E.; Pell, M.; Smårs, S.; Sundberg, C.; Jönsson, H. Greenhouse Gas Emission from Covered Windrow Composting with Controlled Ventilation. Waste Manag. Res. 2012, 30, 155–160. [Google Scholar] [CrossRef]
  88. Fukumoto, Y.; Osada, T.; Hanajima, D.; Haga, K. Patterns and Quantities of NH3, N2O and CH4 Emissions during Swine Manure Composting without Forced Aeration––Effect of Compost Pile Scale. Bioresour. Technol. 2003, 89, 109–114. [Google Scholar] [CrossRef]
  89. Ba, S.; Qu, Q.; Zhang, K.; Groot, J.C.J. Meta-Analysis of Greenhouse Gas and Ammonia Emissions from Dairy Manure Composting. Biosyst. Eng. 2020, 193, 126–137. [Google Scholar] [CrossRef]
  90. Alvarez, R.; Lidén, G. Low Temperature Anaerobic Digestion of Mixtures of Llama, Cow and Sheep Manure for Improved Methane Production. Biomass Bioenergy 2009, 33, 527–533. [Google Scholar] [CrossRef]
  91. Yang, F.; Li, G.X.; Yang, Q.Y.; Luo, W.H. Effect of Bulking Agents on Maturity and Gaseous Emissions during Kitchen Waste Composting. Chemosphere 2013, 93, 1393–1399. [Google Scholar] [CrossRef] [PubMed]
  92. Cáceres, R.; Malińska, K.; Marfà, O. Nitrification within Composting: A Review. Waste Manag. 2018, 72, 119–137. [Google Scholar] [CrossRef] [PubMed]
  93. Posmanik, R.; Gross, A.; Nejidat, A. Effect of High Ammonia Loads Emitted from Poultry-Manure Digestion on Nitrification Activity and Nitrifier-Community Structure in a Compost Biofilter. Ecol. Eng. 2014, 62, 140–147. [Google Scholar] [CrossRef]
  94. Manu, M.K.; Li, D.; Luo, L.; Zhao, J.; Varjani, S.; Wong, J.W.C. A Review on Nitrogen Dynamics and Mitigation Strategies of Food Waste Digestate Composting. Bioresour. Technol. 2021, 334, 125032. [Google Scholar] [CrossRef]
  95. Wrage-Mönnig, N.; Horn, M.A.; Well, R.; Müller, C.; Velthof, G.; Oenema, O. The Role of Nitrifier Denitrification in the Production of Nitrous Oxide Revisited. Soil Biol. Biochem. 2018, 123, A3–A16. [Google Scholar] [CrossRef]
  96. Hwang, S.; Hanaki, K. Effects of Oxygen Concentration and Moisture Content of Refuse on Nitrification, Denitrification and Nitrous Oxide Production. Bioresour. Technol. 2000, 71, 159–165. [Google Scholar] [CrossRef]
  97. Amlinger, F.; Peyr, S.; Cuhls, C. Green House Gas Emissions from Composting and Mechanical Biological Treatment. Waste Manag. Res. 2008, 26, 47–60. [Google Scholar] [CrossRef]
  98. He, Y.; Inamori, Y.; Mizuochi, M.; Kong, H.; Iwami, N.; Sun, T. Measurements of N2O and CH4 from the Aerated Composting of Food Waste. Sci. Total Environ. 2000, 254, 65–74. [Google Scholar] [CrossRef]
  99. Beck-Friis, B.; Pell, M.; Sonesson, U.; Jönsson, H.; Kirchmann, H. Formation and Emission of N2O and CH4 from Compost Heaps of Organic Household Waste. Environ. Monit. Assess. 2000, 62, 317–331. [Google Scholar] [CrossRef]
  100. El Kader, N.A.; Robin, P.; Paillat, J.M.; Leterme, P. Turning, Compacting and the Addition of Water as Factors Affecting Gaseous Emissions in Farm Manure Composting. Bioresour. Technol. 2007, 98, 2619–2628. [Google Scholar] [CrossRef] [PubMed]
  101. Jiang, T.; Schuchardt, F.; Li, G.; Guo, R.; Zhao, Y. Effect of C/N Ratio, Aeration Rate and Moisture Content on Ammonia and Greenhouse Gas Emission during the Composting. J. Environ. Sci. 2011, 23, 1754–1760. [Google Scholar] [CrossRef] [PubMed]
  102. Williams, S.R.; Zhu-Barker, X.; Lew, S.; Croze, B.J.; Fallan, K.R.; Horwath, W.R. Impact of Composting Food Waste with Green Waste on Greenhouse Gas Emissions from Compost Windrows. Compost Sci. Util. 2019, 27, 35–45. [Google Scholar] [CrossRef]
  103. Cayuela, M.L.; Sánchez-Monedero, M.A.; Roig, A.; Sinicco, T.; Mondini, C. Biochemical Changes and GHG Emissions during Composting of Lignocellulosic Residues with Different N-Rich by-Products. Chemosphere 2012, 88, 196–203. [Google Scholar] [CrossRef]
  104. Onwosi, C.O.; Igbokwe, V.C.; Odimba, J.N.; Eke, I.E.; Nwankwoala, M.O.; Iroh, I.N.; Ezeogu, L.I. Composting Technology in Waste Stabilization: On the Methods, Challenges and Future Prospects. J. Environ. Manag. 2017, 190, 140–157. [Google Scholar] [CrossRef]
  105. Wunderlin, P.; Mohn, J.; Joss, A.; Emmenegger, L.; Siegrist, H. Mechanisms of N2O Production in Biological Wastewater Treatment under Nitrifying and Denitrifying Conditions. Water Res. 2012, 46, 1027–1037. [Google Scholar] [CrossRef]
  106. Zhang, L.; Sun, X. Changes in Physical, Chemical, and Microbiological Properties during the Two-Stage Co-Composting of Green Waste with Spent Mushroom Compost and Biochar. Bioresour. Technol. 2014, 171, 274–284. [Google Scholar] [CrossRef]
  107. Andersen, J.K.; Boldrin, A.; Samuelsson, J.; Christensen, T.H.; Scheutz, C. Quantification of Greenhouse Gas Emissions from Windrow Composting of Garden Waste. J. Environ. Qual. 2010, 39, 713–724. [Google Scholar] [CrossRef]
  108. Christensen, T.H.; Gentil, E.; Boldrin, A.; Larsen, A.W.; Weidema, B.P.; Hauschild, M. C Balance, Carbon Dioxide Emissions and Global Warming Potentials in LCA-Modelling of Waste Management Systems. Waste Manag. Res. 2009, 27, 707–715. [Google Scholar] [CrossRef]
Figure 1. Detail of the modified lid (internal part) of the bin.
Agronomy 15 00771 g001
Figure 2. Detail of the lid during the gas sampling event.
Agronomy 15 00771 g002
Figure 3. Ambient air temperature (dashed line) and compost temperature trends of both mixtures under two strategies: manual turning (MT—red line) and static composting (ST—blue line). Red arrows represent the turning events in manual turning composting on days 5, 12, 17, 21, 26, 33, and 46. The temperatures were measured once per hour, and the reported value is the daily mean. (a) Temperature trends for MIX1 (mixture composition: brewers’ spent grains (BSG), wheat straw, and pig slurry solid fraction). (b) Temperature trends for MIX2 (mixture composition: brewers’ spent grains (BSG), wheat straw, and sheep manure).
Agronomy 15 00771 g003
Figure 4. Trends of daily average CO2 emission fluxes. Three replicates for each condition. The bars indicate the standard deviation, and values below 10 mg C kg−1 d−1 are not visible. In the MT system, the red arrows represent the turning events in manual turning composting on days 5, 12, 17, 21, 26, 33, and 46.
Agronomy 15 00771 g004
Figure 5. Trends of daily average CH4 emission fluxes. Three replicates for condition. The bars indicate the standard deviation, and values below 0.0003 mg C kg−1 d−1 are not visible. In the MT system, the red arrows represent the turning events in manual turning composting on days 5, 12, 17, 21, 26, 33, and 46.
Agronomy 15 00771 g005
Figure 6. Trends of daily average N2O emission fluxes. The bars indicate the standard deviation, and values below 0.3 mg C kg−1 d−1 are not visible. In the MT system, the red arrows represent the turning events in manual turning composting on days 5, 12, 17, 21, 26, 33, and 46.
Agronomy 15 00771 g006
Figure 7. Trend of cumulative emissions of carbon as CO2 (a) and CH4 (b) and nitrogen as N2O (c) during the composting process. The number of replicates is three. The standard deviation bars are not visible because of the low SD.
Agronomy 15 00771 g007
Table 1. Physicochemical characteristics of the initial mixtures. Mean values and standard deviations of three replicates.
CompostMoisture *pHTOCOMTKNNH4+-NNO3-NC/N
% g kg−1%%mg kg−1mg kg−1
MIX173.2 ± 1.07 a8.3 ± 0.06 b515 ± 0.23 a88.6 ± 0.29 a2.8 ± 0.11 a1091 ± 5.03 b74 ± 1.66 b18.2 ± 0.78 a
MIX273.0 ± 1.52 a8.7 ± 0.12 a488 ± 2.06 a85.8 ± 0.58 b2.6 ± 0.09 b1623 ± 4.07 a103 ± 6.24 a19.1 ± 0.15 a
TOC: total organic carbon; OM: organic matter; TKN: total Kjeldahl nitrogen; NH4+-N: ammoniacal nitrogen; NO3-N: nitrate nitrogen; C/N: TOC to TKN ratio. * Calculated based on fresh weight. a,b Different letters represent significant differences between physicochemical characteristics between mixtures. Significant differences were determined by ANOVA and the Bonferroni post hoc test (p = 0.05).
Table 2. Physicochemical properties evolution during the composting process. Mean values and standard deviations (SD) of 3 replicates.
TreatmentDayMoisture * (%)pHTOC (g kg−1)OM (%)OM Loss ** (%)TKN (%)NH4+-N (mg kg−1)NO3-N (mg kg−1)C/N
MIX1-MT1373.6 ± 1.57 a8.1 ± 0.15 b497 ± 1.7 ab85.8 ± 0.30 ab22.2 ± 0.55 ab3.0 ± 0.02 a706 ± 9.90 c75 ± 1.09 b16.6 ± 0.04 bc
4670.5 ± 0.87 a6.4 ± 0.00 c465 ± 0.4 a80.2 ± 0.08 c47.6 ± 1.56 a3.5 ± 0.06 a471 ± 2.91 c100 ± 1.11 c13.2 ± 0.21 d
7467.4 ± 0.29 a6.1 ± 0.00 b457 ± 3.9 a78.8 ± 0.65 a52.0 ± 0.64 a3.8 ± 0.11 a380 ± 6.81 b460 ± 9.15 c12.2 ± 0.44 b
10440.6 ± 0.63 b6.2 ± 0.06 c424 ± 1.3 b76.9 ± 0.67 ab56.9 ± 1.73 a3.7 ± 0.10 a187 ± 3.92 a490 ± 3.05 bc11.6 ± 0.29 c
MIX2-MT1375.6 ± 2.04 a8.7 ± 0.00 a488 ± 4.0 b84.1 ± 0.68 b12.1 ± 1.10 ab2.7 ± 0.15 b728 ± 2.08 b108 ± 6.24 a18.1 ± 0.96 b
4645.2 ± 2.52 b9.0 ± 0.06 a471 ± 1.3 a81.1 ± 0.22 b28.7 ± 4.39 c3.0 ± 0.06 c684 ± 3.76 b155 ± 1.51 ab15.5 ± 0.29 b
7437.0 ± 1.37 b8.8 ± 0.44 a445 ± 4.2 a76.8 ± 0.73 a45.3 ± 0.46 a3.2 ± 0.03 b363 ± 6.73 b503 ± 1.97 c14.0 ± 0.15 a
10418.4 ± 0.73 d9.4 ± 0.00 a425 ± 9.5 b73.6 ± 1.61 b53.9 ± 1.64 ab3.1 ± 0.13 b281 ± 7.70 b560 ± 1.73 a13.9 ± 0.28 b
MIX1-ST1374.8 ± 0.57 a8.5 ± 0.12 a509 ± 3.7 a88.0 ± 0.81 a4.7 ± 9.22 b3.1 ± 0.06 a834 ± 1.40 ab79 ± 8.54 b16.4 ± 0.41 c
4671.2 ± 0.04 a6.5 ± 0.06 c475 ± 0.9 a82.0 ± 0.08 a41.2 ± 1.47 ab3.3 ± 0.03 b820 ± 6.76 a114 ± 1.73 c14.3 ± 0.11 c
7468.6 ± 3.14 a6.1 ± 0.06 b456 ± 11.3 a79.1 ± 1.79 a50.8 ± 6.75 a3.7 ± 0.10 a328 ± 6.73 c572 ± 1.21 b12.5 ± 0.67 ab
10446.0 ± 1.76 a6.0 ± 0.12 c449 ± 0.3 a77.4 ± 0.05 a55.7 ± 1.37 a3.5 ± 0.17 a247 ± 3.00 a836 ± 9.64 c12.9 ± 0.64 bc
MIX2-ST1358.4 ± 3.97 b8.7 ± 0.12 a486 ± 8.8 b81.1 ± 1.30 c28.3 ± 9.41 a2.6 ± 0.11 b1418 ± 3.00 a105 ± 5.29 ab18.6 ± 0.50 a
4655.2 ± 1.37 ab8.8 ± 0.10 b470 ± 7.6 a79.2 ± 0.36 d37.0 ± 1.65 b2.8 ± 0.06 d587 ± 1.02 ab179 ± 9.17 a16.9 ± 0.61 a
7443.2 ± 7.68 b8.4 ± 0.32 a459 ± 2.1 a78.0 ± 8.96 a37.0 ± 2.29 b3.4 ± 0.22 ab490 ± 9.41 a627 ± 1.11 a13.4 ± 0.80 ab
10426.6 ± 0.86 c9.0 ± 0.00 b451 ± 11.5 a77.7 ± 1.98 a41.7 ± 9.41 b2.9 ± 0.04 b408 ± 5.03 a931 ± 9.85 ab15.5 ± 0.21 a
* Calculated based on fresh weight. ** Calculated according to Equation (1) a–d Different letters in the same column represent significant differences between days of analysis. Significant differences were determined by ANOVA and Bonferroni post hoc test (p = 0.05).
Table 3. (a) Cumulative emissions of carbon dioxide (CO2-C), methane (CH4-C), and nitrous oxide (N2O-N) at the end of the composting process and (b) emission factors (%). The reported values are means and standard deviations (SD) of the three replicates (n = 3) of each condition.
GHGUnitMIX1-MTMIX2-MTMIX1-STMIX2-ST
(a) Cumulative gas emissions
CO2-Cmg C kg−1 FM34,275 ± 27.0 a31,024 ± 62.8 b28,769 ± 10.9 c31,219 ± 24.6 b
CH4-Cmg C kg−1 FM0.014 ± 0.00 c0.070 ± 0.00 b0.004 ± 0.00 d0.086 ± 0.00 a
N2O-Nmg N kg−1 FM168 ± 8.0 b7 ± 0.1 d231 ± 14.6 a36 ± 1.9 c
(b) Emission factor *
CO2-C(%)3.87 ± 0.04 a3.62 ± 0.03 b3.25 ± 0.01 c3.64 ± 0.03 b
CH4-C(%)(0.16 ± 0.01 c) 10−7(0.82 ± 0.02 b) 10−7(0.05 ± 0.02 d) 10−71.00 ± 0.03 a
N2O-N(%)0.595 ± 0.035 b0.026 ± 0.001 d0.816 ± 0.025 a0.142 ± 0.003 c
FM: fresh matter. * Calculated as % from initial OM content for CO2 and CH4 and from TKN content for N2O. a–d Different letters represent significant differences between conditions for each gas. Significant differences were determined by ANOVA and the Bonferroni post hoc test (p = 0.05).
Table 4. Global warming potentials (GWP, mg CO2 eq kg−1 FM) of the gasses emitted during the composting process. The reported values are means and standard deviations (SD) of the three replicates (n = 3) of each condition.
GWPUnitMIX1-MTMIX2-MTMIX1-STMIX2-ST
CH4mg CO2 eq kg−1 FM0.38 ± 0.0 c1.90 ± 0.0 b0.12 ± 0.0 d2.32 ± 0.1 a
N2Omg CO2 eq kg−1 FM45,815 ± 211 b1784 ± 15.7 d62,950 ± 386 a9875 ± 50.5 c
TOTmg CO2 eq kg−1 FM45,816 ± 211 b1786 ± 15.7 d62,950 ± 386 a9877 ± 50.5 c
FM: fresh matter. a–d Different letters represent significant differences between conditions. Significant differences were determined by ANOVA and the Bonferroni post hoc test (p = 0.05).
Disclaimer/Publisher’s Note: The statements, opinions and data contained in all publications are solely those of the individual author(s) and contributor(s) and not of MDPI and/or the editor(s). MDPI and/or the editor(s) disclaim responsibility for any injury to people or property resulting from any ideas, methods, instructions or products referred to in the content.

