Article

Effects of Nitrogen Fertilizer Spraying Time on Source–Sink Nitrogen Metabolism and Seed Oil Quality of Paeonia ostii ‘Fengdan’

College of Agriculture, Henan University of Science and Technology, Luoyang 471023, China
*
Author to whom correspondence should be addressed.
Agronomy 2025, 15(4), 892; https://doi.org/10.3390/agronomy15040892
Submission received: 2 March 2025 / Revised: 28 March 2025 / Accepted: 1 April 2025 / Published: 3 April 2025
(This article belongs to the Section Soil and Plant Nutrition)

Abstract

:
The spraying time of nitrogen fertilizer is a key factor to consider when fertilizing with an intelligent micro-sprinkler irrigation system. This study aims to investigate the impact of nitrogen fertilizer spraying time on the seed oil quality of tree peony, with the expectation of providing theoretical support for the application of intelligent micro-sprinkler irrigation systems in the production of tree peony. In 2022 and 2023, foliar nitrogen application was conducted on Paeonia ostii ‘Fengdan’ utilizing an intelligent micro-spray irrigation system, with four distinct nitrogen fertilizer spraying times (3:00–4:00, 7:00–8:00, 14:00–15:00, and 19:00–20:00). Based on this, the study assessed nitrogen metabolism indicators in leaves and seeds at various growth stages and the fatty acid composition of seed oil in Paeonia ostii ‘Fengdan’. The results revealed that foliar nitrogen application between 14:00 and 15:00 significantly enhanced the levels of free amino acids (FAA), nitrate reductase (NR), glutamine synthetase (GS), and glutamate synthase (GOGAT) activity in both leaves and seeds. Furthermore, the ratio of α-linolenic acid in the seed oil was significantly increased. Correlation analysis demonstrated a positive or highly significant positive correlation between the levels of nitrogen metabolism indicators and the ratio of unsaturated fatty acids. In conclusion, foliar nitrogen application between 14:00 and 15:00 significantly enhances the FAA content and the activity of nitrogen metabolism enzymes within the leaves and seeds and promotes the synthesis of unsaturated fatty acids in seed oil. This study contributes to the efficient and high-quality cultivation of tree peony.

1. Introduction

The tree peony (Paeonia suffruticosa) is a perennial, deciduous shrub classified within the Moutan section of the genus Paeonia, belonging to the Paeoniaceae family [1]. It is a general term for peonies with a seed production and oil yield rate surpassing 22%. The ‘Feng Dan’ peony (Paeonia ostii) is one of the primary peony cultivars currently utilized in China for oilseed crop cultivation [2]. As an emerging woody oil crop, tree peonies have high-quality oil, with their seed oil containing over 92% unsaturated fatty acids, particularly abundant in α-linolenic acid (≥40%), thereby conferring significant nutritional benefits [3].
As an essential macronutrient, nitrogen is one of the primary limiting factors affecting crop quality [4] and can also regulate the activity of nitrogen metabolism-related enzymes such as nitrate reductase (NR), glutamine synthetase (GS), and glutamate synthase (GOGAT) in the leaves and seeds of plants, thereby increasing the free amino acid (FAA) content in the seeds [5,6]. Nitrogen application can significantly increase the linoleic acid and linolenic acid content in rapeseed (Brassica napus) seeds [7] and can also significantly increase the oil content and fatty acid content of tobacco (Nicotiana tabacum) seeds [8]. Previous studies have shown that in peonies, nitrogen application rate significantly affects the oil component content, with the content of linoleic acid, oleic acid, and α-linolenic acid being highest at an application rate of 450 kg/ha, while the content of palmitic acid and stearic acid is highest at an application rate of 375 kg/ha [9].
Foliar nitrogen application is more conducive to plant nitrogen absorption compared to conventional soil nitrogen application [10]. However, the stomatal aperture of plants and carbon and nitrogen metabolism exhibit diurnal variations [11,12]. Nitrogen fertilizer spraying time may influence the fatty acid composition of seed oil by regulating the intensity of source–sink nitrogen metabolism. This hypothesis has not yet been sufficiently verified in tree peonies.
Using intelligent micro-sprinkler irrigation technology for foliar nitrogen application can effectively reduce the difficulty of nitrogen fertilizer application, decrease labor input, and also allow for the remote control of the nitrogen fertilizer spraying time [13,14,15]. This study investigates the effects of different nitrogen fertilizer spraying times throughout the day on the activity of nitrogen metabolism enzymes and the seed oil quality of Paeonia ostii ‘Fengdan’ to provide a theoretical basis for the high-quality and intelligent cultivation systems of the tree peony, thereby contributing to the development of the tree peony industry.

2. Materials and Methods

2.1. Experimental Site Description

The experiment was conducted in 2022 and 2023 at the experimental facility of Henan University of Science and Technology (34°33′ N, 112°16′ E). The soil pH at the experimental site was 8.45, with 0.63% organic matter, 0.75 g·kg−1 total nitrogen, 68.57 mg·kg−1 alkaline hydrolysable nitrogen, 20.74 mg·kg−1 available phosphorus, and 287.38 mg·kg−1 available potassium.

2.2. Experimental Materials and Design

The experimental materials consisted of ten-year-old Paeonia ostii ‘Fengdan’, with a planting density of 0.6 m × 0.75 m. A randomized block design was employed, establishing four nitrogen fertilizer spraying times, T1, T2, T3, and T4 (3:00–4:00, 7:00–8:00, 14:00–15:00, and 19:00–20:00). Nitrogen was applied foliarly from the leaf expansion stage to fruit maturity, with a 0.5% nitrogen solution sprayed every 15 days. Each experimental plot measured 19 m × 7 m, with a 1 m buffer zone between plots. A smart-controlled fixed micro-spray irrigation system was utilized for modular application, with the nozzle positioned 1.6 m above the ground and a flow rate of 3.02 m3·h⁻1 at a lift height of 1.5 m.

2.3. Measurement Indicators and Methods

Under conventional field management conditions, samples were collected at 30, 60, 90, and 120 days post-anthesis (DPA) of Paeonia ostii ‘Fengdan’. For each experimental treatment, five tree peony plants with consistent growth conditions were randomly selected to collect the trifoliate leaves and extract the seeds from the pods. These samples were promptly frozen in liquid nitrogen and stored at −40 °C in a refrigerator to determine the activity of nitrogen metabolism enzymes. When the surface of the pods of Paeonia ostii ‘Fengdan’ turned yellow and began to crack, thirty tree peony plants with uniform growth conditions were randomly selected for each treatment, and the seeds were collected and air-dried naturally indoors for the analysis of fatty acid composition in the seed oil.
The determination of FAA content and the activities of NR, GS, and GOGAT enzymes were conducted according to the method described by Li [16], with minor modifications. The extraction of peony seed oil was performed using the SFE-2 supercritical extraction apparatus (Applied Separations Inc., Allentown, PA, USA). A 10 g sample of ground peony seeds was measured and the extracted oil was preserved in a sealed, light-protected container at 4 °C in a refrigerator for subsequent analysis.
For the analytical procedure, 0.2 g of peony seed oil was placed in a 25 mL stoppered test tube, to which 5 mL of 0.5 mol·L−1 potassium hydroxide–methanol solution was added. The mixture was thoroughly agitated and then subjected to heating in a water bath for 30 min until complete dissolution of the oil was achieved. Following cooling, 2 mL of 5% H2SO4–methanol solution was introduced, and the mixture was incubated for 10 min in a 60 °C water bath. After cooling again, 2 mL of n-hexane was added and shaken. Subsequently, 2 mL of saturated NaCl solution was incorporated, and the mixture was allowed to stand for phase separation. The upper layer was collected and filtered, and the filtrate was analyzed for fatty acid composition using a 7890A-5975 gas chromatography-mass spectrometry system (Agilent Technologies Inc., Santa Clara, CA, USA).

2.4. Data Analysis and Processing

The experimental data were preprocessed using Microsoft Excel 2007 and analyzed using SPSS 16.0 software for one-way ANOVA, with significance assessments performed through the LSD method and Duncan’s multiple range test. Duncan’s multiple range test is a post hoc statistical procedure used to compare multiple group means after obtaining a significant result (typically p < 0.05) in one-way ANOVA. Correlation analysis and graphical representations were generated using Origin 2020.

3. Results

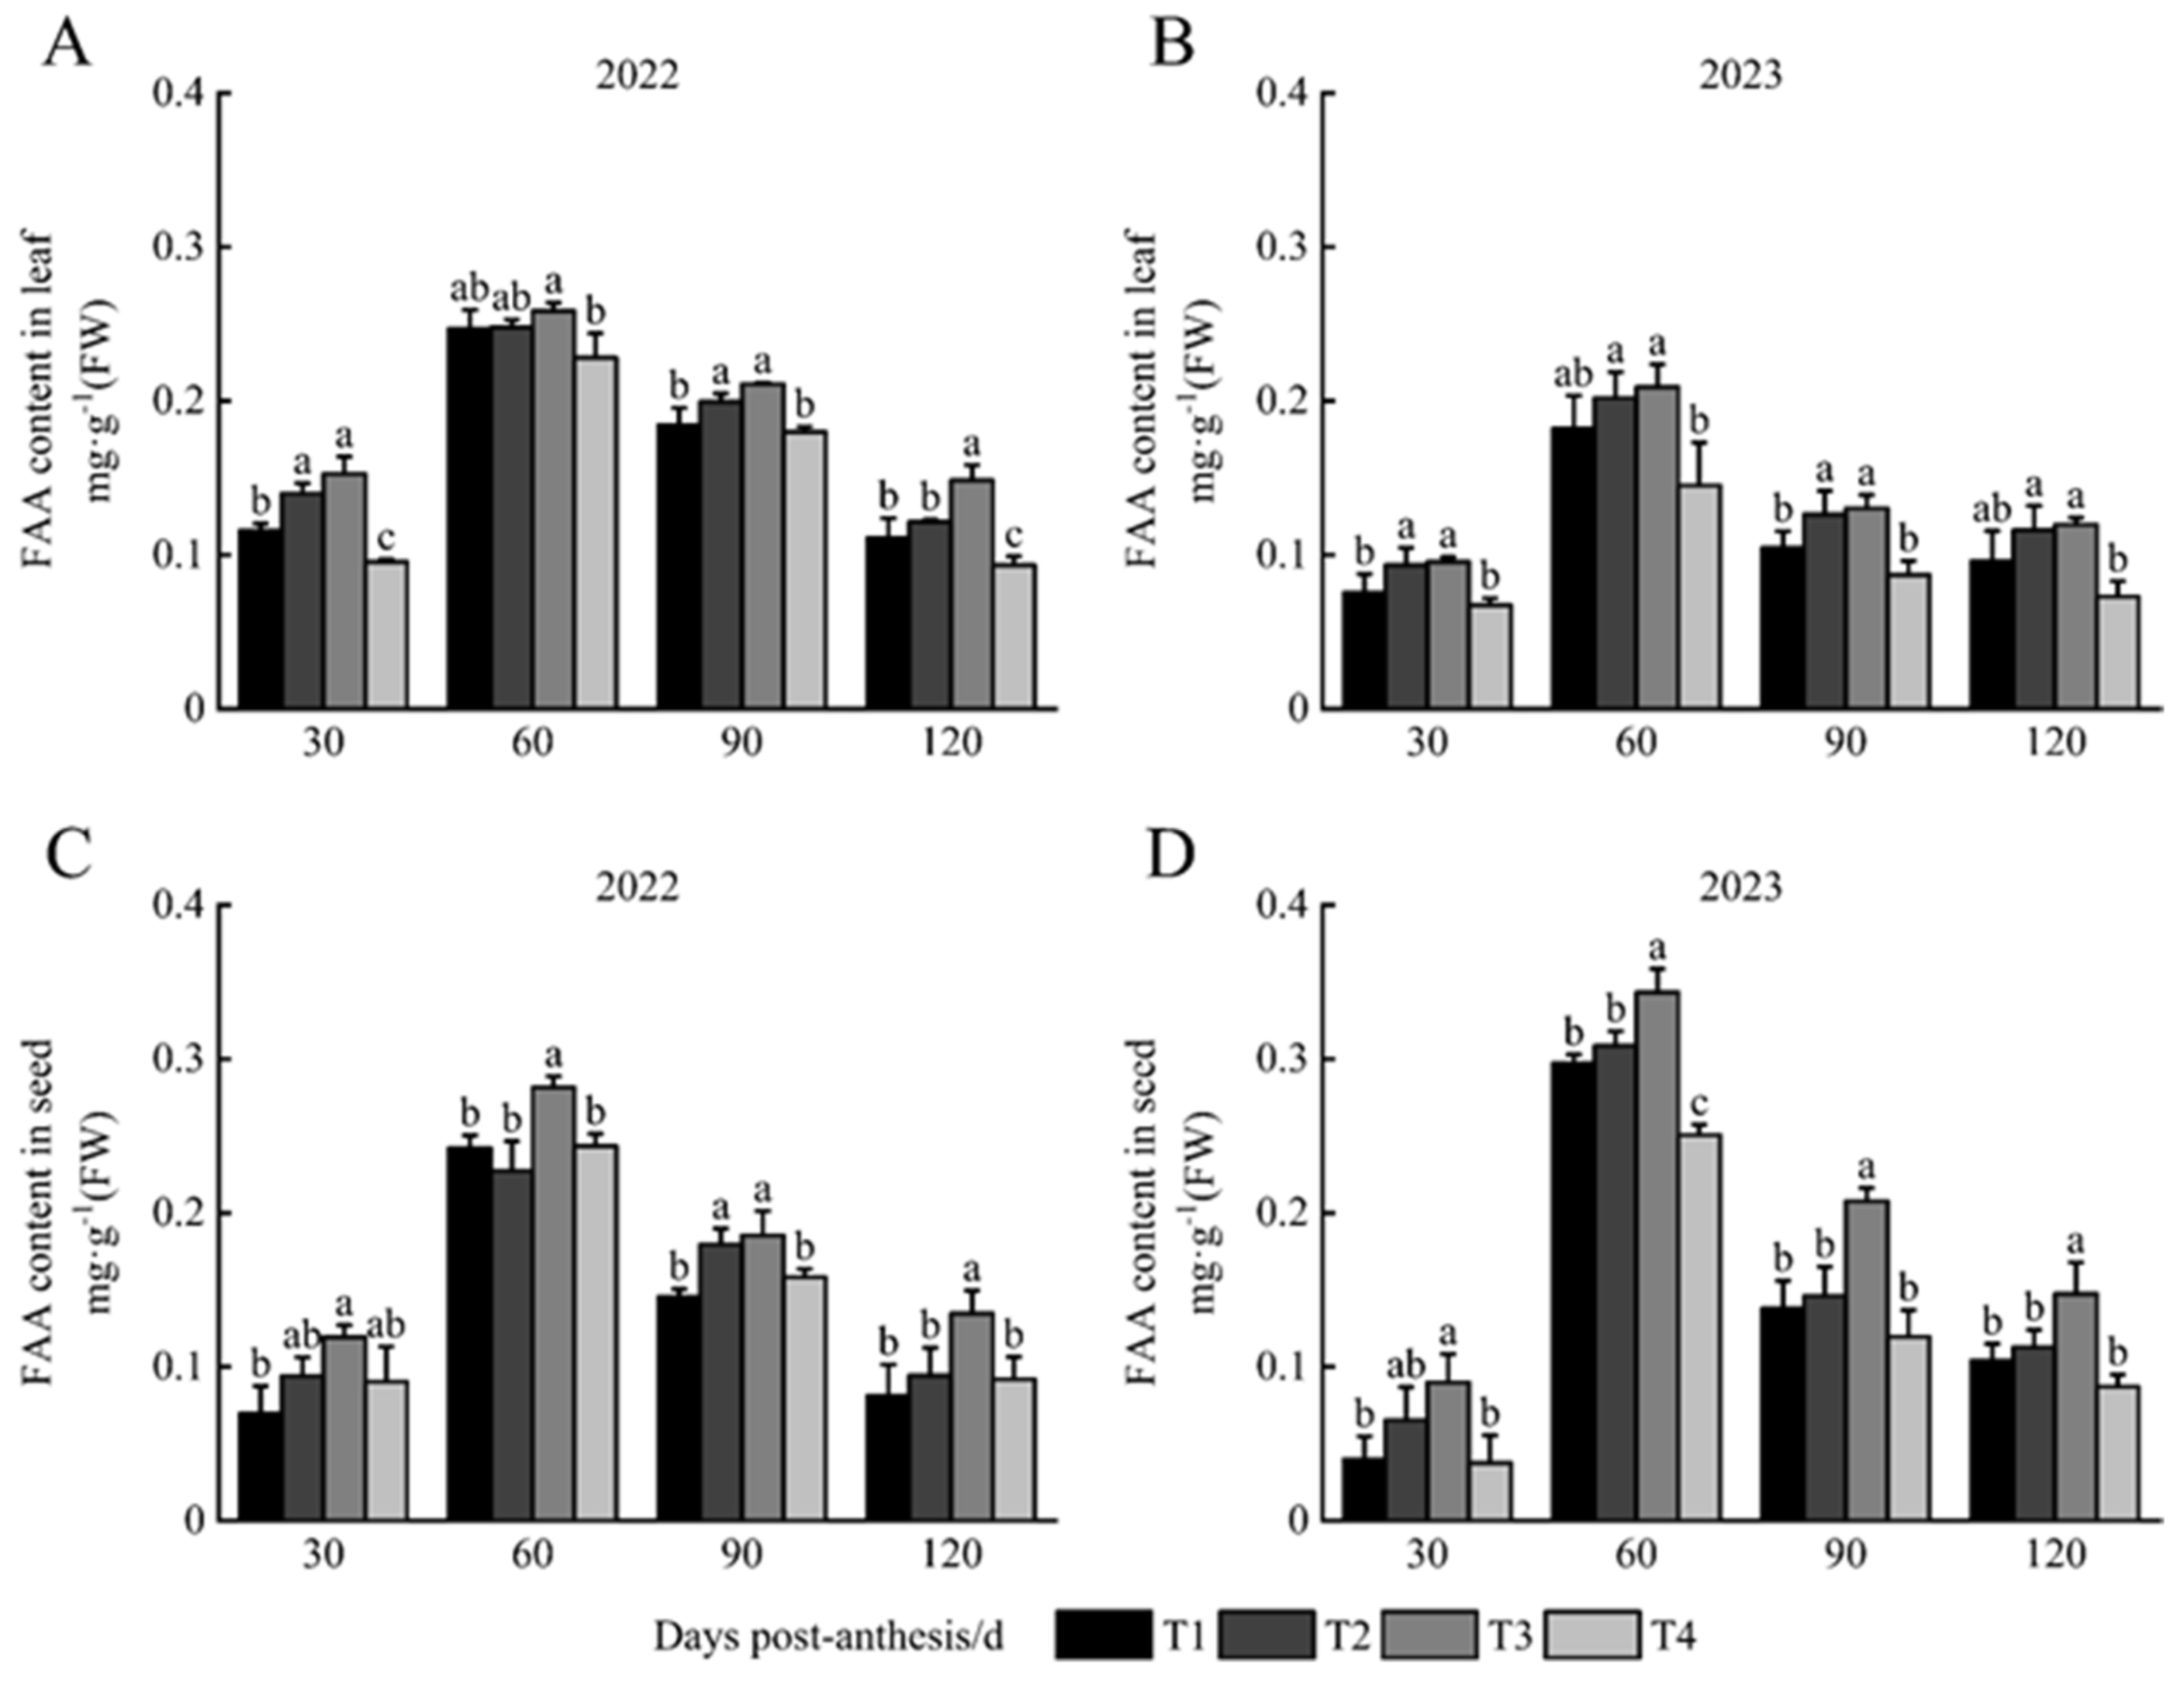
3.1. FAA Content in Leaves and Seeds

The FAA concentration in the leaves across all treatments exhibited a pattern of initial increase followed by a reduction throughout the growing stages of 2022 and 2023. Notably, a rise was observed from 30 to 60 DPA, followed by a gradual decline thereafter. The FAA content in leaves subjected to T3 over the two years consistently surpassed those of other treatments during the growth stages (Figure 1A,B). At 30 and 90 DPA in 2022, T3 demonstrated significantly higher levels than T1 and T4, with no notable difference when compared to T2. At 60 DPA, T3 was significantly elevated compared to T4, while the differences between T3 and both T1 and T2 were not statistically significant. At this juncture, the FAA concentration in T3-treated leaves was recorded at 0.26 mg·g−1, which is 1.13 times greater than that of the lowest treatment, T4. By 120 DPA, T3 levels were significantly higher than those of T1, T2, and T4 (Figure 1A). In 2023, at 30 and 90 DPA, T3 again showed significantly higher levels than T1 and T4, with no significant difference from T2. At 60 and 120 DPA, T3 maintained significantly higher levels than T4, while showing no significant difference from T1 and T2. At 60 DPA, the FAA concentration in T3-treated leaves was 0.21 mg·g−1, which is 1.44 times that of the lowest T4 at that time (Figure 1B).
The FAA concentration in the seeds across all treatments exhibited a trend of initial elevation followed by a reduction throughout the growth stages in both 2022 and 2023. In both years, the T3 treatment consistently demonstrated a higher FAA concentration in the seeds compared to the other treatments (Figure 1C,D). At 30 DPA in 2022, T3 showed a significant increase over T1, while no significant differences were observed between T2 and T4. At 60 DPA, T3 was significantly elevated compared to T1, T2, and T4, with the FAA concentration in T3 peaking at 0.28 mg·g−1, which is 1.24 times greater than the lowest value recorded for T2 at that time. By 90 DPA, T3 remained significantly higher than T1 and T4, with no significant difference noted relative to T2. At 120 DPA, T3 was significantly superior to T1, T2, and T4. The FAA concentration in T3 decreased by 34.15% and 52.15% at 90 and 120 DPA, respectively, compared to the levels recorded 60 DPA (Figure 1C). In 2023, at 30 DPA, T3 exhibited a significant increase compared to T1 and T4, with no notable difference from T2. At 60 DPA, T3 was significantly higher than T1, T2, and T4, while T1 and T2 showed no significant difference. At this stage, the FAA concentration in T3 peaked at 0.37 mg·g−1, which is 1.37 times higher than the lowest value observed in T4. After 60 days, the FAA concentration in the seeds gradually declined. At 90 and 120 DPA, T3 remained significantly higher than all other treatments, with the FAA concentration in T3 decreasing by 29.21% and 62.81%, respectively, compared to the levels at 60 DPA (Figure 1D). The results from two years of experimentation indicate that foliar nitrogen application at the T3 time is more beneficial for enhancing the FAA concentration in both the leaves and seeds of Paeonia ostii ‘Fengdan’.

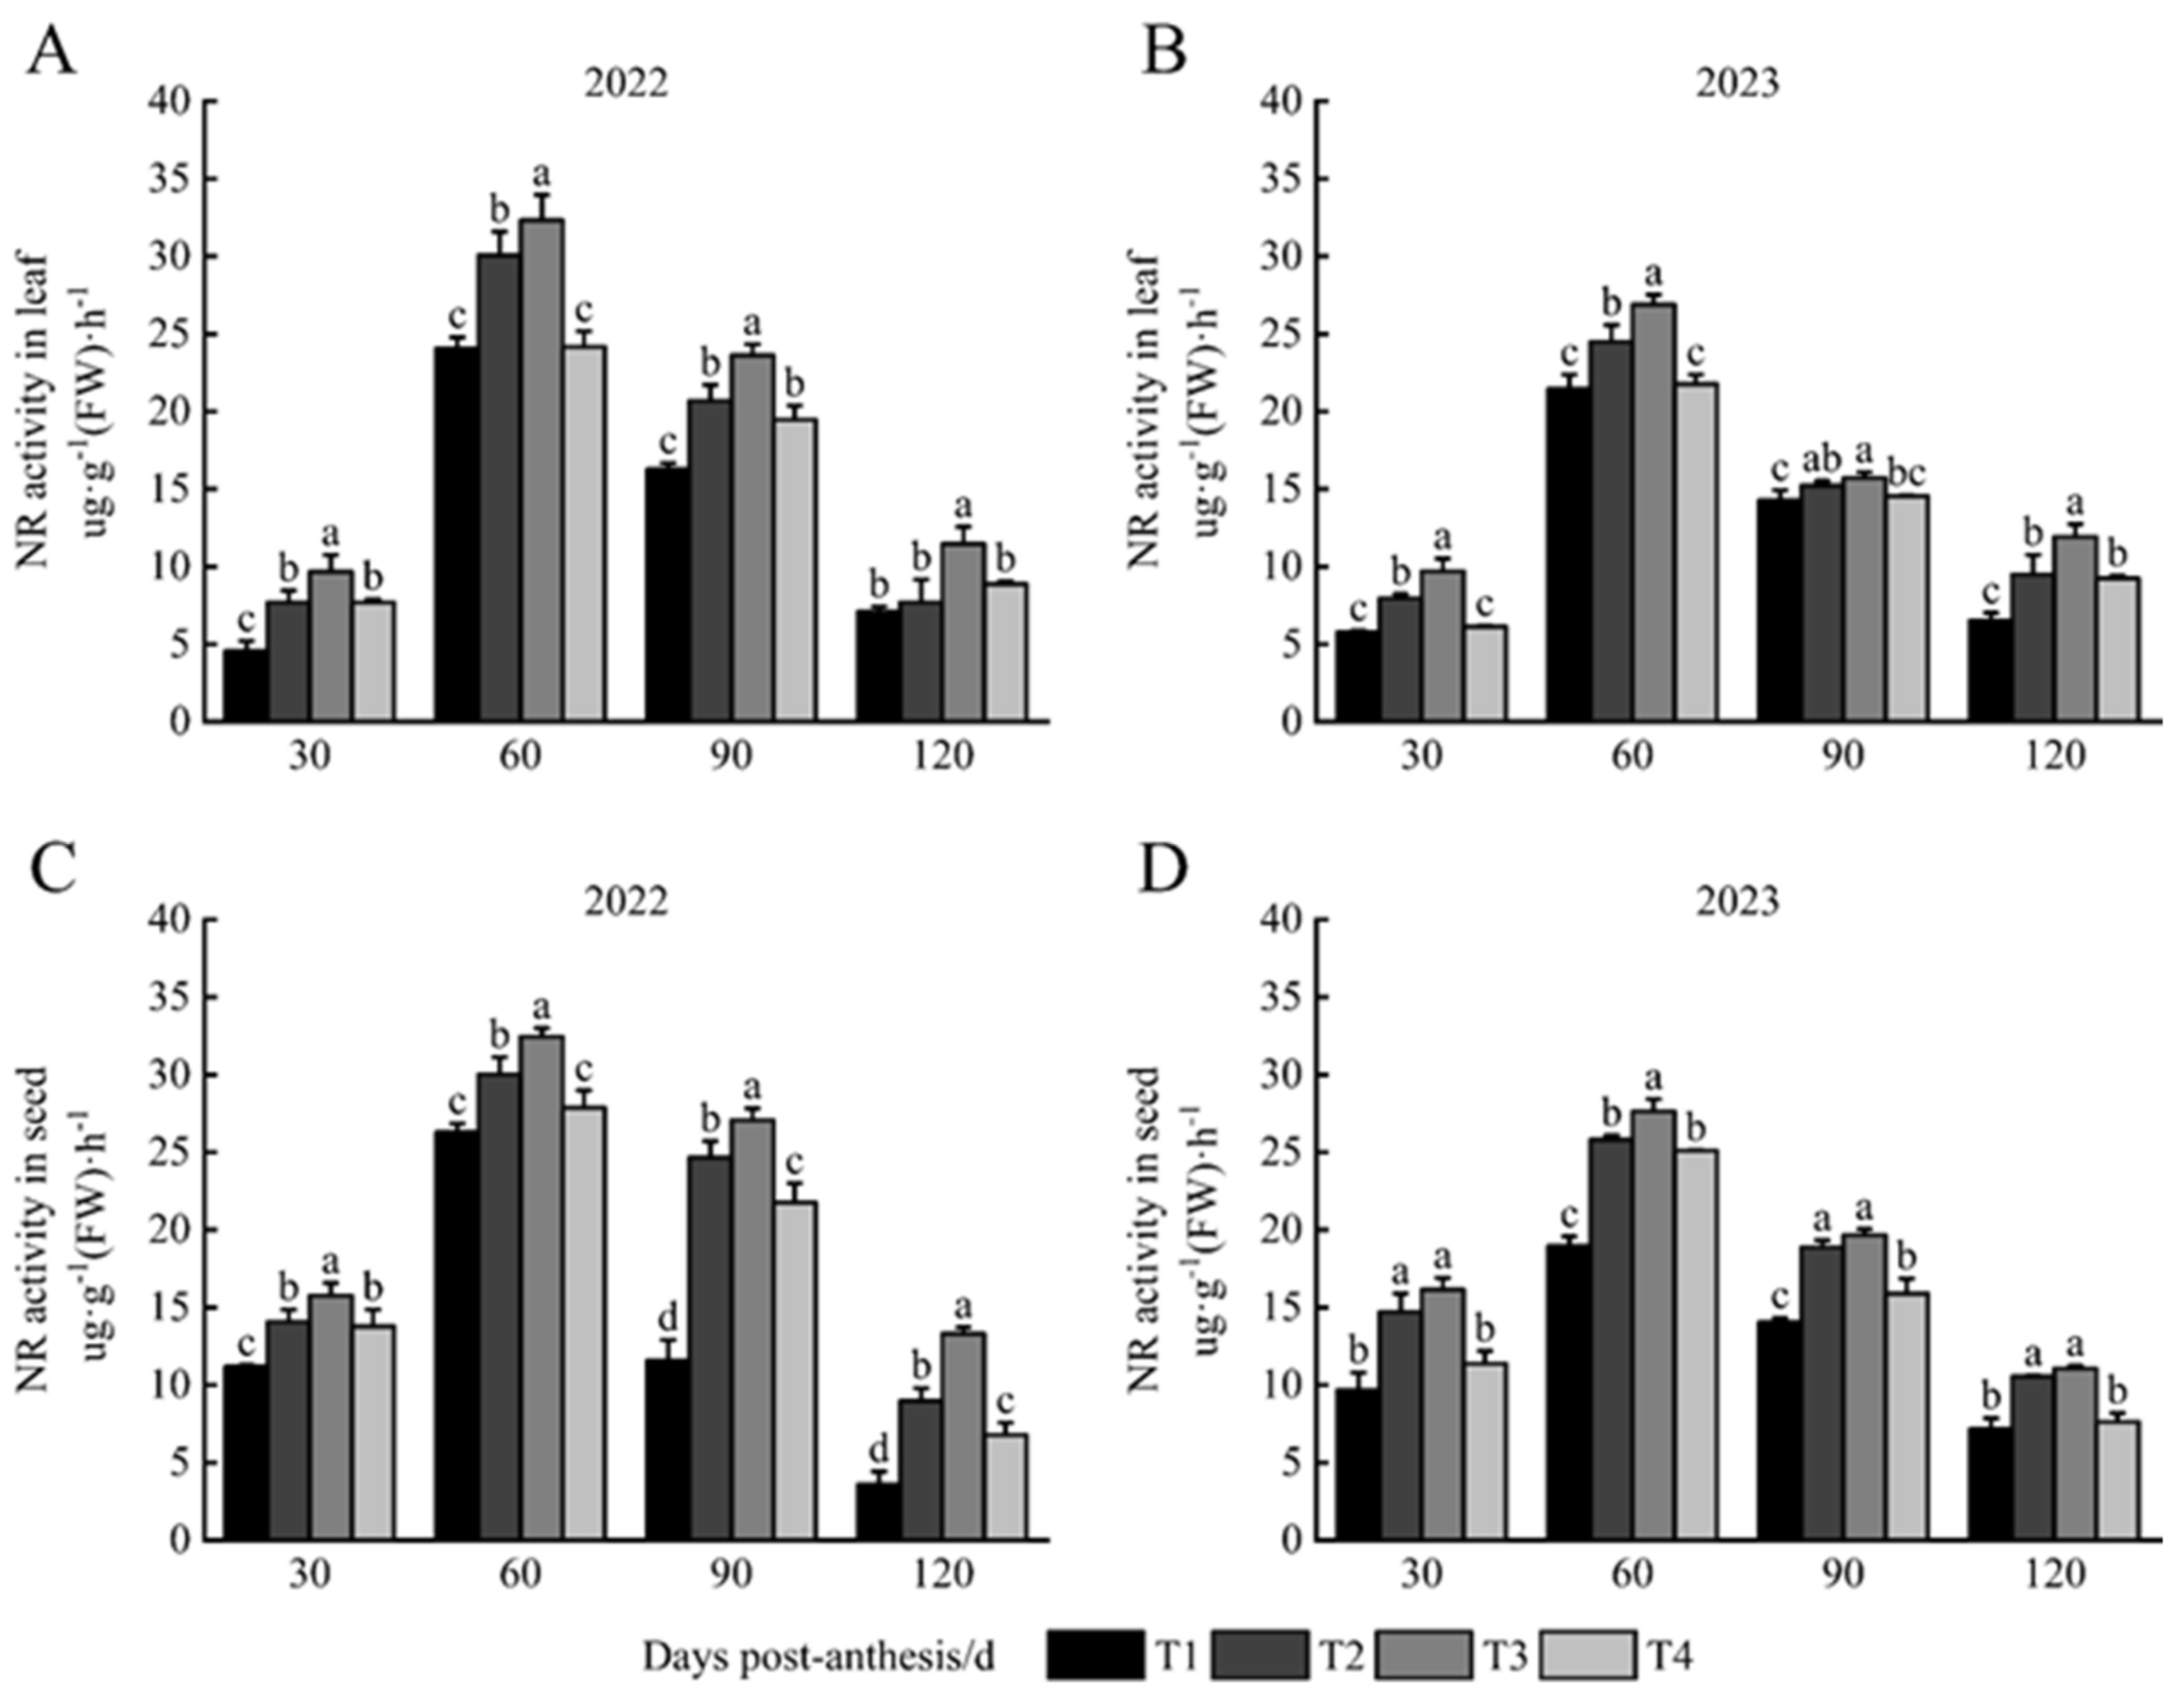
3.2. NR Activity in Leaves and Seeds

The NR activity in leaves across all treatments demonstrated a pattern of initial increase followed by a decline throughout the growth period in both 2022 and 2023. The ranking of NR activity from highest to lowest during the growth stages was as follows: T3 > T2 > T4 > T1 (Figure 2A,B). At 30 DPA, NR activity in leaves for all treatments was relatively low, with T3 exhibiting a significantly higher level compared to T1, T2, and T4, while T2 and T4 did not show significant differences. By 60 DPA, NR activity in leaves peaked across all treatments, with T3 significantly exceeding T1, T2, and T4, while T1 and T4 exhibited no significant difference. At this stage, the NR activity in the T3 treatment was measured at 32.32 µg·g−1·h−1, which was 1.34, 1.08, and 1.33 times greater than that of T1, T2, and T4, respectively. Following 60 days, NR activity in leaves gradually diminished. At 90 DPA, T3 was significantly higher than T1, T2, and T4, while T2 and T4 did not differ significantly. At 120 DPA, T3 continued to show significantly elevated NR activity compared to T1, T2, and T4, with no significant differences among the latter three treatments (Figure 2A). In 2023, at 30 DPA, T3 was significantly elevated compared to T1, T2, and T4, while T1 and T4 did not exhibit significant differences. At 60 DPA, NR activity in leaves across all treatments reached its peak, with T3 significantly higher than T1, T2, and T4, while T1 and T4 remained statistically similar. The NR activity in the T3 treatment was recorded at 26.90 µg·g−1·h−1, which was 1.26, 1.1, and 1.24 times that of T1, T2, and T4, respectively. At 90 DPA, T3 displayed significant differences compared to T1 and T4, while no significant difference was observed with T2. At 120 DPA, T3 was significantly higher than T1, T2, and T4, with no significant differences between T2 and T4. At 90 and 120 DPA, the NR activity in the T3 treatment was recorded at 15.71 µg·g−1·h−1 and 11.91 µg·g−1·h−1, respectively, which were 1.10 and 1.83 times higher than the lowest value observed in T1 at those respective time points (Figure 2B).
The NR activity of seeds across all treatments demonstrated a pattern of initial increase followed by a decline throughout the growth stages in both 2022 and 2023. The NR activity ranked from highest to lowest during the growth period for each treatment, and is ordered as follows: T3 > T2 > T4 > T1 (Figure 2C,D). At 30 DPA in 2022, T3 exhibited a significantly elevated NR activity compared to T1, T2, and T4, while T2 and T4 did not exhibit significant differences. The NR activity of seeds peaked at 60 DPA, with T3 significantly surpassing T1, T2, and T4, and no notable difference was observed between T1 and T4. At this stage, the NR activity for T3 was measured at 32.44 µg·g−1·h−1, which was 1.23 times, 1.08 times, and 1.16 times greater than that of T1, T2, and T4, respectively. Following 60 days, the NR activity of seeds gradually diminished. At 90 and 120 DPA, T3 continued to exhibit significantly higher NR activity than T1, T2, and T4 (Figure 2C). In 2023, at 30 and 120 DPA, T2 and T3 were significantly elevated compared to T1 and T4, with no significant differences observed between T2 and T3, or T1 and T4. The NR activity of seeds again peaked at 60 DPA, with T3 significantly surpassing than T1, T2, and T4, while no significant difference was detected between T2 and T4. At this juncture, the NR activity for T3 was recorded at 27.63 µg·g−1·h−1, which is 1.46 times, 1.07 times, and 1.10 times that of T1, T2, and T4, respectively. At 90 DPA, T3 was significantly greater than T1 and T4, with no significant difference from T2 (Figure 2D). The results from both years indicate that foliar nitrogen application at the T3 time is more beneficial for enhancing the NR activity in the leaves and seeds of Paeonia ostii ‘Fengdan’.

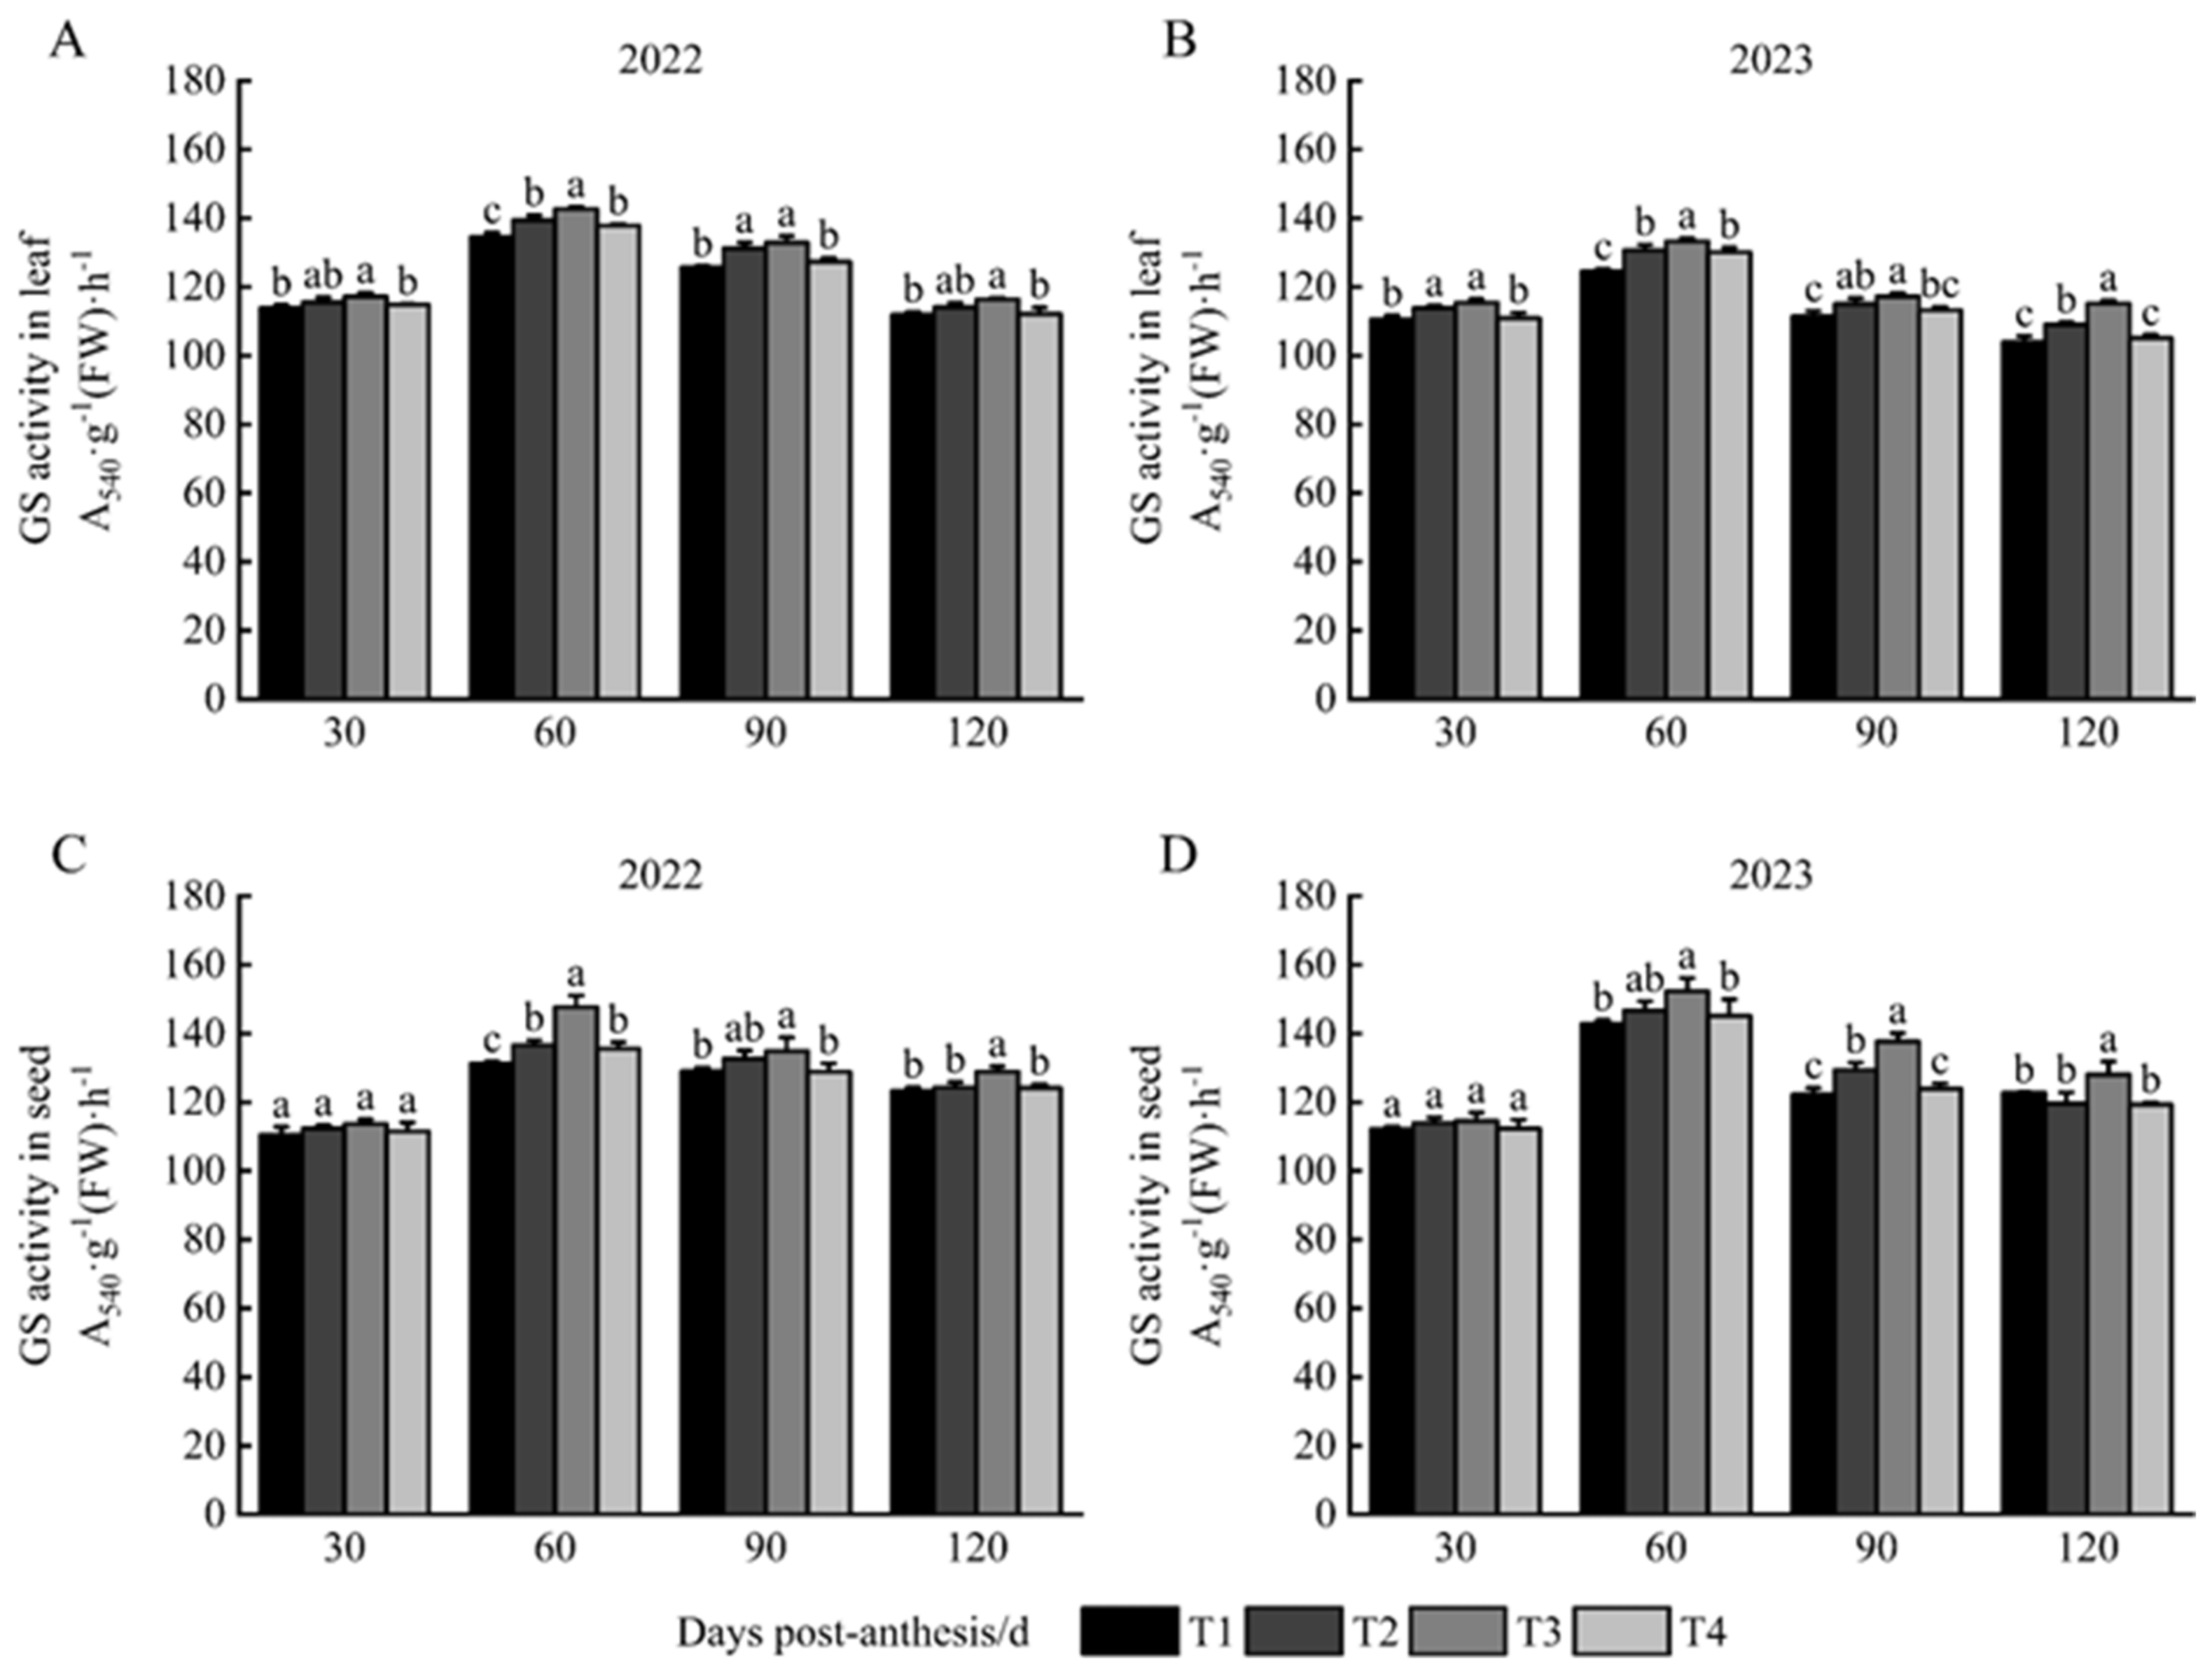
3.3. GS Activity in Leaves and Seeds

The GS activity of leaves across all treatments exhibited a trend of initially increasing and then decreasing throughout the growth stages in both 2022 and 2023. During the growth stage, the GS activity of leaves was ranked from highest to lowest as follows: T3 > T2 > T4 > T1 (Figure 3A,B). At 30 DPA in 2022, T3 exhibited a significantly higher GS activity compared to T1 and T4, with no significant difference observed from T2. At 60 DPA, T3 was significantly greater than that of T1, T2, and T4. At this stage, T3 was measured at 142.67 g−1·FW·h−1, which is 1.06 times that of the lowest treatment, T1. At 90 DPA, T3 continued to show significantly higher GS activity than T1 and T4, with no significant difference from T2. At 120 DPA, T3 maintained a significantly higher GS activity than T1 and T4, while the difference from T2 remained non-significant. The GS activity of T3 at 90 and 120 DPA decreased by 6.82% and 18.46%, respectively, in comparison to the levels observed at 60 DPA (Figure 3A). In 2023, at 30 DPA, T3 again showed significantly higher GS activity than T1 and T4, with no significant difference from T2. At 60 DPA, T3 was significantly higher than T1, T2, and T4, with a recorded GS activity of 133.26 g−1·FW·h−1, which is 1.07 times that of the lowest treatment, T1. At 90 DPA, T3 remained significantly higher than T1 and T4, with no significant difference from T2. By 120 DPA, T3 was significantly higher than all other treatments. The GS activity of T3 at 90 and 120 DPA decreased by 12.02% and 13.63%, respectively, compared to the levels at 60 DPA (Figure 3B).
The GS activity of seeds across all treatments in 2022 and 2023 exhibited a trend of initially increasing and then decreasing throughout the growth stages. The GS activity from highest to lowest during the growth stage for each treatment was as follows: T3 > T2 > T4 > T1 (Figure 3C,D). At 30 DPA in 2022, no significant differences in GS activity were observed among the treatments. At 60 DPA, GS activity reached its peak, with T3 exhibiting a significantly higher level than T1, T2, and T4. At this juncture, the GS activity of T3 was recorded at 147.72 g−1·FW·h−1, which is 1.13 times that of the lowest treatment, T1. After 60 days, GS activity gradually declined across all treatments. At 90 DPA, T3 remained significantly higher than T1 and T4, with no significant difference noted in comparison to T2. At 120 DPA, T3 was significantly superior to all other treatments. The GS activity of T3 at 90 and 120 DPA decreased by 8.73% and 12.76%, respectively, relative to 60 DPA (Figure 3C). In 2023, at 30 DPA, no significant differences in GS activity were detected among the treatments. At 60 DPA, GS activity peaked again, with T3 significantly higher than T1 and T4, while no significant difference was observed with T2. At the same time, the GS activity of T3 was 152.34 g−1·FW·h−1, which is 1.07 times that of the lowest treatment, T1. After 60 days, GS activity gradually declined across all treatments. At 90 and 120 DPA, T3 was significantly higher than the other treatments, with the GS activity of T3 decreasing by 9.63% and 15.95%, respectively, compared to 60 DPA (Figure 3D). The results from both years indicate that foliar nitrogen application at the T3 time is more beneficial for enhancing the GS activity of both the leaves and seeds of Paeonia ostii ‘Fengdan’.

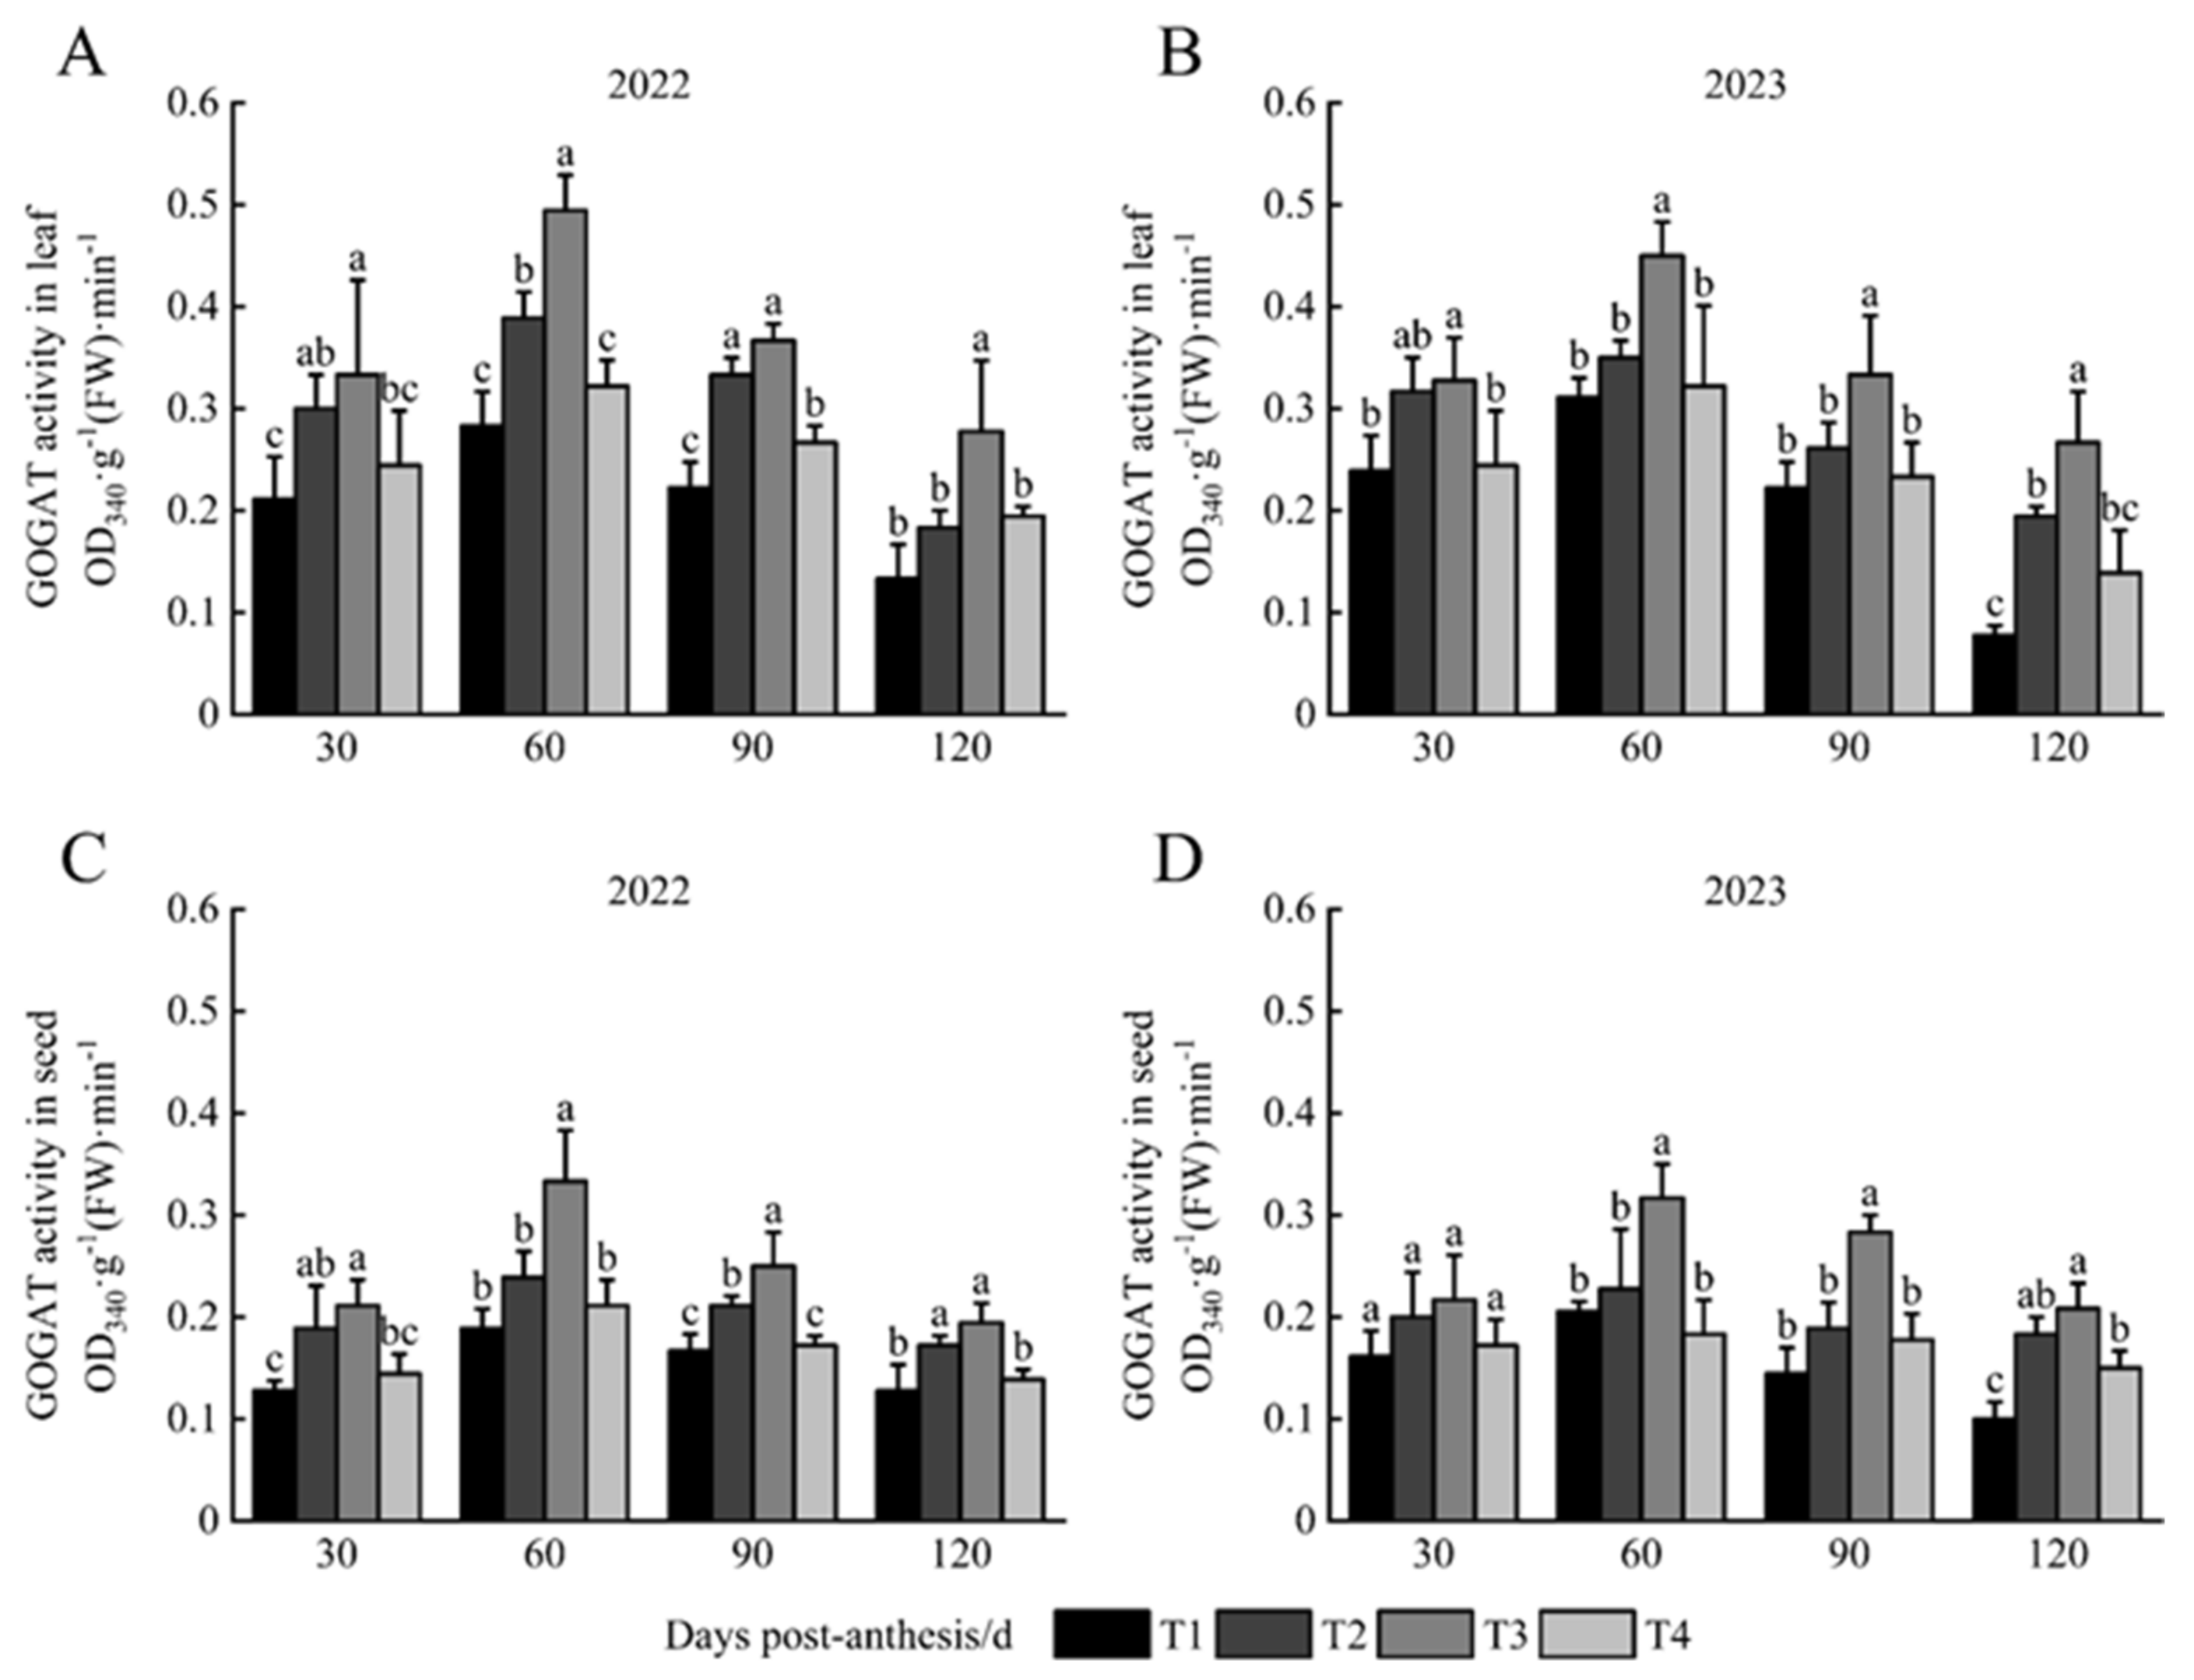
3.4. GOGAT Activity in Leaves and Seeds

The patterns noted in the activity of GOGAT in both leaves and seeds over the two years were analogous, demonstrating an initial rise followed by a decline at the growth stage of Paeonia ostii ‘Fengdan’. The GOGAT activity in leaves and seeds across different treatments during the growth stage ranked from highest to lowest as follows: T3 > T2 > T4 > T1 (Figure 4). In 2022, at 30 DPA, the GOGAT activity in leaves for T3 was significantly elevated compared to T1 and T4, with no notable difference from T2. At 60 DPA, the GOGAT activity in leaves for T3 reached 0.49 g−1·min−1, significantly surpassing the other treatments, being 1.75 times, 1.27 times, and 1.53 times greater than T1, T2, and T4, respectively. At 90 DPA, T3 exhibited significantly higher activity than T1 and T4, with no significant difference from T2. By 120 DPA, T3 was significantly superior to the other treatments (Figure 4A). In 2023, the GOGAT activity in leaves at 30 DPA for T3 was significantly higher than that of T1 and T4, with no significant difference from T2. At 60, 90, and 120 DPA, the GOGAT activity in leaves forT3 was significantly higher than that of the other treatments. At the same time, the GOGAT activity for T3 was measured at 0.45 g−1·min−1, 0.33 g−1·min−1, and 0.23 g−1·min−1, which was 1.45 times, 1.29 times, and 1.40 times that of T1, T2, and T4, respectively (Figure 4B).
In 2022, the GOGAT activity in the seeds at 30 DPA for T3 was markedly elevated compared to T1 and T4, with no significant difference observed relative to T2. At 60 and 90 DPA, the GOGAT activity in seeds for T3 was significantly superior to that of the other treatments, recording values of 0.33 g−1·min−1 and 0.25 g−1·min−1, respectively. Specifically, at 60 DPA, GOGAT activity for T3 was 1.76 times, 1.40 times, and 1.58 times greater than that of T1, T2, and T4, respectively. At 120 DPA, T3 exhibited significantly higher GOGAT activity than T1 and T4, with no significant difference compared to T2 (Figure 4C). In 2023, at 30 DPA, no significant differences in GOGAT activity were detected among the treatments. At 60 and 90 DPA, the GOGAT activity in seeds for T3 was significantly higher than that of the other treatments, measuring 0.32 g−1·min−1 and 0.28 g−1·min−1, respectively. At 60 DPA, the GOGAT activity for T3 was 1.54 times, 1.39 times, and 1.73 times that of T1, T2, and T4, respectively. At 120 DPA, T3 again showed significantly higher activity than T1 and T4, with no significant difference compared to T2 (Figure 4D). The results from both years indicate that foliar nitrogen application at the T3 time is more beneficial for enhancing GOGAT activity in both the leaves and seeds of Paeonia ostii ‘Fengdan’.

3.5. Main Fatty Acid Composition

The T3 treatment in 2022 exhibited significant increases in the oleic acid and α-linolenic acid ratio, by 2.7% and 5.1%, respectively, compared to the lowest treatment. In 2023, the T3 treatment exhibited a significant 7.1% increase in the α-linolenic acid ratio compared to the lowest treatment, while the oleic acid ratio did not differ significantly among treatments. The ratio of linoleic acid did not significantly differ among treatments in either 2022 or 2023, although the T3 treatment consistently showed the highest levels. Furthermore, the T3 treatment in both years resulted in lower levels of palmitic acid and stearic acid compared to other treatments, with no significant difference observed among the treatments (Table 1). The two-year experimental results indicate that foliar nitrogen application at the T3 time point is more beneficial for improving the content α-linolenic acid in seed oil of Paeonia ostii ‘Fengdan’.

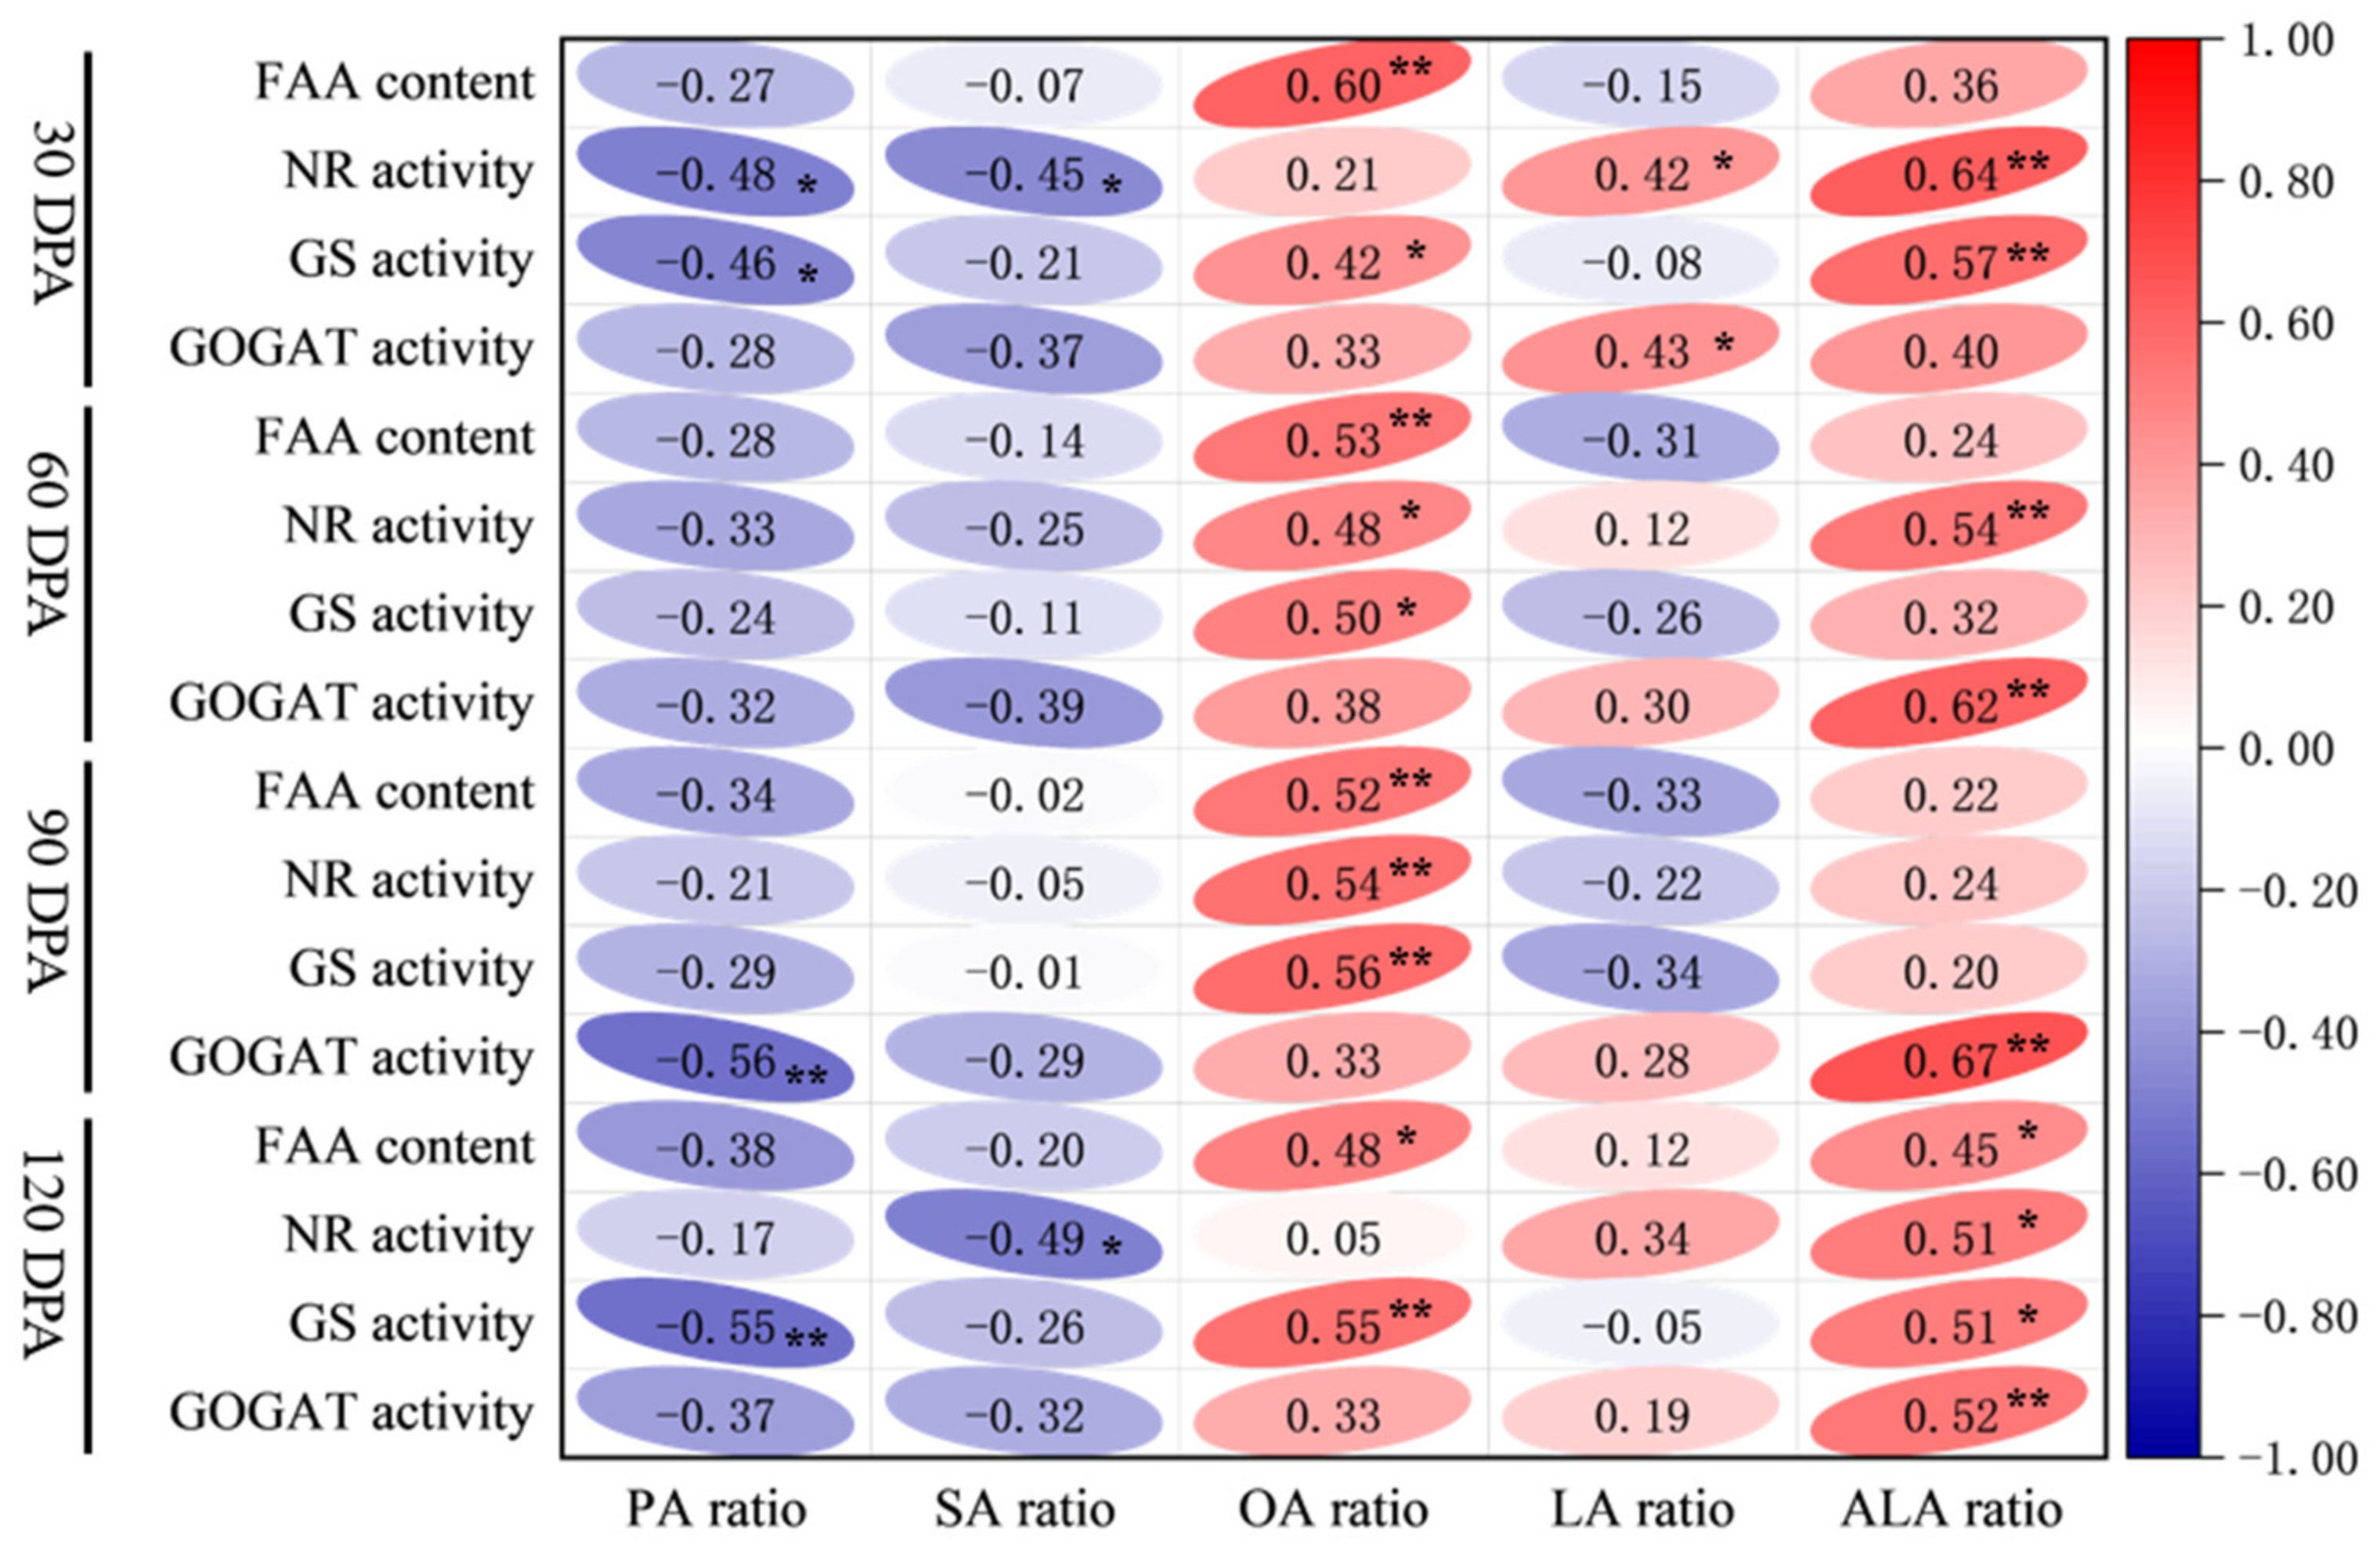
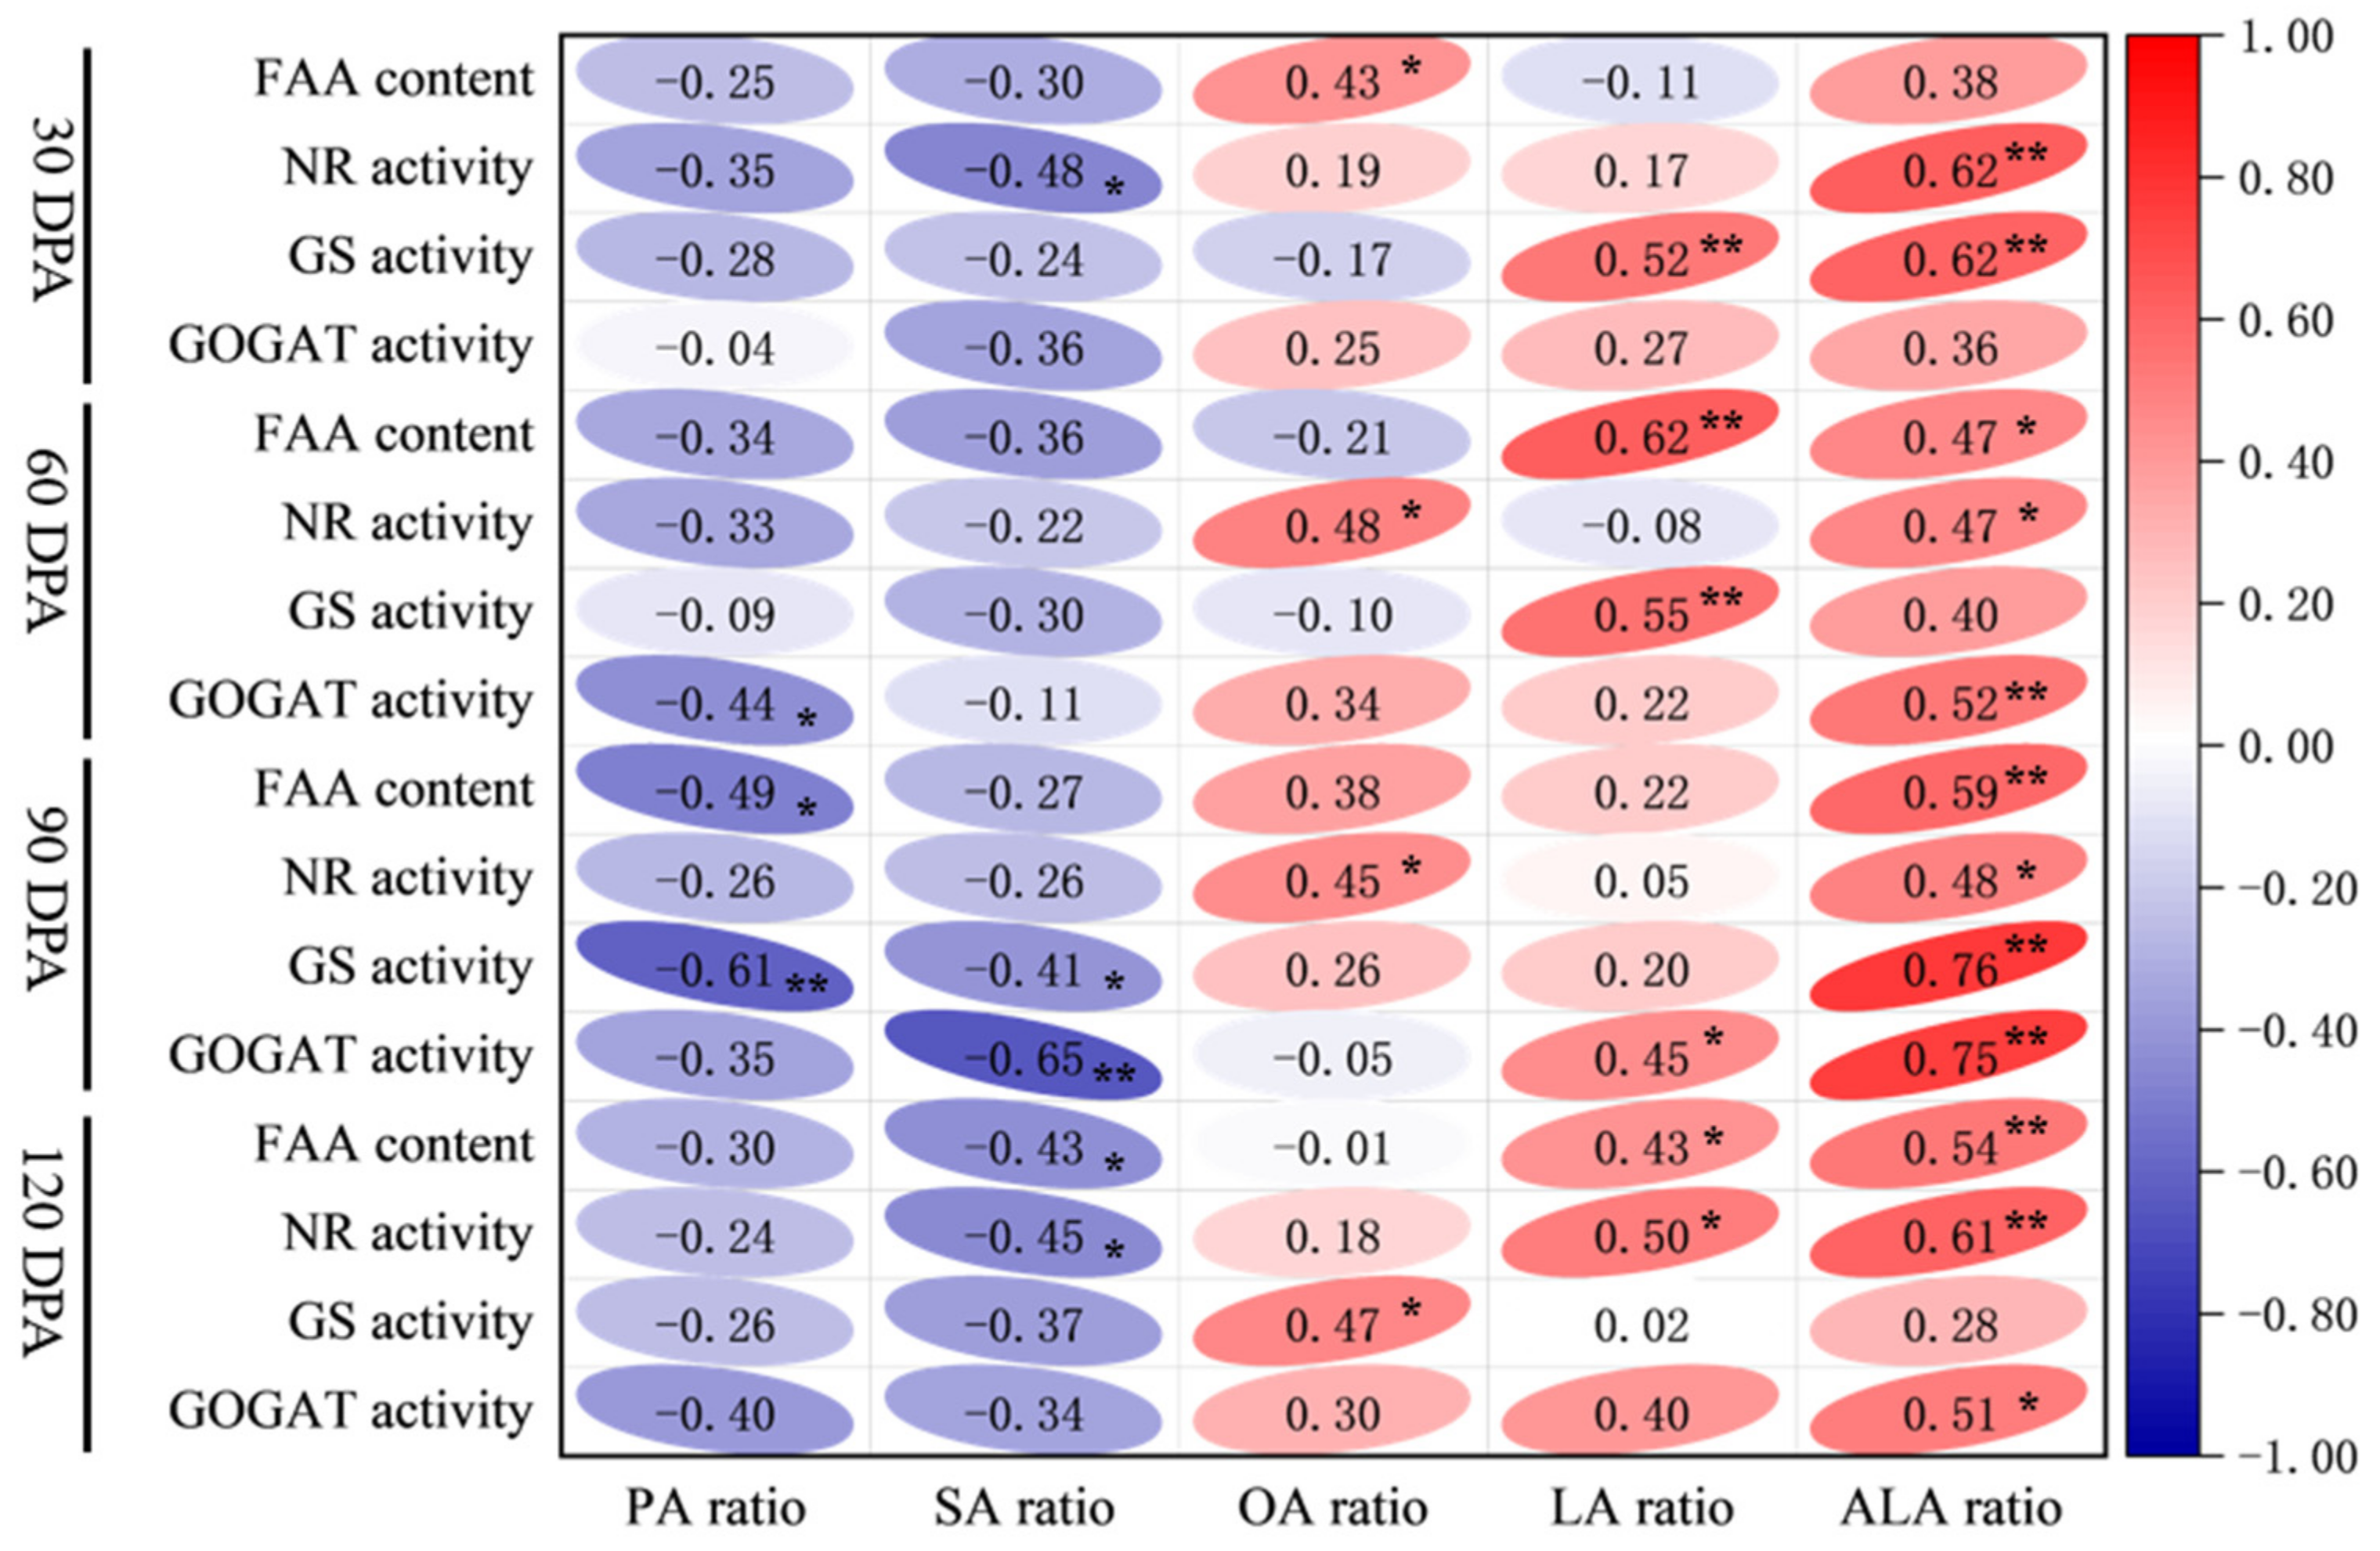
3.6. Relationship Between Nitrogen Metabolism Indicators and Fatty Acids

The levels of FAA, NR, GS, and GOGAT in the leaves and seeds of Paeonia ostii ‘Fengdan’ from 30 to 120 DPA exhibited a positive or highly significant positive correlation with the ratio of oleic acid, linoleic acid, and α-linolenic acid. Conversely, a negative correlation was observed with the ratio of palmitic acid and stearic acid. These findings indicate that enhancing nitrogen metabolism in Paeonia ostii ‘Fengdan’ can promote the synthesis of unsaturated fatty acids (Figure 5 and Figure 6).

4. Discussion

Nitrogen fertilizer serves as a crucial regulatory factor in plant nitrogen metabolism. Nitrogen metabolism directly reflects the nitrogen status of source and sink organs and plays a pivotal role in determining plant quality [17]. In plants, nitrogen metabolites primarily exist and are transported in the form of amino acids. The concentration of FAA serves as a reliable indicator of nitrogen levels and significantly influences the formation of crop seed quality. Enhanced nitrogen nutrition can modulate nitrogen metabolic processes within plants, thereby improving nitrogen assimilation capacity. This physiological response leads to an increased accumulation of FAA in both foliar and reproductive tissues, subsequently facilitating protein biosynthesis and enhancing seed quality parameters [18,19]. In this study, the highest content of FAA was found in T3, indicating a better nitrogen status in T3 plants (Figure 1). In this study, the content of FAA was highest in T3, and the activities of nitrogen metabolism-related enzymes such as NR (Figure 2), GS (Figure 3), and GOGAT (Figure 4) were also the highest in T3 plants, indicating a better nitrogen status in T3 plants. Research has shown that the daily dynamics of net photosynthetic rate and transpiration rate in Paeonia ostii ‘Fengdan’ during summer exhibit a characteristic bimodal curve, with plants experiencing a temporary midday depression between 11:00 and 14:00. During this period, delayed water supply from the roots and insufficient replenishment of leaf water loss led to reduced photosynthetic rates [20]. Under these conditions, foliar nitrogen application increases ambient humidity while reducing environmental temperature, thereby improving the plant’s water status. This modification facilitates increased turgor pressure in stomatal guard cells, promoting stomatal opening [21]. Consequently, the leaf nitrogen absorption efficiency is enhanced, leading to improved nitrogen metabolism levels. Furthermore, these changes create more favorable conditions for photosynthetic activity and carbohydrate accumulation in leaves. Simultaneously, increasing water supply during dry and hot periods can effectively enhance plant transpiration rate, promoting the translocation of nitrogen and photosynthetic products from source to sink organs, which significantly boosts nitrogen accumulation and nitrogen metabolism levels in the seeds [22].
The results of this study showed that from 30 to 120 DPA, the FAA content (Figure 1) and the activities of NR (Figure 2), GS (Figure 3), and GOGAT (Figure 4) in both the leaves and seeds of Paeonia ostii ‘Fengdan’ exhibited an initial increase followed by a subsequent decrease under different nitrogen fertilizer spraying times. Throughout the growth period, nitrogen metabolism indicators displayed regular and coordinated changes. The nitrogen metabolites and enzyme activities in the vegetative organs of Paeonia ostii ‘Fengdan’ exhibited higher levels during the early growth stages but demonstrated a gradual decline throughout the pod maturation stage. This pattern indicates that significant nitrogen accumulation occurs in the leaves during the initial growth period, followed by a gradual senescence of vegetative organs and a subsequent reduction in their nitrogen content, with nitrogen progressively translocating to the developing seeds [23]. Furthermore, the synchronous increase in FAA (Figure 1), NR (Figure 2), GS (Figure 3), and GOGAT (Figure 4) in the leaves and seeds of T3 indicated that under foliar nitrogen application conditions, a good nitrogen status not only helps to enhance nitrogen metabolism levels in the leaves but also contributes to the improvement of nitrogen metabolism levels in the seeds. This, in turn, will further affect the formation of oil in the seeds [24,25].
The accumulation of carbohydrates in seeds further promotes fatty acid synthesis. In this study, foliar nitrogen application between 14:00 and 15:00 significantly increased the ratio of α-linolenic acid in seed oil of Paeonia ostii ‘Fengdan’, leading to an increase in fatty acid unsaturation (Table 1). The correlation analysis revealed a positive relationship between the levels of nitrogen metabolism indicators in leaves (Figure 5) and seeds (Figure 6) and the ratio of unsaturated fatty acids. Nitrogen plays a crucial role in promoting the synthesis of proteins related to photosynthesis and increasing leaf area [26]. Appropriate increases in nitrogen fertilizer application can enhance leaf nitrogen content, thereby increasing chlorophyll concentration in leaves. This improvement boosts the plant’s light energy capture and conversion efficiency, promoting photosynthesis in plants and providing sufficient carbohydrates for seed fatty acid synthesis [27,28]. Studies have demonstrated that increased nitrogen fertilizer application can significantly alter seed fatty acid composition [29], while nitrogen deficiency has been shown to increase fatty acid unsaturation, thereby affecting oil quality [30].

5. Conclusions

The content of FAA and the activity of nitrogen metabolism enzymes in both leaves and seeds of Paeonia ostii ‘Fengdan’ reach elevated levels when nitrogen fertilizer spraying time occurs between 14:00 and 15:00. Furthermore, the ratio of unsaturated fatty acids in the seed oil was also significantly higher. Therefore, it is recommended that manufacturers apply foliar nitrogen fertilizer between 14:00 and 15:00 to enhance nitrogen accumulation and translocation across various plant organs in the practical production of Paeonia ostii ‘Fengdan’. All authors have read and agreed to the published version of the manuscript.

Author Contributions

Conceptualization, N.Z., X.M. and X.H.; methodology, N.Z., X.L., Y.Z. and C.S.; investigation, N.Z., X.L., Y.Z., D.W. and D.Z.; data curation, N.Z., X.M. and X.L.; writing—original draft preparation, N.Z.; writing—review and editing, N.Z., X.M., X.L., Y.Z., D.W., D.Z., C.S. and X.H.; funding acquisition, X.H. All authors have read and agreed to the published version of the manuscript.

Funding

This research was supported by the National Natural Science Foundation of China (U23A20211); the Project of Science and Technology of Henan Province of China (232102110042); the Henan Province Central Guidance for Local Science and Technology Development Fund Project (Z20231811104); the Zhongyuan Scholars Workstation Funded Project (234400510018).

Data Availability Statement

The datasets presented in this article are not readily available because the data are part of an ongoing study. Requests to access the datasets should be directed to the corresponding author (e-mail address: hkdhxg@haust.edu.cn).

Conflicts of Interest

The authors declare no conflicts of interest.

References

  1. Ekiert, H.; Klimek-Szczykutowicz, M.; Szopa, A. Paeonia × suffruticosa (Moutan Peony)—A Review of the chemical composition, traditional and professional use in medicine, position in cosmetics industries, and biotechnological studies. Plants 2022, 11, 3379–3404. [Google Scholar] [CrossRef] [PubMed]
  2. Burdge, G.C. Metabolism of alpha linolenic acid in humans. Prostaglandins Leukot. Essent. Fat. Acids 2006, 75, 161–168. [Google Scholar]
  3. Wang, H.; Wei, S.; He, Y. Characterization of agronomic and seed oil features for different cultivars of tree peony. Plants 2023, 12, 3112–3127. [Google Scholar] [CrossRef]
  4. Regni, L.; Proietti, P. Effects of nitrogen foliar fertilization on the vegetative and productive performance of the olive tree and on oil quality. Agriculture 2019, 9, 252–259. [Google Scholar] [CrossRef]
  5. Li, G.; Guo, X.; Sun, W.; Hou, L.; Wang, G.; Tian, R.; Wang, X.; Qu, C.; Zhao, C. Nitrogen application in pod zone improves yield and quality of two peanut cultivars by modulating nitrogen accumulation and metabolism. BMC Plant Biol. 2024, 24, 48–59. [Google Scholar] [CrossRef] [PubMed]
  6. Zhang, Z.; Yu, Z.; Zhang, Y.; Shi, Y. Optimized nitrogen fertilizer application strategies under supplementary irrigation improved winter wheat (Triticum aestivum L.) yield and seed protein yield. PeerJ 2021, 9, e11467. [Google Scholar] [CrossRef]
  7. Zapletalová, A.; Ducsay, L.; Varga, L.; Sitkey, J.; Javoreková, S.; Hozlár, P. Influence of nitrogen nutrition on fatty acids in oilseed rape (Brassica napus L.). Plants 2021, 11, 44–52. [Google Scholar] [CrossRef]
  8. Lin, Y.; Kong, D.; Wang, Z.; Chen, Y.; Yang, Z.; Wu, C.; Yang, H.; Chen, L. Nitrogen application modifies the seed and oil yields and fatty acid composition of Nicotiana tabacum. HortScience 2020, 55, 1898–1902. [Google Scholar] [CrossRef]
  9. Liu, W.; Yin, D.; Zhang, T.; Hou, X.; Qiao, Q.; Song, P. Major fatty acid compositions and antioxidant activity of cultivated Paeonia ostii under different nitrogen fertilizer application. Chem. Biodivers. 2020, 17, e2000617. [Google Scholar] [CrossRef]
  10. Hasani, M.; Zamani, M.; Savaghebi, G.; Sofla, H. Effect of foliar and soil application of urea on leaf nutrients concentrations, yield and fruit quality of pomegranate. J. Plant Nutr. 2016, 39, 749–755. [Google Scholar] [CrossRef]
  11. Ishfaq, M.; Kiran, A.; Rehman, H.U.; Farooq, M.; Ijaz, N.H.; Nadeem, F.; Azeem, I.; Li, X.X.; Wakeel, A. Foliar nutrition: Potential and challenges under multifaceted agriculture. Environ. Exp. Bot. 2022, 200, 104909. [Google Scholar]
  12. Cavero, J.; Faci, J.M.; Martínez-Cob, A. Relevance of sprinkler irrigation time of the day on alfalfa forage production. Agric. Water Manag. 2016, 178, 304–313. [Google Scholar]
  13. Farouk, A.S.; Abdelghany, A.M.; Shehab, A.A.; Alwakel, S.E.; Makled, K.M.; Naif, E.; Ren, H.; Lamlom, S.F. Optimizing wheat productivity through integrated management of irrigation, nutrition, and organic amendments. BMC Plant Biol. 2024, 24, 548–562. [Google Scholar] [CrossRef]
  14. Waseem, M.; Kaleel, I.; Mallikarjuna; Patil, R. Comparsion of micro sprinkler irrigation and surface irrigation methodson growth and yield for groundnut under Raichur region. Agric. Update 2017, 12, 2031–2035. [Google Scholar] [CrossRef]
  15. Artacho, P.; Bonomelli, C. Changes in fine-root production, phenology and spatial distribution in response to N application in irrigated sweet cherry trees. Tree Physiol. 2016, 36, 601–617. [Google Scholar] [CrossRef]
  16. Li, H. Modern Plant Physiology, 3rd ed.; Higher Education Press: Beijing, China, 2012. (In Chinese) [Google Scholar]
  17. Cheng, X.; Liang, Y.; Zhang, A.; Wang, P.; He, S.; Zhang, K.; Wang, J.; Fang, Y.; Sun, X. Using foliar nitrogen application during veraison to improve the flavor components of grape and wine. J. Sci. Food Agric. 2021, 101, 1288–1300. [Google Scholar] [CrossRef]
  18. Pannico, A.; Modarelli, G.; Stazi, S.; Giaccone, M.; Romano, R.; Rouphael, Y.; Cirillo, C. Foliar nutrition influences yield, nut quality and kernel composition in hazelnut cv mortarella. Plants 2023, 12, 2219–2233. [Google Scholar] [CrossRef]
  19. Liu, M.; Tang, D.; Shi, Y.; Ma, L.; Zhang, Q.; Ruan, J. Foliar N application on tea plant at its dormancy stage increases the N concentration of mature leaves and improves the quality and yield of spring tea. Front. Plant Sci. 2021, 12, 753086. [Google Scholar] [CrossRef]
  20. Ma, Z.; Yin, J.; Yang, Y.; Sun, F.; Yang, Z. Effect of water and nitrogen coupling regulation on the growth, physiology, yield, and quality attributes and comprehensive evaluation of wolfberry (Lycium barbarum L.). Front. Plant Sci. 2023, 14, 1130109. [Google Scholar] [CrossRef]
  21. Song, Y.; Dong, M.; Chen, F.; Hu, Y.; Zhu, Y.; Gu, J.; Chen, P.; Xie, Y.; Yuan, C.; Qiao, Z.; et al. Effects of nitrogen fertilizer reduction combined with foliar fertilizer application on the physiological characteristics and yield of high-quality japonica rice. Int. J. Plant Prod. 2024, 18, 239–254. [Google Scholar] [CrossRef]
  22. Guo, D.; Wang, R.; Chen, C.; Yin, B.; Ding, Z.; Wang, X.; Zhao, M.; Zhou, B. Nitrogen supply mitigates heat stress on photosynthesis of Maize (Zea mays L.) during early seed filling by improving nitrogen assimilation. J. Agron. Crop Sci. 2024, 210, e12750. [Google Scholar] [CrossRef]
  23. Lyu, X.; Liu, Y.; Li, N.; Ku, L.; Hou, Y.; Wen, X. Foliar applications of various nitrogen (N) forms to winter wheat affect seed protein accumulation and quality via N metabolism and remobilization. Crop J. 2022, 10, 1165–1177. [Google Scholar] [CrossRef]
  24. Nasar, J.; Wang, G.; Ahmad, S.; Muhammad, I.; Zeeshan, M.; Gitari, H.; Adnan, M.; Fahad, S.; Khalid, M.; Zhou, X.; et al. Nitrogen fertilization coupled with iron foliar application improves the photosynthetic characteristics, photosynthetic nitrogen use efficiency, and the related enzymes of maize crops under different planting patterns. Front. Plant Sci. 2022, 13, 988055. [Google Scholar] [CrossRef]
  25. Sun, M.; Li, S.; Yu, H.; Gong, Q.; Zhang, B.; Liu, G.; Xiao, Y.; Peng, F. Effects of valine and urea on carbon and nitrogen accumulation and lignin content in peach trees. Plants 2023, 12, 1596–1610. [Google Scholar] [CrossRef]
  26. Luo, Z.; Kong, X.; Dai, J.; Dong, H. Soil plus foliar nitrogen application increases cotton growth and salinity tolerance. J. Plant Nutr. 2015, 38, 443–455. [Google Scholar] [CrossRef]
  27. Noor, H.; Wang, Q.; Islam, M.A.; Sun, M.; Lin, W.; Ren, A.X.; Feng, Y.; Yu, S.B.; Fida, N.; Dong, S.F.; et al. Effects of sowing methods and nitrogen rates on photosynthetic characteristics, yield, and quality of winter wheat. Photosynthetica 2021, 59, 277–285. [Google Scholar] [CrossRef]
  28. Zangani, E.; Afsahi, K.; Shekari, F.; Sweeney, E.; Mastinu, A. Nitrogen and phosphorus addition to soil improves seed yield, foliar stomatal conductance, and the photosynthetic response of rapeseed (Brassica napus L.). Agriculture 2021, 11, 483–492. [Google Scholar] [CrossRef]
  29. Wang, C.; Li, Z.; Wu, W. Understanding fatty acid composition and lipid profile of rapeseed oil in response to nitrogen management strategies. Food Res. Int. 2023, 165, 112565. [Google Scholar] [CrossRef]
  30. Li, S.; Liu, X.; Yin, L.; Wang, S.; Deng, X. Alteration in lipid metabolism is involved in nitrogen deficiency response in wheat seedlings. Plant Physiol. Biochem. 2024, 214, 108883. [Google Scholar] [CrossRef]
Figure 1. Free amino acid (FAA) content of Paeonia ostii ‘Fengdan’ under different nitrogen fertilizer spraying time. (A), FAA content of leaves in 2022; (B), FAA content of leaves in 2023; (C), FAA content of seeds in 2022; (D), FAA content of seeds in 2023. Values are shown as means ± SD of three independent biological samples. Different lowercase letters in the bar graph indicate a significant difference in FAA content between different treatments in the same period at p < 0.05 according to Duncan’s multiple range test. T1, T2, T3, T4 indicate the nitrogen fertilizer spraying times of 3:00–4:00, 7:00–8:00, 14:00–15:00, and 19:00–20:00; 30, 60, 90, and 120 represent the days post-anthesis (DPA).
Agronomy 15 00892 g001
Figure 2. Nitrate reductase (NR) activity of Paeonia ostii ‘Fengdan’ under different nitrogen fertilizer spraying time. (A), NR activity of leaves in 2022; (B), NR activity of leaves in 2023; (C), NR activity of seeds in 2022; (D), NR activity of seeds in 2023. Values are shown as means ± SD of three independent biological samples. Different lowercase letters in the bar graph indicate a significant difference in NR activity between different treatments in the same period at p < 0.05 according to Duncan’s multiple range test. T1, T2, T3, T4 indicate the nitrogen fertilizer spraying times of 3:00–4:00, 7:00–8:00, 14:00–15:00, and 19:00–20:00; 30, 60, 90, 120 represent DPA.
Agronomy 15 00892 g002
Figure 3. Glutamine synthetase (GS) activity of Paeonia ostii ‘Fengdan’ under different nitrogen fertilizer spraying time. (A), GS activity of leaves in 2022; (B), GS activity of leaves in 2023; (C), GS activity of seeds in 2022; (D), GS activity of seeds in 2023. Values are shown as means ± SD of three independent biological samples. Different lowercase letters in the bar graph indicate a significant difference in GS activity between different treatments in the same period at p < 0.05 according to Duncan’s multiple range test. T1, T2, T3, T4 indicate the nitrogen fertilizer spraying times of 3:00–4:00, 7:00–8:00, 14:00–15:00, and 19:00–20:00; 30, 60, 90, 120 represent DPA. A540 represents the absorbance at 540 nm.
Agronomy 15 00892 g003
Figure 4. Glutamate synthase activity (GOGAT) of Paeonia ostii ‘Fengdan’ under different nitrogen fertilizer spraying time. (A), GOGAT activity of leaves in 2022; (B), GOGAT activity of leaves in 2023; (C), GOGAT activity of seeds in 2022; (D), GOGAT activity of seeds in 2023. Values are shown as means ± SD of three independent biological samples. Different lowercase letters in the bar graph indicate a significant difference in GOGAT activity between different treatments in the same period at p < 0.05 according to Duncan’s multiple range test. T1, T2, T3, T4 indicate the nitrogen fertilizer spraying times of 3:00–4:00, 7:00–8:00, 14:00–15:00, and 19:00–20:00; 30, 60, 90, 120 represent DPA. OD340 represents the difference between the end value and the initial value during the phase where the optical density exhibits a consistent decline at 340 nm.
Agronomy 15 00892 g004
Figure 5. Correlation analysis of nitrogen metabolism enzymes activity in leaves and ratio of fatty acids in seed oil of Paeonia ostii ‘Fengdan’. Note: * indicates a significant association at the 0.05 level; ** indicates a very significant association at the 0.01 level. PA, SA, OA, LA, and ALA represent palmitic acid, stearic acid, oleic acid, linoleic acid, and α-linolenic acid.
Agronomy 15 00892 g005
Figure 6. Correlation analysis of nitrogen metabolism enzymes activity in seeds and ratio of fatty acids in seed oil of Paeonia ostii ‘Fengdan’. Note: * indicates a significant association at the 0.05 level; ** indicates a very significant association at the 0.01 level. PA, SA, OA, LA, and ALA represent palmitic acid, stearic acid, oleic acid, linoleic acid, and α-linolenic acid.
Agronomy 15 00892 g006
Table 1. Main fatty acid composition (%) in seed oil of Paeonia ostii ‘Fengdan’.
YearTreatmentPalmitic AcidStearic AcidOleic AcidLinoleic Acidα-Linolenic Acid
2022T16.87 ± 0.18 a3.00 ± 0.29 a25.46 ± 0.18 b25.28 ± 0.43 a35.77 ± 0.91 b
T26.77 ± 0.36 a2.75 ± 0.14 a26.03 ± 0.43 ab25.99 ± 0.87 a37.23 ± 0.80 a
T36.74 ± 0.18 a2.62 ± 0.22 a26.17 ± 0.09 a26.04 ± 0.74 a37.50 ± 0.25 a
T46.80 ± 0.06 a2.81 ± 0.07 a25.54 ± 0.45 ab25.18 ± 0.17 a35.57 ± 0.36 b
2023T17.12 ± 0.49 a3.03 ± 0.35 a25.06 ± 0.79 a26.09 ± 0.24 a35.43 ± 0.16 b
T26.81 ± 0.64 a2.41 ± 0.27 a24.96 ± 1.60 a26.70 ± 0.71 a37.31 ± 1.31 ab
T36.35 ± 0.86 a2.32 ± 0.93 a25.22 ± 1.16 a27.05 ± 1.36 a38.16 ± 1.84 a
T47.42 ± 0.18 a2.82 ± 0.07 a24.74 ± 0.27 a26.25 ± 0.18 a35.65 ± 0.14 b
Note: Data are means ± SD of three replicates each containing five plants independently. Different lowercase letters in the same column indicate significantly different between different treatments in the same fatty acid at p < 0.05 according to Duncan’s multiple range test.
Disclaimer/Publisher’s Note: The statements, opinions and data contained in all publications are solely those of the individual author(s) and contributor(s) and not of MDPI and/or the editor(s). MDPI and/or the editor(s) disclaim responsibility for any injury to people or property resulting from any ideas, methods, instructions or products referred to in the content.

