


Multivariate Insight into Soil Organic Matter Dynamics in Subarctic Abandoned Farmland by the Chronosequence Approach


Abstract
:1. Introduction
2. Materials and Methods
3. Results
4. Discussion
5. Conclusions
Author Contributions
Funding
Data Availability Statement
Acknowledgments
Conflicts of Interest
Abbreviations
| SOM | Soil Organic Matter |
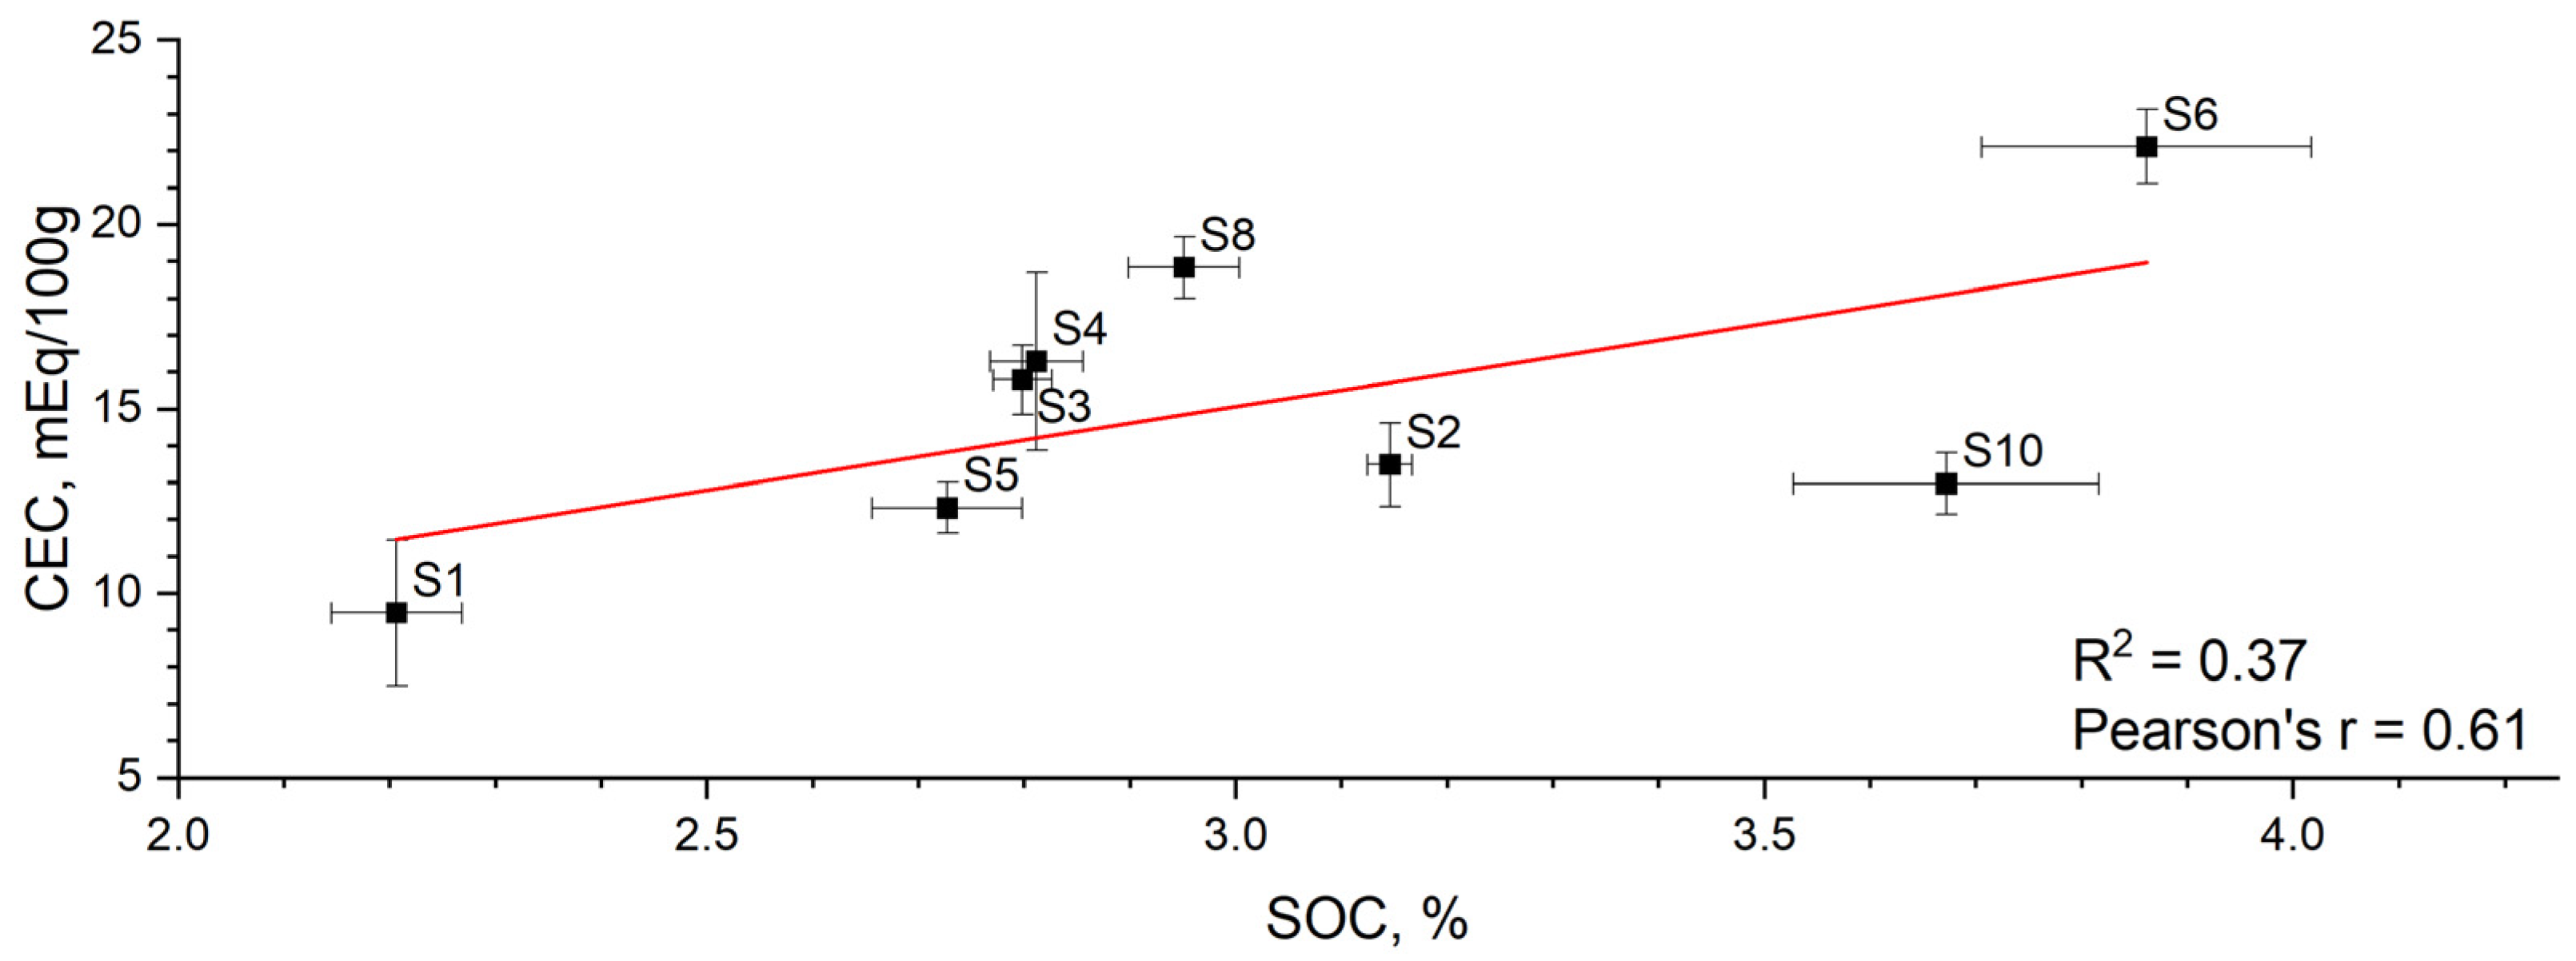
| SOC | Soil Organic Carbon |
| TN | Total Nitrogen |
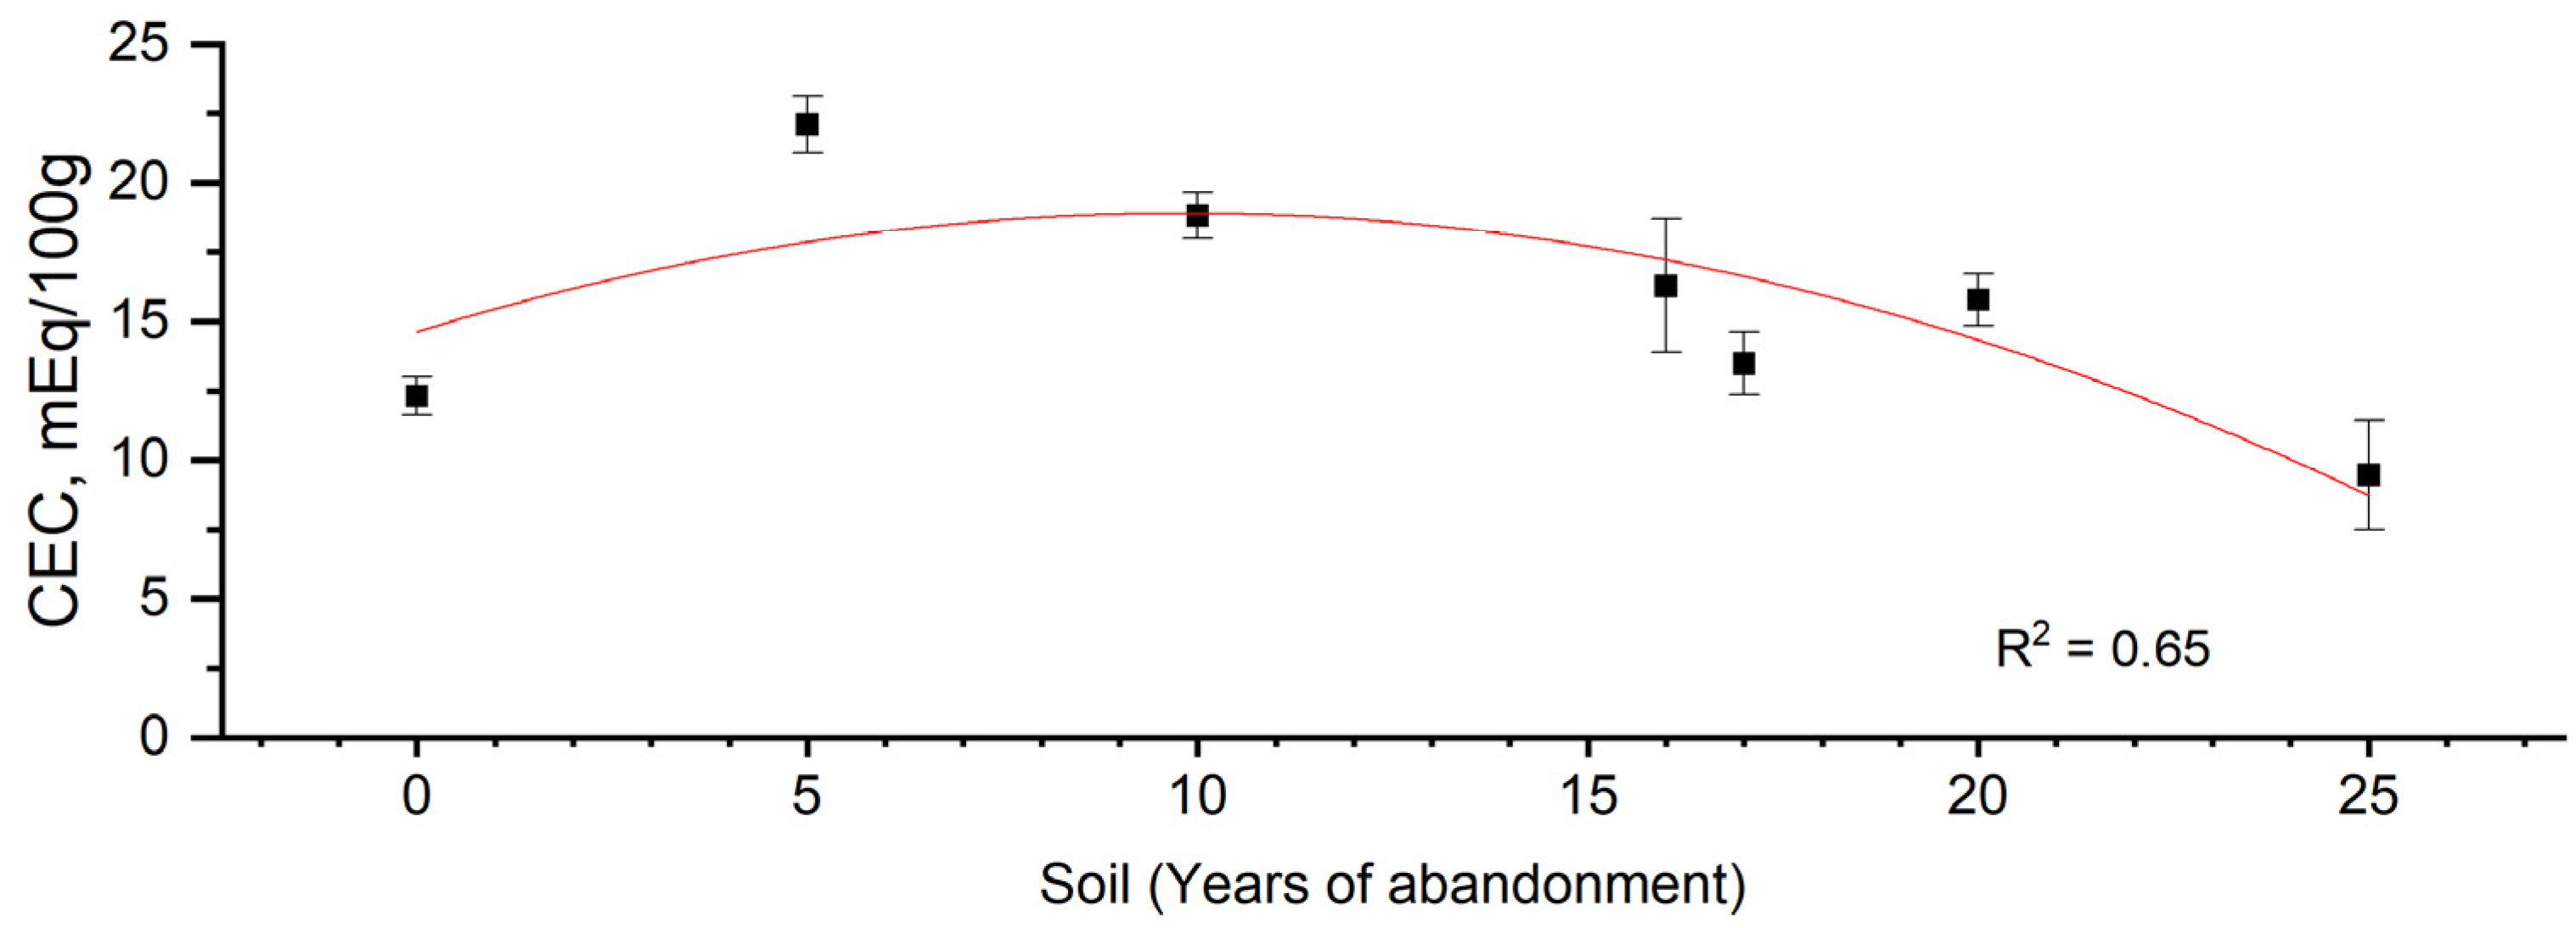
| CEC | Cation Exchange Capacity |
| NMR | Nuclear Magnetic Resonance |
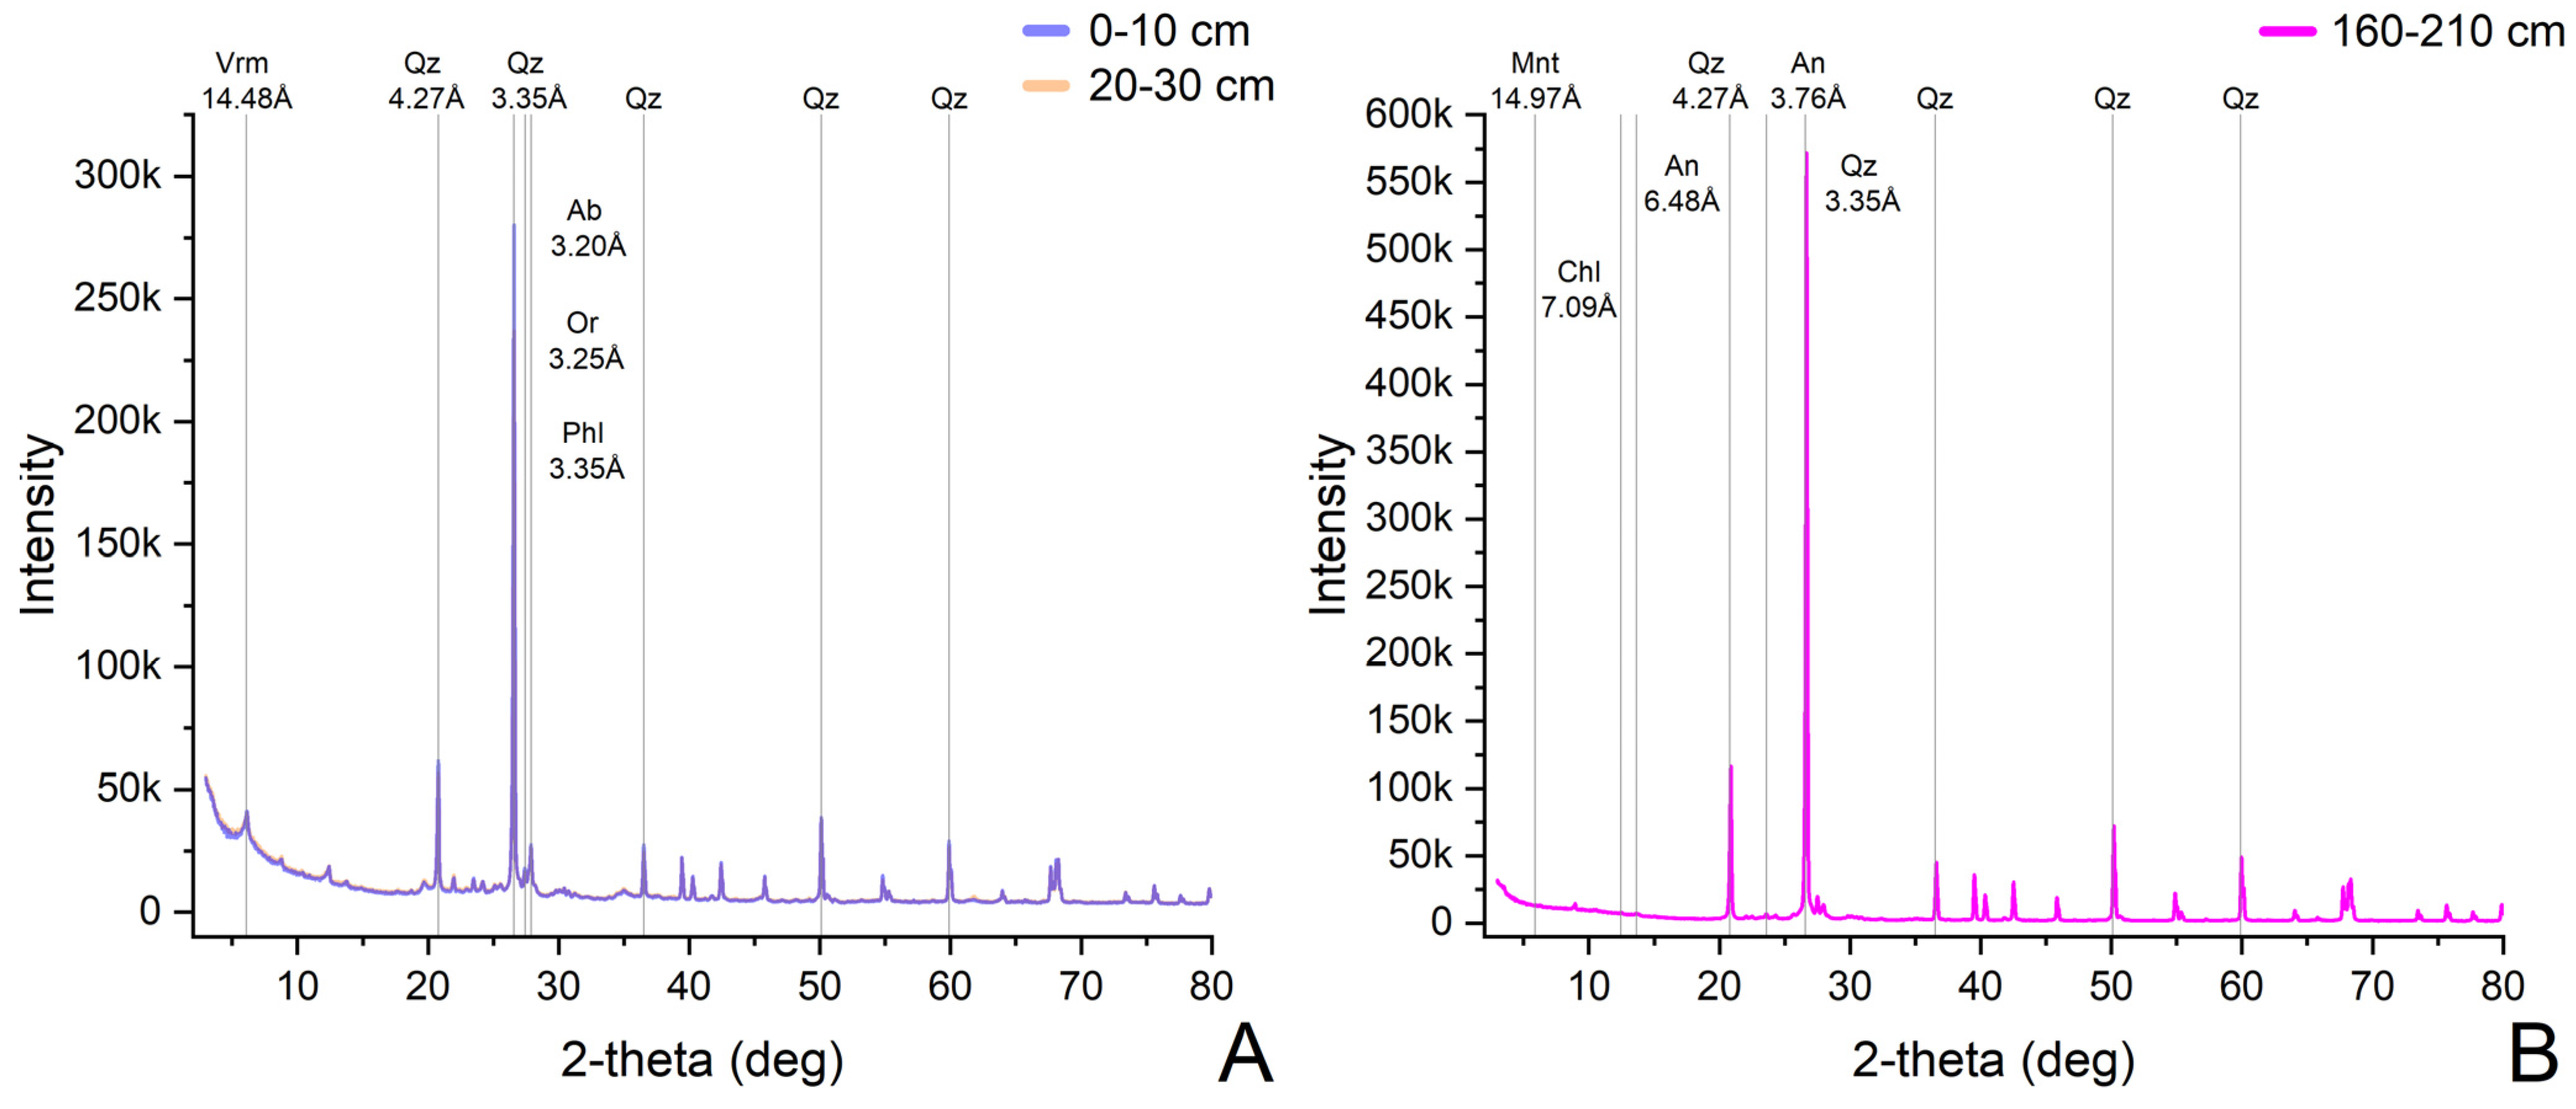
| PXRD | Powder X-Ray Diffraction |
| YAS | Yamal Experimental Agricultural Station |
| MT | Mature Soil |
| ARM | Aromaticity index |
| HB/HI | Hydrophobicity index |
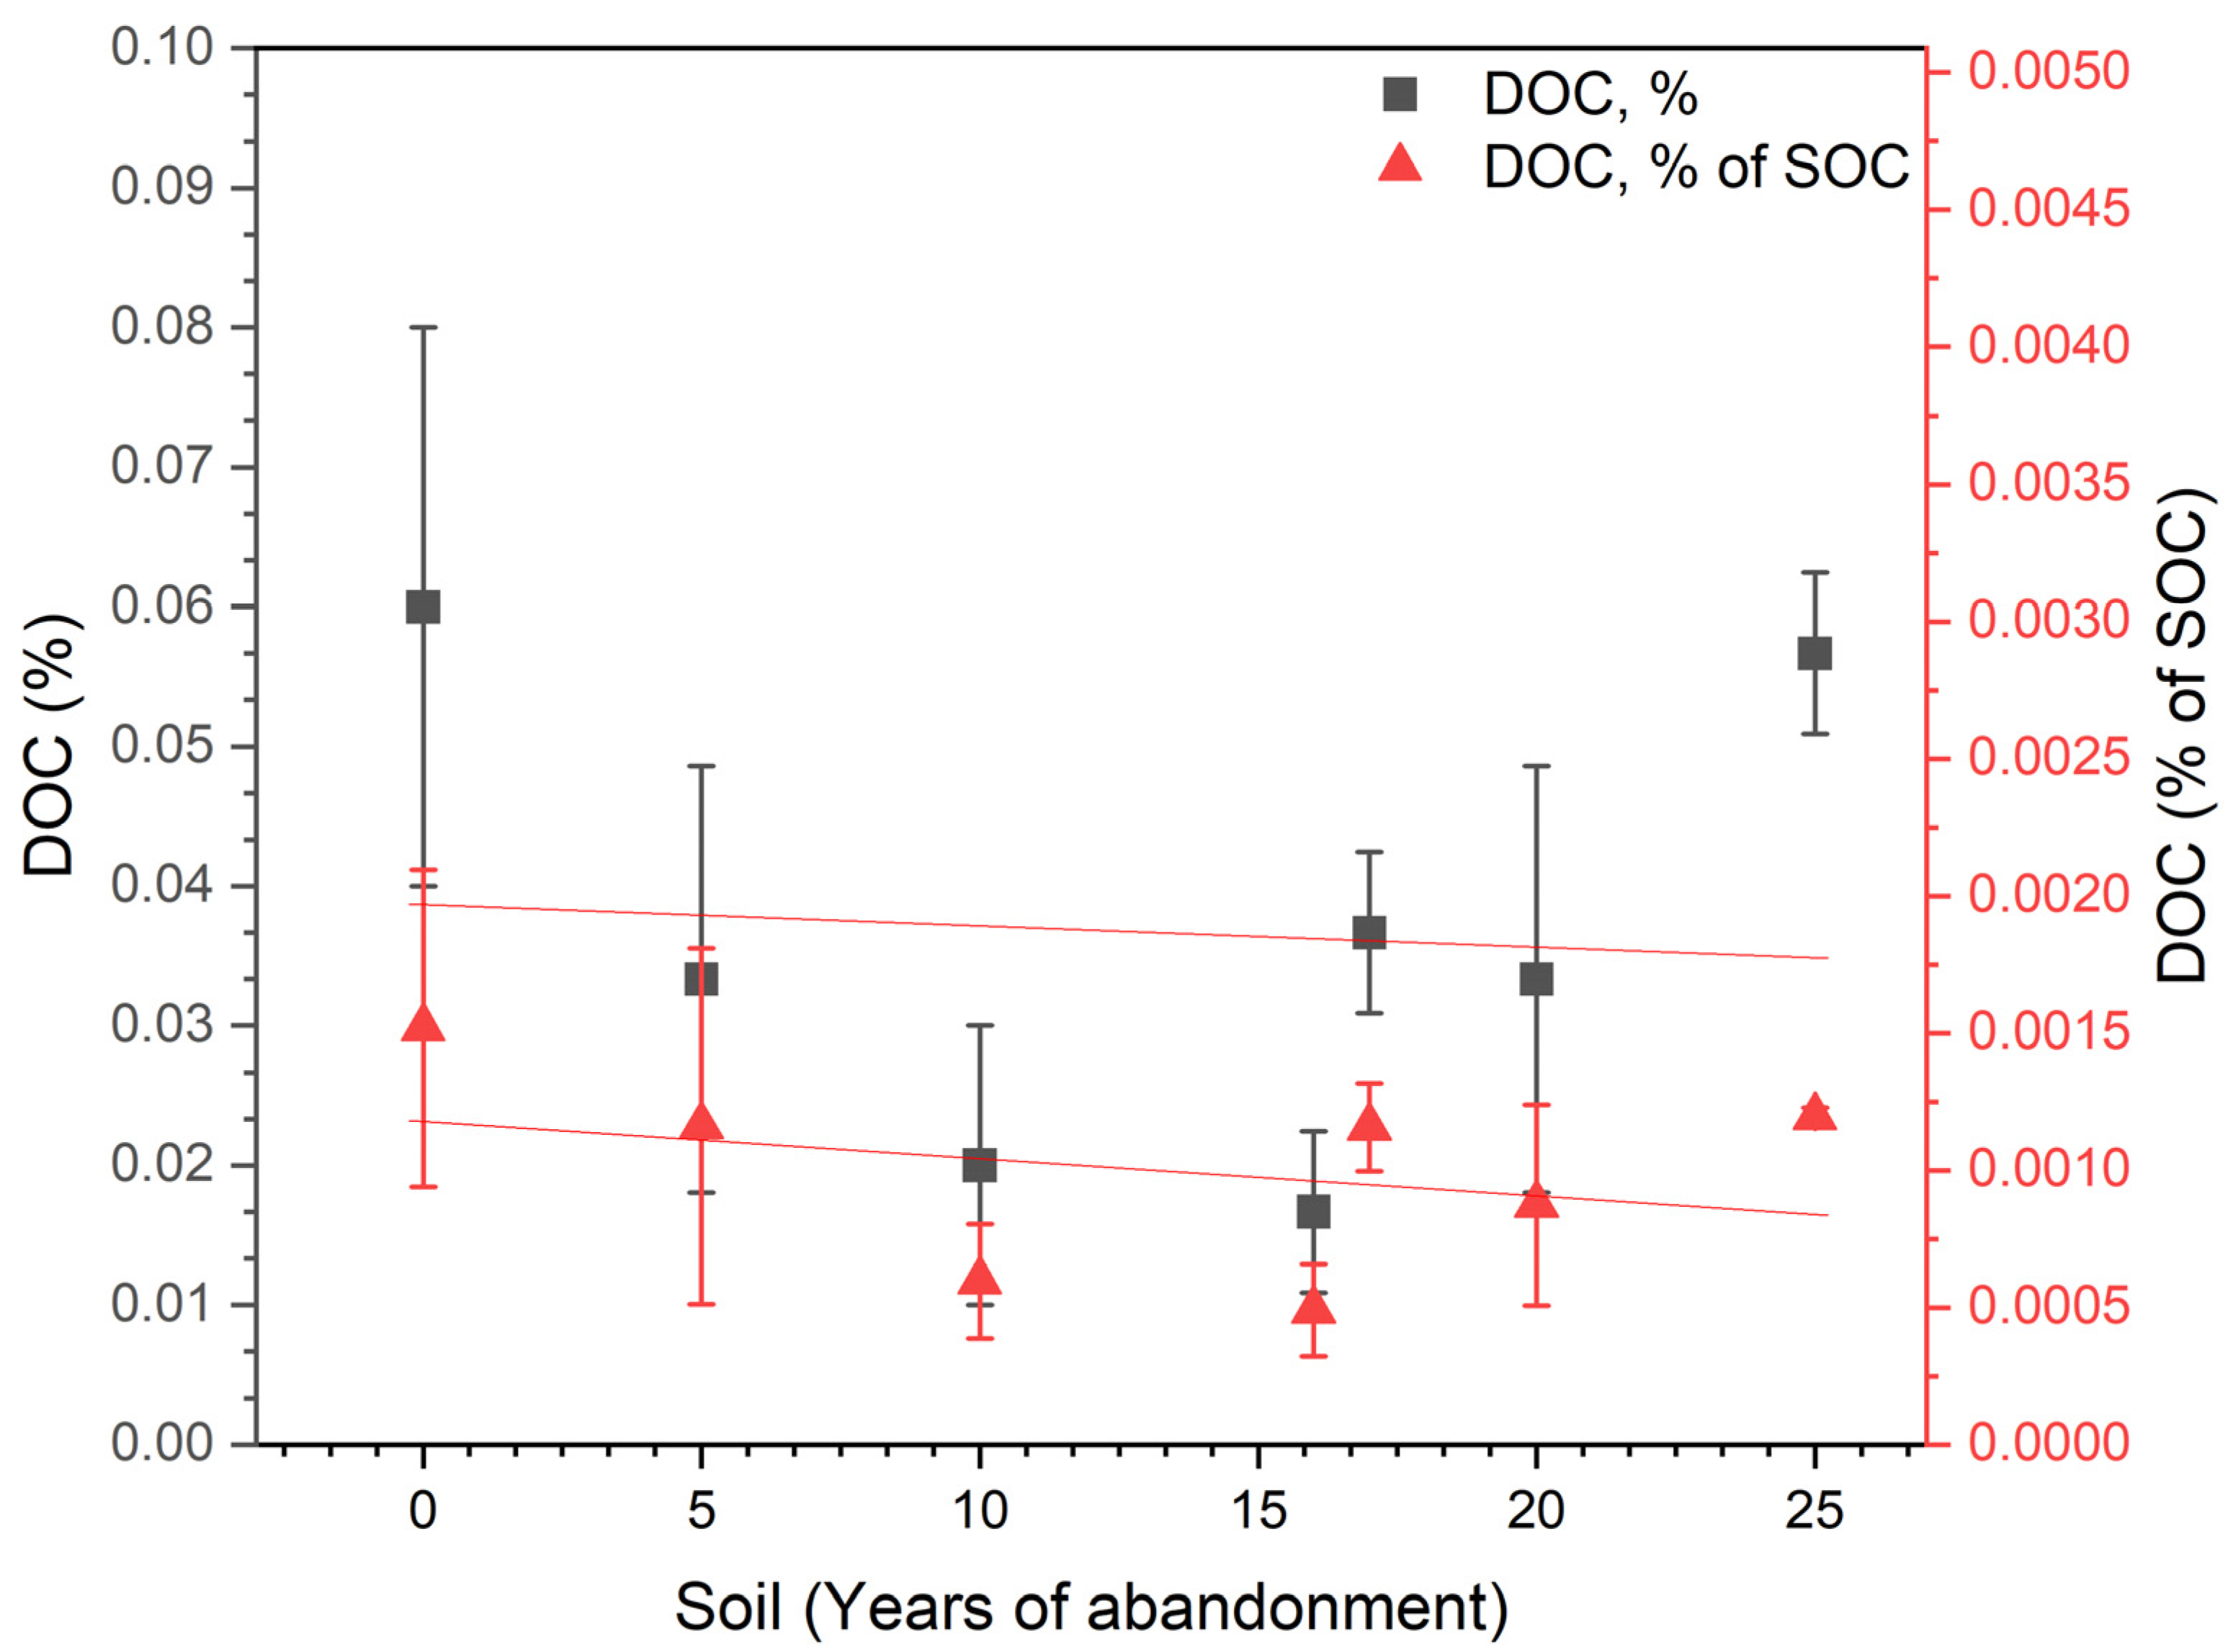
| DOC | Dissolved Organic Compounds in SOC |
| PCA | Principal Component Analysis |
| CV | Coefficient of Variation |
Appendix A

| Soil | BD | Clay | pH | SOC | TN | C:N | P | K | N-NH4 | N-NO3 |
|---|---|---|---|---|---|---|---|---|---|---|
| Units | g cm−3 | % | - | % | % | - | mg kg−1 | mg kg−1 | mg kg−1 | mg kg−1 |
| S5 | 1.07 | 5.26 ± 0.26 | 4.4 ± 0.2 | 2.73 ± 0.07 | 0.17 ± 0.01 | 18.63 ± 1.28 | 1115.67 ± 22.94 | 1145.33 ± 20.13 | 302.41 ± 19.95 | 16.70 ± 2.01 |
| S6 | 1.20 | 7.53 ± 0.20 | 4.3 ± 0.2 | 3.86 ± 0.16 | 0.18 ± 0.01 | 25.54 ± 1.23 | 322.67 ± 6.81 | 43.67 ± 1.53 | 15.92 ± 9.26 | 12.54 ± 3.02 |
| S8 | 1.12 | 7.00 ± 0.35 | 5.3 ± 0.1 | 2.95 ± 0.05 | 0.15 ± 0.01 | 22.74 ± 1.50 | 944.33 ± 32.01 | 55.33 ± 5.03 | 9.01 ± 0.56 | 0.61 ± 0.21 |
| S4 | 1.18 | 7.81 ± 0.46 | 4.5 ± 0.5 | 2.81 ± 0.04 | 0.13 ± 0.01 | 25.71 ± 0.74 | 248.00 ± 25.94 | 37.00 ± 5.20 | 12.85 ± 0.99 | 0.81 ± 0.25 |
| S2 | 1.12 | 10.38 ± 0.34 | 4.0 ± 0.2 | 3.15 ± 0.02 | 0.15 ± 0.01 | 24.55 ± 0.19 | 365.67 ± 16.26 | 40.67 ± 2.52 | 12.50 ± 0.53 | 1.42 ± 0.31 |
| S3 | 0.98 | 10.70 ± 0.60 | 4.2 ± 0.1 | 2.80 ± 0.03 | 0.13 ± 0.01 | 24.40 ± 0.86 | 409.00 ± 6.24 | 46.67 ± 14.50 | 17.39 ± 0.75 | 0.28 ± 0.07 |
| S1 | 1.29 | 12.46 ± 0.88 | 4.1 ± 0.1 | 2.21 ± 0.06 | 0.12 ± 0.01 | 22.09 ± 0.18 | 215.33 ± 11.50 | 50.67 ± 6.51 | 14.31 ± 0.43 | 1.05 ± 0.61 |
| S10 | 1.25 | 14.80 ± 1.03 | 4.8 ± 0.3 | 3.67 ± 0.14 | 0.22 ± 0.01 | 19.78 ± 0.79 | 977.33 ± 29.87 | 80.33 ± 9.07 | 13.62 ± 0.63 | 32.32 ± 1.78 |
References
- Joshi, R.K.; Garkoti, S.C.; Gupta, R.; Kumar, S.; Mishra, A.; Kumar, M. Recovery of soil microbial biomass, stoichiometry, and herb-layer diversity with chronosequence of farmland land abandonment in the central Himalayas, India. Restor. Ecol. 2023, 31, e13782. [Google Scholar]
- Levers, C.; Schneider, M.; Prishchepov, A.V.; Estel, S.; Kuemmerle, T. Spatial variation in determinants of agricultural land abandonment in Europe. Sci. Total Environ. 2018, 644, 95–111. [Google Scholar] [PubMed]
- Zhou, J.; Sun, T.; Shi, L.; Kurganova, I.; de Gerenyu, V.L.; Kalinina, O.; Giani, L.; Kuzyakov, Y. Organic carbon accumulation and microbial activities in arable soils after abandonment: A chronosequence study. Geoderma 2023, 435, 116496. [Google Scholar]
- Kalinina, O.; Cherkinsky, A.; Chertov, O.; Goryachkin, S.; Kurganova, I.; de Gerenyu, V.L.; Lyuri, D.; Kuzyakov, Y.; Giani, L. Post-agricultural restoration: Implications for dynamics of soil organic matter pools. Catena 2019, 181, 104096. [Google Scholar] [CrossRef]
- Cramer, V.A.; Hobbs, R.J.; Standish, R.J. What’s new about old fields? Land abandonment and ecosystem assembly. Trends Ecol. Evol. 2008, 23, 104–112. [Google Scholar]
- Yang, Y.; Hobbie, S.E.; Hernandez, R.R.; Fargione, J.; Grodsky, S.M.; Tilman, D.Y.; Zhu, G.; Luo, Y.; Smith, T.M.; Jungers, J.M.; et al. Restoring abandoned farmland to mitigate climate change on a full earth. One Earth 2020, 3, 176–186. [Google Scholar]
- Żarczyński, P.J.; Krzebietke, S.J.; Sienkiewicz, S.; Wierzbowska, J. The Role of Fallows in Sustainable Development. Agriculture 2023, 13, 2174. [Google Scholar] [CrossRef]
- Kozak, M.; Pudełko, R. Impact Assessment of the Long-Term Fallowed Land on Agricultural Soils and the Possibility of Their Return to Agriculture. Agriculture 2021, 11, 148. [Google Scholar] [CrossRef]
- Lasanta, T.; Arnáez, J.; Pascual, N.; Ruiz-Flaño, P.; Errea, M.P.; Lana-Renault, N. Space–time process and drivers of land abandonment in Europe. Catena 2017, 149, 810–823. [Google Scholar]
- Beillouin, D.; Corbeels, M.; Demenois, J.; Berre, D.; Boyer, A.; Fallot, A.; Feder, F.; Cardinael, R. A global meta-analysis of soil organic carbon in the Anthropocene. Nat. Commun. 2023, 14, 3700. [Google Scholar]
- Poeplau, C.; Don, A. Carbon sequestration in agricultural soils via cultivation of cover crops—A meta-analysis. Agric. Ecosyst. Environ. 2015, 200, 33–41. [Google Scholar]
- Qin, W.; Wang, K.; Min, K.; Zhang, Y.; Wang, Z.; Liu, X. Agricultural land abandonment promotes soil aggregation and aggregate-associated organic carbon accumulation: A global meta-analysis. Plant Soil 2024, 503, 629–644. [Google Scholar]
- Nizamutdinov, T.; Yang, S.; Abakumov, E. Post-Agricultural Shifts in Soils of Subarctic Environment on the Example of Plaggic Podzols Chronosequence. Agronomy 2025, 15, 584. [Google Scholar] [CrossRef]
- Abakumov, E.; Morgun, E.; Pechkin, A.; Polyakov, V. Abandoned agricultural soils from the central part of the Yamal region of Russia: Morphology, diversity, and chemical properties. Open Agric. 2020, 5, 94–106. [Google Scholar]
- Desyatkin, A.R.; Iwasaki, S.; Desyatkin, R.V.; Hatano, R. Changes of Soil C Stock under Establishment and Abandonment of Arable Lands in Permafrost Area—Central Yakutia. Atmosphere 2018, 9, 308. [Google Scholar] [CrossRef]
- Deng, L.; Zhu, G.; Tang, Z.; Shangguan, Z. Global patterns of the effects of land-use changes on soil carbon stocks. Glob. Ecol. Conserv. 2016, 5, 127–138. [Google Scholar]
- Xiong, X.; Grunwald, S.; Myers, D.B.; Ross, C.W.; Harris, W.G.; Comerford, N.B. Interaction effects of climate and land use/land cover change on soil organic carbon sequestration. Sci. Total Environ. 2014, 493, 974–982. [Google Scholar]
- Davidson, E.A.; Janssens, I.A. Temperature Sensitivity of Soil Carbon Decomposition and Feedbacks to Climate Change. Nature 2006, 440, 165–173. [Google Scholar]
- Rodrigues, C.I.D.; Brito, L.M.; Nunes, L.J.R. Soil Carbon Sequestration in the Context of Climate Change Mitigation: A Review. Soil Syst. 2023, 7, 64. [Google Scholar] [CrossRef]
- Hoffland, E.; Kuyper, T.W.; Comans, R.N.J.; Creamer, R.E. Eco-functionality of organic matter in soils. Plant Soil 2020, 455, 1–22. [Google Scholar]
- Li, J.; Ramires, G.H.; Kiani, M.; Quideau, S.; Smith, E.; Janzen, H.; Larney, F.; Puurveen, D. Soil organic matter dynamics in long-term temperate agroecosystems: Rotation and nutrient addition effects. Can. J. Soil Sci. 2018, 98, 232–245. [Google Scholar]
- Lal, R. Soil carbon sequestration impacts on global climate change and food security. Science 2004, 304, 1623–1627. [Google Scholar]
- Schmidt, M.W.I.; Torn, M.S.; Abiven, S.; Dittmar, T.; Guggenberger, G.; Janssens, I.A.; Kleber, M.; Kögel-Knabner, I.; Lehmann, J.; Manning, D.A.C. Persistence of soil organic matter as an ecosystem property. Nature 2011, 478, 49–56. [Google Scholar]
- White, D.M.; Garland, D.S.; Ping, C.L.; Michaelson, G. Characterizing soil organic matter quality in arctic soil by cover type and depth. Cold Reg. Sci. Technol. 2004, 38, 63–73. [Google Scholar]
- Nizamutdinov, T.; Zhemchueva, D.; Zverev, A.; Andronov, E.; Pechkin, A.; Abakumov, E. Agropedogenesis and related changes in morphology, fertility and microbiome diversity of soils in cryogenic ecosystems on the example of the central part of Yamal region (West Siberia). Geoderma 2024, 449, 117014. [Google Scholar]
- Mosa, A.A.; Taha, A.; Elsaeid, M. Agro-environmental applications of humic substances: A critical review. Egypt. J. Soil Sci. 2020, 60, 207–220. [Google Scholar]
- Hugelius, G.; Strauss, J.; Zubrzycki, S.; Harden, J.W.; Schuur, E.A.; Ping, C.-L.; Schirrmeister, L.; Grosse, G.; Michaelson, G.J.; Koven, C.D. Estimated stocks of circumpolar permafrost carbon with quantified uncertainty ranges and identified data gaps. Biogeosciences 2014, 11, 6573–6593. [Google Scholar]
- Unc, A.; Altdorff, D.; Abakumov, E.; Adl, S.; Baldursson, S.; Bechtold, M.; Cattani, D.J.; Firbank, L.G.; Grand, S.; Guðjónsdóttir, M.; et al. Expansion of Agriculture in Northern Cold-Climate Regions: A Cross-Sectoral Perspective on Opportunities and Challenges. Front. Sustain. Food Syst. 2021, 5, 663448. [Google Scholar]
- Altdorff, D.; Borchard, N.; Young, E.H.; Galagedara, L.; Sorvali, J.; Quideau, S.; Unc, A. Agriculture in boreal and Arctic regions requires an integrated global approach for research and policy. Agron. Sustain. Dev. 2021, 41, 23. [Google Scholar]
- Poeplau, C.; Schroeder, J.; Gregorich, E.; Kurganova, I. Farmers’ Perspective on Agriculture and Environmental Change in the Circumpolar North of Europe and America. Land 2019, 8, 190. [Google Scholar] [CrossRef]
- Schroeder, J.; Peplau, T.; Pennekamp, F.; Gregorich, E.; Tebbe, C.C.; Poeplau, C. Deforestation for agriculture increases microbial carbon use efficiency in subarctic soils. Biol. Fertil. Soils 2024, 60, 17–34. [Google Scholar] [CrossRef]
- Alekseeva, L.V. The Formation of Polar Agriculture in the USSR (Based on the Materials of Yamal). Bull. Nizhnevartovsk State Univ. 2017, 2, 3–10. (In Russian) [Google Scholar]
- Nizamutdinov, T.; Abakumov, E.; Morgun, E.; Loktev, R.; Kolesnikov, R. Agrochemical and Pollution Status of Urbanized Agricultural Soils in the Central Part of Yamal Region. Energies 2021, 14, 4080. [Google Scholar] [CrossRef]
- Doetterl, S.; Berhe, A.A.; Heckman, K.; Lawrence, C.; Schnecker, J.; Vargas, R.; Vogel, C.; Wagai, R. A landscape-scale view of soil organic matter dynamics. Nat. Rev. Earth Environ. 2025, 6, 67–81. [Google Scholar] [CrossRef]
- Nizamutdinov, T.I.; Suleymanov, A.R.; Morgun, E.N.; Dinkelaker, N.V.; Abakumov, E.V. Ecotoxicological analysis of fallow soils at the Yamal experimental agricultural station. Food Process. Tech. Technol. 2022, 52, 350–360. [Google Scholar] [CrossRef]
- Herndon, E.M.; Yang, Z.; Bargar, J.; Janot, N.; Regier, T.Z.; Graham, D.E.; Liang, L. Geochemical drivers of organic matter decomposition in arctic tundra soils. Biogeochemistry 2015, 126, 397–414. [Google Scholar] [CrossRef]
- Abakumov, E.; Zverev, A.; Morgun, E.; Alekseev, I. Microbiome of Abandoned Agricultural and Mature Tundra Soils in Southern Yamal Region. Russian Arctic. Open Agric. 2020, 5, 335–344. [Google Scholar] [CrossRef]
- Jastrow, J.D.; Miller, R.M. Soil aggregate stabilisation and carbon sequestration: Feedbacks through organomineral associations. In Soil Processes and the Carbon Cycle; Lal, R., Kimble, J.M., Follett, R.F., Stewart, B.A., Eds.; CRC Press: Boca Raton, FL, USA, 1997; pp. 207–223. [Google Scholar]
- Dignac, M.-F.; Derrien, D.; Barre, P.; Barot, S.; Cécillon, L.; Chenu, C.; Chevallier, T.; Freschet, G.T.; Garnier, P.; Guenet, B.; et al. Increasing soil carbon storage: Mechanisms, effects of agricultural practices and proxies. A review. Agron. Sustain. Dev. 2017, 37, 14. [Google Scholar] [CrossRef]
- Ondrasek, G.; Begic, H.B.; Zovko, M.; Filipović, L.; Meriño-Gergichevich, C.; Savić, R.; Rengel, Z. Biogeochemistry of soil organic matter in agroecosystems & environmental implications. Sci. Total Environ. 2019, 658, 1559–1573. [Google Scholar]
- Crews, T.E.; Rumsey, B.E. What Agriculture Can Learn from Native Ecosystems in Building Soil Organic Matter: A Review. Sustainability 2017, 9, 578. [Google Scholar] [CrossRef]
- Semenov, V.M.; Tulina, A.S.; Semenova, N.A.; Ivannikova, L.A. Humification and nonhumification pathways of the organic matter stabilization in soil: A review. Eurasian Soil Sci. 2013, 46, 355–368. [Google Scholar] [CrossRef]
- Lützow, M.; Kögel-Knabner, I.; Ekschmitt, K.; Matzner, E.; Guggenberger, G.; Marschner, B.; Flessa, H. Stabilization of organic matter in temperate soils: Mechanisms and their relevance under different soil conditions—A review. Eur. J. Soil Sci. 2006, 57, 426–445. [Google Scholar] [CrossRef]
- Haddaway, N.R.; Hedlund, K.; Jackson, L.E.; Kätterer, T.; Lugato, E.; Thomsen, I.K.; Jørgensen, H.B.; Isberg, P.-E. How does tillage intensity affect soil organic carbon? A systematic review. Environ. Evid. 2017, 6, 30. [Google Scholar]
- Lodygin, E.; Abakumov, E. The Use of Spectroscopic Methods to Study Organic Matter in Virgin and Arable Soils: A Scoping Review. Agronomy 2024, 14, 1003. [Google Scholar] [CrossRef]
- Baldock, J.A.; Oades, J.M.; Nelson, P.N.; Skene, T.M.; Golchin, A.; Clarke, P. Assessing the extent of decomposition of natural organic materials using solid-state 13C NMR spectroscopy. Aust. J. Soil Res. 1997, 35, 1061–1083. [Google Scholar] [CrossRef]
- Audette, Y.; Congreves, K.A.; Schneider, K.; Zaro, G.C.; Nunes, A.L.P.; Zhang, H.; Voroney, R.P. The effect of agroecosystem management on the distribution of C functional groups in soil organic matter: A review. Biol. Fertil. Soils 2021, 57, 881–894. [Google Scholar] [PubMed]
- Chukov, S.N.; Lodygin, E.D.; Abakumov, E.V. Application of 13C NMR spectroscopy to the study of soil organic matter: A review of publications. Eurasian Soil Sci. 2018, 51, 889–900. [Google Scholar]
- Kögel-Knabner, I.; Guggenberger, G.; Kleber, M.; Kandeler, E.; Kalbitz, K.; Scheu, S.; Eusterhues, K.; Leinweber, P. Organo-mineral associations in temperate soils: Integrating biology, mineralogy, and organic matter chemistry. J. Plant Nutr. Soil Sci. 2008, 171, 61–82. [Google Scholar]
- Suleymanov, A.; Nizamutdinov, T.; Morgun, E.; Abakumov, E. Evaluation and Spatial Variability of Cryogenic Soil Properties (Yamal-Nenets Autonomous District, Russia). Soil Syst. 2022, 6, 65. [Google Scholar] [CrossRef]
- Tikhanovsky, A.N. Potatoes in Yamal. In Novosibirsk; Publishing House “Akademizdat”: Moscow, Russia, 2021; 160p. (In Russian) [Google Scholar]
- IUSS Working Group WRB. World Reference Base for Soil Resources. International Soil Classification System for Naming Soils and Creating Legends for Soil Maps, 4th ed.; IUSS: Vienna, Austria, 2022. [Google Scholar]
- Bahadori, M.; Chen, C.; Lewis, S.; Boyd, S.; Rashti, M.R.; Esfandbod, M.; Garzon-Garcia, A.; Van Zwieten, L.; Kuzyakov, Y. Soil organic matter formation is controlled by the chemistry and bioavailability of organic carbon inputs across different land uses. Sci. Total Environ. 2021, 770, 145307. [Google Scholar]
- Mathers, N.J.; Xu, Z.H.; Berners-Price, S.J.; Perera, S.; Saffigna, P.G. Hydrofluoric acid pre-treatment for improving 13C CPMAS NMR spectral quality of forest soils in southeast Queensland, Australia. Aust. J. Soil Res. 2002, 40, 655–674. [Google Scholar]
- Pizzanelli, S.; Calucci, L.; Forte, C.; Borsacchi, S. Studies of Organic Matter in Composting, Vermicomposting, and Anaerobic Digestion by 13C Solid-State NMR Spectroscopy. Appl. Sci. 2023, 13, 2900. [Google Scholar] [CrossRef]
- Vanchikova, E.V.; Shamrikova, E.V.; Sytar, T.S.; Kazakov, V.G. A new method to determine the carbon content of water-soluble organic compounds in soils. Eurasian Soil Sci. 2006, 39, 1084–1088. [Google Scholar]
- FAO. Standard Operating Procedure for Soil Organic Carbon. Walkley-Black Method: Titration and Colorimetric Method; FAO: Rome, Italy, 2019. [Google Scholar]
- Maskalchuk, L.N.; Baklai, A.A.; Leont’eva, T.G.; Makovskaya, N.A. Removal of Cesium Radionuclides from Aqueous Media with an Aluminosilicate Sorbent Prepared from Belaruskalii Production Waste. Radiochemistry 2019, 61, 459–463. [Google Scholar]
- Elemile, O.O.; Ibitogbe, E.M.; Folorunso, O.P.; Ejiboye, P.O.; Adewumi, J.R. Principal component analysis of groundwater sources pollution in Omu-Aran community, Nigeria. Environmental Sciences, 80:690. Environ. Earth Sci. 2021, 80, 16. [Google Scholar]
- Faloye, O.T.; Ajayi, A.E.; Kamchoom, V.; Akintola, O.A.; Oguntunde, P.G. Evaluating Impacts of Biochar and Inorganic Fertilizer Applications on Soil Quality and Maize Yield Using Principal Component Analysis. Agronomy 2024, 14, 1761. [Google Scholar] [CrossRef]
- Lodygin, E.; Beznosikov, V.; Abakumov, E. Humic substances elemental composition of selected taiga and tundra soils from Russian European North-East. Pol. Polar Res. 2017, 38, 125–147. [Google Scholar] [CrossRef]
- Nadal-Romero, E.; Rubio, P.; Kremyda, V.; Absalah, S.; Cammeraat, E.; Jansen, B.; Lasanta, T. Effects of agricultural land abandonment on soil organic carbon stocks and composition of soil organic matter in the Central Spanish Pyrenees. Catena 2021, 205, 105441. [Google Scholar]
- Raiesi, F. Soil properties and C dynamics in abandoned and cultivated farmlands in a semi-arid ecosystem. Plant Soil 2012, 351, 161–175. [Google Scholar] [CrossRef]
- Filimonenko, E.; Kurganova, I.; Uporova, M.; de Gerenyu, V.L.; Sokolova, L.; Zorina, S.; Dorofeev, N.; Maltseva, A.; Soldatova, E.; Gershelis, E.; et al. Energy storage and stability of soil organic matter during the natural restoration of abandoned cropland. Agric. Ecosyst. Environ. 2024, 375, 109198. [Google Scholar]
- Balesdent, J.; Chenu, C.; Balabane, M. Relationship of soil organic matter dynamics to physical protection and tillage. Soil Tillage Res. 2000, 53, 215–230. [Google Scholar] [CrossRef]
- Amelung, W.; Zech, W.; Flach, K. Climatic effects on soil organic matter composition in the Great Plains. Soil Sci. Soc. Am. J. 1997, 61, 115–123. [Google Scholar] [CrossRef]
- Mani, S.; Merino, A.; García-Oliva, F.; Riotte, J.; Sukumar, R. Soil properties and organic matter quality in relation to climate and vegetation in southern Indian tropical ecosystems. Soil Res. 2018, 56, 80–90. [Google Scholar] [CrossRef]
- Wasner, D.; Abramoff, R.; Griepentrog, M.; Venegas, E.Z.; Boeckx, P.; Doetterl, S. The role of climate, mineralogy and stable aggregates. Glob. Biogeochem. Cycles 2024, 38, e2023GB007934. [Google Scholar] [CrossRef]
- Kleber, M.; Bourg, I.C.; Coward, E.K.; Hansel, C.M.; Myneni, S.C.; Nunan, N. Dynamic interactions at the mineral–organic matter interface. Nat. Rev. Earth Environ. 2021, 2, 402–421. [Google Scholar] [CrossRef]
- Liang, C.; Schimel, J.P.; Jastrow, J.D. The importance of anabolism in microbial control over soil carbon storage. Nat. Microbiol. 2017, 2, 17105. [Google Scholar] [CrossRef]
- Basile-Doelsch, I.; Balesdent, J.; Pellerin, S. Reviews and syntheses: The mechanisms underlying carbon storage in soil. Biogeosciences 2020, 17, 5223–5242. [Google Scholar] [CrossRef]
- Six, J.; Bossuyt, H.; Degryze, S.; Denef, K. A history of research on the link between (micro) aggregates, soil biota, and soil organic matter dynamics. Soil Tillage Res. 2004, 79, 7–31. [Google Scholar] [CrossRef]
- Nadporozhskaya, M.A.; Bykhovets, S.S.; Nizamutdinov, T.I.; Morgun, E.N.; Abakumov, E.V. Analysis of organic matter stock dynamics in arable soils of Yamal: Simulation experiments with the ROMUL model. Dokuchaev Soil Bull. 2024, 120, 48–83. [Google Scholar] [CrossRef]
- Singh, M.; Sarkar, B.; Sarkar, S.; Churchman, J.; Bolan, N.; Mandal, S.; Menon, M.; Purakayastha, T.J.; Beerling, D.J. Stabilization of Soil Organic Carbon as Influenced by Clay Mineralogy. In Advances in Agronomy; Elsevier: Amsterdam, The Netherlands, 2018; Volume 148, pp. 33–84. ISBN 978-0-12-815179-2. [Google Scholar]
- Li, H.; Parent, L.E.; Karam, A.; Tremblay, C. Potential of sphagnum peat for improving soil organic matter, water holding capacity, bulk density and potato yield in a sandy soil. Plant Soil 2004, 265, 355–365. [Google Scholar] [CrossRef]
- Szajdak, L.W.; Jezierski, A.; Wegner, K.; Meysner, T.; Szczepański, M. Influence of Drainage on Peat Organic Matter: Implications for Development, Stability, and Transformation. Molecules 2020, 25, 2587. [Google Scholar] [CrossRef] [PubMed]
- Ostrowska, A.; Porębska, G. Assessment of the C/N ratio as an indicator of the decomposability of organic matter in forest soils. Ecol. Ind. 2015, 49, 104–109. [Google Scholar]
- van der Sloot, M.; Kleijn, D.; De Deyn, G.B.; Limpens, J. Carbon to nitrogen ratio and quantity of organic amendment interactively affect crop growth and soil mineral N retention. Crop Environ. 2022, 1, 161–167. [Google Scholar]
- Lehmann, J.; Hansel, C.M.; Kaiser, C.; Kleber, M.; Maher, K.; Manzoni, S.; Nunan, N.; Reichstein, M.; Schimel, J.P.; Torn, M.S.; et al. Persistence of Soil Organic Carbon Caused by Functional Complexity. Nat. Geosci. 2020, 13, 529–534. [Google Scholar]
- Yeasmin, S.; Singh, B.; Johnston, C.T.; Sparks, D.L. Organic carbon characteristics in density fractions of soils with contrasting mineralogies. Geochim. Cosmochim. Acta 2017, 218, 215–236. [Google Scholar]
- Grandy, A.S.; Robertson, G.P. Land-use intensity effects on soil organic carbon accumulation rates and mechanisms. Ecosystems 2007, 10, 58–73. [Google Scholar]
- Gupta, N.S.; Michels, R.; Briggs, D.E.; Collinson, M.E.; Evershed, R.P.; Pancost, R.D. Experimental evidence for the formation of geomacromolecules from plant leaf lipids. Org. Geochem. 2007, 38, 28–36. [Google Scholar]
- Rumpel, C.; Seraphin, A.; Goebel, M.O.; Wiesenberg, G.; Gonzales--Vila, F.; Bachmann, J.; Schwark, L.; Michaelis, W.; Mariotti, A.; Kögel--Knabner, I. Alkyl C and hydrophobicity in B and C horizons of an acid forest soil. J. Plant Nutr. Soil Sci. 2004, 167, 685–692. [Google Scholar]
- Höfle, S.; Rethemeyer, J.; Mueller, C.W.; John, S. Organic matter composition and stabilization in a polygonal tundra soil of the Lena Delta. Biogeosciences 2013, 10, 3145–3158. [Google Scholar]
- Wild, B.; Gentsch, N.; Čapek, P.; Diáková, K.; Alves, R.J.E.; Bárta, J.; Gittel, A.; Hugelius, G.; Knoltsch, A.; Kuhry, P.; et al. Plant-derived compounds stimulate the decomposition of organic matter in arctic permafrost soils. Sci. Rep. 2016, 6, 25607. [Google Scholar]
- Sonsri, K.; Mitsuboshi, M.; Watanabe, A. Stabilization mechanisms of organic matter in Andosols under long-term fertilization as revealed from structural, molecular, and stable isotopic signatures. J. Soils Sediments 2024, 24, 47–59. [Google Scholar]
- Kurganova, I.; Merino, A.; Lopes de Gerenyu, V.O.; Barros, N.; Kalinina, O.; Giani, L.; Kuzyakov, Y. Mechanisms of carbon sequestration and stabilization by restoration of arable soils after abandonment: A chronosequence study on Phaeozems and Chernozems. Geoderma 2019, 15, 113882. [Google Scholar]
- Grgas, D.; Rukavina, M.; Bešlo, D.; Štefanac, T.; Crnek, V.; Šikić, T.; Habuda-Stanić, M.; Landeka Dragičević, T. The Bacterial Degradation of Lignin—A Review. Water 2023, 15, 1272. [Google Scholar] [CrossRef]
- Hussain, M.B.; Al-Hadidi, S.H.; Erfanian, M.B.; Yahia, M.N.D.; Mullungal, M.N.; Alsafran, M.; Bai, Y.; Alatalo, J.M. Photodegradation and Its Effect on Plant Litter Decomposition in Terrestrial Ecosystems: A Systematic Review. Soil Syst. 2023, 7, 6. [Google Scholar] [CrossRef]
- Liu, M.; Zheng, S.; Pendall, E.; Smith, P.; Liu, J.; Li, J.; Fang, C.; Li, B.; Nie, M. Unprotected carbon dominates decadal soil carbon increase. Nat. Commun. 2025, 16, 2008. [Google Scholar] [PubMed]
- Ozlu, E.; Arriaga, F.J. The role of carbon stabilization and minerals on soil aggregation in different ecosystems. Catena 2021, 202, 105303. [Google Scholar]
- Nthebere, K.; Prakash, T.R.; Kumar, N.V.; Yadav, M.B.N. Capability of conservation agriculture for preservation of organic carbon and succeeding effect on soil properties and productivity-a review. Arch. Agron. Soil Sci. 2024, 70, 1–28. [Google Scholar]
- Li, J.; Zhao, J.; Liao, X.; Hu, P.; Wang, W.; Ling, Q.; Xie, L.; Xiao, J.; Zhang, W.; Wang, K. Pathways of soil organic carbon accumulation are related to microbial life history strategies in fertilized agroecosystems. Sci. Total Environ. 2024, 927, 172191. [Google Scholar]
- Matzner, E.; Borken, W. Do freeze-thaw events enhance C and N losses from soils of different ecosystems? A review. Eur. J. Soil Sci. 2008, 59, 274–284. [Google Scholar]
- Debicka, M.; Kocowicz, A.; Weber, J.; Jamroz, E. Organic matter effects on phosphorus sorption in sandy soils. Arch. Agron. Soil Sci. 2016, 62, 840–855. [Google Scholar]
- Hobbie, S.E.; Schimel, J.P.; Trumbore, S.E.; Randerson, J.R. Controls over Carbon Storage and Turnover in High-latitude Soils. Glob. Change Biol. 2000, 6, 196–210. [Google Scholar]
- Sollins, P.; Kramer, M.G.; Swanston, C.; Lajtha, K.; Filley, T.; Aufdenkampe, A.K.; Wagai, R.; Bowden, R.D. Sequential density fractionation across soils of contrasting mineralogy: Evidence for both microbial- and mineral-controlled soil organic matter stabilization. Biogeochemistry 2009, 96, 209–231. [Google Scholar]
- Heikkinen, J.; Ketoja, E.; Nuutinen, V.; Regina, K. Declining trend of carbon in Finnish cropland soils in 1974–2009. Glob. Change Biol. 2013, 19, 1456–1469. [Google Scholar]
- Aerts, R. The freezer defrosting: Global warming and litter decomposition rates in cold biomes. J. Ecol. 2006, 94, 713–724. [Google Scholar]
- Routh, J.; Hugelius, G.; Kuhry, P.; Filley, T.; Tillman, P.K.; Becher, M.; Crill, P. Multi-proxy study of soil organic matter dynamics in permafrost peat deposits reveal vulnerability to climate change in the European Russian Arctic. Chem. Geol. 2014, 368, 104–117. [Google Scholar]
- Walz, J.; Knoblauch, C.; Böhme, L.; Pfeiffer, E. Regulation of soil organic matter decomposition in permafrost-affected Siberian tundra soils—Impact of oxygen availability, freezing and thawing, temperature, and labile organic matter. Soil Biol. Biochem. 2017, 110, 34–43. [Google Scholar]


| Sample Code | ||||||||
|---|---|---|---|---|---|---|---|---|
| S5 | S6 | S8 | S4 | S2 | S3 | S1 | S10 | S11 |
| Soil according to WRB 2022 [52] | ||||||||
| Hortic Podzol (Arenic, Cordic) | Plaggic Albic Podzol (Arenic, Cordic) | Plaggic Ortsteinic Podzol (Arenic) | Plaggic Turbic Gleyic Ortsteinic Podzol (Arenic) | Plaggic Turbic Ortsteinic Podzol (Siltic) | Plaggic Podzol (Siltic, Cordic) | Plaggic Ortsteinic Podzol (Siltic) | Plaggic Podzol (Turbic) | Histic Entic Podzol (Folic) |
| Age of abandonment | ||||||||
| 0 | 5 | 10 | 16 | 17 | 20 | 25 | YAS * | Mature |
| Sampling site coordinates (WGS 84) | ||||||||
| N66.5067° E66.6920° | N66.5069° E66.6984° | N66.5132° E66.6938° | N66.5030° E66.7004° | N66.5016° E66.6976° | N66.5020° E66.6912° | N66.4977° E66.6911° | N66.5266° E66.6552° | N66.5169° E66.6967° |
| Demineralized Sample (n = 3) | ||||||||
|---|---|---|---|---|---|---|---|---|
| S5 | S6 | S8 | S4 | S2 | S3 | S1 | S10 | S11 |
| Ash, % (mean ± SD) | ||||||||
| 34.5 ± 0.4 | 22.1 ± 0.8 | 33.8 ± 0.0 | 31.6 ± 0.1 | 28.1 ± 0.5 | 27.7 ± 0.8 | 41.9 ± 0.1 | 29.3 ± 0.0 | 0.8 ± 0.1 |
| Sample | Age | Functional Groups of C | Integral Indexes | ||||||||
|---|---|---|---|---|---|---|---|---|---|---|---|
| Alcyl | N-alkyl | O-alkyl | Aryl | O-aryl | Carboxyl | Carbonyl | ARM | HB/HI | A/A-O | ||
| Chemical Shifts from 13C, % | |||||||||||
| 0–45 | 45–60 | 60–110 | 110–140 | 140–160 | 160–190 | 190–220 | |||||
| S5 | 0 | 40.88 | 5.75 | 20.61 | 12.45 | 5.75 | 10.93 | 3.61 | 0.21 | 1.44 | 1.55 |
| S6 | 5 | 39.04 | 5.96 | 21.08 | 13.00 | 6.23 | 11.30 | 3.39 | 0.23 | 1.40 | 1.44 |
| S8 | 10 | 31.65 | 7.67 | 20.28 | 15.88 | 7.97 | 13.08 | 3.47 | 0.29 | 1.25 | 1.13 |
| S4 | 16 | 40.31 | 5.52 | 21.37 | 12.35 | 6.45 | 11.40 | 2.60 | 0.22 | 1.45 | 1.50 |
| S2 | 17 | 36.10 | 5.33 | 21.89 | 15.54 | 6.32 | 11.72 | 3.10 | 0.26 | 1.38 | 1.33 |
| S3 | 20 | 34.44 | 5.85 | 23.33 | 13.18 | 6.70 | 11.68 | 4.82 | 0.24 | 1.19 | 1.18 |
| S1 | 25 | 35.06 | 6.25 | 21.60 | 15.09 | 7.64 | 10.88 | 3.48 | 0.27 | 1.37 | 1.26 |
| S10 | YAS | 39.61 | 5.90 | 19.26 | 13.26 | 6.60 | 11.89 | 3.48 | 0.23 | 1.47 | 1.57 |
| S11 | MT | 33.56 | 6.05 | 27.37 | 11.38 | 5.36 | 12.64 | 3.64 | 0.20 | 1.01 | 1.00 |
| Mean | 36.74 | 6.03 | 21.87 | 13.57 | 6.56 | 11.72 | 3.51 | 0.24 | 1.33 | 1.33 | |
| SD | 3.32 | 0.67 | 2.35 | 1.57 | 0.83 | 0.74 | 0.59 | 0.03 | 0.15 | 0.20 | |
| CV | 9.03% | 11.16% | 10.76% | 11.55% | 12.59% | 6.28% | 16.73% | 12.28% | 11.40% | 15.13% | |
| Var. | Bulk Soil | SOM | |||||||||||||
|---|---|---|---|---|---|---|---|---|---|---|---|---|---|---|---|
| pH | SOC | DOC | C:N | Clay | P | K | NH4 | NO3 | O:C | C:N | H:C | A/O-A | HB/HI | ARM | |
| PC1 | 0.03 | −0.34 | 0.62 | −0.84 | −0.24 | 0.65 | 0.91 | 0.90 | 0.41 | 0.31 | 0.16 | 0.55 | 0.42 | 0.40 | −0.29 |
| PC2 | −0.03 | 0.79 | −0.12 | −0.01 | −0.02 | 0.16 | 0.15 | 0.15 | 0.70 | −0.86 | 0.31 | −0.72 | 0.83 | 0.63 | −0.76 |
| PC3 | 0.73 | 0.38 | −0.17 | −0.42 | 0.35 | 0.63 | −0.20 | −0.23 | 0.48 | 0.28 | −0.91 | 0.15 | −0.10 | −0.09 | 0.48 |
Disclaimer/Publisher’s Note: The statements, opinions and data contained in all publications are solely those of the individual author(s) and contributor(s) and not of MDPI and/or the editor(s). MDPI and/or the editor(s) disclaim responsibility for any injury to people or property resulting from any ideas, methods, instructions or products referred to in the content. |
© 2025 by the authors. Licensee MDPI, Basel, Switzerland. This article is an open access article distributed under the terms and conditions of the Creative Commons Attribution (CC BY) license (https://creativecommons.org/licenses/by/4.0/).
Share and Cite
Nizamutdinov, T.; Yang, S.; Wu, X.; Gurzhiy, V.; Abakumov, E. Multivariate Insight into Soil Organic Matter Dynamics in Subarctic Abandoned Farmland by the Chronosequence Approach. Agronomy 2025, 15, 893. https://doi.org/10.3390/agronomy15040893
Nizamutdinov T, Yang S, Wu X, Gurzhiy V, Abakumov E. Multivariate Insight into Soil Organic Matter Dynamics in Subarctic Abandoned Farmland by the Chronosequence Approach. Agronomy. 2025; 15(4):893. https://doi.org/10.3390/agronomy15040893
Chicago/Turabian StyleNizamutdinov, Timur, Sizhong Yang, Xiaodong Wu, Vladislav Gurzhiy, and Evgeny Abakumov. 2025. "Multivariate Insight into Soil Organic Matter Dynamics in Subarctic Abandoned Farmland by the Chronosequence Approach" Agronomy 15, no. 4: 893. https://doi.org/10.3390/agronomy15040893
APA StyleNizamutdinov, T., Yang, S., Wu, X., Gurzhiy, V., & Abakumov, E. (2025). Multivariate Insight into Soil Organic Matter Dynamics in Subarctic Abandoned Farmland by the Chronosequence Approach. Agronomy, 15(4), 893. https://doi.org/10.3390/agronomy15040893