Abstract
Determination of apple attitude is a key technology for apple picking robots to achieve automatic picking. This paper proposes a joint estimation method for apple pose estimation by segmenting apples and their calyx basin and designs an improved YOLO11s segmentation network (SCH-YOLO11s) to address challenges posed by small, darker calyx basin targets and image degradation. The SCH-YOLO11s network combines the Simple Attention Module (SimAM) with C3k2 into the C3k2_SimAM module, the Conv in the backbone network is replaced with the CMUNeXt Block, and the Histogram Transformer Block (HTB) is added to the C2PSA module. The trained model segmented the apple and the calyx basin and acquired the point cloud data of the segmented region. The center of the apple point cloud was determined by least squares sphere fitting, and the center of the calyx basin point cloud was calculated using the mean value method. The vector connecting these two centers was defined as the apple’s pose. The SCH-YOLO11s network achieves a segmentation AP50 of 97.1% and 94.7% on the apple and calyx basin, and the mAP is improved by 1.8% and 2.7% compared to the unimproved version, respectively. Real apple pose data were obtained for experimental comparison with the estimated pose data. The average error angle of the real pose data compared with the estimated data is 12.3 degrees. The algorithm’s runtime per image is approximately 0.08 s. It shows that the proposed pose estimation scheme has the capability to be applied in a real apple picking robot system.
1. Introduction
In recent years, with the aging of the population and the climbing of labor costs, agricultural labor productivity has shown a declining trend [1,2]. In this context, the development of modern agricultural automation and intelligence, as well as the advancement of AI and robotics, has provided the possibility for the development of automatic picking robots for agricultural products and made them a reality [3,4,5]. The application of automated picking robots plays an important role in alleviating the shortage of agricultural labor, improving production efficiency and product quality, and thus promoting the process of agricultural modernization. In automated orchard picking, robots must be equipped with advanced visual perception systems to achieve fast and accurate recognition of fruit position and attitude in complex and changing orchard environments [6,7]. Based on this information, the robot can plan the optimal picking path to ensure that the picking task is completed efficiently and gently, minimizing damage to the crop [8].
Deep-learning-based target detection models have been widely used in the field of fruit recognition [9,10,11], achieving efficient and accurate fruit detection and localization [12,13]. Further, the image segmentation model provides more detailed morphological information, such as features like the contour and orientation of the fruit, by distinguishing the pixel regions belonging to the fruit in the image, thereby estimating the pose of the fruit more accurately. Compared to target detection methods that only provide a bounding box, image segmentation enables pixel-level classification and especially exhibits higher stability and reliability when dealing with scenes with occlusion or complex backgrounds [14,15]. A 3D point cloud combined with segmentation [16] can effectively obtain spatial information of fruits for attitude estimation. Eizentals [17] proposed the use of point cloud data for green pepper attitude and picking point estimation. However, this method is inefficient, with a processing time of up to 14.5 s per image frame, and part of the point cloud is not segmented and matched with the model correctly due to the occlusion problem. Wang [18] addressed the problem of millet chili pepper pose in a complex farmland environment by segmenting the two parts of the chili pepper skin and the chili pepper, obtaining the millet chili pepper planar pose. This method is only applicable to long-type crops and only estimates the pose at the 2D level without determining the 3D position information. Lin [19] achieved semantic segmentation of fruits and branches through convolutional network output, then combined this with RGB-D depth images to obtain the fruit point cloud, and estimated the fruit poses based on the position of the fruit center and the branch information obtained from the 3D reconstruction. Yin [20] proposed a method that requires segmenting and projecting grape bunches from RGB-D images into a point cloud and fitting the point cloud to a cylindrical model using the RANSAC algorithm to estimate the pose. Jang [21] used the trained YOLOv8 model for segmentation of fruiting bodies and sepals of tomato, calculated the segmented fruiting body and sepal centers of the segmented fruiting body and sepal, and the estimated pose of the tomato was used as the connection vector between the two centers of the fruiting body and sepal.
This paper proposes a method for jointly obtaining apple pose by segmenting apples and calyx basins using the SCH-YOLO11s network. Specifically, based on the SCH-YOLO11s segmentation network combined with a depth camera, the corresponding point cloud data are extracted by segmenting and identifying the apple and calyx basin, and then the centers of the apple and calyx basin are over-calculated, and ultimately, the vector connecting the two centers defines the apple’s pose. In summary, the main contributions of this paper are as follows:
- The proposed SCH-YOLO11s network, combining SimAM with C3k2 to form the C3k2_SimAM module, then replacing the traditional Conv in the backbone network with the CMUNeXt Block, and finally inserting the HTB module in the C2PSA module to replace the traditional PSABlock with HTB to improve the apple and calyx basin segmentation accuracy.
- The developed apple pose estimation technique. The point clouds of the apple and calyx basin are segmented using the proposed network and an RGB-D camera, the center is determined by least squares sphere fitting to the apple point cloud, the center of the calyx basin point cloud is calculated by the mean value method, the segmentation of the concave effectively avoids its effect on the sphere fitting, and the concatenation vector of the two is defined as the attitude direction of the apple.
- A scheme was designed to validate the proposed method in a laboratory environment. The real attitude data of an apple were manually collected using an RGB-D camera and compared with the estimated data to validate the effectiveness of the proposed attitude estimation method.
2. Materials and Methods
2.1. Dataset Production and Data Augmentation
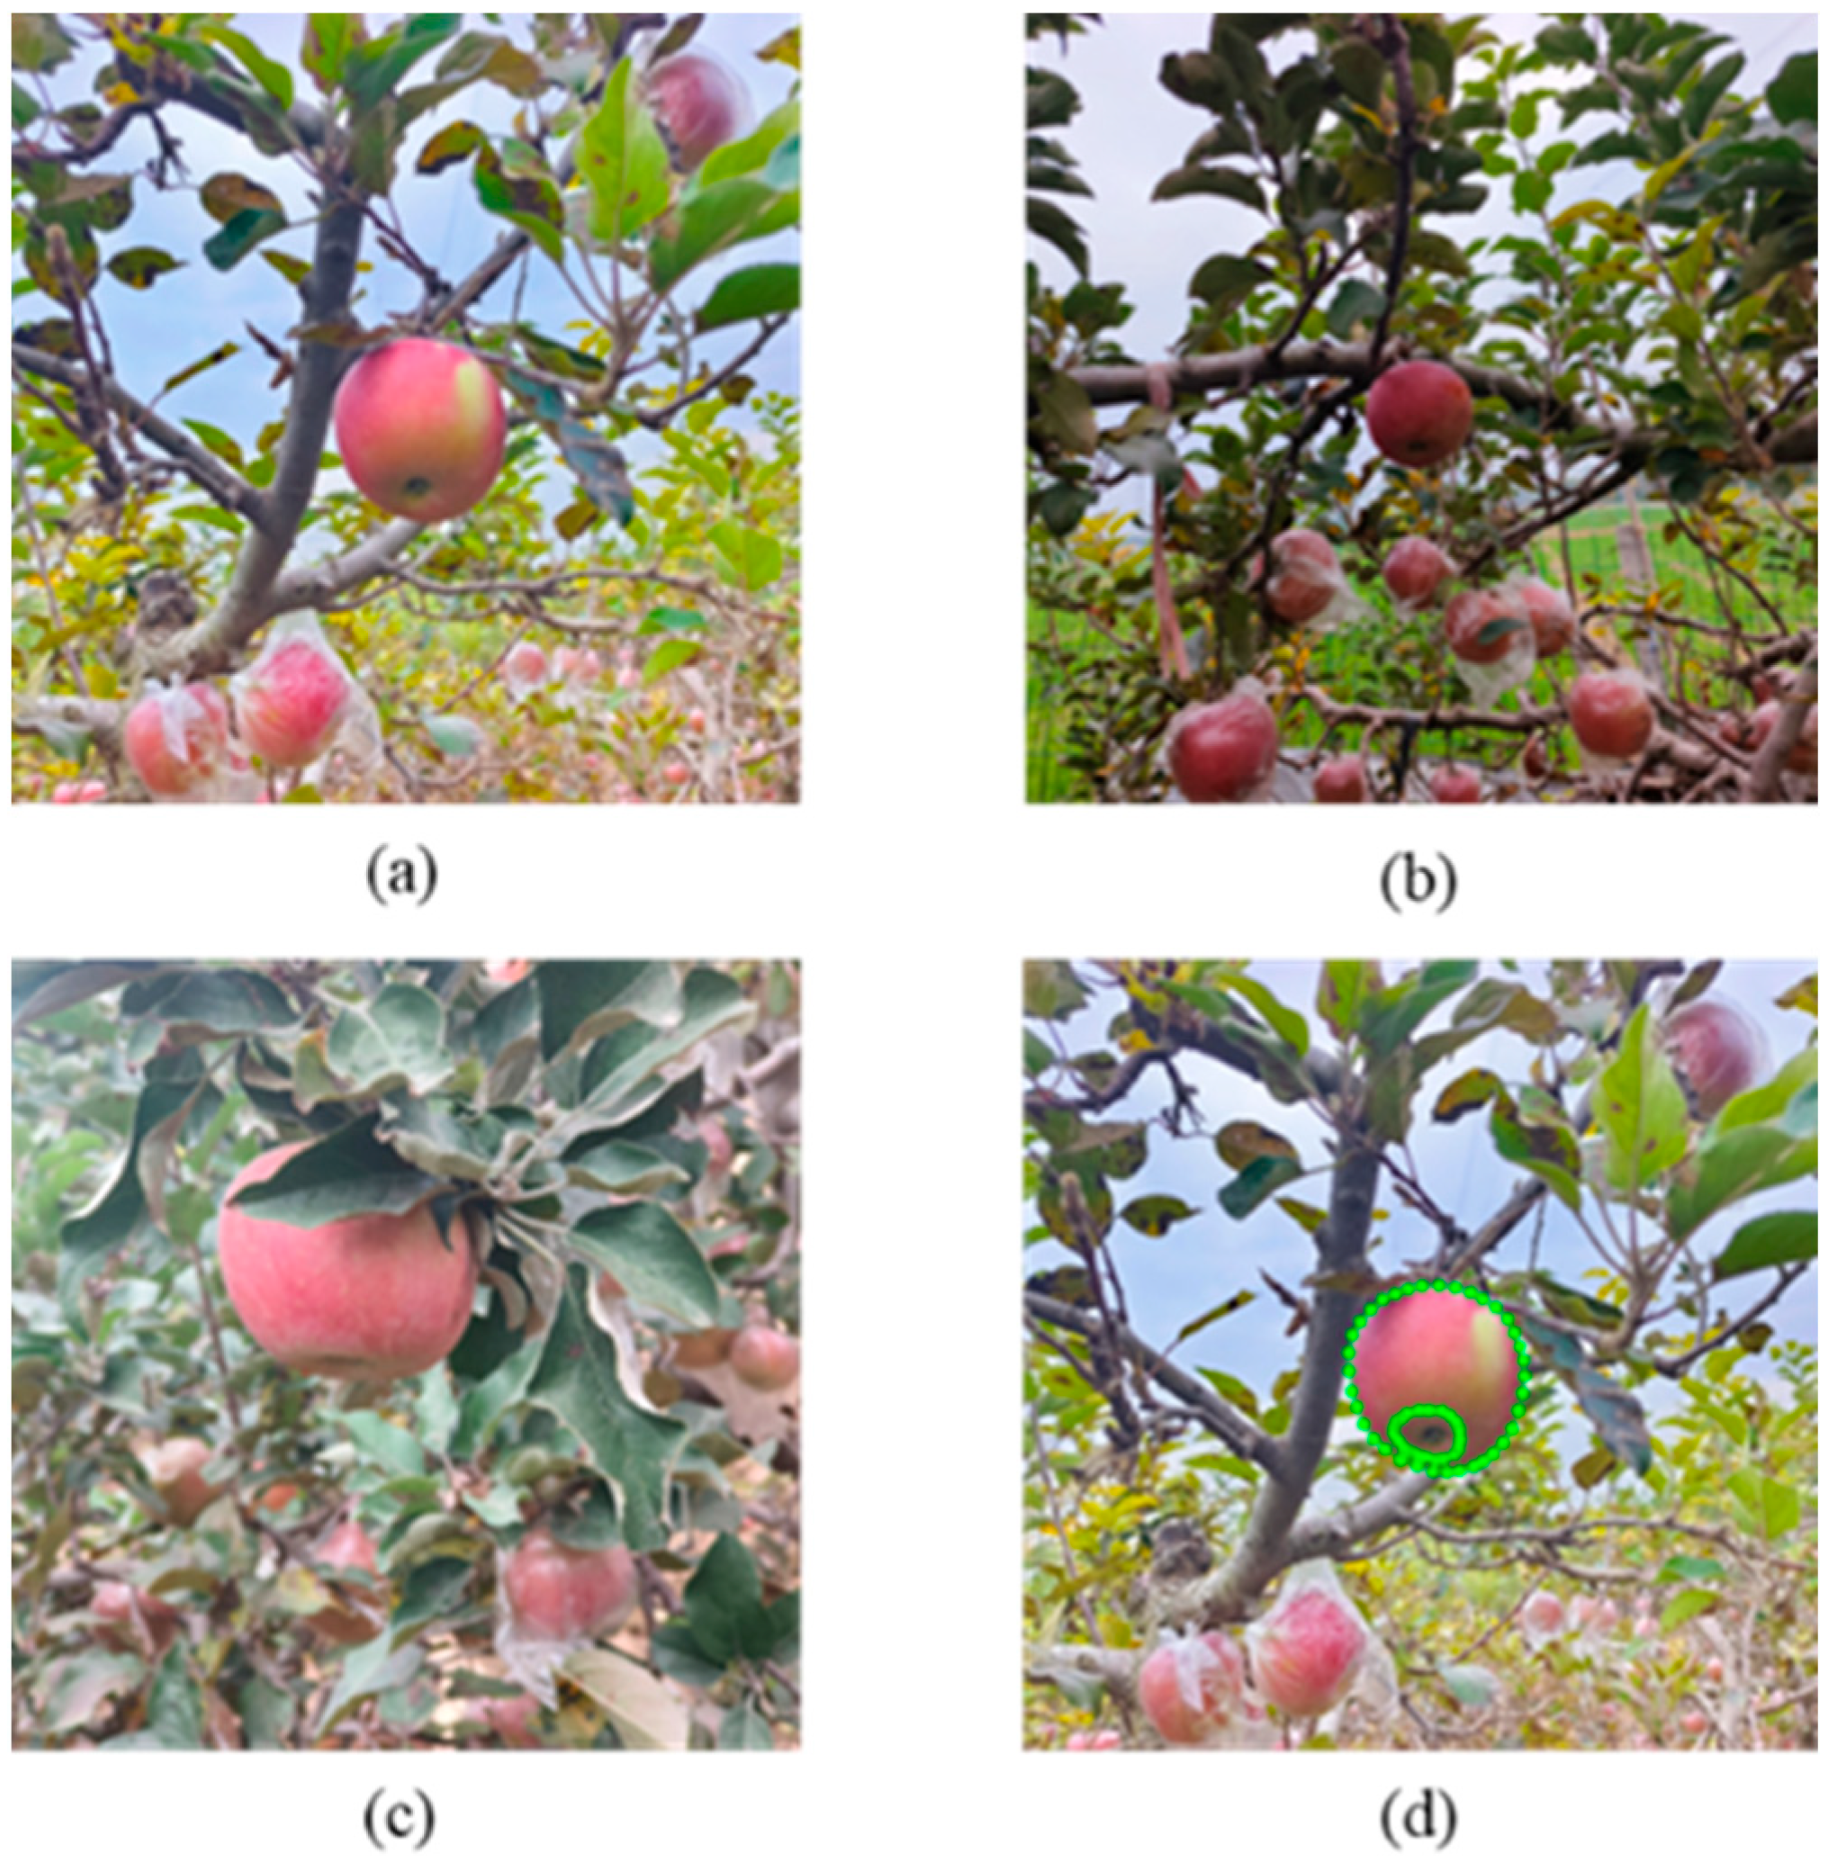
The apple dataset was collected in apple picking orchards in Zhongmou and Shangqiu, China. To realize the distance between the apple and the device during real picking, the shooting distance was set at about 0.5–1 m from the apple. Images were collected on 5 October and 9 November 2024 in the morning and afternoon. A total of 568 original images were collected. These images contain apples with the calyx basin fully and partially visible as well as different light brightness scenarios, as shown in Figure 1a–c. For model training and performance testing, 113 images were randomly selected to make the test set and the remaining 455 images formed the original training set. The LabelMe [22] annotation tool was used to label the apples in the images with only those apples where the calyx basin was visible, labeling the calyx basin and the apple portion separately, as shown in Figure 1d.

Figure 1.
Images of normal weather conditions (a), cloudy conditions (b) and calyx basin portion visible (c) and labeled image (d) of image (a). The apple part is labeled in (d) and the calyx basin part is within the apple part.
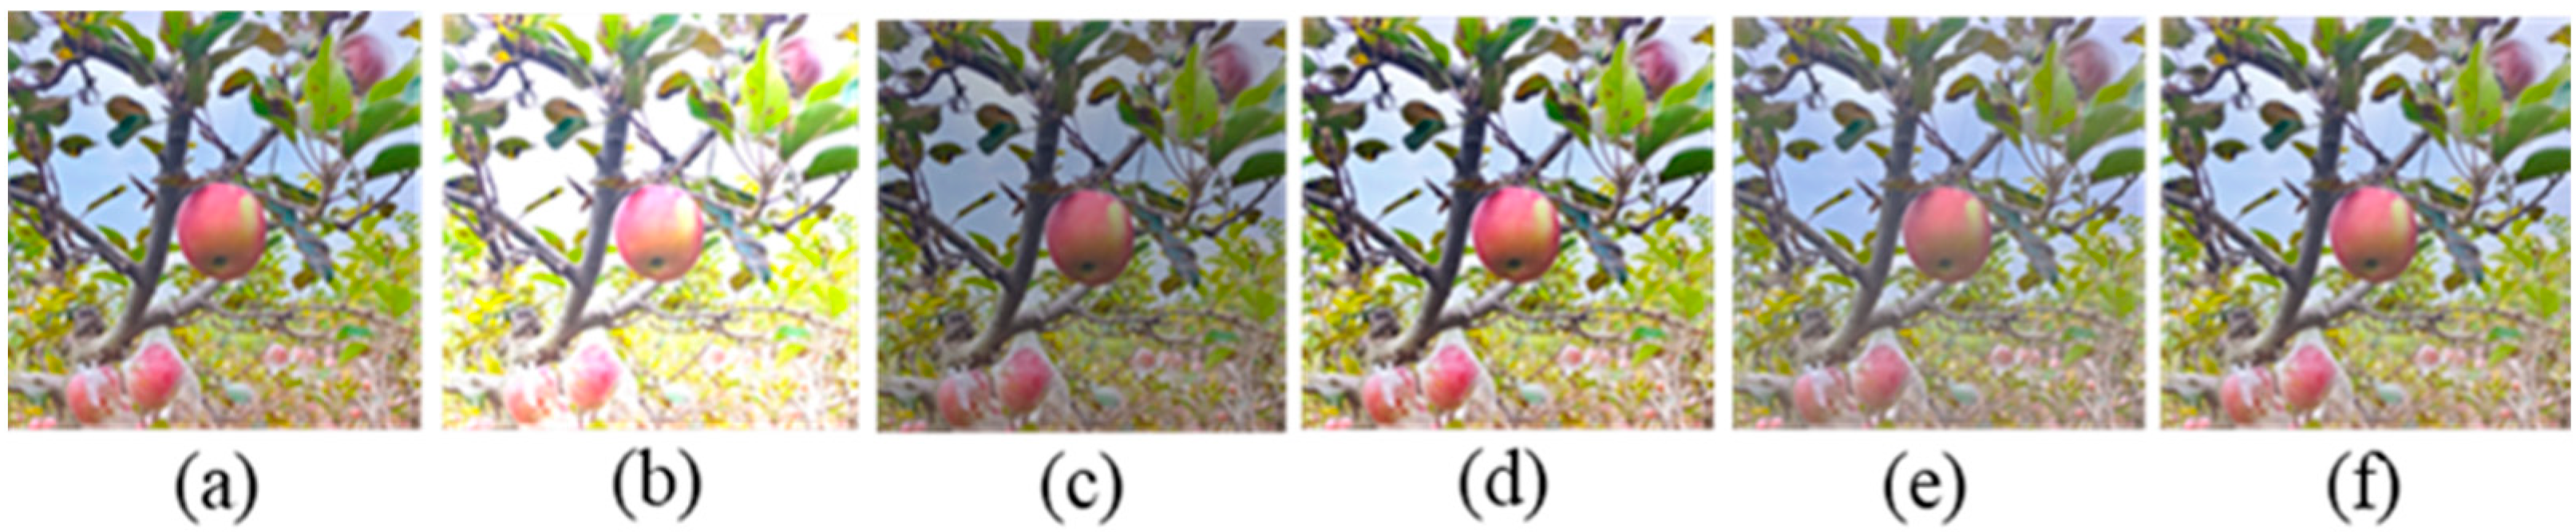
While training the deep learning model on the collected raw images, insufficient training data were observed. To increase the number of apple samples, to better extract features under different lighting conditions, and to avoid the phenomenon of overfitting during network model training, data augmentation was performed on the training set. Four kinds of image augmentation processes were performed on the original slice images, including brightness enhancement and attenuation and contrast enhancement and attenuation. Meanwhile, camera shake may cause image blurring during data acquisition, so blurring enhancement was added. To ensure that the original annotation remains valid after image augmentation, the brightness and contrast of the image are varied randomly within 50% of the original image and the image is blurred using the Gaussian blur [23] operation. Figure 2a shows the original image and Figure 2b–f show the result of image augmentation which results in an enhanced training dataset containing 2730 images. The 113 images in the test dataset are original images as described above.
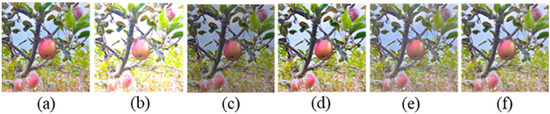
Figure 2.
Data augmentation results, (a) is the original image and (b–f) are the augmented images.
2.2. Model Construction
2.2.1. SCH-YOLO11s Model Construction
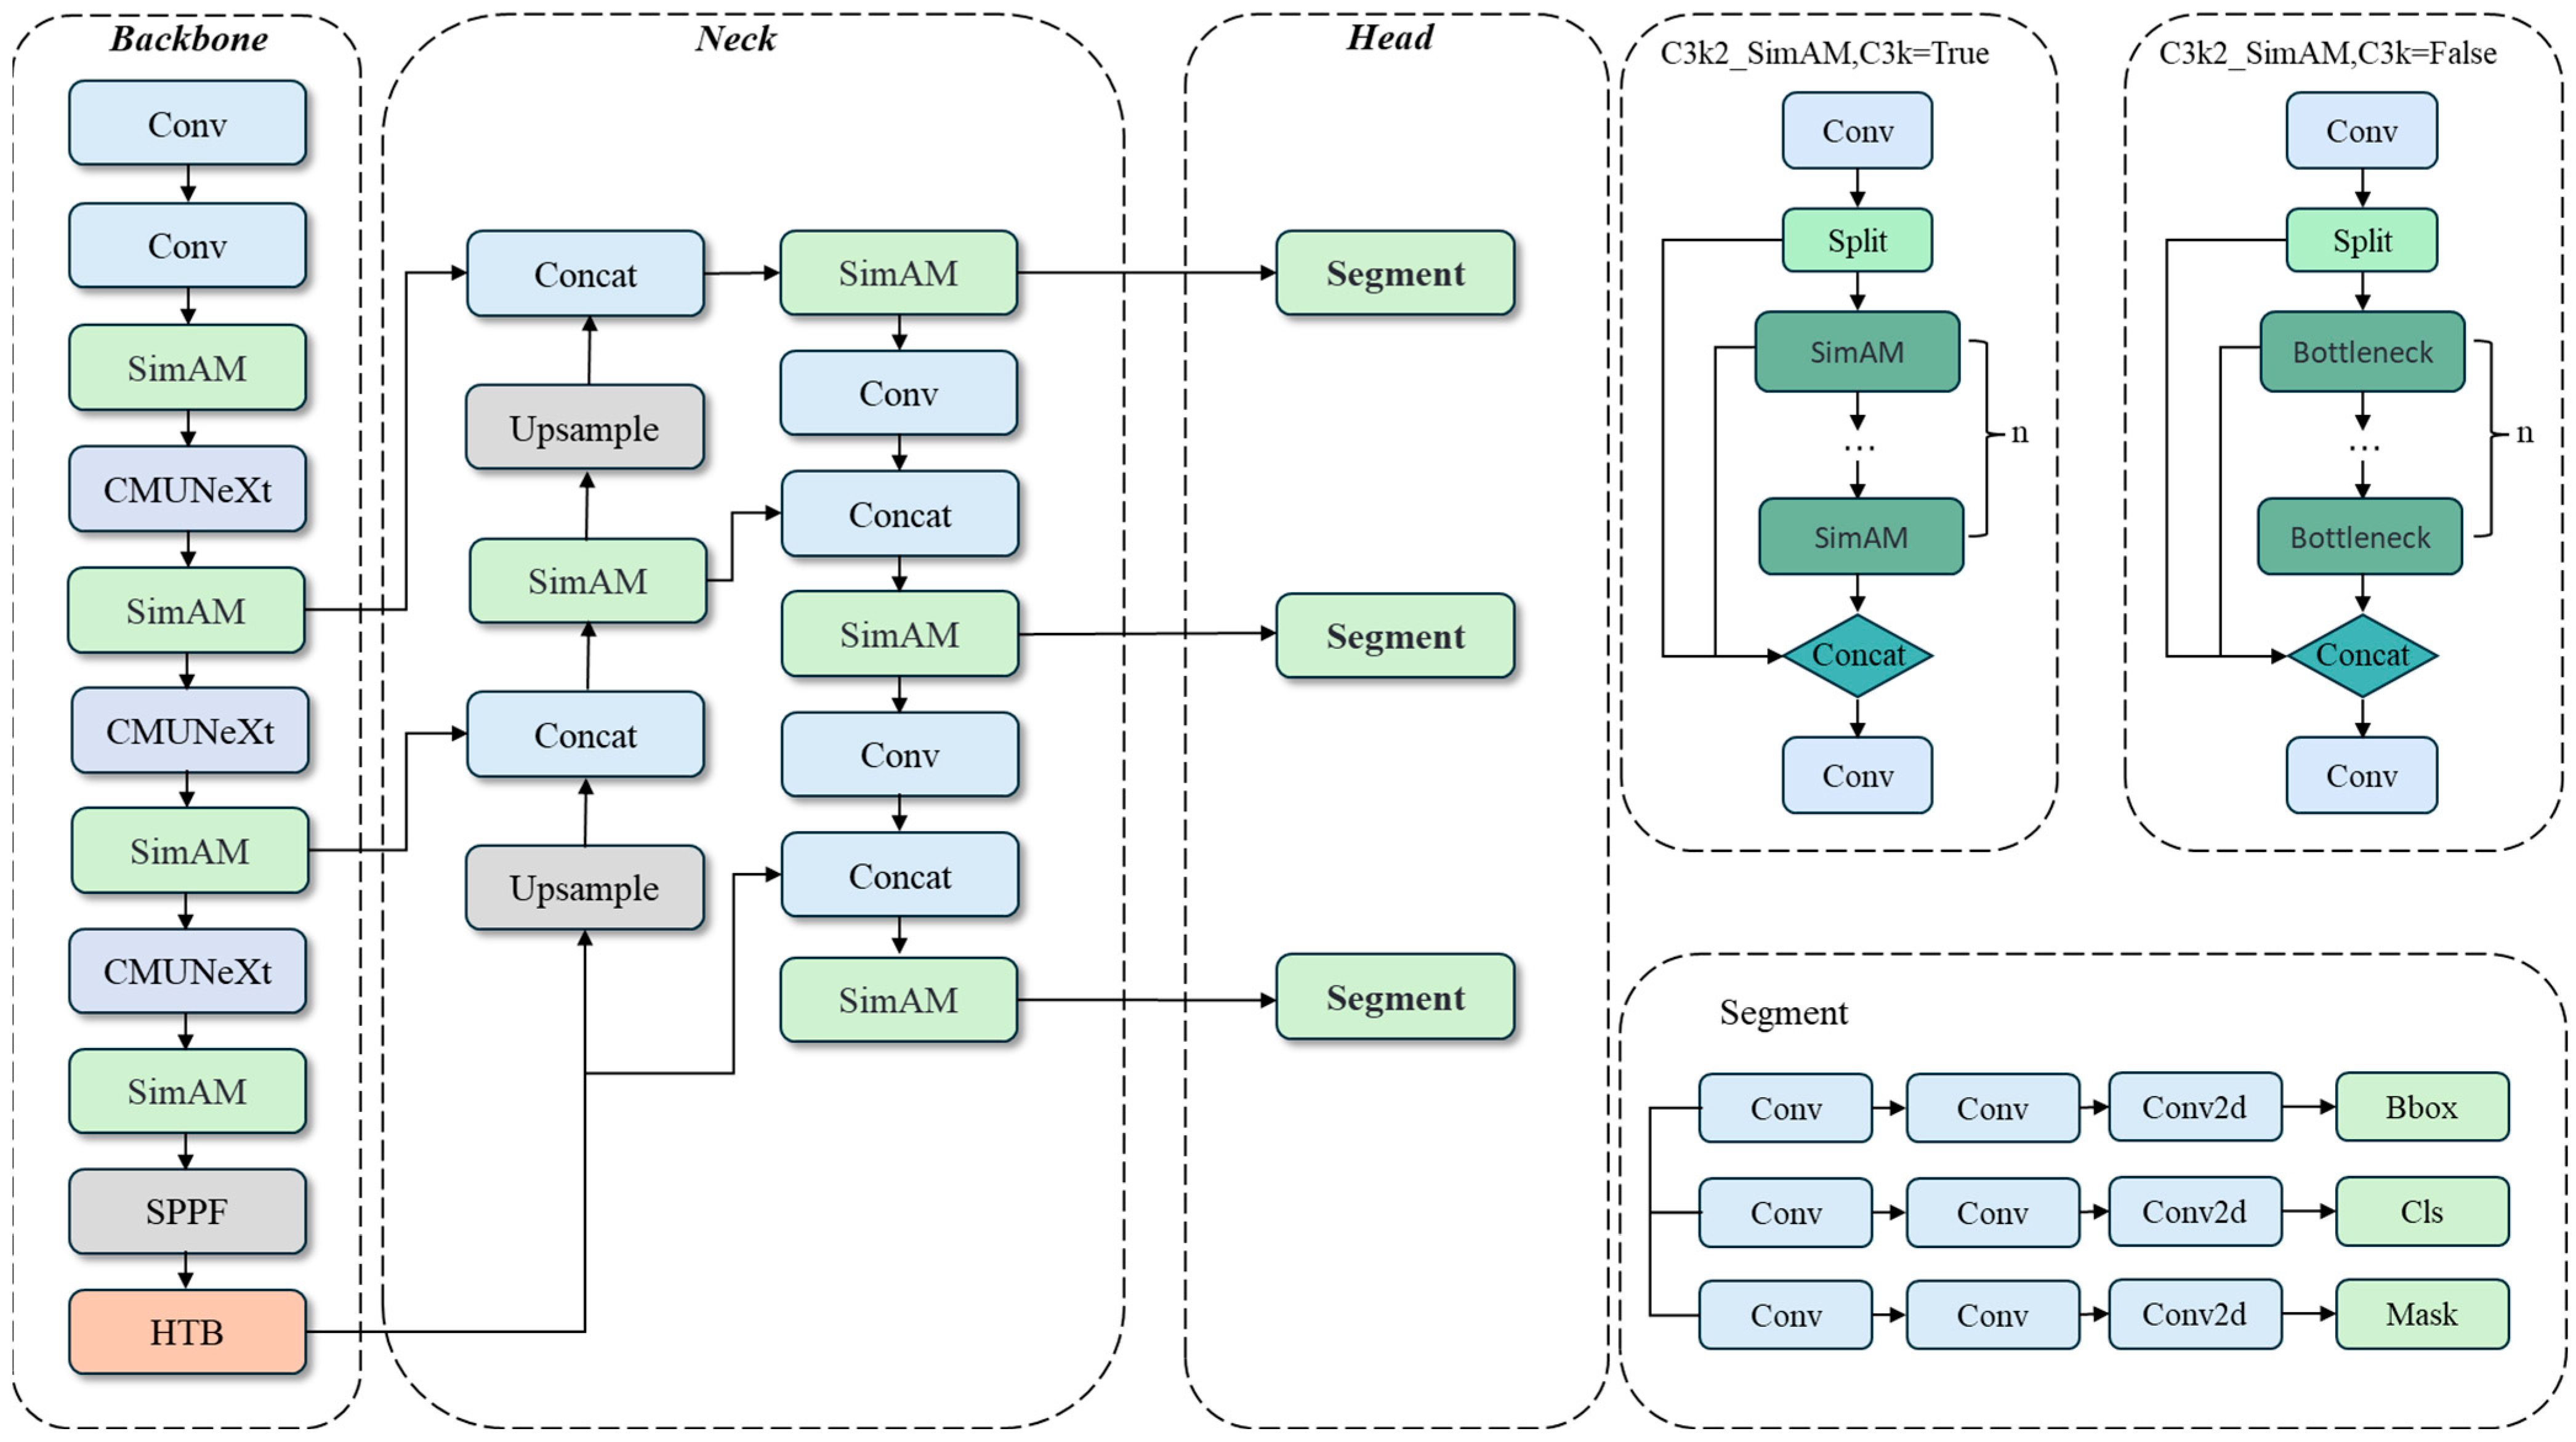
The YOLO family of networks is currently widely used in agriculture for segmentation tasks. YOLO11 [24], developed by Ultralytics, represents the latest version of the series, integrating tasks such as object classification, detection, keypoint detection, rotated frame detection, and segmentation into a unified framework. It inherits the excellent properties of the YOLO family of algorithms in terms of speed and accuracy, and through its advanced neural network architecture and optimized training strategy, it demonstrates excellent performance in a variety of complex visual tasks. To achieve high instance segmentation accuracy and relatively fast detection speed, the YOLO11s model is chosen as the benchmark network in this paper. The architecture of the improved SCH-YOLO11s network is shown in Figure 3. The model consists of three main components: backbone, neck, and head. To solve the problems of small targets, darkness, and image degradation in apple and calyx basin segmentation, the SCH-YOLO11s network introduces several improvements. The C3k2_SimAM module is introduced, which combines the Simple Attention Module (SimAM) [25] with the C3k2 module of YOLO11s to enhance the model’s ability to capture nuances and complex structural features; the traditional convolutional layer of the backbone network is replaced with the CMUNeXt Block [26], which enhances the ability of global information extraction; in addition, the Histogram Transformer Block (HTB) [27] is added to the C2PSA module, which combines the dynamic range convolution and the two-branch histogram self-attention mechanism to improve the model’s ability to cope with image degradation. The optimized YOLO11s network was finally named SCH-YOLO11s.
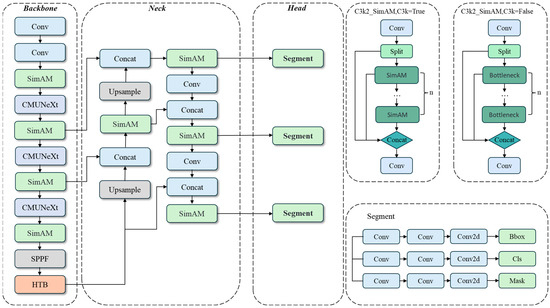
Figure 3.
Architecture of the proposed SCH-YOLO11s network.
2.2.2. C3k2_SimAM
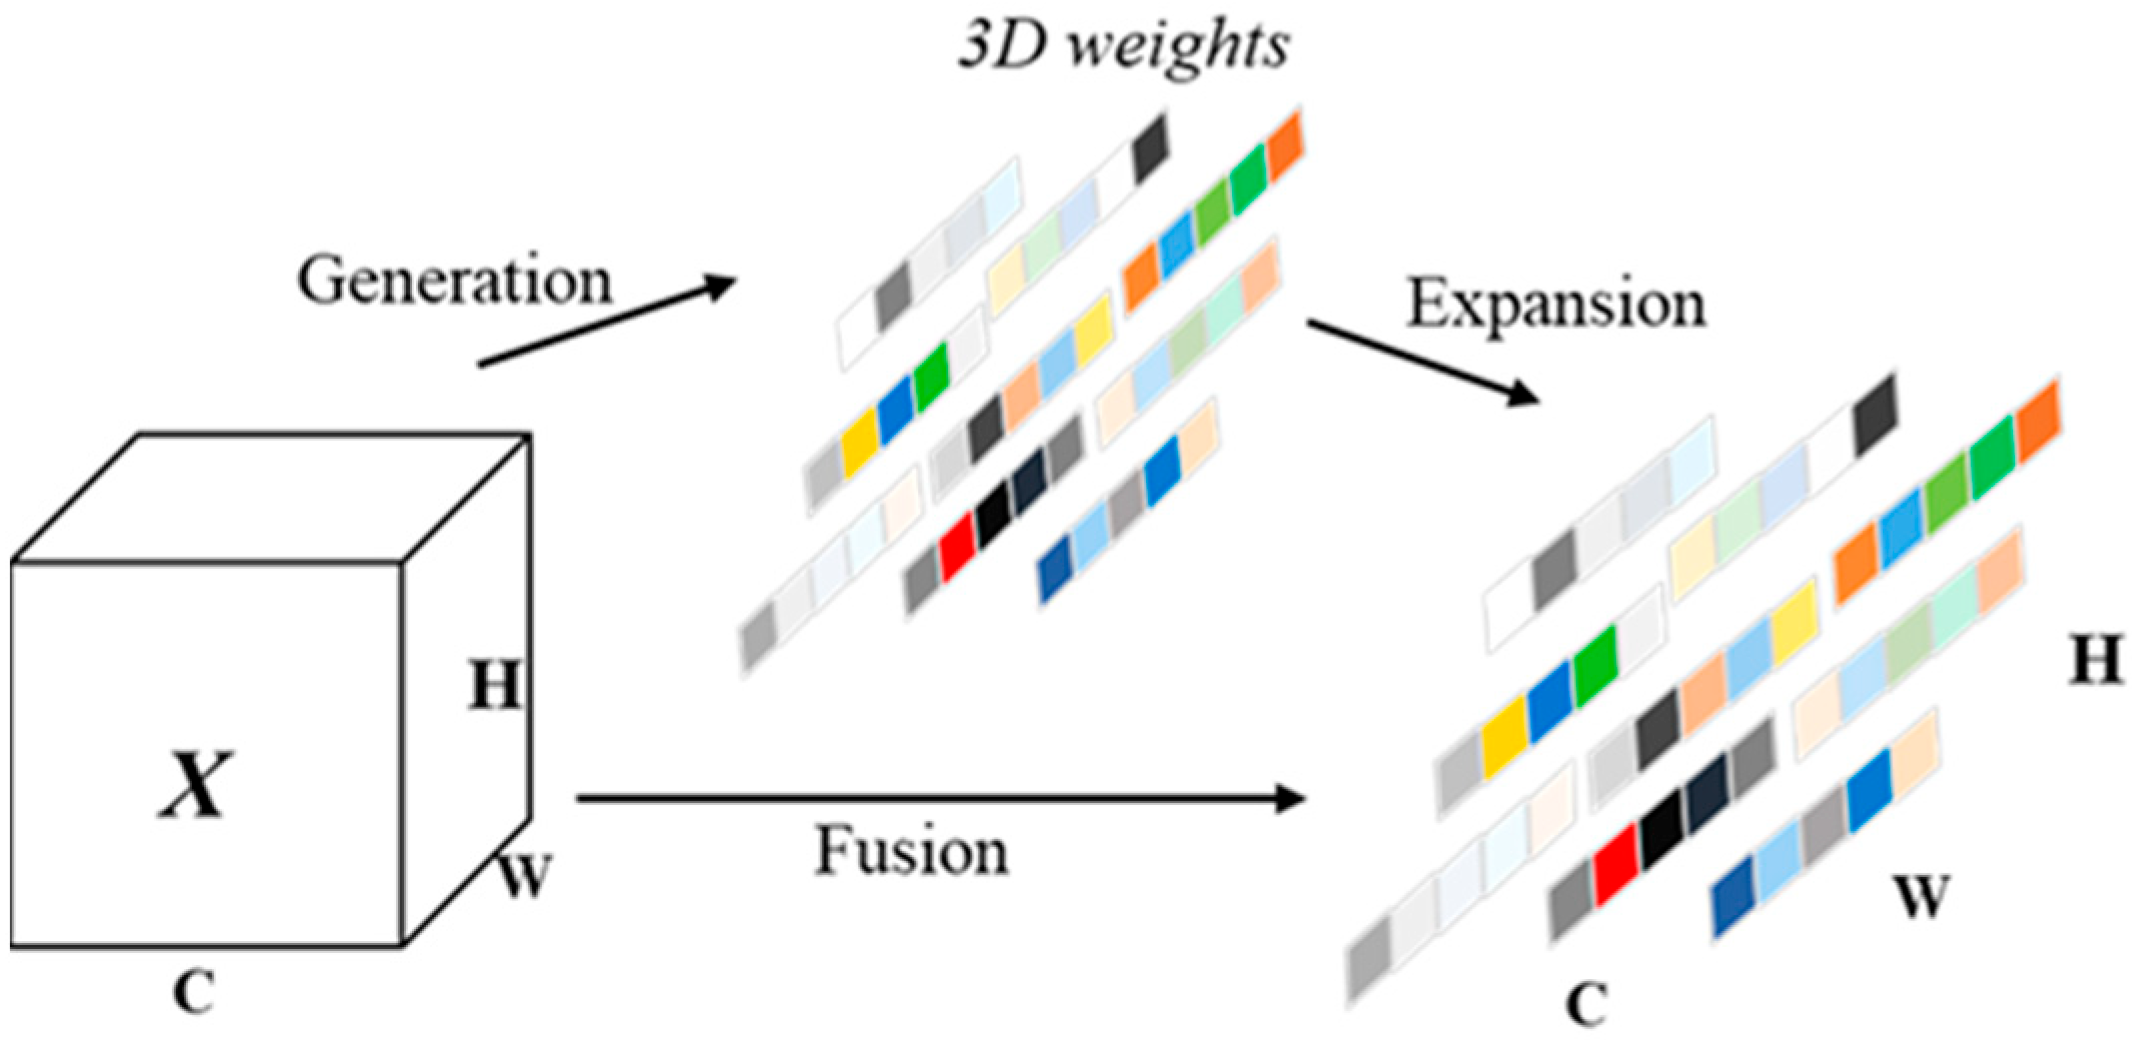
In this paper, a feature learning module, C3k2_SimAM, designed based on the Simple Attention Mechanism (SimAM) is proposed to replace the C3k2 module in the original network. SimAM, as a parameter-free attention mechanism, aims to improve the robustness of neural networks in complex environments and their ability to handle complex features. Figure 4 illustrates the components of SimAM, which calculates the importance of each neuron by integrating channel and spatial information to generate a 3D attention weight map. Compared to traditional one- or two-dimensional attention mechanisms, SimAM not only captures global features but also pays special attention to the learning of local features, thus reflecting more accurately the nuances and complex structures of the input data. The core of SimAM is to reduce computational complexity while simplifying the model architecture and to improve performance through parameter-free construction. SimAM quantifies the uniqueness and relevance of each neuron in the feature map by defining an energy function and thus accurately evaluates the contribution of each neuron to the overall output. Specifically, the energy function is used to measure the similarity and difference between neurons, which ensures the effective capture and reinforcement of important information in the feature map. The C3k2_SimAM module, through the clever application of SimAM, not only enhances the robustness and accuracy of the model in complex feature processing but also realizes the simplification of the model architecture and the enhancement of the computational efficiency, which provides strong support for improving the network segmentation accuracy.
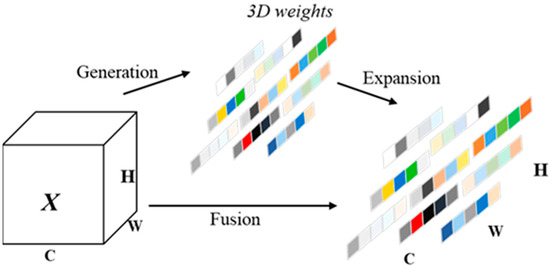
Figure 4.
SimAM Attention Mechanism Architecture.
2.2.3. CMUNeXt Block
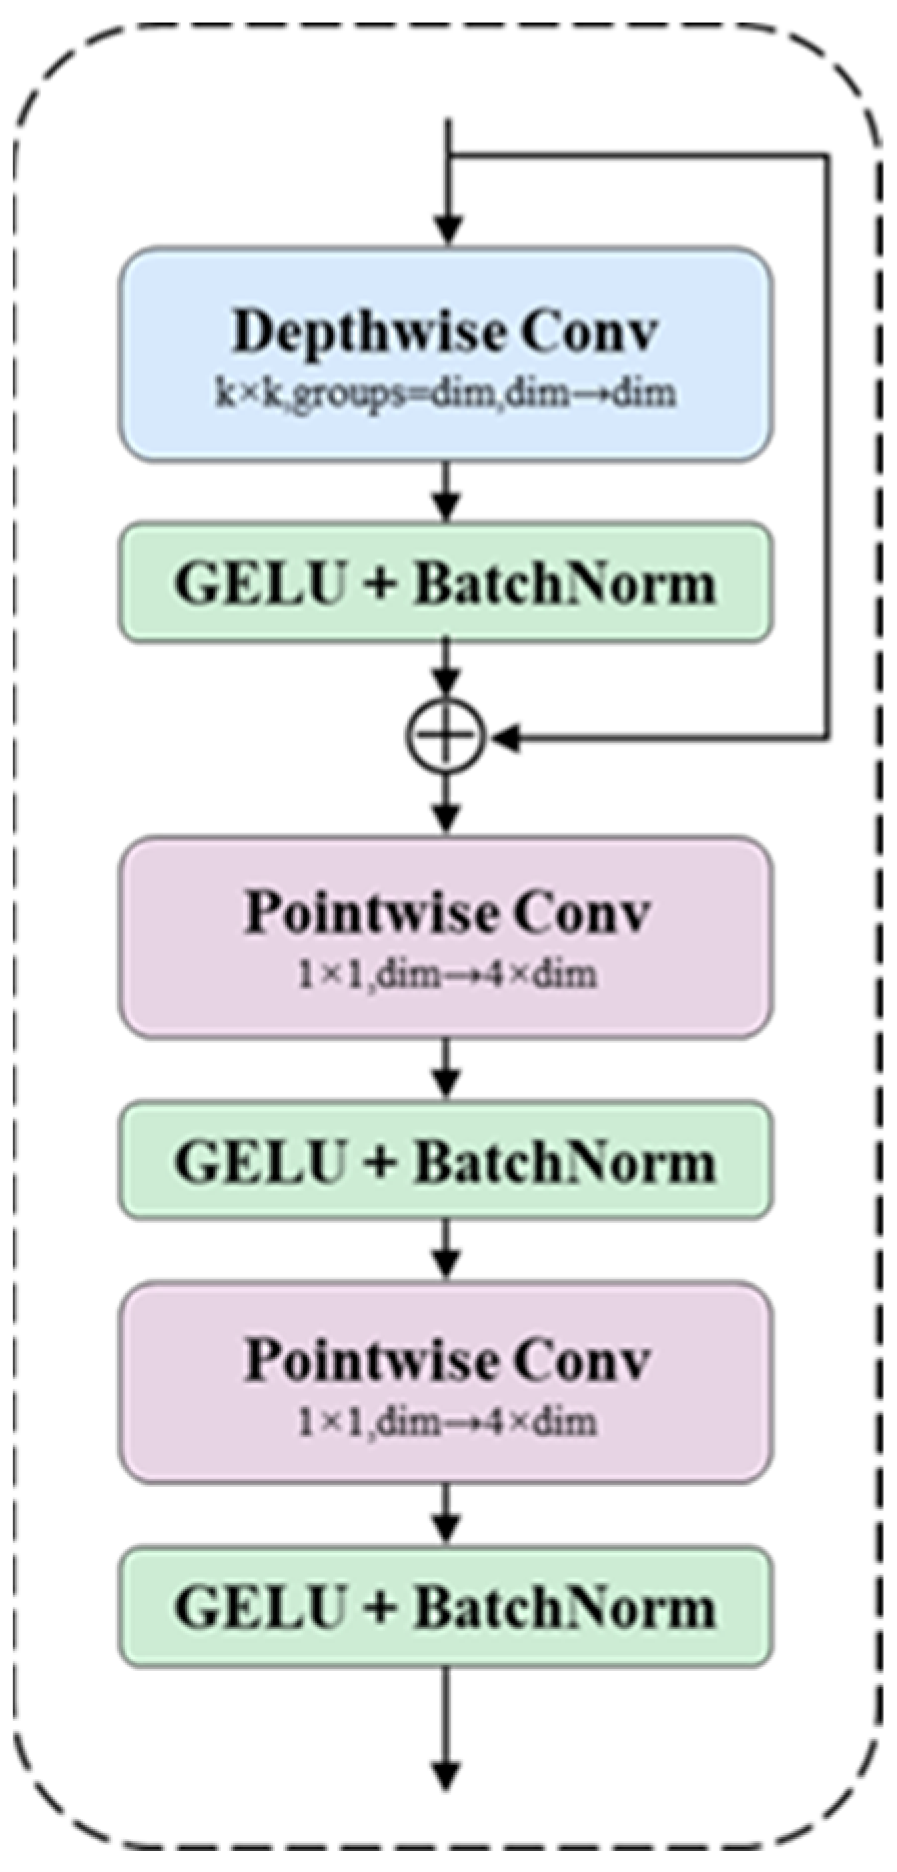
The CMUNeXt Block significantly improves the network’s ability to capture global information by replacing the traditional convolutional layers with large kernel depth-separable convolution. Firstly, the input feature maps are processed by Depthwise Conv [28] to capture global information on each channel; subsequently, the number of channels is extended using Pointwise Conv, thus enhancing the expressive power of the middle layer. On this basis, an inverted residual bottleneck is used, i.e., the number of channels is first extended from dim to 4 × dim by 1 × 1 convolution and then reduced back to the original number of channels or specified output dimensions via another 1 × 1 convolution, which not only enhances the ability of the model to characterize complex features but also ensures that the model structure is lightweight. The GELU activation function and BatchNorm are applied after each convolution operation to stabilize the training process and accelerate the convergence, while residual connections ensure the effective transfer of information and avoid the problem of gradient vanishing. Finally, the optimized feature maps are output, which provide high-quality feature representations for subsequent image segmentation tasks. Deep separable convolution can significantly reduce the network parameters and computational cost compared to ordinary convolution, which not only improves the model efficiency but also makes it more suitable for deployment in mobile devices and edge computing environments. The specific structure of the CMUNeXt Block is shown in Figure 5.
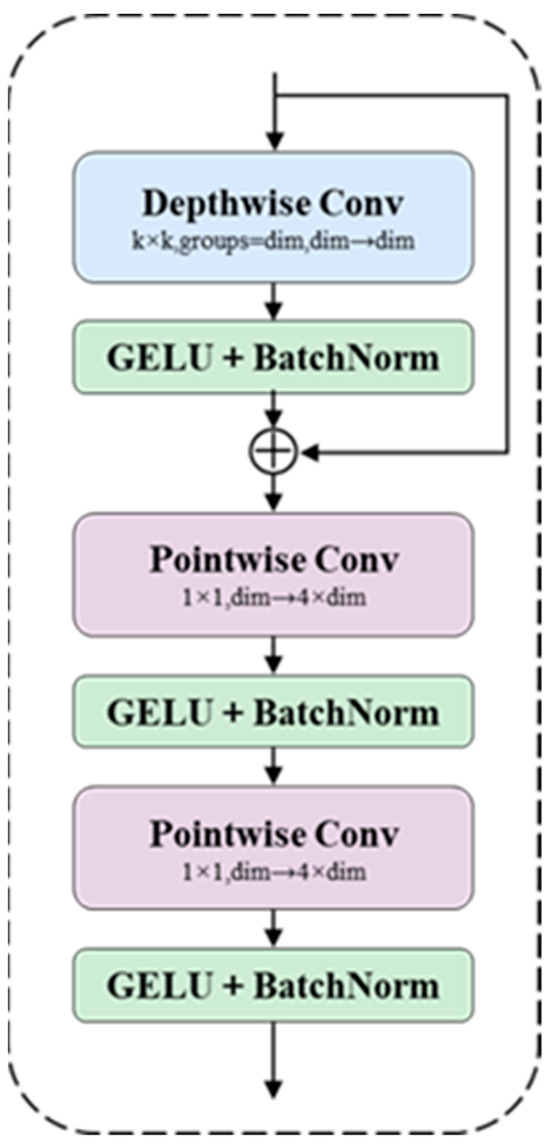
Figure 5.
CMUNeXt Block Structure.
2.2.4. C2PSA_HTB
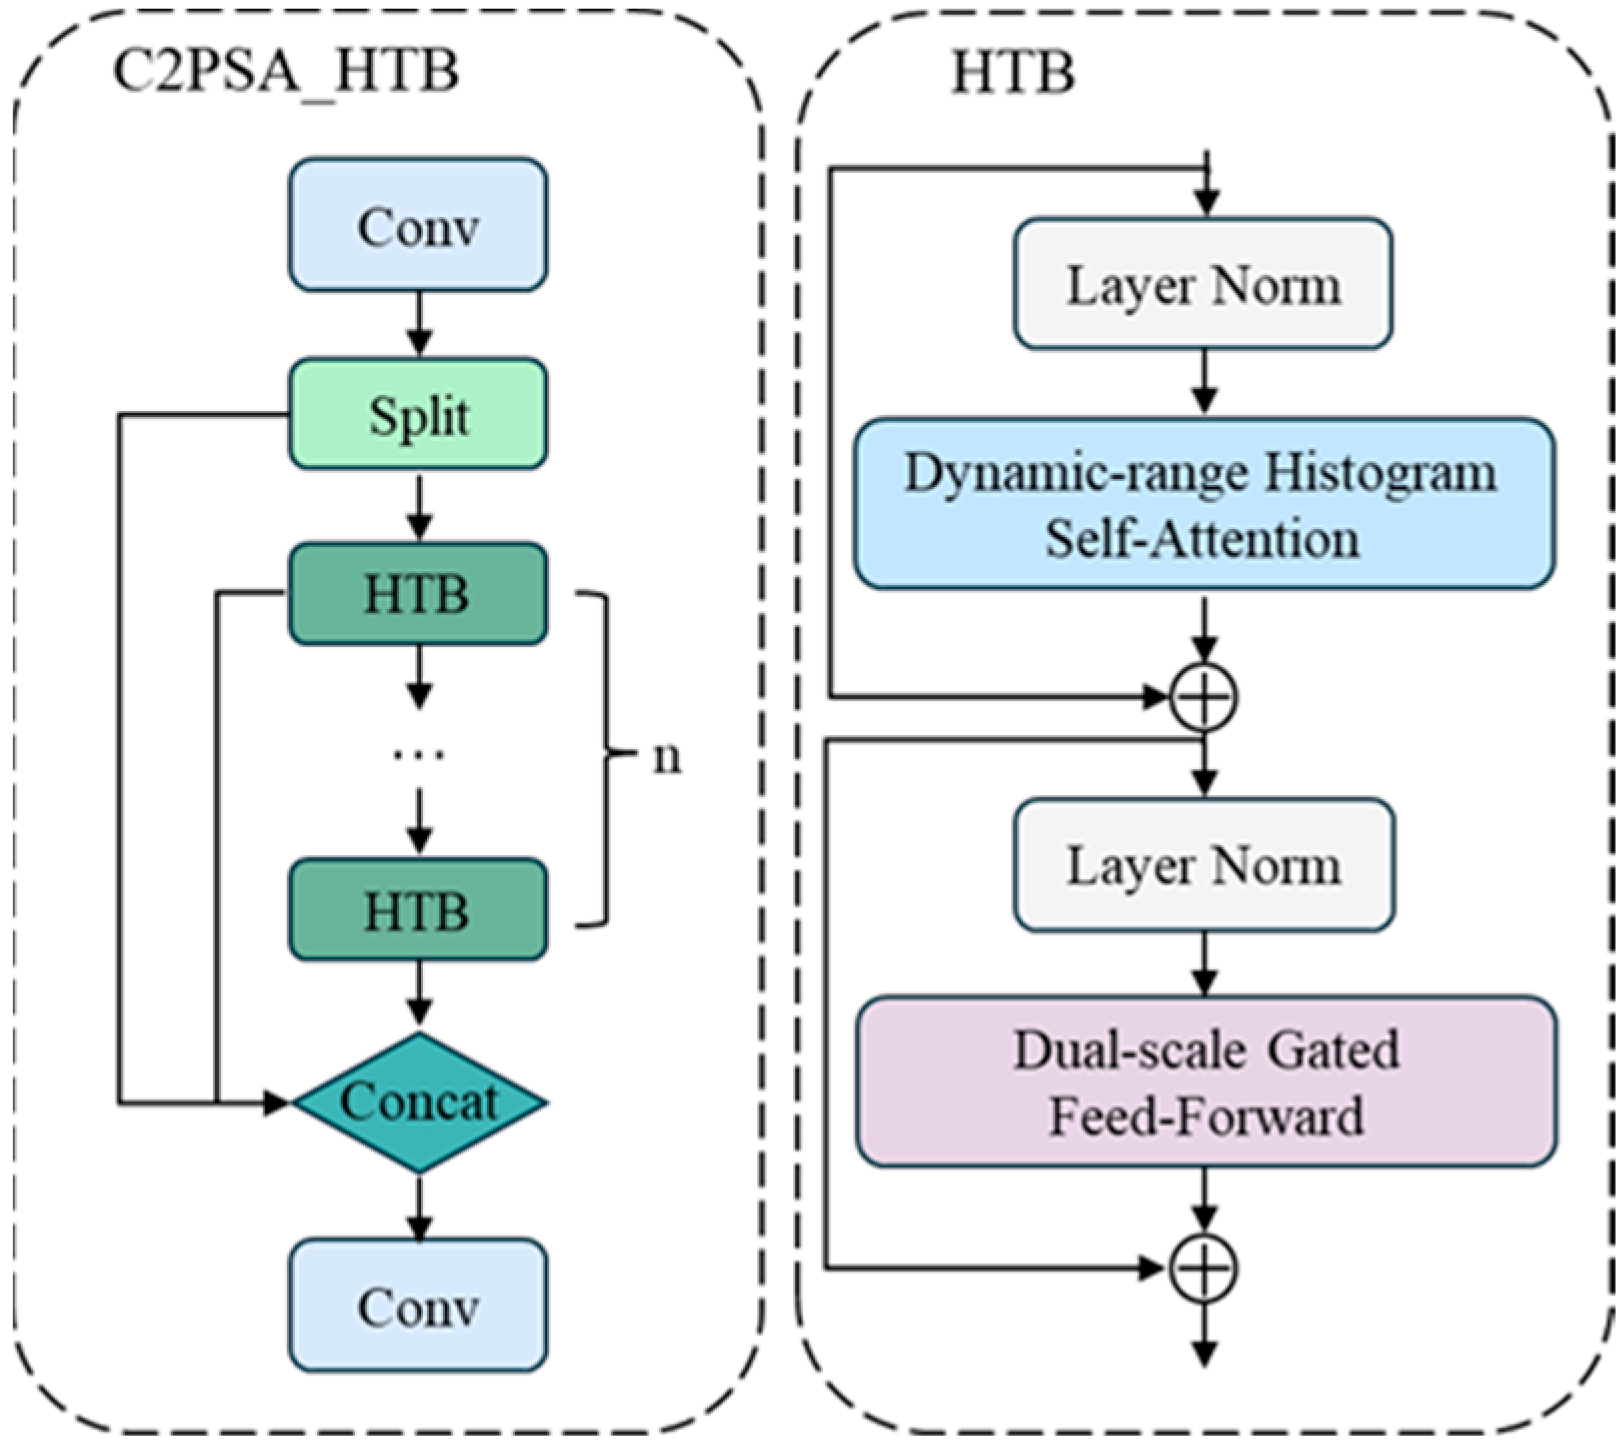
In the C2PSA module in the backbone network, the traditional PSABlock is replaced by the Histogram Transformer Block (HTB), which significantly enhances the ability to model long-range spatial features and thus improves the performance of the model in responding to the effects of environmental changes. The HTB aims to solve the image degradation problem, which is centered on the use of a Dynamic Range Histogram Self-Attention mechanism to accurately process degraded regions in the image.
It consists of two main modules: the Dynamic Range Histogram Self-Attention (DHSA) and the Dual Scale Gated Feedforward (DGFF) module, which together are used to extract features from degradation-affected images. The DHSA categorizes the pixels into different histogram bins based on their intensity values, thus applying the self-attention mechanism within and between bins of these intensity bases. This approach enhances the attention mechanism to focus on regions with similar degradation patterns while improving the ability to capture long-range dependencies. The DGFF module integrates two different multi-range and multi-scale deep convolutional paths during the transmission process to enhance the ability to extract multi-scale and multi-range information through different convolutional operations and gating mechanisms. Figure 6 shows the overall structure of C2PSA_HTB with HTB.

Figure 6.
C2PSA_HTB with HTB structure.
2.3. Apple Pose Estimation
2.3.1. Holistic Approach
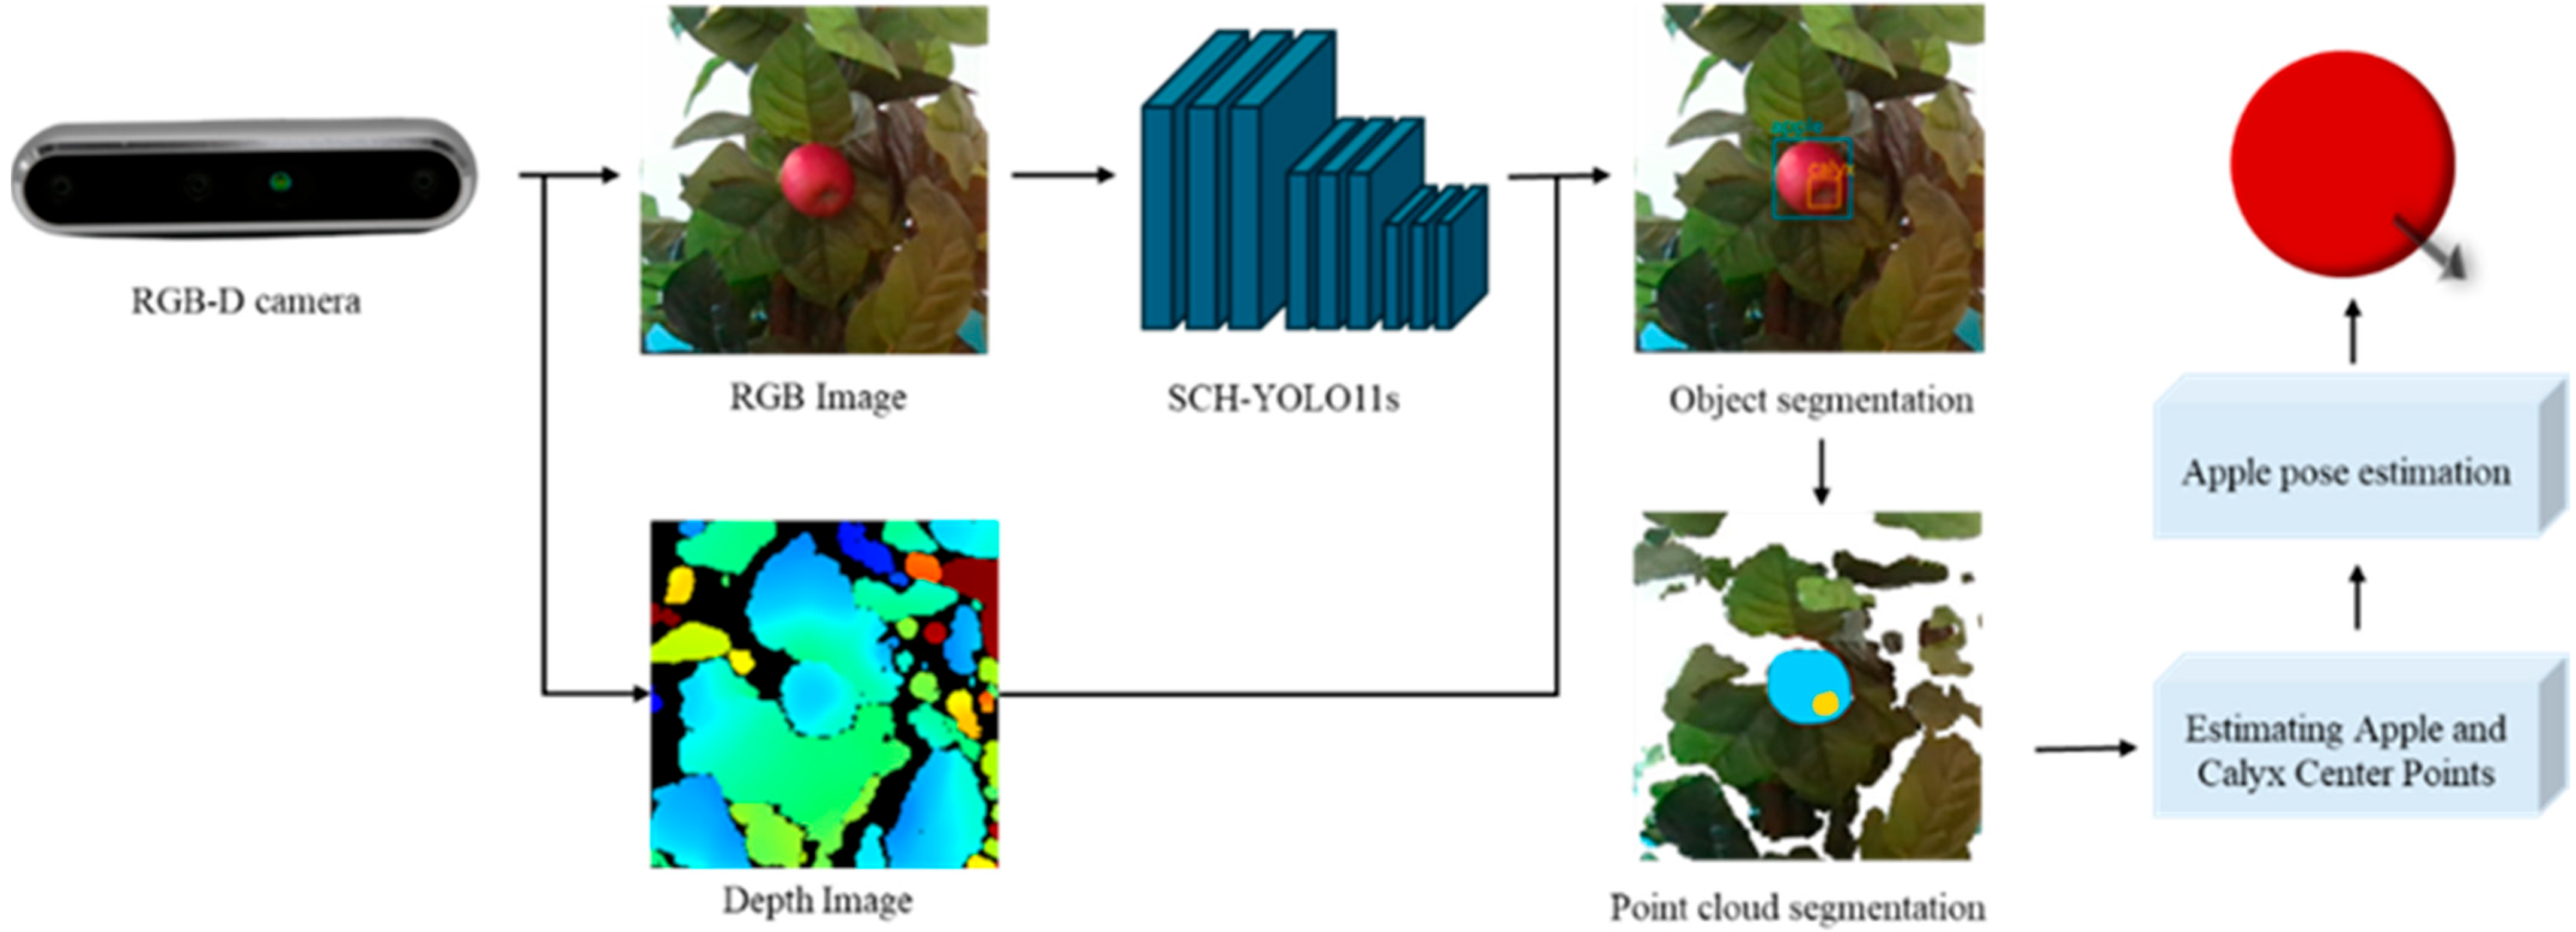
The specific flow of the apple pose estimation method proposed in this paper is shown in Figure 7. It firstly acquires an apple image using an RGB-D camera, and then accurately segments the apple and calyx basin in the image using an improved SCH-YOLO11s network to generate a segmentation mask. By combining the mask with depth map information, the corresponding point cloud data for each part can be extracted and processed, and the center coordinates of the apple and calyx basins are computed through geometric analysis. Finally, the direction vectors constructed from these two center points are used to represent the apple pose estimation. The whole process combines advanced image segmentation and 3D point cloud processing techniques to ensure high accuracy and reliability of the pose estimation.
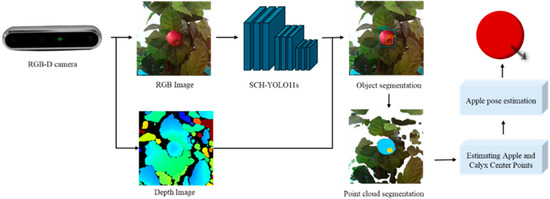
Figure 7.
Overall flow of Apple pose estimation.
2.3.2. Point Cloud Acquisition
To obtain high-quality images and depth information, the Intel RealSense D457 camera was selected as the data acquisition device. The camera can provide RGB images and depth images simultaneously, which provide the necessary spatial information for subsequent point cloud extraction. After image acquisition, the SCH-YOLO11s network was used for pixel-level segmentation of the apple and calyx basin, and the point cloud data were generated by aligning the segmentation mask in the RGB image with the depth image. The specific point cloud coordinatesare calculated by applying the following equation to the pixel coordinatesand depth values in the RGB image:
where and are the pixel coordinates in the RGB image, and are the coordinates of the camera’s principal points, and and are the camera’s focal lengths, which can be obtained through camera calibration.
Given the high density of point cloud data and the computational complexity introduced by direct processing, voxel grid downsampling is employed to simplify the data. This method effectively reduces the amount of point cloud data and computational complexity by dividing the 3D space into equal-sized cubic cells and selecting a representative point within each cell, while preserving the global shape features of the point cloud.
Although the SCH-YOLO11s segmentation network can effectively identify the apple region, the limitation of segmentation accuracy may lead to the misclassification of the background or other objects, which in turn generates noise and artifacts and affects the accuracy of the geometric information. The Statistical Outlier Removal (SOR) [29] algorithm is employed to optimize the point cloud quality. Specifically, the Euclidean distance between any two points and in the point cloud is assumed to be , and then the mean and the standard deviation of the neighborhood distance are calculated for each point:
where is the total number of points in the point cloud, is the average distance between point and its neighboring points, is the mean value of the global distance, and is the standard deviation of the global distance. On this basis, if the distance of a point exceeds a predefined threshold , the point is considered as an anomaly and should be removed from the point cloud. The parameters α = 0.25 and the number of neighborhood points n = 100 are set for outlier detection and removal.
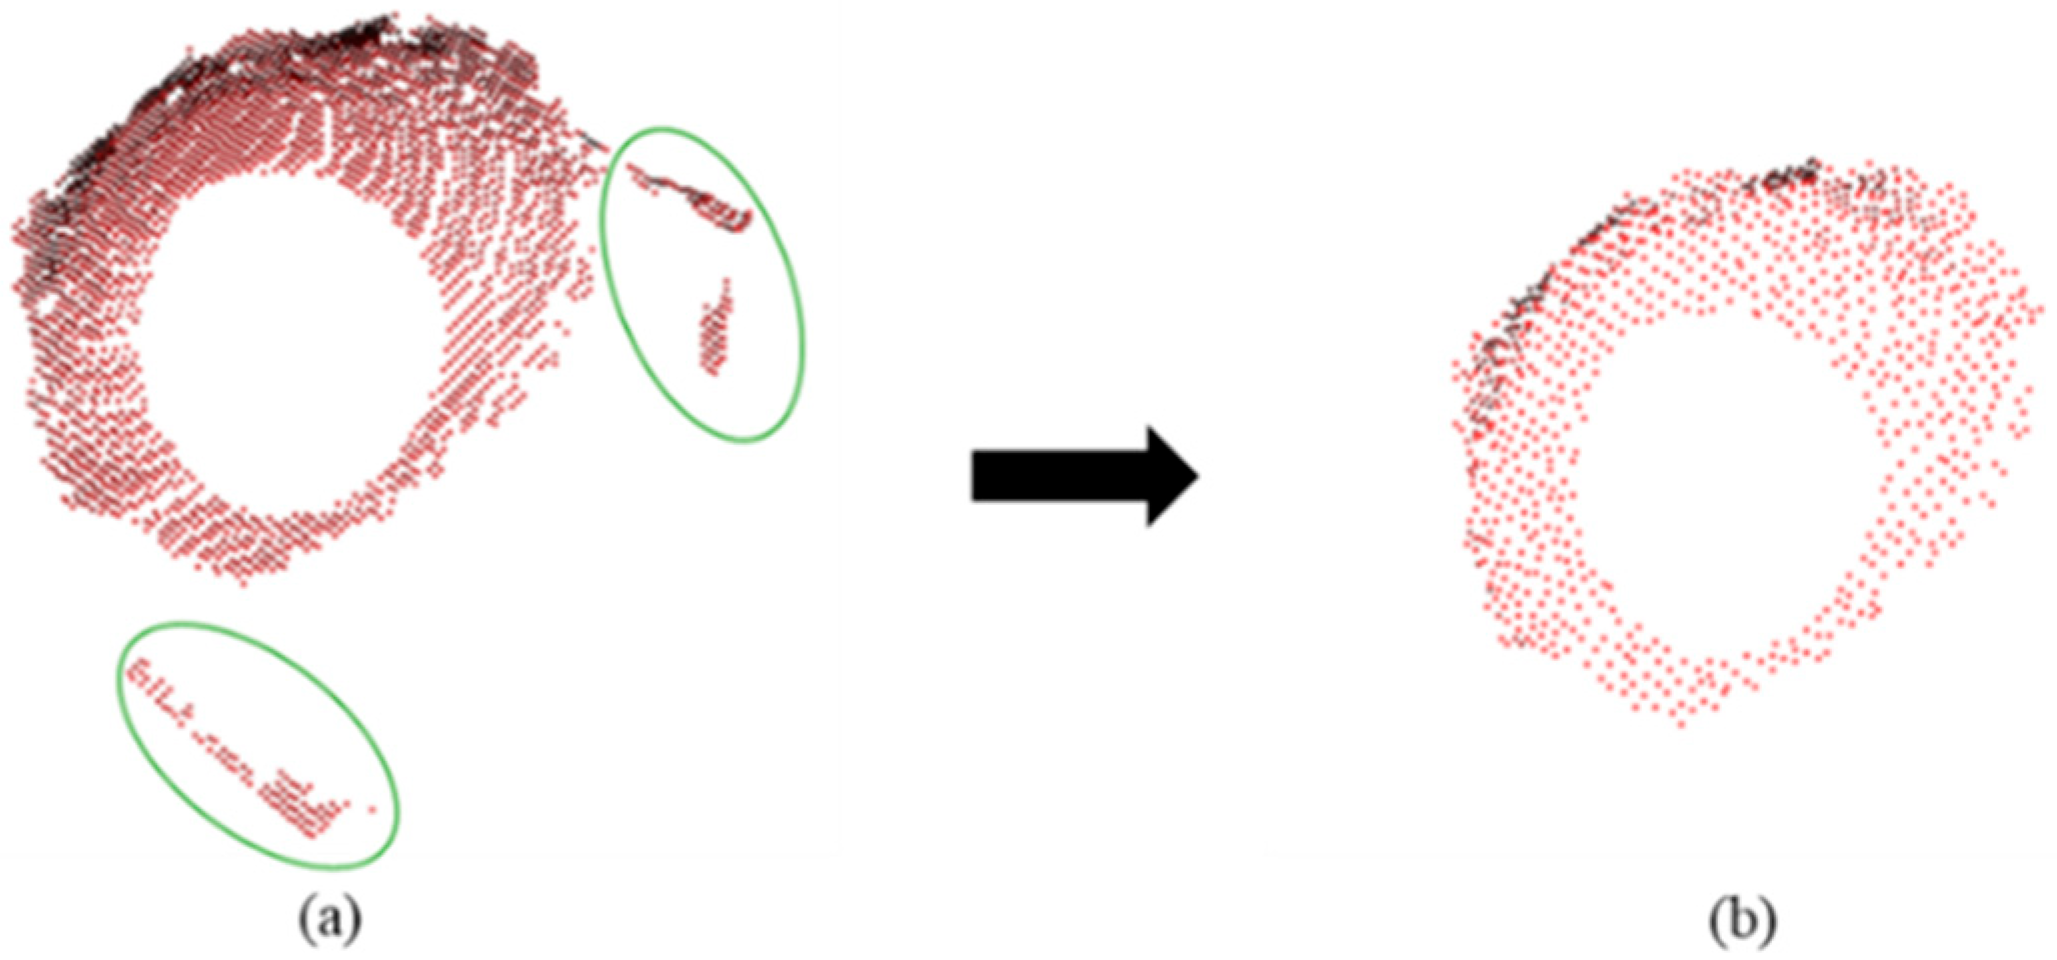
After the above processing, the noise and artifacts in the point cloud are significantly reduced, which improves the reliability and accuracy of the geometric features and provides more accurate basic data for the subsequent apple pose estimation in 3D. Figure 8 shows the comparison of the point cloud before and after voxel downsampling and outlier removal. The denoised point cloud is more detailed and reduces the error caused by noise, further improving the accuracy of the pose estimation.
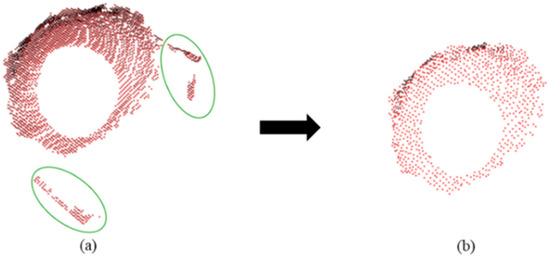
Figure 8.
Extracted original point cloud image (a), downsampling and denoising effect image (b). The green circles in the figure are point cloud discrete points.
2.3.3. Pose Estimation
This paper presents a method for apple pose estimation through point cloud and geometric characterization. In particular, the apple center is estimated based on its point cloud distribution, while the calyx basin center is obtained by calculating the mean of its point cloud coordinates.
Given the relatively small and dense point cloud of the calyx basin region, the simple mean method is employed to approximate its center . Let represent the set of calyx basin point clouds, where each denotes the three-dimensional coordinates of the ith point. The center point can be expressed as:
Considering the small scale of the calyx basin region and the high density of the point cloud, the deviation between the center of the calyx basin obtained by the above equation and the actual position is negligible. Figure 9a shows the calyx basin point cloud and its center (green point).
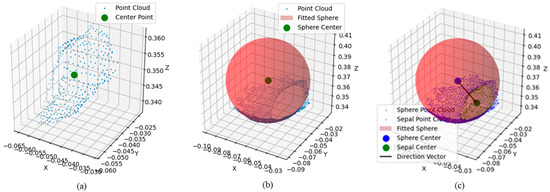
Figure 9.
Point cloud processing and attitude estimation. Calyx concave center (a), apple center (b), apple pose vector (c).
A simple mean calculation may not accurately reflect the true center of the apple due to the wide distribution of the point cloud and the presence of self-occlusion. The apple’s shape is assumed to be approximately spherical, and its center is estimated using a least squares sphere model [30]. Figure 9b shows the apple point cloud and its fitted sphere model. The general equation for the sphere is shown below:
Here, are the coordinates of any point, are the coordinates of the center of the sphere, and r is the radius of the sphere. By substituting each point in the point cloud into the sphere equation and linearizing it, a system of linear equations can be constructed, which in turn can be solved using the least squares method for the optimal parameter vector . Specifically, this can be obtained by solving the following matrix equation:
where A and b are constructed from the point cloud coordinates, respectively, and c contains the unknowns of the sphere center coordinates and the radius squared minus the sum of the squares of the sphere center coordinates. By solving this linear system, the coordinates of the center of the sphere , i.e., the apple center point , can be obtained:
Finally, the attitude of the apple can be determined by calculating the direction vector between the apple center point and the calyx basin center point :
This direction vector describes the orientation and position of the apple with respect to the calyx, thus providing an efficient estimate of the apple pose. Figure 9c shows the direction vector between the fruit center and the calyx basin center .
3. Experimental Design and Evaluation Indicators
3.1. Network Modeling Experimental Design
Model training and testing tasks for all networks were performed on PCs equipped with Intel Xeon(R) Silver 4210R CPUs and NVIDIA GTX3090 GPUs. The networks were constructed using the PyTorch 1.12.1 framework, the environment was set up in a virtual environment created by Anaconda3, and the configuration included Python 3.10 and CUDA 11.3 installed. The training parameters are shown below. The input image size was 640 × 640, the number of training rounds was set to 300, and the batch size was set to 16. The proposed SCH-YOLO11s networks were compared with the segmentation networks YOLOv8, YOLOv9 [31], and unmodified YOLO11. These comparisons were performed to validate the segmentation performance of the SCH-YOLO11s network. Then, ablation experiments were performed to verify the effect of each modification in the SCH-YOLO11s network.
3.2. Indicators for the Assessment of Network Models
To comprehensively evaluate the performance of the model in the task of apple and calyx basin recognition and segmentation, this paper adopts the average precision (AP), a widely accepted evaluation metric in the field of recognition and segmentation detection. AP is a composite metric that measures the performance of the model by calculating the area under the precision (P) and recall (R) curves. Specifically, the accuracy of model prediction is determined by the intersection and concurrency ratio IoU between the true and predicted values. The relevant formula is as follows:
It is worth noting that, for each IoU threshold, AP is calculated based on the accumulated TP, FP, and FN for all test samples. This paper uses mAP and AP50 as the main evaluation criteria. mAP is the average value of AP at a series of different confidence thresholds (usually 0.5 to 0.95 at 0.05 intervals), and AP50 refers to the value of AP at a confidence threshold of 0.5, which reflects the performance of the model under looser matching conditions.
3.3. Acquisition of Pose Truth Data
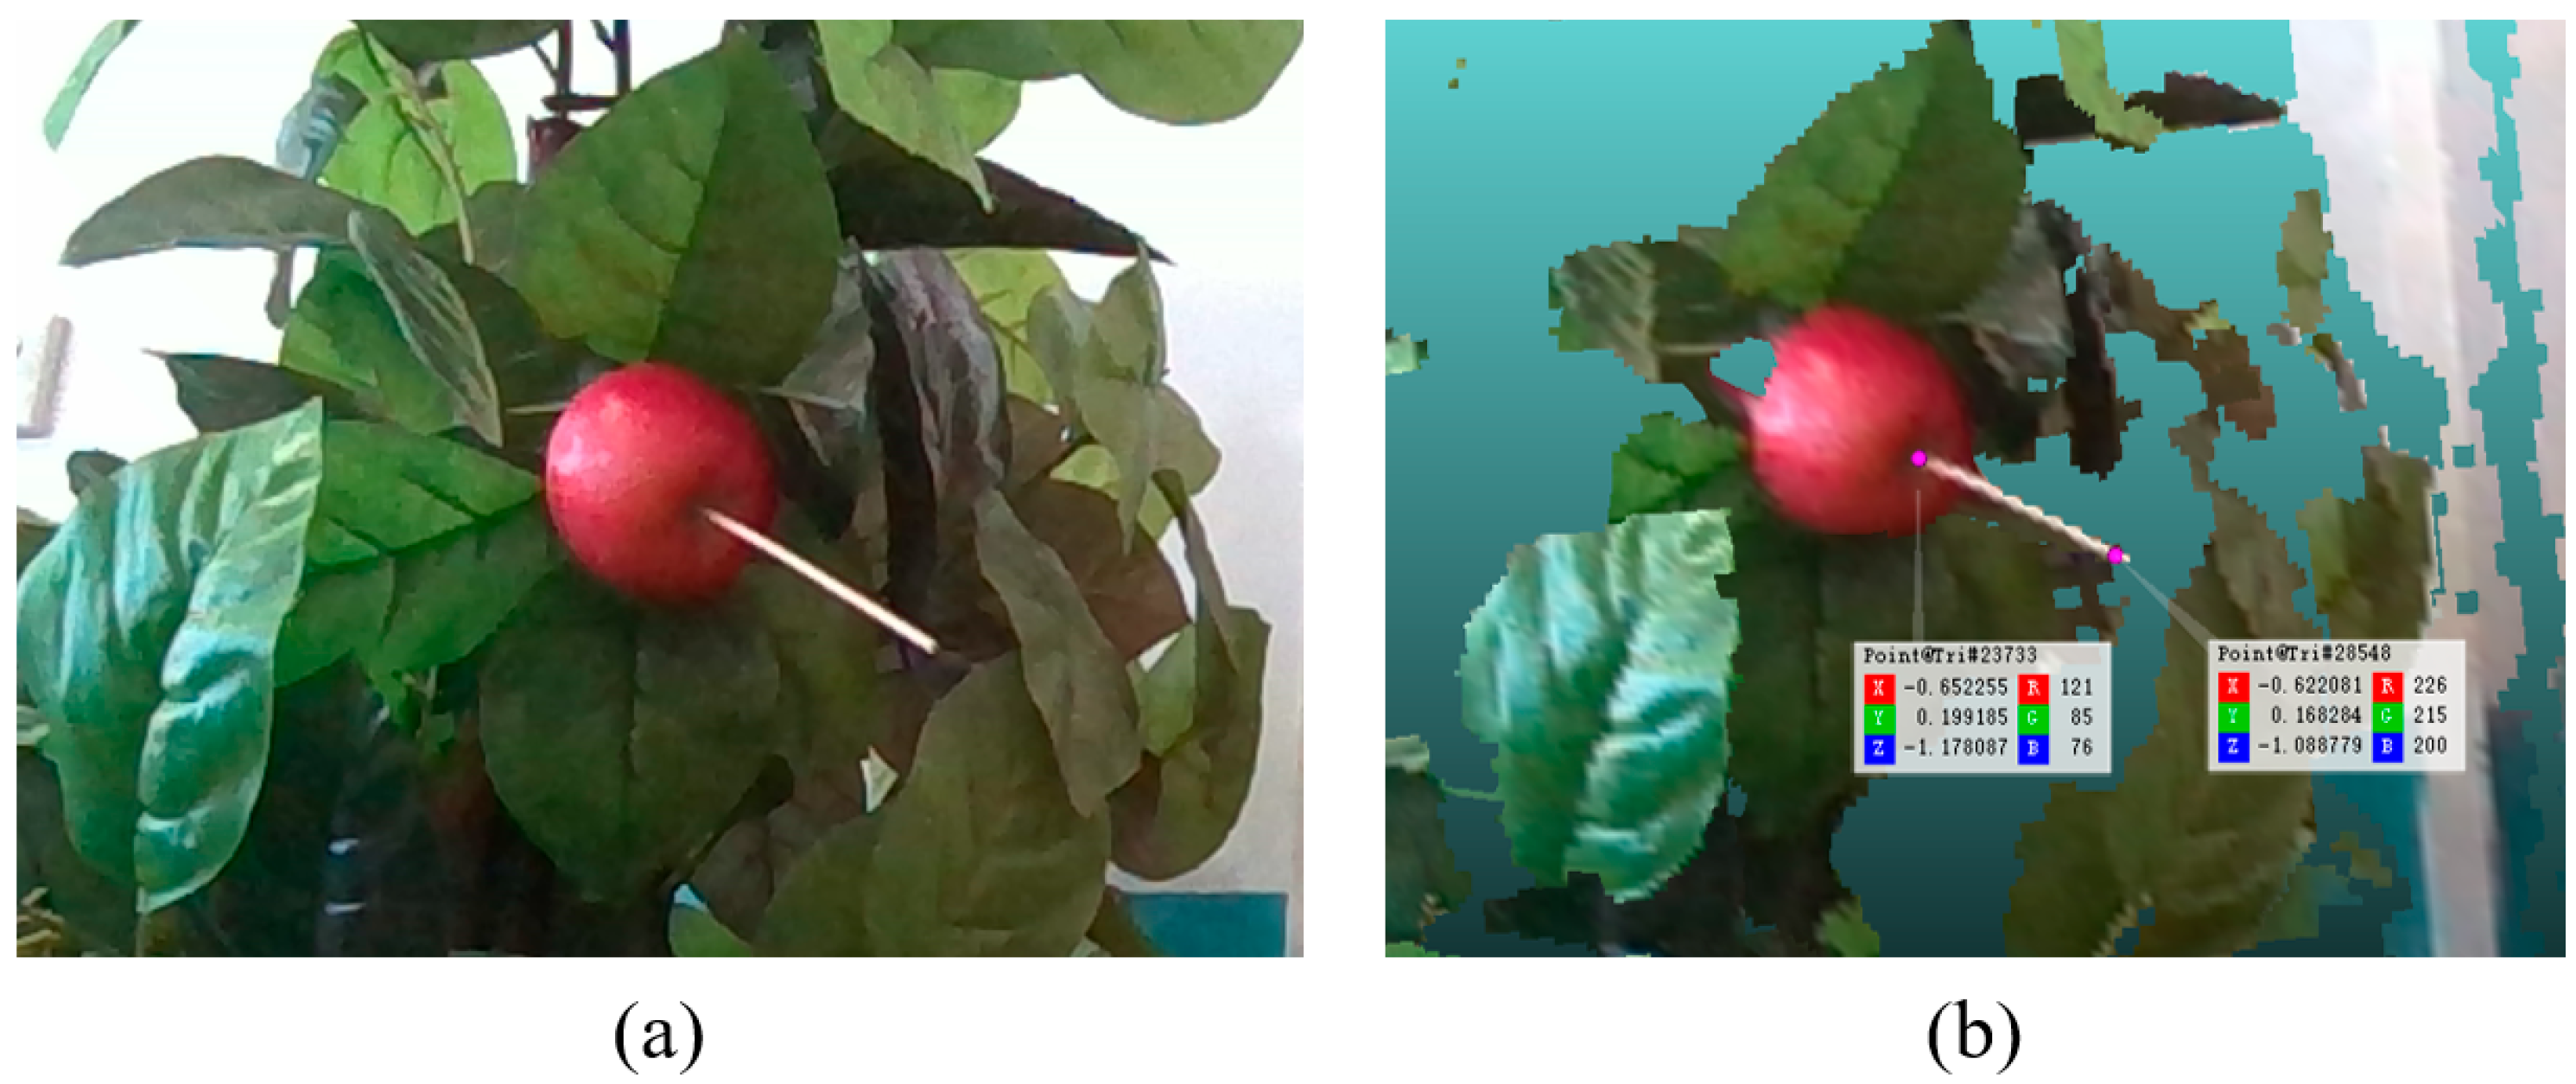
To validate the effectiveness and assess the accuracy of the proposed method, an experimental protocol was designed in a laboratory setting to simulate a real orchard scenario with apple trees. The experiment uses a dummy apple tree model with real apples fixed on the branches to ensure that the experimental conditions are as close as possible to the real situation. To accurately obtain the true attitude orientation of the apples, a manual labeling method is used for estimation, which in turn verifies the effectiveness of the method in field applications and estimates its possible accuracy errors. As shown in Figure 10a, a thin bamboo stick is inserted into the calyx of the apple. The bamboo stick is guaranteed to represent the attitude of the apple in a stable manner and remain within the field of view of the camera when the depth camera is shooting. The depth camera was used to take multiple shots of the apple and its labeling tool from different angles to acquire data, ensuring that the apple, calyx, and labeling tool were clearly captured in each shot. CloudCompare [32], open-source 3D point cloud processing software, was used to manually record the coordinates of the marking tool’s endpoints and its location near the calyx. The vector between the two coordinate points is used as the attitude direction of the apple in the camera coordinate system, as shown in Figure 10b. The accuracy of the proposed pose estimation method was evaluated by comparing the experimentally obtained real apple pose data with the corresponding estimation results. By comparing the difference between the real pose data and the estimated pose data, the accuracy error of the method in this paper can be quantitatively evaluated. The angular error of the pose is used to evaluate the performance, and the apple pose estimation error angles are as follows:
where is the apple pose estimation vector and is the estimated pose vector. The formula measures the error in pose estimation by calculating the angle between the two vectors.

Figure 10.
Real data acquisition. Labeling tools (a), CloudCompare (v2.13.2) software labeling (b).
4. Experimental Results
4.1. Comparative Experiments with Different Models
To systematically evaluate the performance of the proposed SCH-YOLO11s network in image segmentation tasks, this paper compares the model with existing state-of-the-art models such as YOLOv8, YOLOv9, and unmodified YOLO11. The evaluation metrics include AP50, mAP, FPS, and GFLOPs to comprehensively measure the segmentation accuracy and computational efficiency of the models. Table 1 summarizes the performance comparison results of the models. The AP50 and mAP of YOLOv8s are 1.4% and 2.3% lower than SCH-YOLO11s, respectively. The mAP of YOLO11m is slightly higher than that of YOLOv8s, but its FPS is 4.3 and its GFLOPs are as high as 123, showing higher computational cost. The mAP of YOLOv9c is only lower than that of the improved network SCH-YOLO11s by 1.5%, which is the highest outside of the improved networks, yet its FPS and GFLOPs are two to three times higher than those of the other networks, respectively, making it unsuitable for tasks with stringent real-time and resource consumption requirements. In contrast, YOLO11s seems to be better suited to handle the complex details of object edges in specific segmentation tasks. In contrast, the AP50 and mAP of SCH-YOLO11s are 1.4% and 2.2% higher than those of the YOLO11s model, respectively. Overall, the SCH-YOLO11s network provides the highest segmentation accuracy among the five compared models, meeting the requirements of the pose estimation task needed for this paper’s study, proving the effectiveness and superiority of the method.

Table 1.
Comparative results for different segmentation networks.
4.2. Ablation Experiment
The effectiveness of each improved module in the SCH-YOLO11s network was systematically evaluated through ablation experiments on the apple detection dataset. These experiments take the original YOLO11s model as the baseline and gradually introduce three innovative modules, C3k2_SimAM, CMUNeXt Block, and C2PSA_HTB, and investigate the effect of each module on apple fruit and calyx basin detection and segmentation by comparing the performance metrics of the models under different configurations. Table 2 summarizes the model performance after adding different improved modules.
Table 2.
Comparison results of different object detection networks.
From Table 2, it can be seen that, after adding the C3k2_ SimAM module, the network’s recognition of the calyx basin is improved, which is due to the fact that the module helps to capture the target features more comprehensively, and especially for smaller targets, there is a significant improvement; after adding the CMUNeXt Block, the AP50 and mAP of the segmented apples are improved by 1.5% and 0.4%, respectively, compared with that of the baseline model, and calyx basin values improved by 0.8% and 1.4%, which shows its advantage in multi-scale feature extraction and that it can better handle targets of different sizes. By adding the HTB to C2PSA, it can be seen that the AP50 and mAP of segmented apples improved by 1.2% and 0.5%, and those of the calyx basin also improved by 0.3% and 1.9%, respectively. The overall performance is further improved after all modules are added and, comparing the baseline model, apples have 0.8% and 1.6% improvements in AP50 and mAP for recognition and calyx basins have 0.9% and 3% improvements. Apples have a 1.8% improvement in both AP50 and mAP for segmentation, and calyx basins have 1% and 2.7% improvements. This demonstrates the excellent performance of SCH-YOLO11s for apple and calyx basin segmentation tasks in the orchard scenario.
Finally, several representative images from the test dataset are selected to visualize the performance of the SCH-YOLO11s network. The test results of the benchmark YOLO11s network are shown in Figure 11(a1–c1), where the yellow circles in a1, b1, and c1 show cases with misclassification of apples and calyx basins and the red circle in c1 shows a missed detection due to occlusion problems and light effects, while Figure 11(a2–c2) show improved SCH-YOLO11s network test results, to a certain extent, by improving the misjudgement and missed detection.
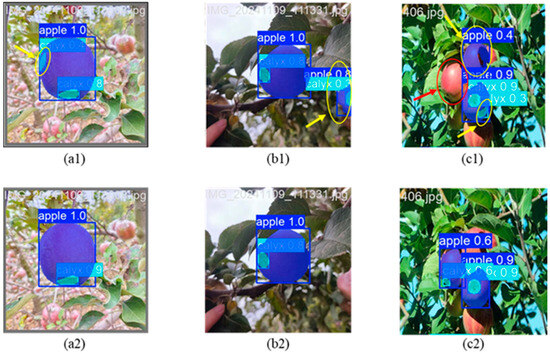
Figure 11.
Visualization of the performance of YOLO11s and SCH-YOLO11s networks. (a1–c1): Segmentation results of YOLO11s; (a2–c2): Segmentation results of SCH-YOLO11s. Yellow circles indicate classification errors; red circles highlight missed detections due to occlusion and lighting effects.
4.3. Attitude Estimation Experiment
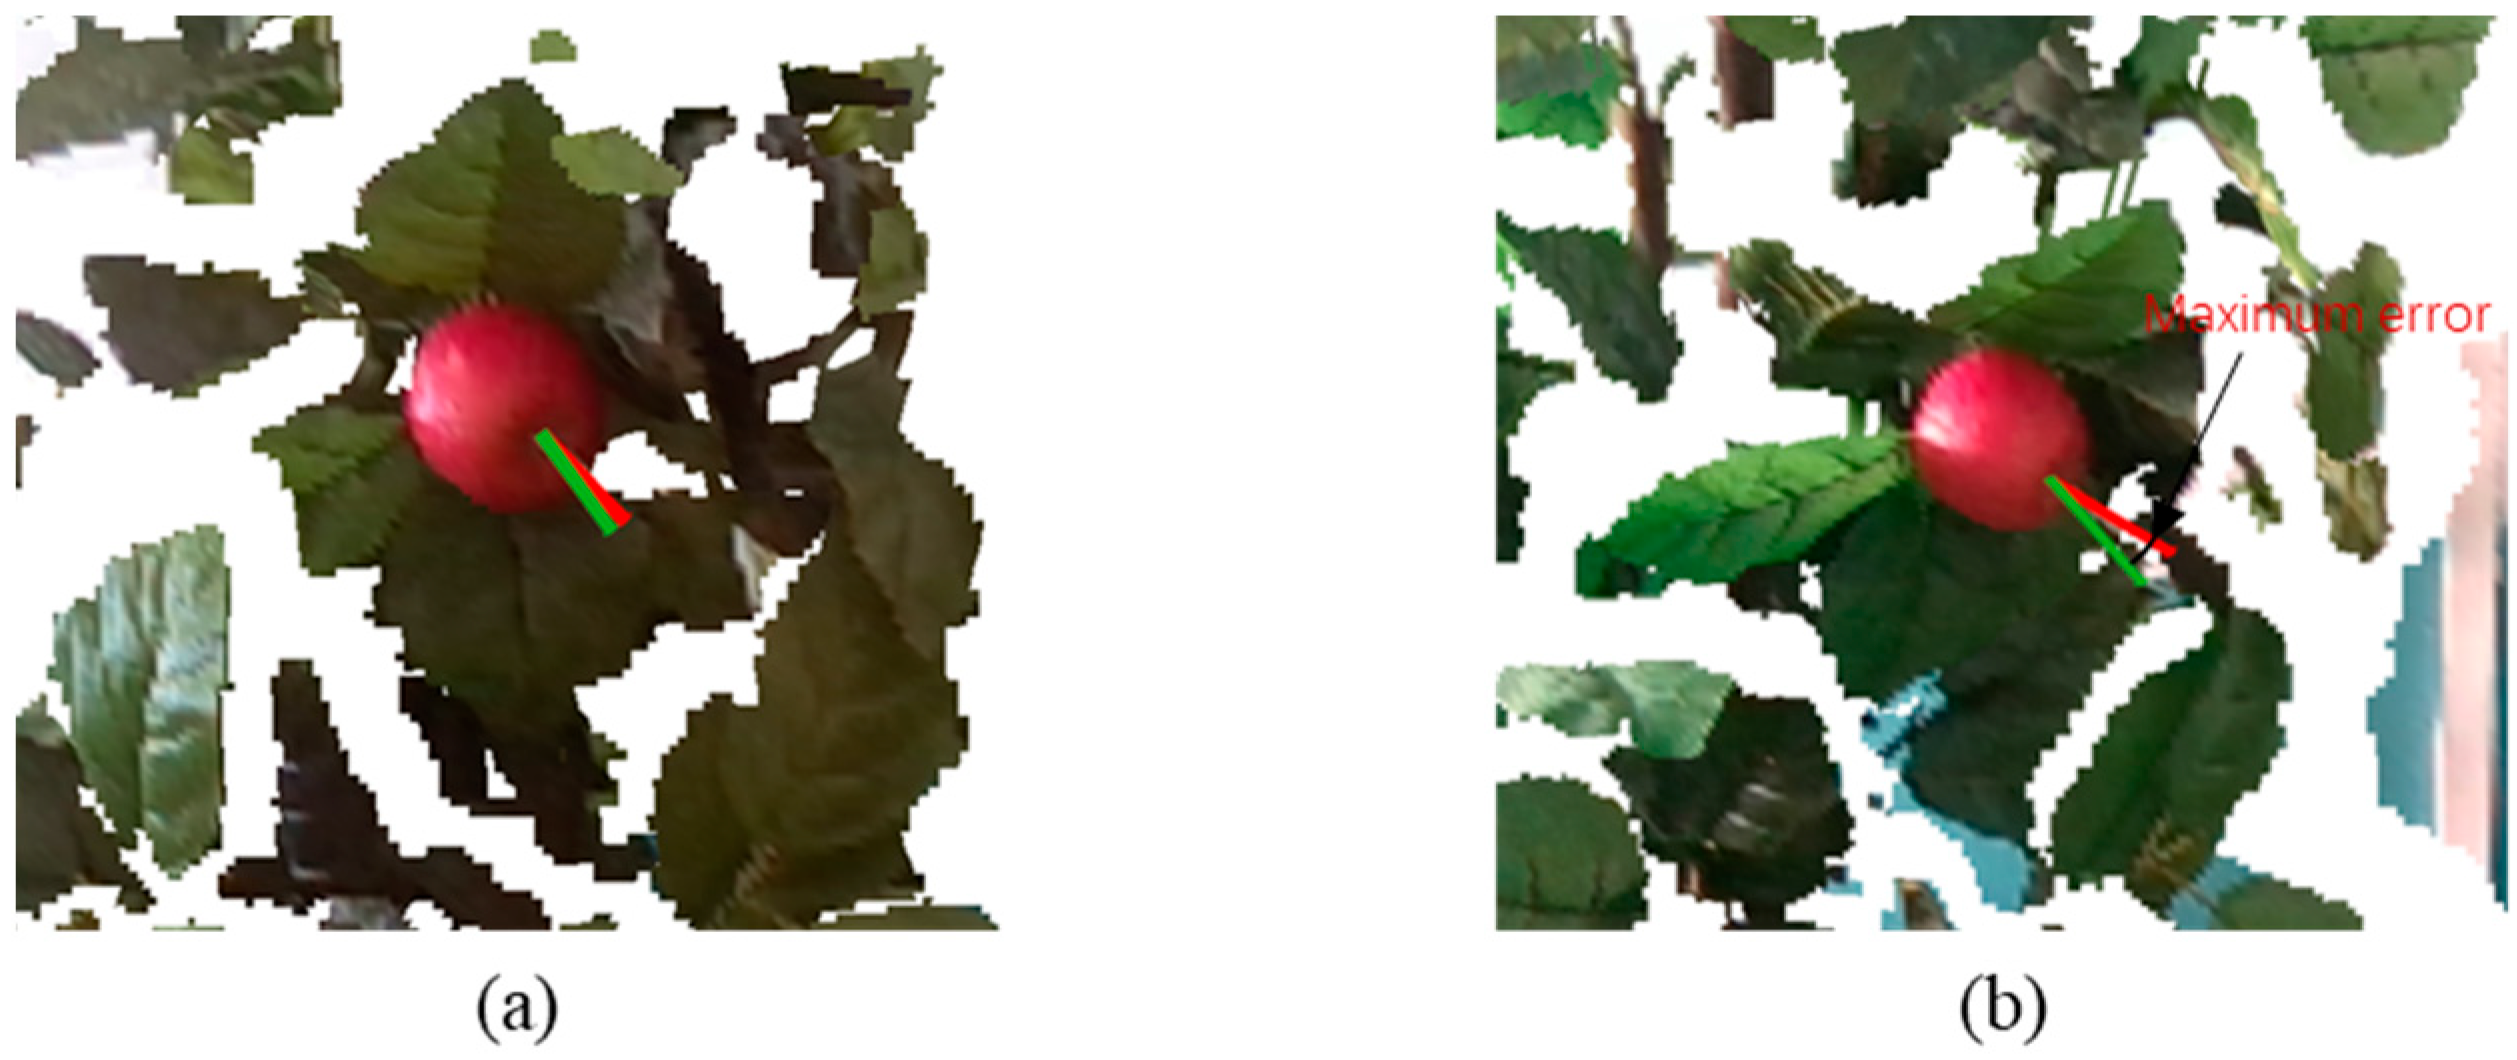
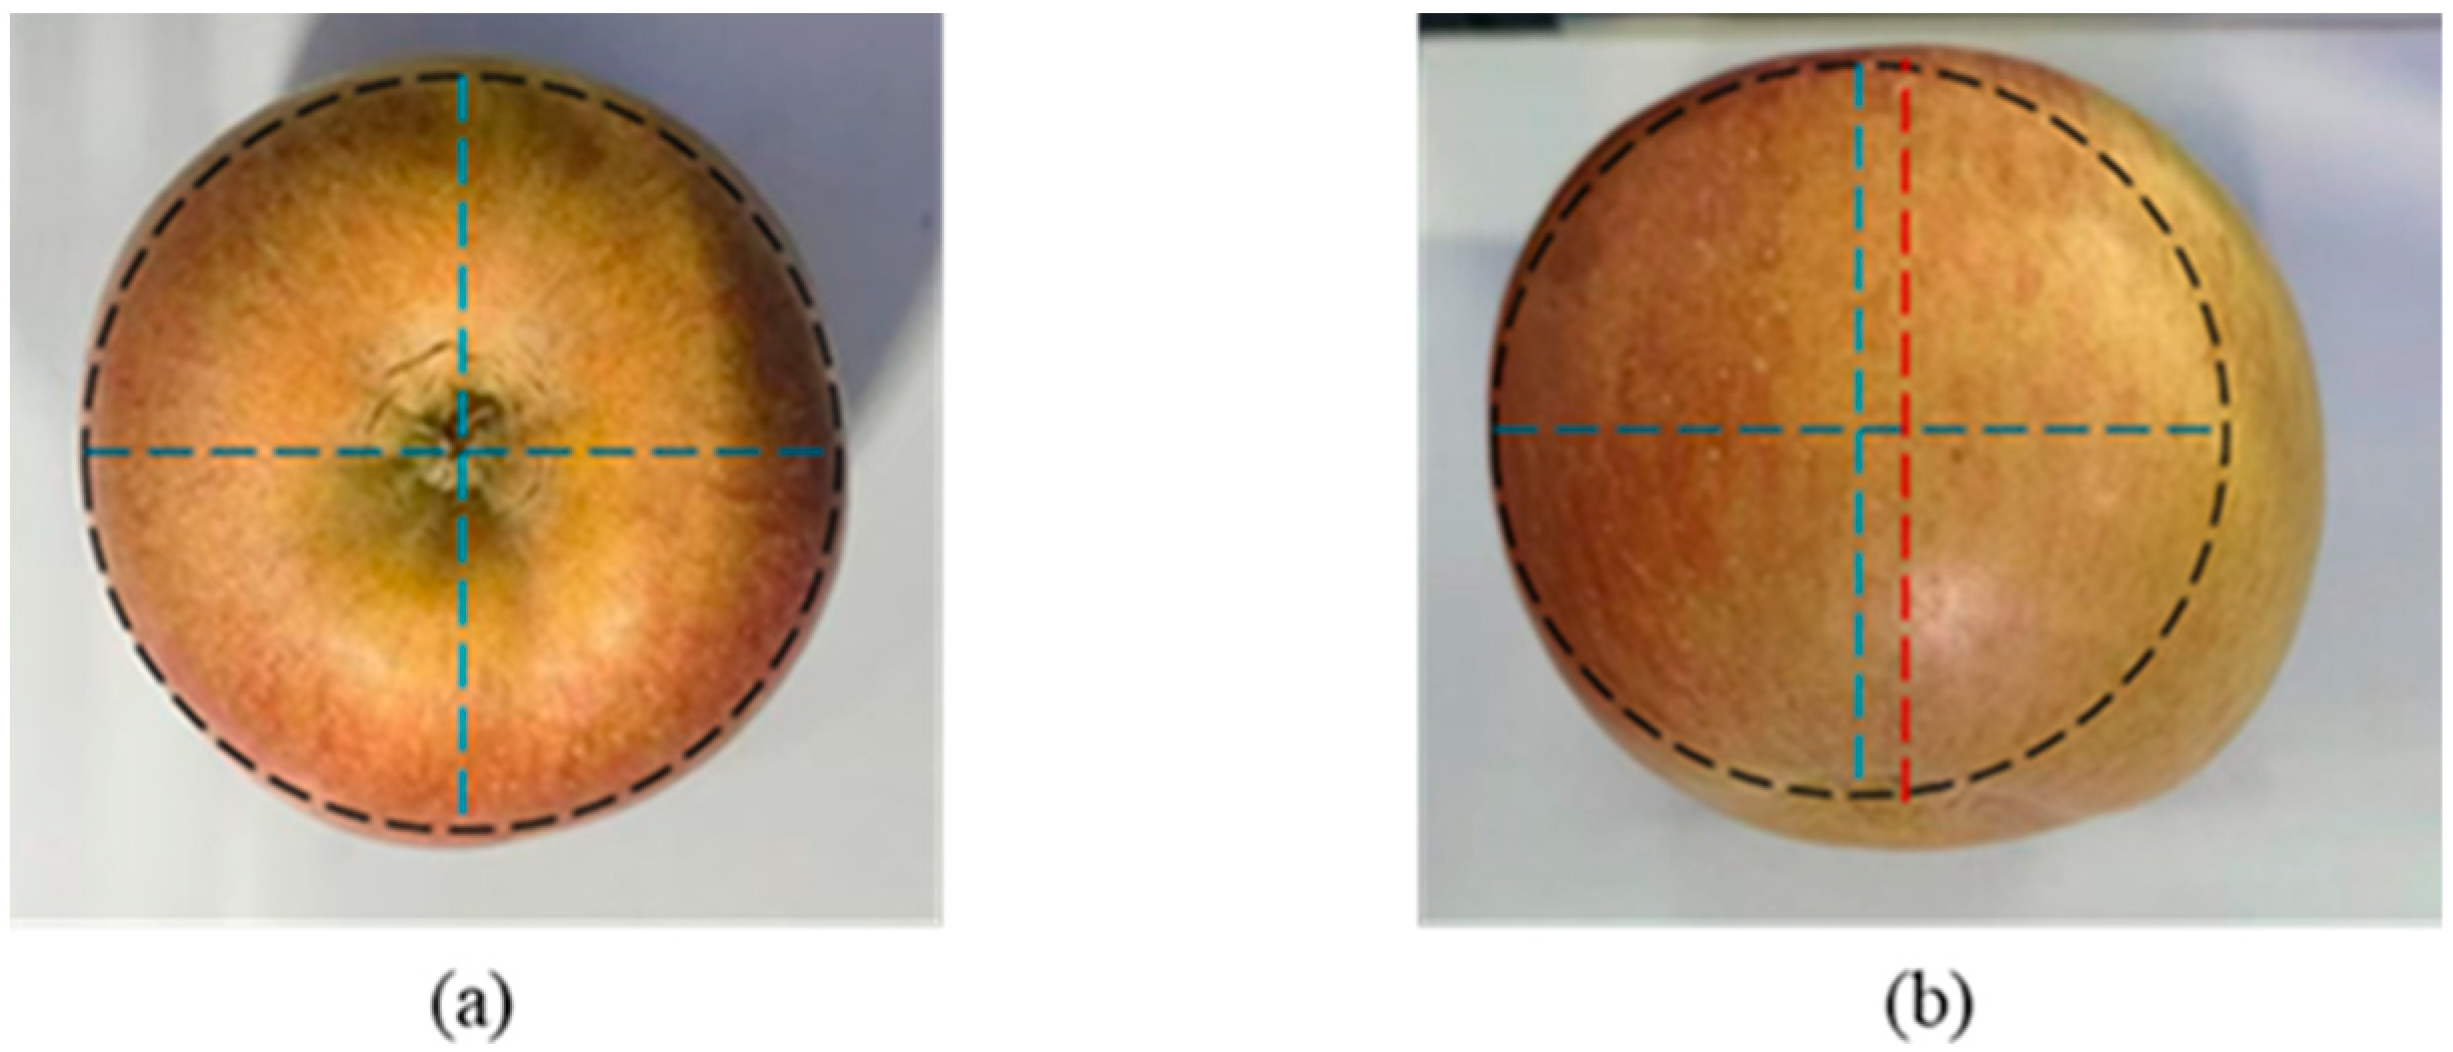
The results of pose estimation for different error angle ranges are shown in Table 3. The average angular error is 12.3 degrees, the minimum angular error is 2.63 degrees, and the maximum angular error is 24.9 degrees. The qualitative pose estimation results are shown in Figure 12, where Figure 12a,b represent the two cases where the angular error is small and large, respectively. It is observed that, when the calyx basin is completely visible, the pose estimation is more accurate because the apple side surface presents a smooth and rounded curved surface, and its horizontal profile can be approximated as a circle, with the fitted spherical center converging at the center, as in Figure 13a. On the contrary, when the concave part of the calyx is visible, the vertical profile of the fruit presents a complex surface with varying curvature, and the center of the fitted sphere deviates from the position of the actual attitude axis, as shown in Figure 13b, resulting in a larger attitude estimation error. As shown in Table 4, the average error angle is 9.71 degrees for the case where the calyx is fully visible and 18.48 degrees for the case where it is partially visible. In addition, large differences between predicted and actual angles are usually caused by incorrect segmentation of apple fruits or calyx parts that are not correctly identified and segmented. In this case, the center estimates obtained from the sphere fitting differed from the actual center position of the fruit, further increasing the error in attitude estimation.
Table 3.
Frequency, mean, maximum, and minimum of attitude errors.

Figure 12.
Apple pose estimation vs. true value. All visible errors are small (a) and some visible errors are large (b).

Figure 13.
Apple sphere fitting error. (a) Fully visible calyx basin; (b) Partially visible calyx basin. The black dashed line represents the fitted sphere under horizontal view; the intersection of blue dashed lines indicates the projected center of the fitted sphere on the plane, while the red marker denotes the actual position.
Table 4.
Frequency, Mean, Maximum, and Minimum Errors in the Visibility of Calyx basin.
5. Conclusions
Apple pose information is crucial to ensure that the picking robot avoids colliding with obstacles and protects the crop from damage during operation. This paper proposes an apple pose estimation method based on segmenting apples and calyx basins. The method employs an improved SCH-YOLO11s deep learning model to achieve instance segmentation of apples and their calyx basins while generating 3D point cloud data. Specifically, a high-quality point cloud representation is obtained by precisely aligning the segmentation mask with the depth image. Subsequently, the apple’s center is estimated using a least squares sphere fitting algorithm, while the calyx basin’s center is determined via the statistical mean of the point cloud data. Ultimately, the pose estimation of the apple is achieved by connecting the estimated centers of the apple and the calyx basin. The improved SCH-YOLO11s achieved a segmentation AP50 of 97.1% and 94.7% on the apple and calyx basins, and the mAP was improved by 1.8% and 2.7% compared to the unimproved version, respectively, and the results indicate that the improved network is suitable for use in the task of segmenting the apple fruit and calyx basins. A real dataset of apple poses was generated using manual measurements in a laboratory environment to validate the apple pose estimation, which had an average error of 12.3 degrees from the estimated angle of the apple poses. The overall processing time of the algorithm is approximately 0.08 s per image, making it suitable for real-time tasks in harvesting robots. These results show that the proposed method can be applied to the vision system of an apple picking robot.
Author Contributions
Conceptualization, J.N.; methodology, M.B.; software, M.B; validation, Q.Y.; formal analysis, M.B.; investigation, Q.Y.; resources, Q.Y.; data curation, M.B.; writing—original draft preparation, M.B.; writing—review and editing, J.N.; visualization, M.B.; supervision, J.N.; project administration, J.N.; funding acquisition, J.N. All authors have read and agreed to the published version of the manuscript.
Funding
This work was supported by Henan Province Key Research and Development Special Project under Grant No. 231111112700, Training Plan for Young Backbone Teachers in Colleges and Universities in Henan Province under Grant No. 2021GGJS077, Scientific and Technological Project of Henan Province (No. 232102211035), and North China University of Water Resources and Electric Power Young Backbone Teacher Training Project under Grant No. 2021-125-4.
Data Availability Statement
The raw data supporting the conclusions of this article will be made available by the authors on request.
Conflicts of Interest
The authors declare no conflicts of interest. The funders had no role in the design of the study; in the collection, analyses, or interpretation of data; in the writing of the manuscript; or in the decision to publish the results.
Abbreviations
The following abbreviations are used in this manuscript:
| AP | Average Precision |
| Conv | Convolution |
| DGFF | Dual-Scale Gated Feed Forward |
| DHSA | Dynamic Range Histogram Self-Attention |
| FN | False Negative |
| FP | False Positive |
| FPS | Frames Per Second |
| GELU | Gaussian Error Linear Unit |
| HTB | Histogram Transformer Block |
| IoU | Intersection over Union |
| mAP | Mean Average Precision |
| RGB-D | Red, Green, Blue-Depth |
| SimAM | Simple Attention Mechanism |
| SOR | Statistical Outlier Removal |
| TP | True Positive |
| YOLO | You Only Look Once |
References
- Guo, G.; Wen, Q.; Zhu, J. The Impact of Aging Agricultural Labor Population on Farmland Output: From the Perspective of Farmer Preferences. Math. Probl. Eng. Theory Methods Appl. 2015, 2015, 730618. [Google Scholar] [CrossRef]
- Zhang, L.; Jia, J.; Gui, G.; Hao, X.; Gao, W.; Wang, M. Deep Learning Based Improved Classification System for Designing Tomato Harvesting Robot. IEEE Access 2018, 6, 67940–67950. [Google Scholar] [CrossRef]
- Jha, K.; Doshi, A.; Patel, P.; Shah, M. A comprehensive review on automation in agriculture using artificial intelligence. Artif. Intell. Agric. 2019, 2, 1–12. [Google Scholar]
- Saleem, M.H.; Potgieter, J.; Arif, K.M. Automation in agriculture by machine and deep learning techniques: A review of recent developments. Precis. Agric. 2021, 22, 2053–2091. [Google Scholar] [CrossRef]
- Zhou, H.; Wang, X.; Au, W.; Kang, H.; Chen, C. Intelligent robots for fruit harvesting: Recent developments and future challenges. Precis. Agric. 2022, 23, 1856–1907. [Google Scholar] [CrossRef]
- Bai, Q.; Li, S.; Yang, J.; Song, Q.; Li, Z.; Zhang, X. Object detection recognition and robot grasping based on machine learning: A survey. IEEE Access 2020, 8, 181855–181879. [Google Scholar] [CrossRef]
- Yang, Y.; Han, Y.; Li, S.; Yang, Y.; Zhang, M.; Li, H. Vision based fruit recognition and positioning technology for harvesting robots. Comput. Electron. Agric. 2023, 213, 108258. [Google Scholar] [CrossRef]
- Ji, W.; Zhang, T.; Xu, B.; He, G. Apple recognition and picking sequence planning for harvesting robot in a complex environment. J. Agric. Eng. 2024, 55, 1549. [Google Scholar] [CrossRef]
- Koirala, A.; Walsh, K.B.; Wang, Z.; McCarthy, C. Deep learning–Method overview and review of use for fruit detection and yield estimation. Comput. Electron. Agric. 2019, 162, 219–234. [Google Scholar] [CrossRef]
- Espinoza, S.; Aguilera, C.; Rojas, L.; Campos, P.G. Analysis of Fruit Images with Deep Learning: A Systematic Literature Review and Future Directions. IEEE Access 2023, 12, 3837–3859. [Google Scholar] [CrossRef]
- Tian, H.; Wang, T.; Liu, Y.; Qiao, X.; Li, Y. Computer vision technology in agricultural automation—A review. Inf. Process. Agric. 2020, 7, 1–19. [Google Scholar] [CrossRef]
- Lv, J.; Niu, L.; Han, Y.; Sun, X.; Wang, L.; Rong, H.; Zou, L. A growth posture identification method of immature peaches in natural environments. Int. J. Adv. Robot. Syst. 2024, 21, 17298806241278153. [Google Scholar]
- Ji, W.; Zhai, K.; Xu, B.; Wu, J. Green Apple Detection Method Based on Multidimensional Feature Extraction Network Model and Transformer Module. J. Food Prot. 2025, 88, 100397. [Google Scholar] [CrossRef]
- Minaee, S.; Boykov, Y.; Porikli, F.; Plaza, A.; Kehtarnavaz, N.; Terzopoulos, D. Image segmentation using deep learning: A survey. IEEE Trans. Pattern Anal. Mach. Intell. 2021, 44, 3523–3542. [Google Scholar]
- Ghosh, S.; Das, N.; Das, I.; Maulik, U. Understanding deep learning techniques for image segmentation. ACM Comput. Surv. (CSUR) 2019, 52, 1–35. [Google Scholar]
- Nguyen, A.; Le, B. 3D point cloud segmentation: A survey. In Proceedings of the 2013 6th IEEE Conference on Robotics, Automation and Mechatronics (RAM), Manila, Philippines, 12–15 November 2013; IEEE: New York, NY, USA, 2013; pp. 225–230. [Google Scholar]
- Eizentals, P.; Oka, K. 3D pose estimation of green pepper fruit for automated harvesting. Comput. Electron. Agric. 2016, 128, 127–140. [Google Scholar] [CrossRef]
- Wang, F.; Tang, Y.; Gong, Z.; Jiang, J.; Chen, Y.; Xu, Q.; Hu, P.; Zhu, H. A lightweight Yunnan Xiaomila detection and pose estimation based on improved YOLOv8. Front. Plant Sci. 2024, 15, 1421381. [Google Scholar] [CrossRef] [PubMed]
- Lin, G.; Tang, Y.; Zou, X.; Xiong, J.; Li, J. Guava Detection and Pose Estimation Using a Low-Cost RGB-D Sensor in the Field. Sensors 2019, 19, 428. [Google Scholar] [CrossRef]
- Yin, W.; Wen, H.; Ning, Z.; Ye, J.; Dong, Z.; Luo, L. Fruit detection and pose estimation for grape cluster–harvesting robot using binocular imagery based on deep neural networks. Front. Robot. AI 2021, 8, 626989. [Google Scholar]
- Jang, M.; Hwang, Y. Tomato pose estimation using the association of tomato body and sepal. Comput. Electron. Agric. 2024, 221, 108961. [Google Scholar] [CrossRef]
- Russell, B.C.; Torralba, A.; Murphy, K.P.; Freeman, W.T. LabelMe: A Database and Web-Based Tool for Image Annotation. Int. J. Comput. Vis. 2008, 77, 157–173. [Google Scholar] [CrossRef]
- Jain, A.K. The fundamentals of digital image processing prentice-hall. Chem. Soc. Rev. 1995, 24, 243–250. [Google Scholar] [CrossRef]
- Jocher, G.; Qiu, J.; Chaurasia, A. Ultralytics YOLO (Version 8.3.50). [Computer Software]. 2023. Available online: https://github.com/ultralytics/ultralytics (accessed on 1 December 2024).
- Yang, L.; Zhang, R.Y.; Li, L.; Xie, X. SimAM: A Simple, Parameter-Free Attention Module for Convolutional Neural Networks; PMLR: Cambridge, MA, USA, 2021. [Google Scholar]
- Tang, F.; Ding, J.; Quan, Q.; Wang, L.; Ning, C.; Zhou, S.K. CMUNeXt: An Efficient Medical Image Segmentation Network based on Large Kernel and Skip Fusion. In Proceedings of the 2024 IEEE International Symposium on Biomedical Imaging (ISBI), Athens, Greece, 27–30 May 2023. [Google Scholar] [CrossRef]
- Sun, S.; Ren, W.; Gao, X.; Wang, R.; Cao, X. Restoring images in adverse weather conditions via histogram transformer. In Proceedings of the European Conference on Computer Vision, Paris, France, 26–27 March 2025; Springer: Cham, Switzerland, 2025; pp. 111–129. [Google Scholar]
- Howard, A.G.; Zhu, M.; Chen, B.; Kalenichenko, D.; Wang, W.; Weyand, T.; Andreetto, M.; Adam, H. MobileNets: Efficient Convolutional Neural Networks for Mobile Vision Applications. arXiv 2017, arXiv:1704.04861. [Google Scholar] [CrossRef]
- Rusu, R.B.; Cousins, S. 3D is here: Point Cloud Library (PCL). In Proceedings of the IEEE International Conference on Robotics & Automation, Shanghai, China, 9–13 May 2011; IEEE: New York, NY, USA, 2011. [Google Scholar] [CrossRef]
- Pratt, V. Direct least-squares fitting of algebraic surfaces. ACM SIGGRAPH Comput. Graph. 1987, 21, 145–152. [Google Scholar] [CrossRef]
- Wang, C.Y.; Yeh, I.H.; Mark Liao, H.Y. YOLOv9: Learning What You Want to Learn Using Programmable Gradient Information. In Proceedings of the European Conference on Computer Vision, Paris, France, 26–27 March 2025; Springer: Cham, Switzerland, 2025. [Google Scholar] [CrossRef]
- Anon. CloudCompare. Version 2.13.2, GPL Software. 2023. Available online: http://www.cloudcompare.org/ (accessed on 12 December 2024).


Disclaimer/Publisher’s Note: The statements, opinions and data contained in all publications are solely those of the individual author(s) and contributor(s) and not of MDPI and/or the editor(s). MDPI and/or the editor(s) disclaim responsibility for any injury to people or property resulting from any ideas, methods, instructions or products referred to in the content. |
© 2025 by the authors. Licensee MDPI, Basel, Switzerland. This article is an open access article distributed under the terms and conditions of the Creative Commons Attribution (CC BY) license (https://creativecommons.org/licenses/by/4.0/).