Article

Effects of Secondary Salinization on Soil Phosphorus Fractions and Microbial Communities Related to Phosphorus Transformation in a Meadow Grassland, Northeast China

1
College of Life and Health Sciences, Northeastern University, Shenyang 110169, China
2
Liaoning Province Key Laboratory of Bioresource Research and Development, Northeastern University, Shenyang 110169, China
*
Author to whom correspondence should be addressed.
Agronomy 2025, 15(4), 960; https://doi.org/10.3390/agronomy15040960
Submission received: 11 March 2025 / Revised: 9 April 2025 / Accepted: 14 April 2025 / Published: 15 April 2025
(This article belongs to the Section Grassland and Pasture Science)

Abstract

:
Soil microorganisms play key roles in soil phosphorus (P) mobilization in grassland ecosystems. However, little is known about how bacterial communities involved in P transformation respond to soil secondary salinization. In this study, a meadow grassland with a gradient of secondary salinization in the semi-arid Horqin Sandy Land, Northeast China was selected. Soil properties, P fractions, the P transformation potentials, the community structures, and the abundance of a phosphorus (P)-mineralizing gene (phoD) and a P-solubilizing gene (gcd) were determined. NaHCO3-Pi and NaOH-Pi declined with salinization, whereas H2O-P, NaHCO3-Po, and HCl-Pi increased. However, the available P fractions (H2O-P and NaHCO3-Pi) remained largely unaffected. Soil salinization significantly decreased the relative abundance of Xanthomonadales and Caulobacterales and increased that of Pseudonocardiales and Enterobacterales. The P fractions, the abundance of the phoD and gcd genes, and the community structures were all closely associated with soil organic matter, total nitrogen, pH, and soil moisture. Additionally, the structures of the phoD and gcd communities were significantly correlated with NaHCO3-Pi and NaOH-Pi. Overall, secondary salinization altered bacterial communities related to P transformation by modifying soil properties, leading to decreases in the labile P and moderately labile P fractions.

1. Introduction

Phosphorus (P) is an essential macronutrient for all living organisms. However, only a small proportion of the P pool, in the form of inorganic phosphate anions (e.g., H2PO4 and HPO42−), can be absorbable and utilizable for plants or microbes [1]. Therefore, P deficiency is prevalent in many terrestrial ecosystems, rendering it a significant limiting factor for primary production. P exists in soil in various forms, and the majority can be adsorbed onto soil particles, incorporated into soil minerals as inorganic P (Pi), integrated into soil organic matter as organic P (Po), or contained within biological biomass P. The bioavailability of soil P depends on its form and total concentration. Specifically, P adsorbed onto soil surfaces is readily accessible to plants, whereas P incorporated within soil matrices tends to be insoluble and recalcitrant, limiting its bioavailability. Based on the bioavailability, soil P can be categorized into five distinct fractions: available P (anion-exchange resin P or H2O-P), labile P (NaHCO3-P), moderately labile P (NaOH-P), recalcitrant P (HCl-P), and residual P [2,3,4,5]. The dynamics of P fractions is influenced by the soil’s physical, chemical, and microbiological properties. Some studies have confirmed that the application of organic fertilizers resulted in alterations in the P fraction pattern, indicating a strong relationship between soil nutrient and P pools [5,6,7]. Aleixo et al. [8] also observed a positive correlation between soil nitrogen levels (N) and available, labile, and less labile P. Meanwhile, the stoichiometry ratios of carbon (C), N, and P in soil are a critical determinant of P’s bioavailability, because they can influence the structure of microbial communities involved in P cycling [9]. Microbial activities and their releases of various organic acids and extracellular enzymes are generally conducive to the transformation of soil P forms [10]. In addition, soil pH and salinity also strongly affect the P pool within soil [11,12,13,14].
The solubilization of insoluble Pi and the mineralization of Po are critical processes influencing P’s bioavailability in soils [15,16,17]. These processes are primarily driven by soil microorganisms through the exudation of organic acids, protons, and siderophores and the excretion of extracellular enzymes [10]. Among organic acids, gluconic acid is recognized as the most effective organic acid for Pi solubilization [18]. Gluconic acid is synthesized via the oxidation of glucose, a reaction catalyzed by the enzyme glucose dehydrogenase, which is encoded by the quinoprotein glucose dehydrogenase gene (gcd). Extracellular alkaline phosphatase (ALP) is a non-specific enzyme produced exclusively by soil microorganisms, including bacteria, archaea, and fungi [19,20]. ALP can catalyze the hydrolysis of phosphomonoesters and phosphodiesters, the predominant Po forms in soils [21]. The ALP gene is encoded by three homologous genes: phoD, phoA, and phoX [22]. Among these, the phoD gene is more prevalent and exhibits greater diversity in soils compared to phoA and phoX [23,24]. Studies have shown that the diversity and composition of soil microbial communities harboring the gcd and phoD genes are strongly influenced by soil properties, particularly P status and pH [25,26,27,28,29,30,31].
Secondary soil salinization, a global environmental issue that is prevalent in arid and semi-arid regions, is generally characterized by simultaneous increases in soil salinity and pH as a consequence of inappropriate agriculture practices. The soil contains salts such as chlorides, sulfates, and nitrates (and bicarbonates) of sodium (Na), calcium (Ca), magnesium (Mg), and potassium (K). The presence of these salts can be indicated by salinity. Salt accumulation primarily occurs in arid and semi-arid regions, where evaporation exceeds precipitation and leaching is insufficient to remove salts from the soil profile. When the soil accumulates high levels of carbonates, the soil pH exceeds 8.3. As a result, increases in soil salinity and pH often occur simultaneously. In China, approximately 29.3 million hm2 of grasslands has been affected by salinization and alkalization [14]. The Horqin Sandy Land, covering an area of 5.18 × 10⁴ km2, is the largest sandy land in China and has experienced extensive desertification in recent decades. A large area of meadow grasslands is distributed in the sandy land, which mainly contributes to the development of the local animal husbandry industry. However, the meadow grasslands have largely been seriously degraded and salinized due to overgrazing driven by rapid population growth. Overgrazing has altered the composition and structure of the vegetation, reduced the productivity of the grasslands, and decreased the average height and coverage of the vegetation. Concurrently, the decline in vegetation coverage has increased soil evaporation and promoted upward movement of soil salts with the shifts in capillary and non-capillary water. This process leads to the accumulation of soluble salts (mainly Na2CO3 and NaHCO3), as insufficient rainfall in this semi-arid climate prevents salts from penetrating back into the deeper soil layers. Soil salinization significantly impacts the soil’s properties, including nutrient bioavailability, further reducing grasslands’ productivity [32,33]. Excessive salt also deteriorates the soil structure and compacts soil particles, negatively affecting microbial activities and nutrient availability (e.g., nitrogen) [33]. In most terrestrial ecosystems, particularly grasslands, P availability is inherently limited. However, emerging evidence suggests that salinization may transiently increase soil P availability, thereby partially alleviating salt-induced constraints on plant productivity [34,35]. This phenomenon implies that soil salinization exerts a distinct regulatory effect on P dynamics compared to other nutrients (e.g., nitrogen). Given the key role of microbe-mediated processes in governing P speciation and transformation, a mechanistic understanding of how salinization influences P fractions and the microbial communities responsible for P cycling is imperative. Specifically, elucidating the responses of phosphorus-transforming microbial diversity and community composition to salinity gradients will provide critical insights into the broader implications of soil salinization for nutrient cycling and ecosystem functioning.
In this study, we examined the responses of P fractions, the P solubilization and mineralization potentials, the abundance of soil microbial gcd and phoD genes, and the structures of the microbial communities harboring these two genes across a gradient of salinization in the meadow grasslands of the Horqin Sandy Land. The aims of this study were to (1) evaluate the impact of soil properties on grassland salinization, (2) identify the dominant microbial taxa related to soil P transformation, and (3) discuss the relationship among the fractions and transformation of soil P, the microbial community structure, and the soil salinization process. We hypothesized that the grassland salinization would increase the available P fraction, and that variations in available P would be correlated with the quantitative responses of dominant gcd- and phoD-harboring microbial communities to soil salinization.

2. Materials and Methods

2.1. Site Description

This study was carried out at the Wulanaodu Experimental Station of Desertification Control, Chinese Academy of Sciences (43°02′ N, 119°39′ E, 480 a.s.l.). The station is located in the west of the Horqin Sandy Land, Inner Mongolia Autonomous Region, Northeast China. This area has a typical continental semi-arid monsoon climate. The average annual precipitation and pan evaporation is 340.5 mm and 2500 mm, respectively. The mean air temperature is 6.3 °C, with a frost-free period lasting approximately 130 days. Over 70% of precipitation occurs from May to September. The landscape is characterized by a mosaic of gently undulating sand dunes, interdune lowlands, and continuous meadow grasslands. Currently, the sand dunes are dominated by various shrubs and semi-shrubs, including Salix gordejevii, Caragana microphylla, Artemisa halodendron, and Hedysarum fruticosum, accompanied by some understory herbaceous species (e.g., Agriophyllum squarrosum, Polygonum divaricatum, Corispermum thelegium, Chenopodium acuminatum, and Pennisetum flaecidum). Most herbaceous species in this region are distributed in the meadow grasslands, and the dominant species include Aneurolepidium chinense, Lespedeza davurica, Arundinella hirta, Stellera chamaijasme, Cleistogenes chinensis, and Spodiopogon sibiricus. The meadow grasslands are commonly utilized as mowing grasslands in agricultural production, serving as a crucial source of winter forage. The grasslands are enclosed with barbed wire from April to September, and they are subsequently reopened for free grazing following the harvest in September. This utilization regime gradually leads to grassland degradation due to overgrazing. The grasslands have experienced widespread secondary salinization, characterized by the enrichment of Na2CO3 and NaHCO3 in topsoil and the triggered decreases in yield and pasture quality, primarily due to overgrazing and the superimposed effects of climate change and habitat aridification. At present, a gradient of salinization has developed around the Wulanaodu region, providing better experimental sites to study the response process of soil properties and microbial communities to continuous soil salinization.

2.2. Experimental Design and Soil Sampling

Soil samples were collected from the permanent experimental sites of the Wulanaodu Experimental Station of Desertification Control in August 2020. Three meadow grasslands with different soil salinization levels—i.e., lightly degraded grassland (average salt content = 0.11%, LD), moderately degraded grassland (average salt content = 0.44%, MD), and heavily degraded grassland (average salt content = 1.07%, HD)—were selected as the experimental sites. For each grassland, three sites were set up for soil sampling. The distance between the different sites was more than 300 m. In each site, one plot (size of 30 m × 30 m) was set up, and twenty sub-samples were randomly taken at a depth of 0–10 cm, using a soil auger with a diameter of 5 cm, and then pooled into a sample. All of the samples were sieved in the field using a 2 mm mesh and then divided into three parts for different analyses. The first part of the sample was stored at 4 °C for analysis of enzymatic activity, the second was stored at −80 °C for DNA extraction, and the third was air-dried for soil property determination.

2.3. Sequential Extractions of P Fractions

Sequential extraction of soil P fractions was performed according to the procedure of Hedley et al. [2], with some modifications described by Waldrip-Dail et al. [36]. Briefly, soil samples (0.5 g) were added to 50 mL centrifuge tubes and combined with 30 mL of the following solutions in order: (1) distilled water (H2O-P), which extracted soluble Pi; (2) 0.5 mol·L−1 NaHCO3 (NaHCO3-Pi and NaHCO3-Po), which extracted labile P adsorbed onto soil surfaces; (3) 0.1 mol·L−1 NaOH (NaOH-Pi and NaOH-Po), which extracted moderately labile P, including Fe-Al phosphates and phosphate anions associated with Fe and Al oxides and carbonates; (4) 1 mol·L−1 HCl (HCl-Pi and HCl-Po), which extracted recalcitrant P from insoluble Ca-P minerals; and (5) residual P, which was determined via digestion in H2SO4 and HF. At steps (1)~(4), 30 mL of the solution was mixed with soil, followed by shaking incubation at 25 °C for 16 h in a shaking incubator (TH2-98AB, Shanghai, China), centrifugation at 3500 rpm and 4 °C for 15 min in a refrigerated centrifuge (PLC017, Thermo Scientific, Waltham, MA, America), and filtration of the supernatant through a 0.45 µm membrane filter. Residual P was determined via digestion in H2SO4 and HF with a temperature-controlled microwave digestion system (Mars6, CEM, Matthews America). An aliquot of NaHCO3, NaOH, and HCl extracts was subjected to acid digestion to measure the total P (TP). Organic P (Po) was calculated as the difference between TP and Pi. The P fractions remaining in the soil residues were analyzed after the digestion with H2SO4 and HF. TP and Pi were analyzed by the phosphomolybdate blue assay, and the absorption spectrum was measured using an automated discrete analyzer (CleverChem 380, DeChem-Tech. GmbH, Hamburg, Germany).

2.4. Determination of Soil Physicochemical Properties

Soil pH and electrical conductivity were measured in soil–water suspensions at ratios of 1:2.5 and 1:5, respectively). Soil moisture was determined through gravimetric analysis of oven-dried soil (105 °C for 24 h). Soil bulk density was measured using a soil core (stainless steel cutting ring with a diameter and height of 5 cm) at each sampling point. Soil organic matter and total N were determined by the K2Cr2O7–H2SO4 oxidation method and the semi-micro-Kjeldahl digestion method, respectively. TP was analyzed by the molybdenum–antimony colorimetric method. Soil NH4+-N and NO3-N were extracted from the soil with 1 mol·L−1 KCl and measured by the salicylic acid and hydrazine sulfate methods, respectively. The absorption spectra for the analysis of TP, NH4+-N, and NO3-N were determined using an automated discrete analyzer (CleverChem 380, DeChem-Tech. GmbH, Hamburg, Germany). Total K and available K were extracted by nitric acid–hydrofluoric acid digestion and ammonium acetate, respectively, and were determined by the method of atomic absorption spectroscopy. All of the abovementioned analyses were performed according to the detailed descriptions of the ISSCAS [37].

2.5. Determinations of Alkaline Phosphatase (ALP) and Dehydrogenase (DHA) Activities

The activity of ALP in soil was determined by the method described by Sardans and Peñuelas [38]. In brief, 1 g of soil was combined with 1 mL of a disodium p-nitrophenyl phosphate solution in a modified universal buffer solution (pH 11.0) and subsequently incubated at 37 °C for 1 h. The p-nitrophenol produced from the enzymatic hydrolysis of disodium p-nitrophenyl phosphate by phosphatase was quantified photometrically at 400 nm. DHA activity was evaluated through the measurement of triphenyl formazone (TPF) formation [39]. Briefly, 5 g of soil was mixed with 5 mL of a 5 g L−1 triphenyltetrazolium chloride solution and 2 mL of a 0.1 mol·L−1 glucose solution, and then incubated at 37 °C for 12 h. The reactions were subsequently terminated by the addition of 0.25 mL of 98% H2SO4, and TPF was extracted using 5 mL of toluene on a shaker for 30 min. After centrifugation, the concentration of TPF in the supernatant was determined by colorimetry at a wavelength of 492 nm.

2.6. Determinations of the P Solubilization and P Mineralization Potentials

The potentials for the mineralization of organic P and solubilization of inorganic P by the microbial community were estimated according to the method of Zheng and Zhang [40]. A suspension was prepared by adding 10 g of fresh soil to 45 mL of sterile water, which was then agitated at 150 rpm for 30 min in a shaking incubator (TH2-98AB, Shanghai, China). Subsequently, 10 mL of suspension was inoculated into 35 mL of a pre-prepared culture medium and was incubated at 30 °C for 21 days in darkness in a shaking incubator. The culture medium was composed of 35 mg of phosphorite or 35 mg of lecithin, 0.5 g of (NH4)2SO4, 0.3 g of MgSO4·7H2O, 5.0 g of CaCO3, 0.3 g of KCl, 0.3 g of NaCl, trace amounts of MnSO4 and FeSO4, 100 g of glucose, and 1000 mL of distilled water. The culture medium was digested by H2SO4 and HF with a temperature-controlled microwave digestion system (Mars6, CEM, Charlotte, NC, USA), and then the TP in the culture medium was determined. After incubation, the culture medium was filtered through a 0.45 µm membrane filter, and the concentration of Pi in the supernatant was determined. The ratios of Pi/TP in the culture media added to lecithin and phosphorite were calculated as the indicators for evaluating the potential of the microbial community to mineralize organic P and dissolve inorganic P, respectively. TP and Pi were measured using the method described above.

2.7. DNA Extraction, Real-Time Quantitative PCR, and Sequencing of phoD and gcd Genes

The soil genomic DNA was extracted using a Soil DNA Quick Extraction Kit (Bioteke, Beijing, China). The phoD and gcd genes were amplified by the primer pairs phoD-F733/phoD-R1083 [27] and gcd-FW/gcd-RW [24] on a Q5 Real-Time PCR System (Applied Biosystems, Carlsbad, CA, USA), respectively. The composition of the PCR mixture included 15 μL of TB GreenTM Premix Ex TaqTM II, 1.5 μL of each primer, 2 μL of DNA, and 2.5 μL of BSA. Standard curves were generated through a 10-fold serial dilution of cloned plasmids containing the fragments of the phoD and gcd genes. The cycling conditions for the phoD and gcd genes were as follows: one cycle of 95 °C for 5 min, phoD for 35 cycles and gcd for 40 cycles of 95 °C for 30 s, 57 °C for 30 s, and 72 °C for 30 s; and a final extension of 72 °C for 10 min.
The PCR products were screened by agarose gel electrophoresis and subsequently retrieved for further analysis. High-throughput sequencing of the PCR products was performed on an Illumina MiSeq platform using a 2 × 300 paired-end configuration (Shanghai Personal Biotechnology Co., Ltd., Shanghai, China). After the quality screening of raw sequences and the removal of chimeric sequences, the remaining effective sequences were clustered into operational taxonomic units (OTUs) at a similarity threshold of 75% for phoD and 97% for gcd, and then the singletons of the OTU tables were eliminated. Taxonomic identifications of representative OTUs were performed through a BLAST algorithm-based search within GenBank (http://blast.ncbi.nlm.nih.gov/Blast.cgi, accessed on 15 April 2025). All sequences of the phoD and gcd genes were submitted to the NCBI Sequence Read Archive under the accession number SRP190750. Alpha diversity indices, including the Chao1, observed species, Shannon–Wiener, and Simpson indices, were estimated using Mothur software (version 1.21.1). Beta diversity was assessed through non-metric multidimensional scaling (NMDS) in R (vegan package). The linear discriminant analysis (LDA) effect size (LEfSe, ggtree package) and MetagenomeSeq analysis in R (MetagenomeSeq package) were performed to identify the compositional differences among different sites.

2.8. Statistical Analysis

One-way ANOVA of soil properties, P fractions, enzymatic activities, gene abundance, and diversity indices and multiple comparisons followed by the LSD test were performed using SPSS software (version 25.0); simultaneously, the responses of the above indicators to the salinization process were fitted by the linear regression model. The Pearson coefficients among the soil P fractions, the abundance of the phoD and gcd genes, and the soil physicochemical properties were calculated. Redundancy analysis (RDA) was performed using CANOCO 4.5 to determine which soil factors and P fractions significantly influenced the phoD and gcd communities. A p ≤ 0.05 was considered statistically significant.

3. Results

3.1. Soil Properties, Enzyme Activities, and P Fractions

The results of the soil properties and enzymatic activities for the LD, MD, and HD sites are shown in Table 1. Secondary soil salinization exerted a significant impact on the soil properties. Specifically, soil organic matter, total N, available N (NH4-N and NO3-N), and soil moisture linearly decreased across the salinization gradient, while pH, electrical conductivity, bulk density, and total K linearly increased (p < 0.01). Among these soil properties, soil organic matter exhibited the most pronounced variation, decreasing from 4.50% in LD to 2.60% in HD. No linear relationship was observed between the soil salt content and either total P or available K. Furthermore, the activities of ALP and DHA also showed significant linearly decreasing tendencies along the salinization gradient.
Secondary salinization of the soil significantly altered the composition patterns of the soil P fractions (Table 2; p < 0.05). H2O-P, NaHCO3-Po, and HCl-Pi linearly increased across the salinization gradient, while NaHCO3-Pi and NaOH-Pi exhibited a linear decrease. Notably, the H2O-P content in HD was 6.53 and 15.6 times higher than that in MD and LD, respectively. However, no linear trends were observed for available Pi (H2O-P and NaHCO3-Pi), NaOH-Po, HCl-Po, and residual P across the salinization gradient.
The variations in P fractions were significantly influenced by the soil properties, particularly H2O-P, NaHCO3-Pi, NaOH-Pi, and HCl-Pi. H2O-P, HCl-Pi, and NaHCO3-Po showed significant positive correlations with electrical conductivity and soil salt content (Figure S1). NaHCO3-Pi and NaOH-Pi were positively correlated with soil organic matter, soil moisture, total N, and the activities of ALP and DHA, and they were negatively correlated with pH and soil salt content.

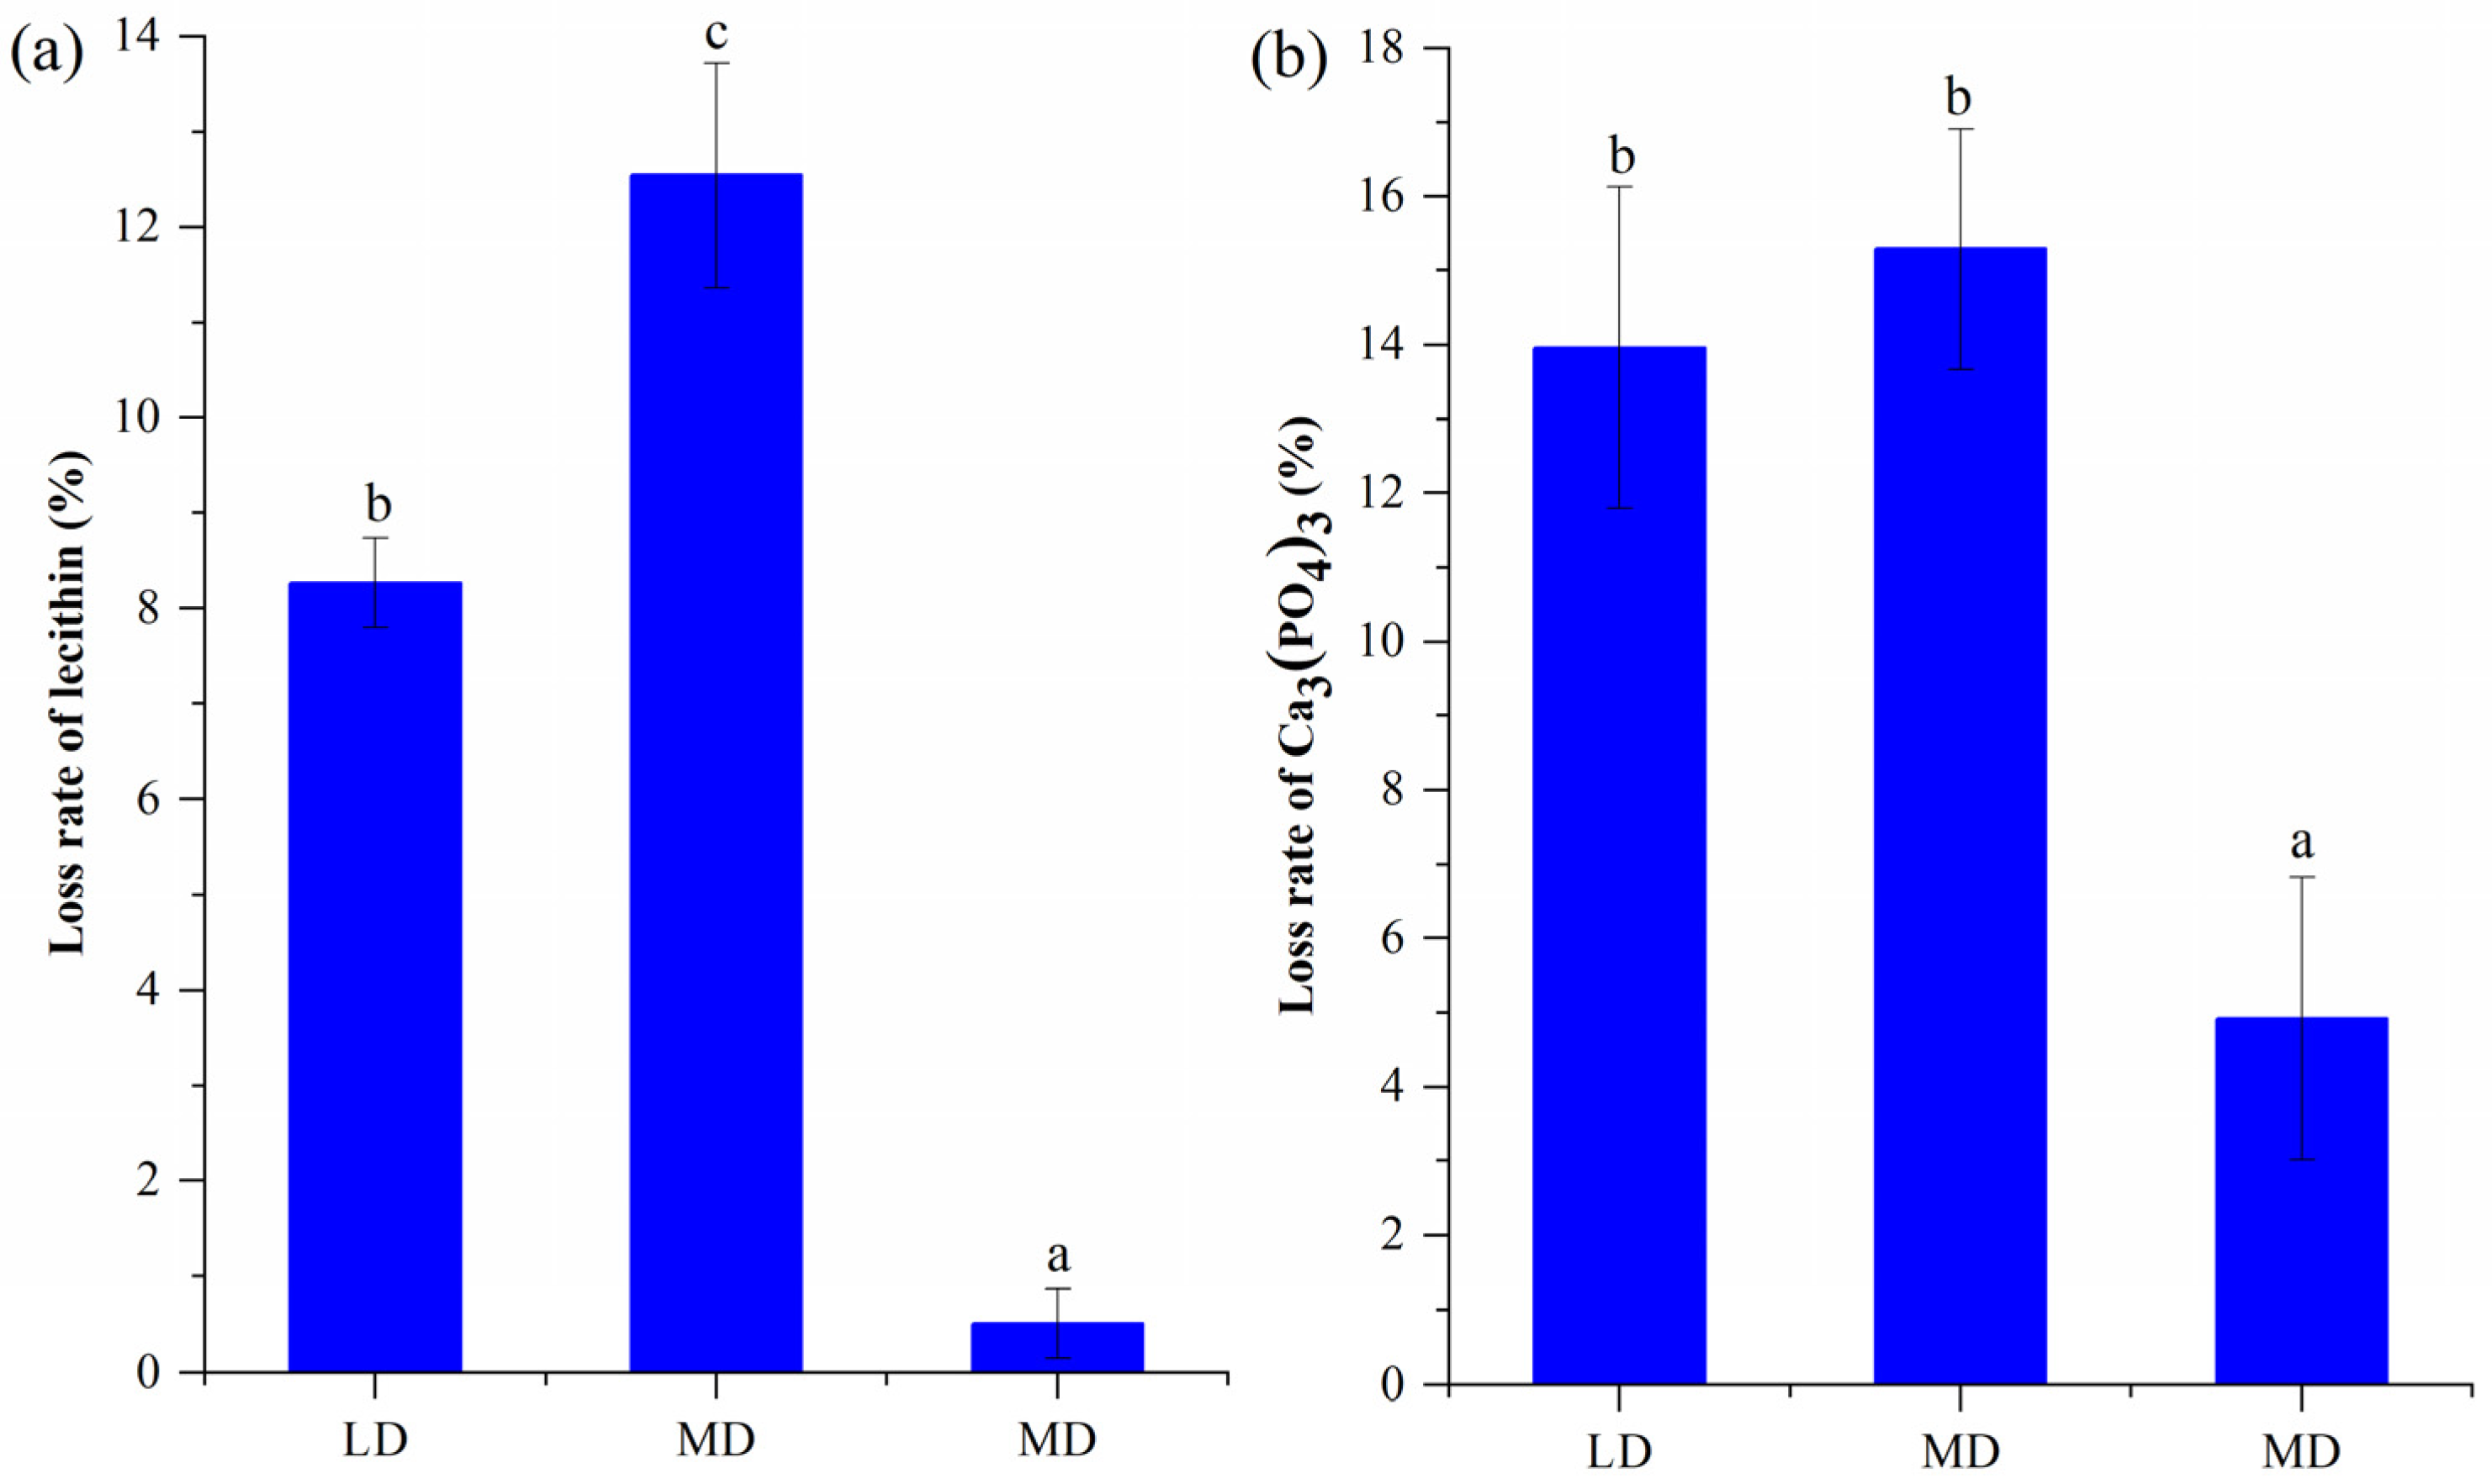
3.2. Potentials of Inorganic P Solubilization and Organic P Mineralization

The rates of phosphorite solubilization and lecithin mineralization varied significantly, ranging from 4.92% to 15.29% and from 0.51% to 12.54%, respectively (Figure 1). The highest rate of lecithin mineralization was recorded for the MD site, where it was 1.52 and 24.59 times higher than those for LD and HD, respectively. The rates of phosphorite solubilization for LD and MD were 2.84 and 3.11 times greater, respectively, compared to that for the HD site.

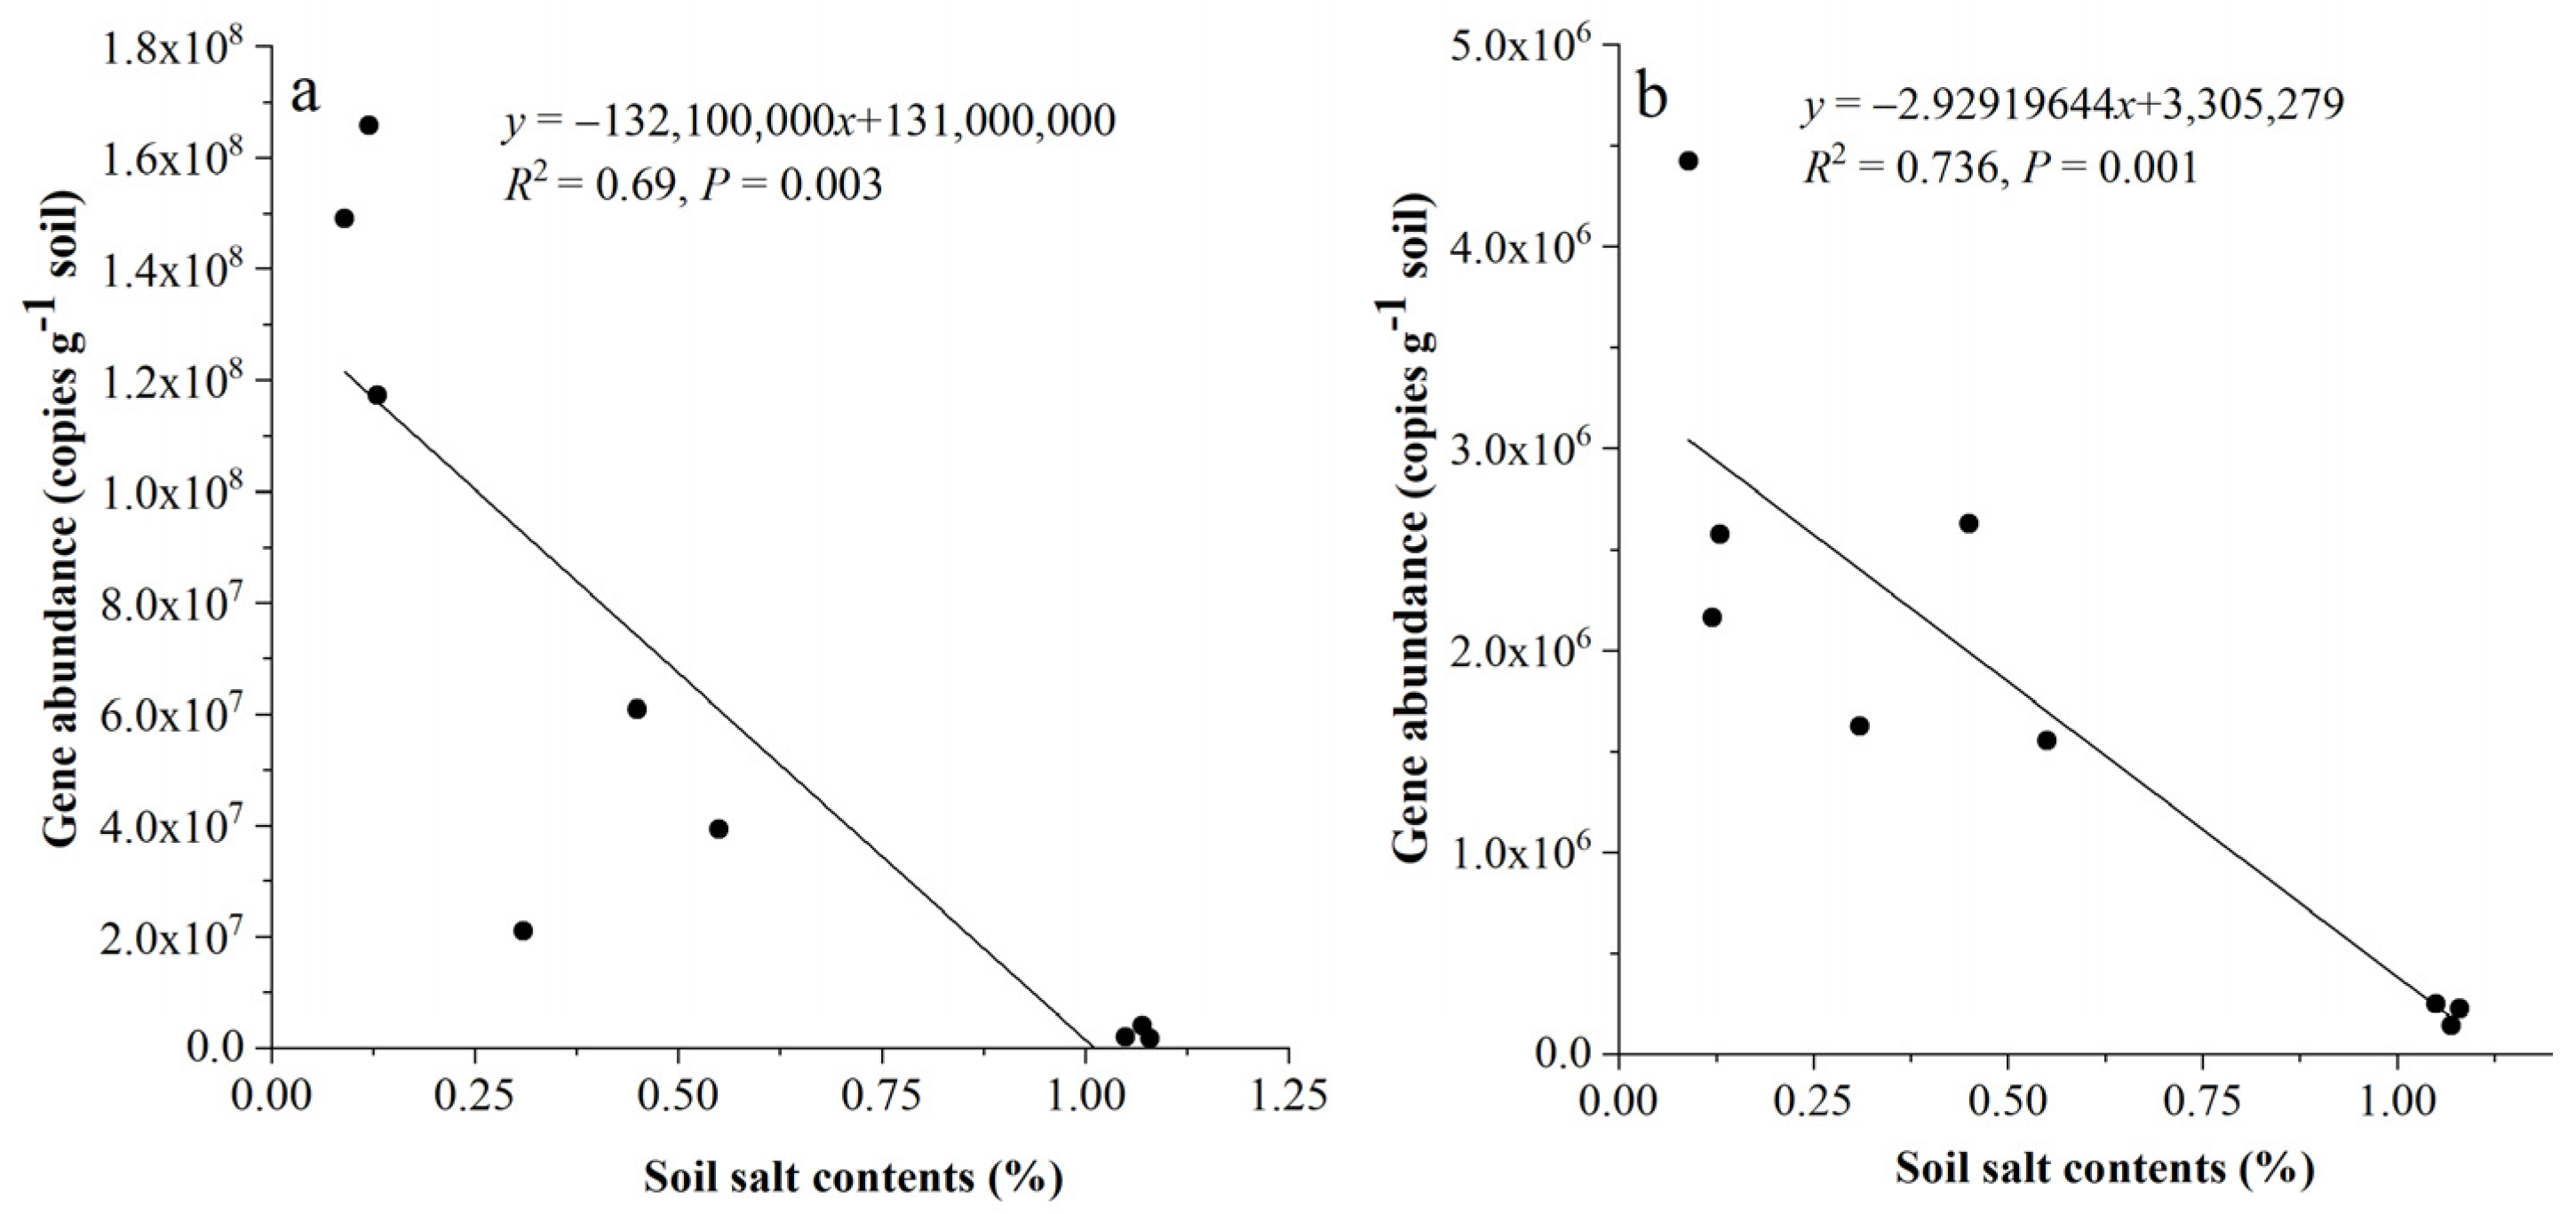
3.3. The Abundance of the phoD and gcd Genes

The abundance of the phoD and gcd genes ranged from 2.57 × 10⁶ to 1.44 × 10⁸ and from 2.06 × 10⁵ to 3.05 × 10⁶ copies g−1 dry soil, respectively (Figure 2). The phoD gene’s abundance in LD was 3.57 and 56.03 times higher than in MD and HD, respectively. Similarly, the gcd gene’s abundance was 1.57 and 14.80 times higher in LD than in MD and HD, respectively. The abundance of both phoD and gcd was positively correlated with soil organic matter, total N, NO3-N, soil moisture, DHA, NaHCO3-Pi, and NaOH-Pi (Pearson coefficients: 0.73–0.92, 0.75–0.94, 0.83–0.87, 0.74–0.97, 0.78–0.79, 0.81–0.95, and 0.74–0.94, respectively; p < 0.05) (Table S2). Conversely, it was negatively correlated with total K and bulk density (Pearson coefficients: −0.944–−0.877 and −0.874–−0.36, respectively). Additionally, the phoD gene’s abundance was positively correlated with ALP (Pearson coefficient: 0.86; p < 0.05).

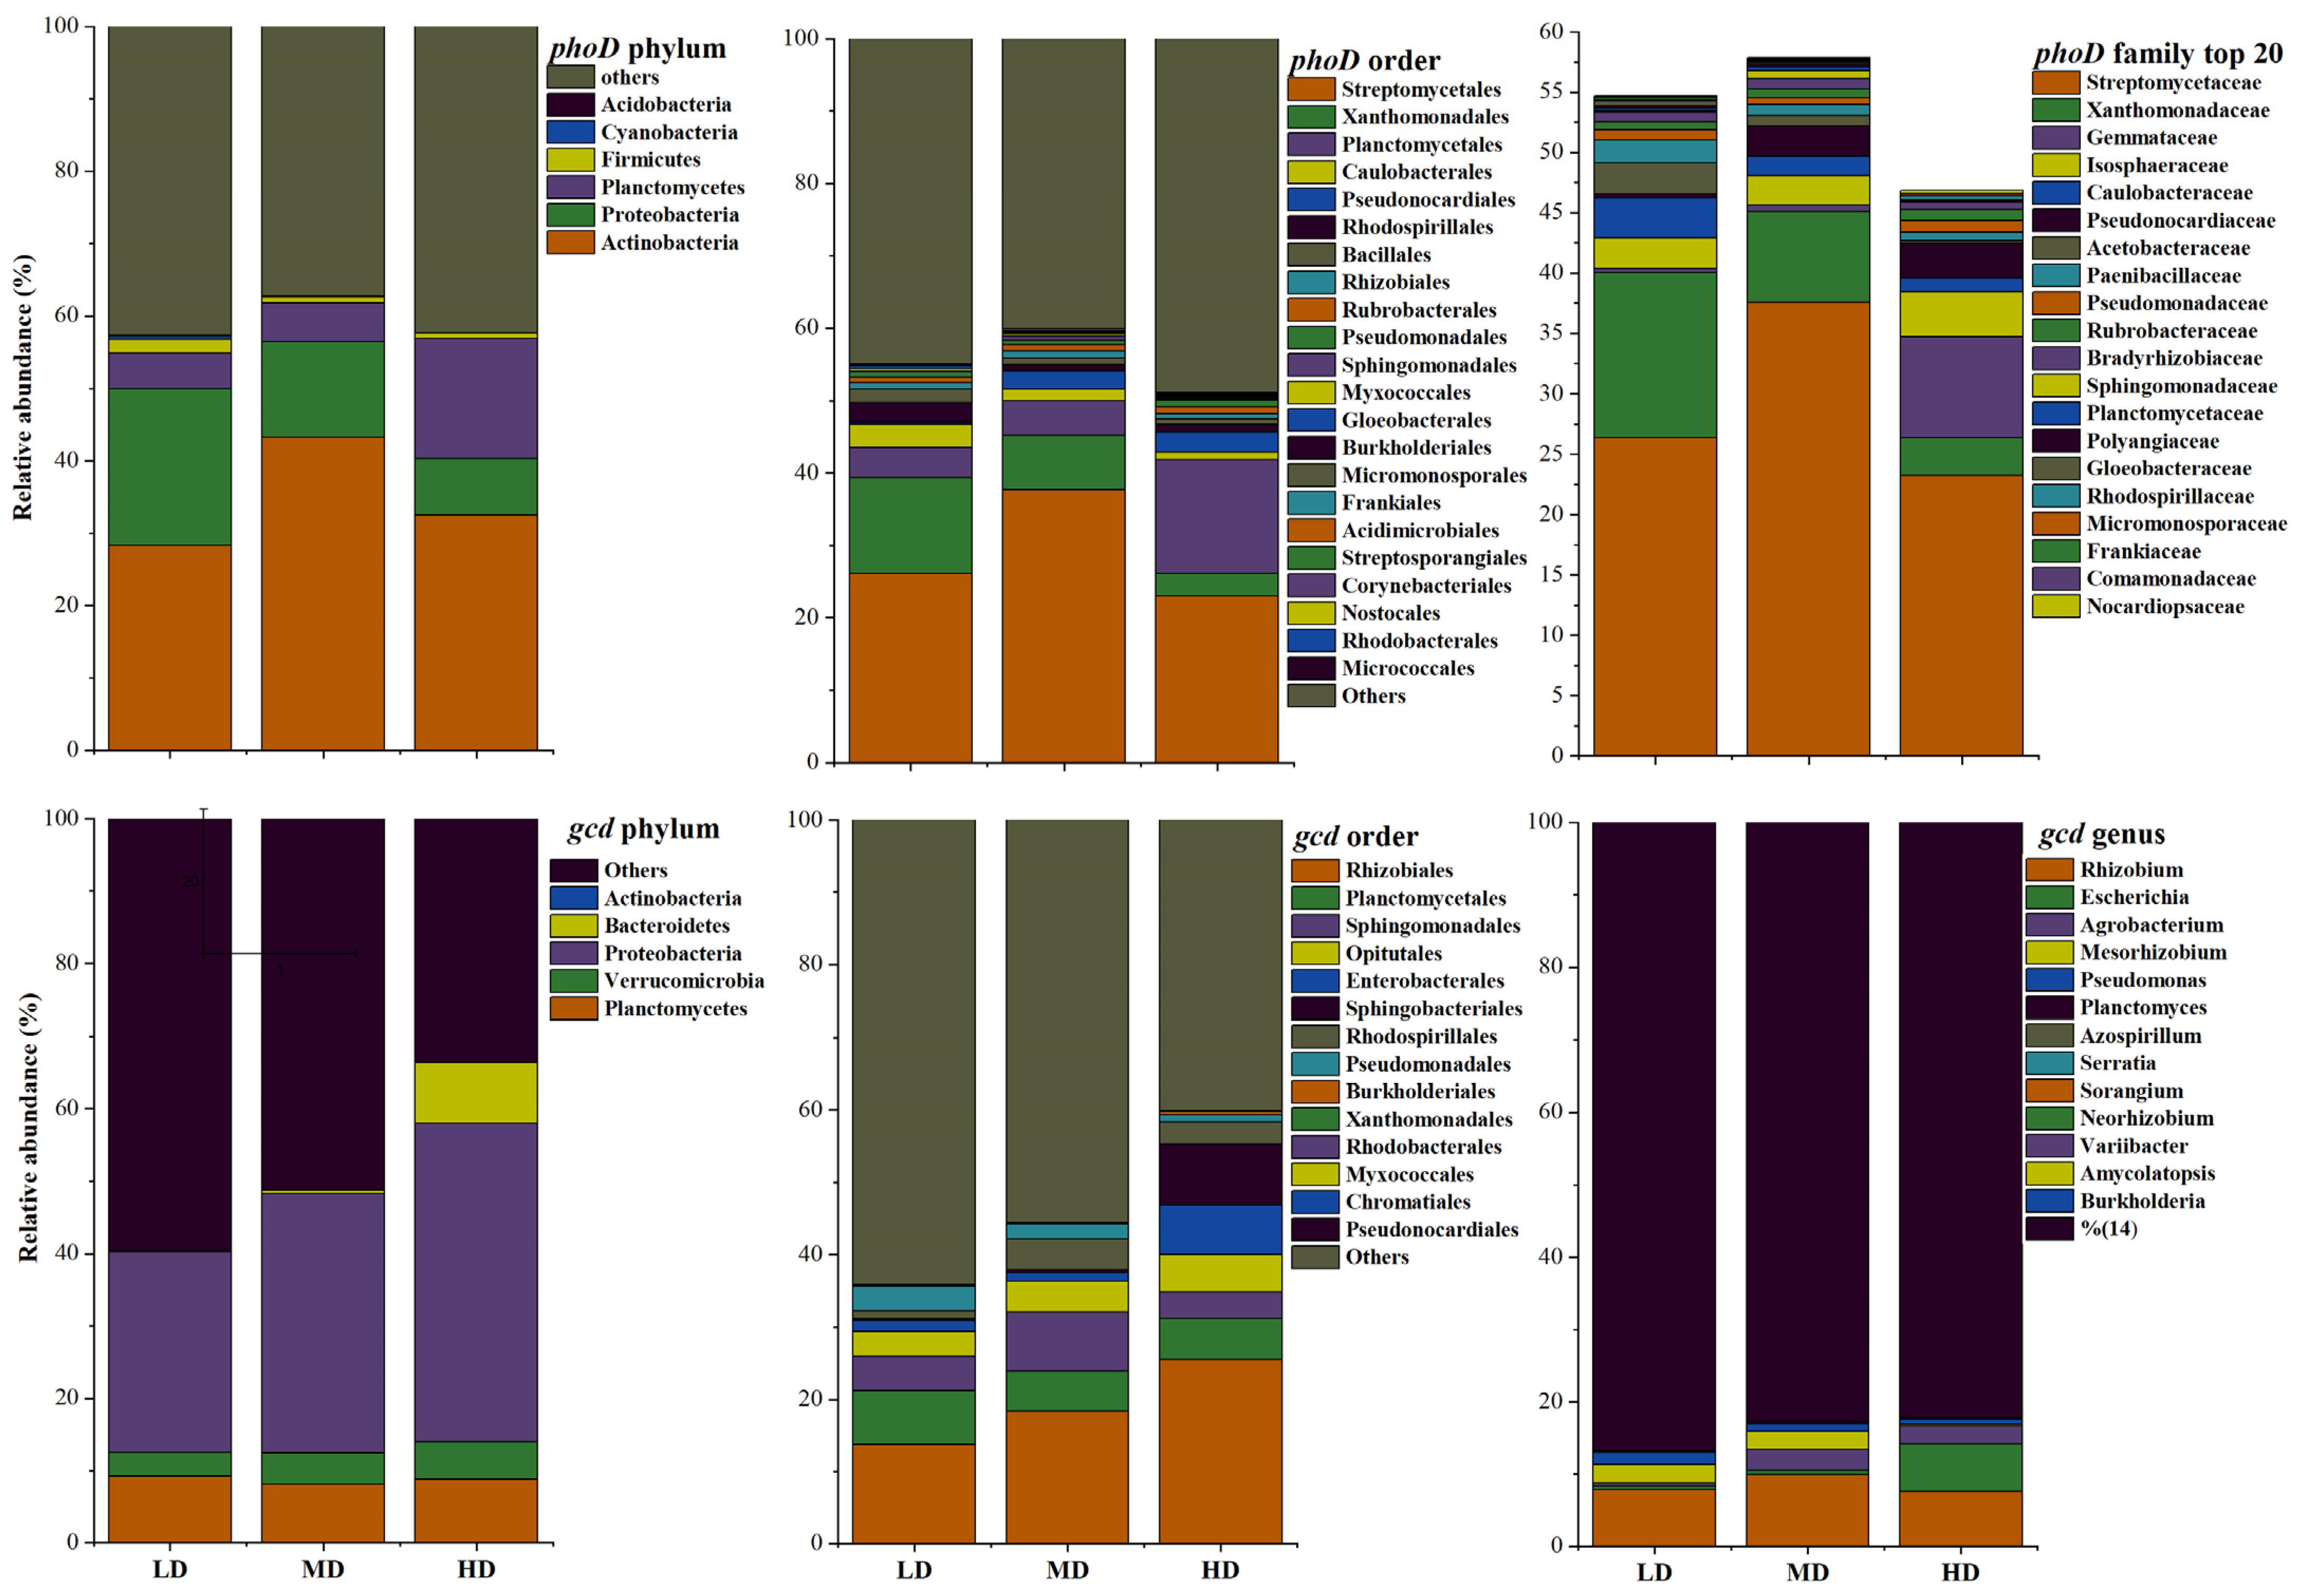
3.4. The Structures of phoD- and gcd-Harboring Microbial Communities

A total of 3575 phoD OTUs and 4563 gcd OTUs were identified through clustering analysis. No significant differences in the alpha indices of the phoD community were observed between LD, MD, and HD (Table 3). However, the Shannon–Wiener and Simpson indices of the gcd community linearly decreased with increasing soil salt content (R2 = 0.694 and 0.759, respectively; p < 0.01). In contrast, no significant linear relationships were detected between the Chao1 or observed species of the gcd community and salt content. The samples from LD, MD, and HD were individually clustered into three groups by NMDS analysis, indicating the significant differences in the phoD and gcd microbial community structures (Figure 3).
All phoD OTUs were classified into 6 phyla, 29 orders, 48 families, or 66 genera, while all gcd OTUs were classified into 5 phyla, 19 orders, 27 families, or 37 genera. Among the phoD-harboring phyla, Actinobacteria (with a relative abundance of 34.7%), Proteobacteria (14.4%), and Planctomycetes (8.7%) were the most dominant (Figure 4). The dominant phoD-harboring orders included Streptomycetales (29.1%), Xanthomonadales (8.1%), Planctomycetales (8.0%), Rhodospirillales (2.91%), Caulobacterales (2.0%), and Pseudonocardiales (1.91%). At the family level, Streptomycetaceae, Xanthomonadaceae, Gemmataceae, Isosphaeraceae, Caulobacteraceae, and Pseudonocardiaceae were identified as the most abundant phoD-harboring families. For the gcd community, Proteobacteria (40%) was the absolutely dominant phylum, followed by Verrucomicrobia (6.3%), Planctomycetes (3.8%), and Bacteroidetes (2.9%). At the order level, Rhizobiales (19.1%), Sphingomonadales (9.6%), Opitutales (6.3%), Rhodospirillales (3.1%), Planctomycetales (3.0%), Sphingobacteriales (2.9%), Enterobacterales (2.7%), and Pseudomonadales (1.5%) were the dominant gcd-harboring orders. The dominant gcd-harboring genera included Rhizobium (8.5%), Escherichia (2.5%), Agrobacterium (1.9%), and Mesorhizobium (1.8%). With the exception of Rhodospirillales, the relative abundances of phoD-harboring Proteobacteria, Caulobacterales (Caulobacteraceae), Gloeobacterales, and Xanthomonadales (Xanthomonadaceae) all significantly linearly decreased with the increase in salinization level (Table S1). In contrast, the abundance of Pseudonocardiales (Pseudonocardiaceae) significantly increased, with a 9.0-fold higher abundance in HD compared to LD (p < 0.05). In the gcd community, the relative abundance of Proteobacteria, Enterobacterales (Enterobacteriaceae), Sphingobacteriales (Sphingobacteriaceae), and Escherichia displayed a significant linear increase along the salinization gradient (p < 0.05), of which the relative abundance of Escherichia in HD was 14.64 times higher than that in LD.
MetagenomeSeq analysis, based on the relative abundance of OTUs, was performed to identify the taxonomic groups with significantly higher relative abundance in HD compared to LD (Figure S2). A total of 344 phoD OTUs were identified, of which 135 were classified into the orders of Streptomycetales, Pseudonocardiales, Planctomycetales, Rhizobiales, Rhodospirillales, Xanthomonadales, and Caulobacterales (Figure S2a). The number of OTUs belonging to Streptomycetales and Planctomycetales was higher than that belonging to other orders. On the other hand, most of the OTUs from Xanthomonadales had significantly lower abundance in HD compared to LD. In the gcd community, the number of OTUs showing a similar response to salinization was significantly lower than that in the phoD community. These OTUs were primarily classified into Rhizobiales, Planctomycetales, Opitutales, Rhodospirillales, or Sphingobacteriales (Figure S2b).
LEfSe analysis revealed 13 phoD-harboring clades with significantly different relative abundance across the samples (Figure S3). The differentially abundant taxa in LD included Proteobacteria, Cyanobacteria, Gammaproteobacteria, Xanthomonadales (Xanthomonadaceae), Gloeobacteria, Gloeobacterales (Gloeobacteraceae), and Acetobacteraceae. In MD, the differentially abundant taxa were Planctomycetaceae and Sphingomonadales (Sphingomonadaceae). In HD, Gemmataceae from Planctomycetes was the only abundant taxon. For the gcd community, Yersiniaceae was the sole differentially abundant taxon in LD, while Proteobacteria and Enterobacterales (Enterobacteriaceae) were identified as differentially abundant taxa in HD (Figure S4).

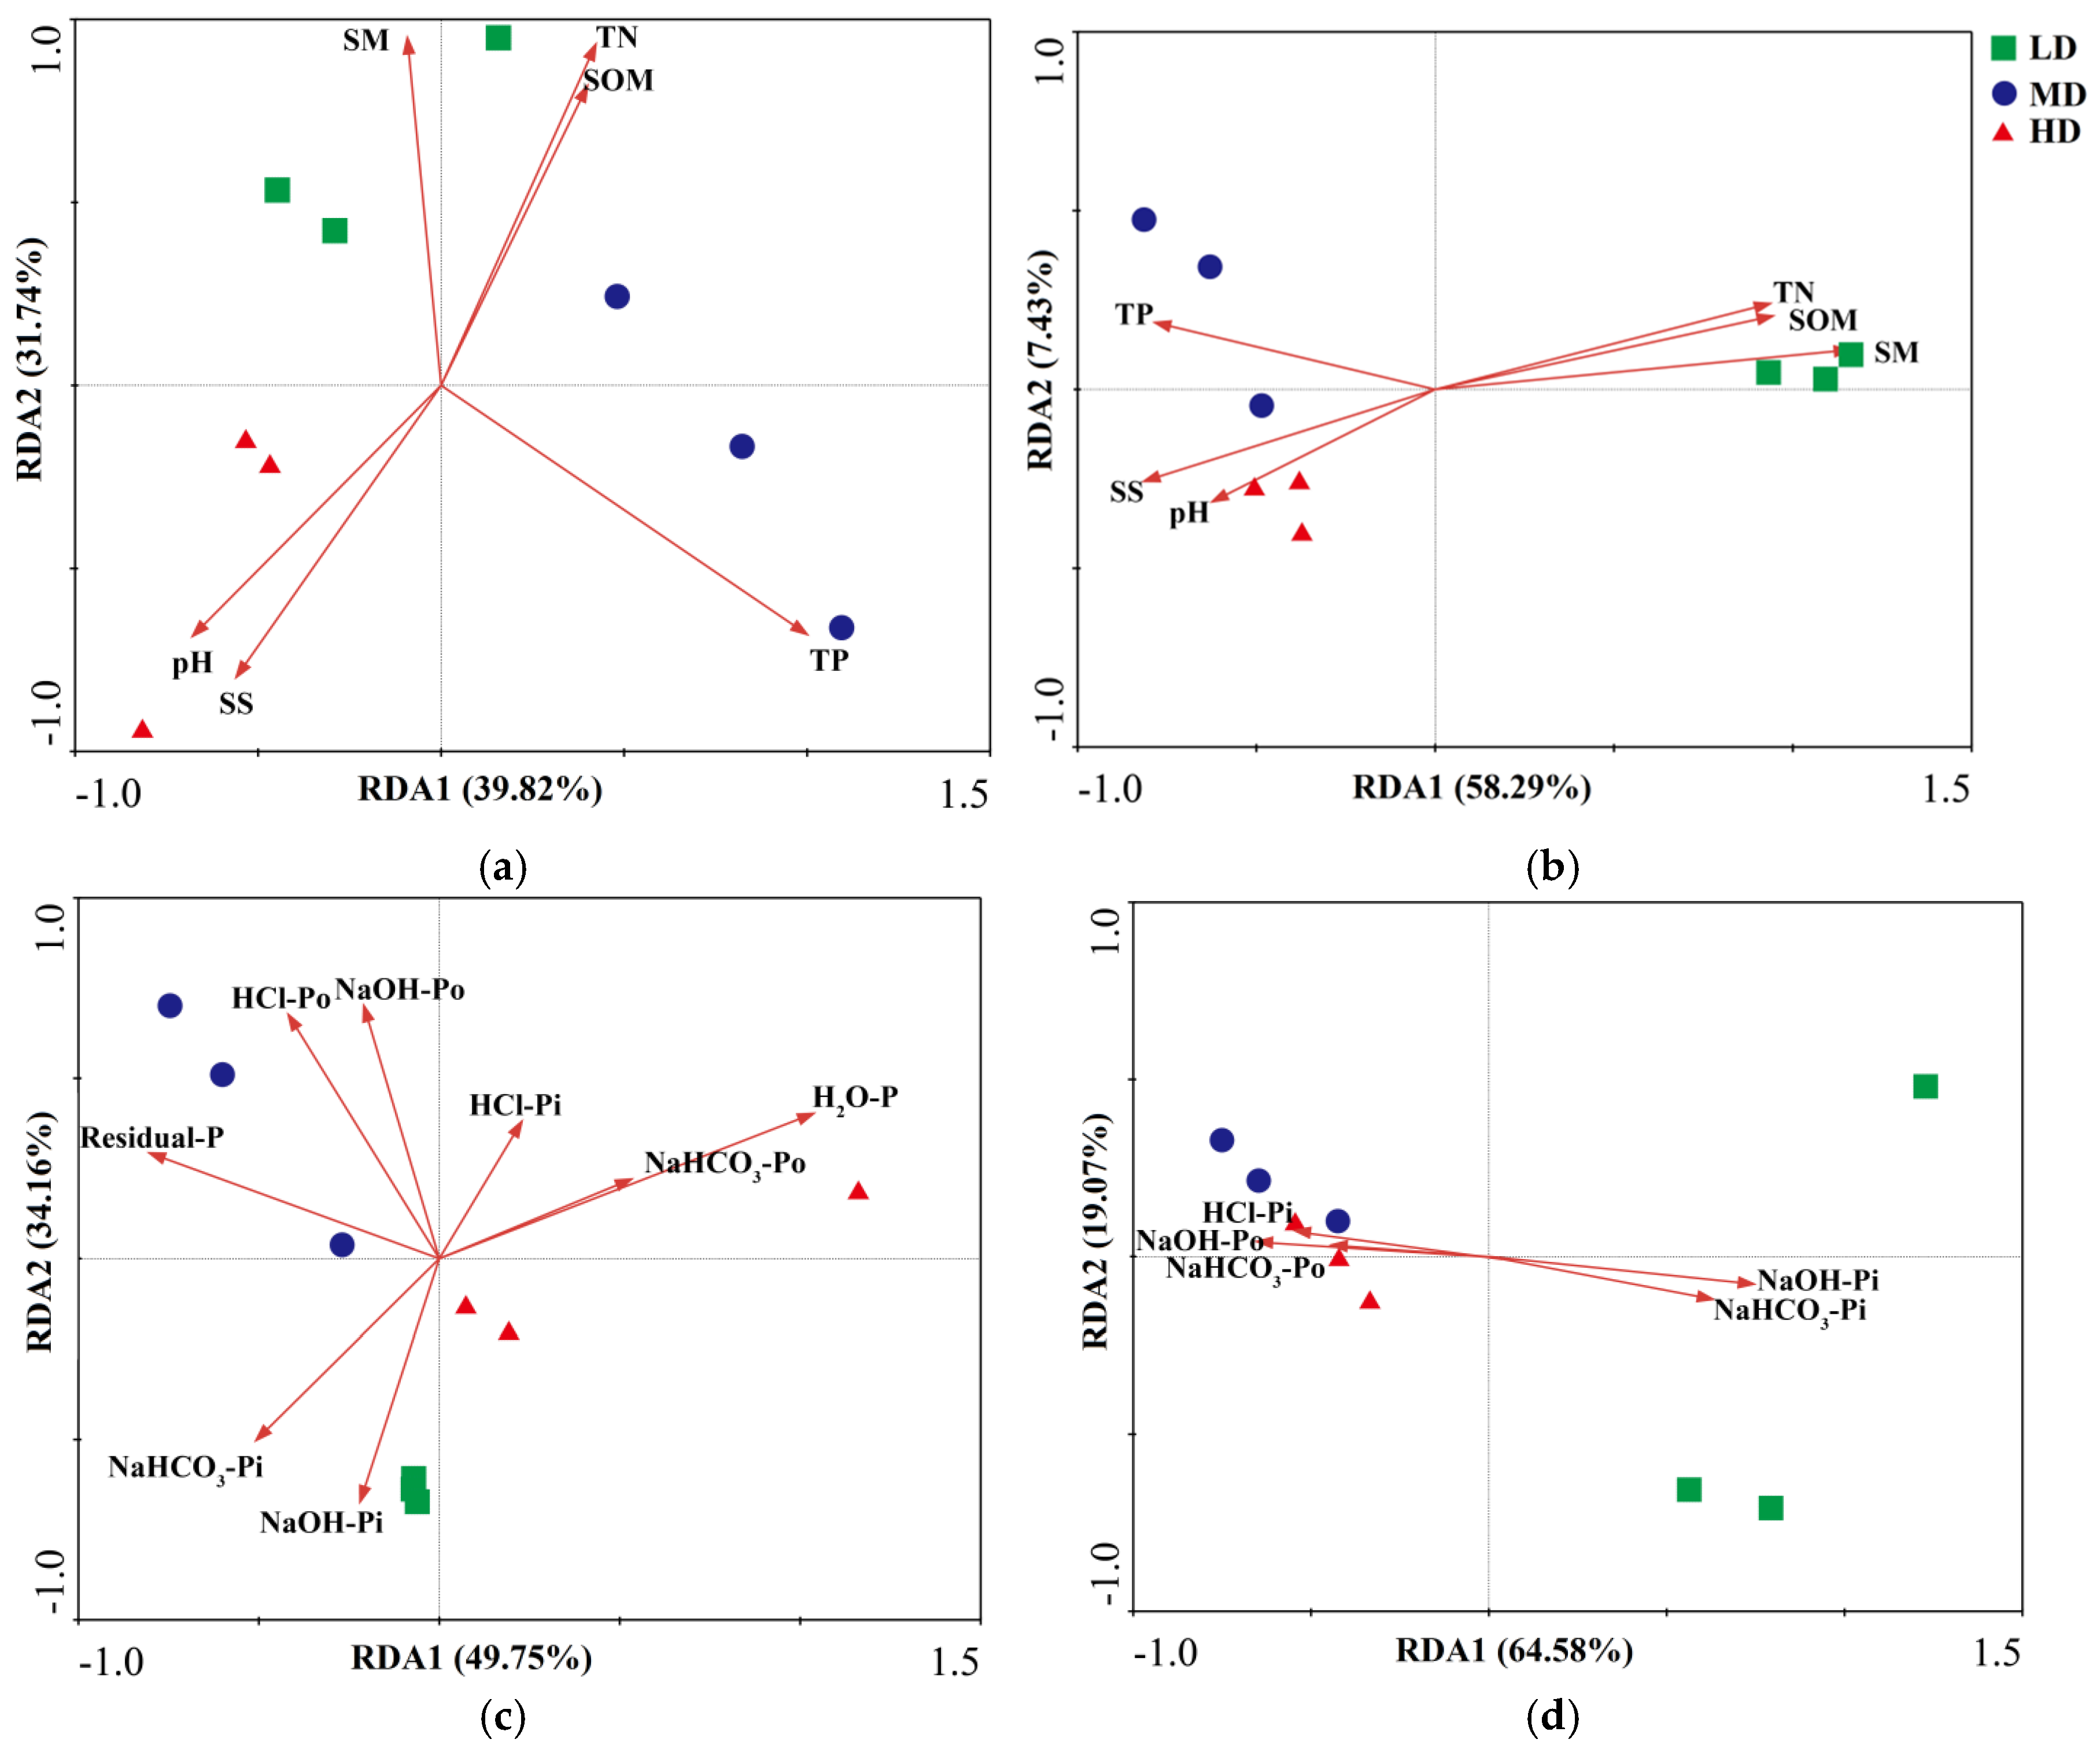
3.5. Dependence of phoD/gcd Community Structure on Soil Properties and P Fractions

Redundancy analysis (RDA) was conducted to investigate the relationship between soil properties/P fractions and the structures of the phoD and gcd microbial communities (Figure 5). The RDA results between the microbial communities and soil properties indicated that soil properties accounted for 39.82% and 31.74% of the variations in the phoD community structures along the first and second axes, respectively, while for the gcd community the corresponding variations were 58.29% and 7.43% (Figure 5a,b). Similarly, when examining the P fractions, the first and second axes explained 49.75% and 34.16% of the variation in the phoD community and 64.58% and 19.07% in the gcd community, respectively (Figure 5c,d). This finding underscores a profound association between the selected soil variables, P fractions, and the structures of the phoD and gcd communities. In addition, the Pearson correlations between soil variables, including enzymatic activities and the relative abundances of some dominant taxa, were determined (Figures S4 and S5). The phoD-harboring taxa, such as Xanthomonadales, Caulobacterales, Rhodospirillales, and Gloeobacterales, along with gcd-harboring taxa including Proteobacteria, Enterobacterales, and Sphingobacteriales, exhibited positive correlations with soil organic matter, soil moisture, total N, NH4-N, NO3-N, DHA, and ALP, Conversely, these taxa were negatively correlated with pH, electrical conductivity, soil salt content, and bulk density (Figures S5 and S6). Notably, Streptomycetales emerged as the sole taxonomic group demonstrating a positive association with available P (H2O-P and NaHCO3-Pi).

4. Discussion

4.1. Responses of P Fractions and the P Solubilization and P Mineralization Potentials to Grassland Salinization

H2O-P is recognized as the most accessible form of P for plants, followed by NaHCO3-Pi. Our results indicated that grassland salinization increased soil H2O-P but decreased NaHCO3-Pi and NaOH-Pi (Table 2). The rise in H2O-P may be attributable to the elevated concentration of Na+ ions in the soil solution, which promoted the formation of more soluble Na3PO4, thereby suppressing the formation of insoluble P [41,42]. NaHCO3-Pi is typically associated with the contents of soil organic matter and microbial biomass [43]. Previous studies have shown that both soil organic matter and microbial biomass declined with increasing soil salinization [32]. Moreover, NaHCO3-Pi and NaOH-Pi were significantly positively correlated with the activities of ALP and DHA, as well as the abundance of the phoD and gcd genes (Figure S1). Thus, the reduction in NaHCO3-Pi and NaOH-Pi along a salinization gradient may be linked with the inhibited propagation of phoD- and gcd-harboring microorganisms. In addition, both NaHCO3-Pi and NaOH-Pi were significantly and positively correlated with soil moisture. The impact of soil moisture on P fractions is directly and indirectly mediated by ALP activity [44]. Consequently, the observed declines in NaHCO3-Pi and NaOH-Pi may have resulted from the reduction in inorganic P’s availability due to decreased rates of P mineralization and solubilization. The salinization simultaneously increased H2O-P and decreased NaHCO3-Pi, resulting in no significant differences in the total available P fraction (H2O-P and NaHCO3-Pi), which ranged from 12.84 mg·kg−1 to 18.43 mg·kg−1 along the salinization gradient. Pan et al. [14] demonstrated a significant positive correlation between soil salinity levels and available phosphorus (P) concentrations in the Hexi Corridor region of Gansu Province, China, with values increasing from 16.73 mg kg⁻¹ in mildly salinized grasslands to 32.79 mg kg⁻¹ in severely salinized ecosystems. This finding was corroborated by Yang et al. [45], who observed a progressive alleviation of microbial phosphorus limitation along a gradient of increasing salinization in the semi-arid grasslands of Jilin Province, China. Their results indicated that salinization maintains or even enhances phosphorus’s availability.
Generally, Po constitutes a greater proportion of P compared to other P fractions in grassland ecosystems [46]. Specifically, NaHCO3-Po, NaOH-Po, and HCl-Po serve as significant sources of biologically available P in grassland soil, as they can be mineralized into available inorganic P [47]. The NaHCO3-Po and NaOH-Po fractions, considered to be relatively labile organic P, were positively correlated with soil organic matter [48,49]. However, in this study, NaHCO3-Po and NaOH-Po increased with the gradient of salinization, and no positive correlation was observed between these fractions and soil organic matter. Soil salinization in semi-arid grasslands reduced the activity of soil ALP and the quantity of phoD-harboring bacteria, thereby decreasing the mineralization rate of the organic P. Additionally, changes in vegetation composition and biomass affect the soil P pool by altering the soil’s properties [8,50,51,52]. Different plant species exhibit varying capacities to mobilize organic P fractions, and soil NaHCO3-Po and NaOH-Po can be differentially utilized by plants, particularly in salinized grassland environments. Consequently, NaHCO3-Po and NaOH-Po may not be fully depleted by plants in salinized grasslands [50,53]. The accumulation of organic P can be attributed to the multifaceted impacts of grassland salinization in arid regions, which influence plant diversity, soil properties, and soil microorganisms involved in P cycling [54]. Our results suggest that available P may be retained in labile and moderately labile organic P forms within the salinized soil of arid grasslands. Therefore, a critical strategy for enhancing P’s availability is to explore practices that can stimulate the metabolic activity of phoD-harboring bacteria [55].

4.2. Responses of phoD- and gcd-Harboring Communities to Grassland Salinization

Previous studies have demonstrated that soil salinization significantly influences the overall bacterial community structure [33,56,57,58]. In this study, the phoD- and gcd-harboring bacterial communities were clustered by site and distinctly separated from one another in the NMDS analysis (Figure 3), a pattern consistent with observations of the whole bacterial community [33]. However, our results showed that the alpha diversity of the phoD community remained almost unchanged and was unaffected by the soil salinization level (Table 3). This aligns with previous findings that soil salinization can increase the alpha diversity of the whole bacterial community [33]. Thus, soil salinization does not necessarily lead to a reduction in the alpha diversity of the microbial community. Nevertheless, the abundance of the phoD and gcd communities declined under salinization and exhibited positive correlations with soil organic matter, total N, and soil moisture in this study, while showing negative correlations with bulk density. These findings suggest that the reduced abundance of phoD- and gcd-harboring communities is likely driven by nutrient limitations and alterations in the soil structure under salinized conditions [42].
Actinobacteria and Proteobacteria are dominant taxa in many soils [59,60], and certain species within these phyla harbor the phoD gene, playing a critical role in the mineralization of Po [31]. These phyla are also relatively abundant in saline soils, particularly Gammaproteobacteria [58,61]. In this study, Streptomycetales and Xanthomonadales were identified as representative taxa within Actinobacteria and Gammaproteobacteria, respectively. Streptomycetales are known to thrive in salt- and drought-stressed soil [62,63], which explains their dominance at the HD site, characterized by the highest soil salt and the lowest moisture. Notably, Streptomycetales was the only group positively correlated with available P. In contrast, the abundance of phoD-harboring Xanthomonadales was significantly lower at the HD site compared to the low-salinization (LD) site, a trend also observed for gcd-harboring Xanthomonadales. Soil salinization resulted in an increase in bulk density, reducing the air void volume and limiting gas exchange. Consequently, salinized soils may become anoxic, creating conditions unfavorable for Xanthomonadales, which typically dominate oxic soil layers, as demonstrated by Kim et al. [64]. Similar to phoD-harboring Streptomycetales, gcd-harboring Escherichia had higher relative abundance in HD compared to LD, exhibiting strong adaptability to arid and saline conditions. This observation was supported by Singh et al. [65], who also found that Escherichia was the dominant genus in drought-affected soils. Thus, Escherichia may play important roles in P mobilization in salinized soil.
Our results demonstrated that the community structures of both phoD and gcd significantly shifted along the salinization gradient. Both community structures were closely correlated with soil organic matter, total N, soil moisture, NaHCO3-Pi, and NaOH-Pi (Figure 5). Hu et al. [6] demonstrated that soil C and N played more important roles than P in influencing the phoD community structure. Soil moisture has been shown to affect the overall bacterial community structure [66] and can determine the composition of P-cycling microbial communities and their roles in regulating soil P cycling in arid deserts [67]. In addition, this study found a significant positive correlation between the abundance of phoD and gcd microbial communities and various soil parameters, including soil organic matter, total nitrogen, soil moisture, NaHCO3-Pi, and NaOH-Pi. These findings indicate that the phoD and gcd communities play a crucial role in Po mineralization and Pi solubilization. Therefore, soil organic matter, total nitrogen, and soil moisture appear to influence the relationship between microbial communities involved in P transformation and the availability of labile P. Yang et al. [45] proposed that the available P was governed by salinization through concomitant modifications in edaphic properties and restructuring of soil bacterial communities. This is supported by Wang et al. [68] and Zhang et al. [69], who found that reductions in both the labile (NaHCO3-Pi) and moderately labile P (NaOH-Pi) fractions were associated with changes in P-cycling microbial community structure. Hence, salinization decreased labile and moderately labile P via alterations in soil properties, restructuring the P-transforming community. However, in this study, the relatively stable available P may have resulted from a combination of abiotic and biotic P acquisition under long-term salinized grassland [45,70]. For example, elevated concentrations of Na+ ions enhance phosphate’s solubility.

5. Conclusions

Secondary soil salinization significantly reduced the soil moisture and nutrients, while increasing the pH, electrical conductivity, and bulk density. The composition of the soil’s P pool underwent significant changes during the process of soil salinization; specifically, NaHCO3-Pi and NaOH-Pi decreased, whereas H2O-P, NaHCO3-Po, and HCl-Pi increased. However, the available P fractions (H2O-P and NaHCO3-Pi) remained largely unchanged. These shifts in P fractions were closely correlated with soil organic matter, total N, soil salt content, bulk density, and the activities of ALP and DHA. Secondary soil salinization decreased the numbers of phoD- and gcd-harboring microbes and induced structural changes in their respective microbial communities. The phoD microbial community was dominated by taxa such as Streptomycetales, Xanthomonadales, Planctomycetales, Rhodospirillales, Caulobacterales, and Pseudonocardiales, while the dominant taxa of the gcd microbial community included Rhizobiales, Sphingomonadales, Opitutales, Rhodospirillales, Planctomycetales, Sphingobacteriales, Enterobacterales, and Pseudomonadales. Structural changes in the phoD and gcd microbial communities were characterized by decreases in the relative abundance of Xanthomonadales and Caulobacterales, and increases in the relative abundance of Pseudonocardiales and Enterobacterales. The P fractions, the abundance of the phoD and gcd genes, and the structures of these communities were significantly correlated with soil organic matter, total N, pH, and soil moisture. Additionally, NaHCO3-Pi and NaOH-Pi significantly affected the structures of the phoD and gcd communities. Collectively, microbial communities related to P transformation were significantly affected by soil salinization, with decreases in their quantities and shifts in their functions linked to changes in P fractions and soil properties.
Our findings establish a scientific basis for elucidating the response mechanisms of soil nutrient cycling to saline–alkaline stress in arid and semi-arid grassland ecosystems, offering critical insights for ecological restoration and precision nutrient management in salt-affected grasslands. The present study has some limitations. The use of only one sampling, in August, limits the assessment of seasonal microbial dynamics. In addition, fungal communities, which may predominate in salinized grasslands, were not investigated. Future studies could explore the seasonal dynamics of bacterial and fungal communities. Another prospect for future study is screening Actinobacteria strains with high phosphate-solubilizing capacity, adapted to saline–alkaline environments, as bioinoculants.

Supplementary Materials

The following supporting information can be downloaded at https://www.mdpi.com/article/10.3390/agronomy15040960/s1, Figure S1: Pearson correlation relationships between P fractions, soil properties, and enzymatic activities; Figure S2: Significantly abundant taxa in HD compared to LD, identified by MetagenomeSeq analysis; Figure S3: Significantly abundant phoD taxa identified by LEfSe analysis. Figure S4: Significantly abundant gcd taxa identified by LEfSe analysis; Figure S5: Pearson correlation between the abundant phoD-harboring groups in relation to soil properties and enzymatic activities; Figure S6: Pearson correlation between the abundant gcd-harboring groups in relation to soil properties and enzymatic activities; Table S1: Significantly abundant taxonomic groups in the soils with a gradient of salinization. Table S2: The pearson correlations between phoD and gcd gene abundance and soil properties and enzymatic activities

Author Contributions

Y.Z.: writing—original draft and methodology; Z.C.: resources and investigation; C.C.: writing—original draft, data curation, reviewing and editing, conceptualization, and project administration. All authors have read and agreed to the published version of the manuscript.

Funding

This research was funded the National Natural Science Foundation of China (41877536; 42277467).

Data Availability Statement

The original contributions presented in this study are included in the article/Supplementary Materials; further inquiries can be directed to the corresponding author.

Acknowledgments

The authors would like to express their gratitude to the Wulanaodu Desertification Combating Ecological Station under the Institute of Applied Ecology, Chinese Academy of Sciences.

Conflicts of Interest

The authors declare no conflicts of interest.

References

  1. Hinsinger, P. Bioavailability of soil inorganic P in the rhizosphere as affected by root induced chemical changes: A review. Plant Soil 2001, 237, 173–195. [Google Scholar] [CrossRef]
  2. Hedley, M.J.; Stewart, J.W.B.; Chauhan, B.S. Changes in inorganic and organic soil phosphorus fractions induced by cultivation practices and by laboratory incubations. Soil Sci. Soc. Am. J. 1982, 46, 970–976. [Google Scholar] [CrossRef]
  3. Waldrip, H.M.; He, Z.; Erich, M.S. Effects of poultry manure amendment on phosphorus uptake by ryegrass, soil phosphorus fractions and phosphatase activity. Biol. Fert. Soils 2011, 47, 407–418. [Google Scholar] [CrossRef]
  4. Ye, D.H.; Li, T.X.; Yu, H.Y.; Chen, G.D.; Zheng, X.Z.; Zhang, Z.C.; Li, J.X. P accumulation of Polygonum hydropiper, soil P fractions and phosphatase activity as affected by swine manure. Appl. Soil Ecol. 2015, 86, 10–18. [Google Scholar] [CrossRef]
  5. Yan, X.; Wei, Z.; Hong, Q.; Lu, Z.; Wu, J. Phosphorus fractions and sorption characteristics in a subtropical paddy soil as influenced by fertilizer sources. Geoderma 2017, 295, 80–85. [Google Scholar] [CrossRef]
  6. Hu, Y.J.; Xia, Y.H.; Sun, Q.; Liu, K.P.; Chen, X.B.; Ge, T.D.; Zhu, B.L.; Zhu, Z.K.; Zhang, Z.H.; Su, Y.R. Effects of long-term fertilization on phoD-harboring bacterial community in karst soils. Sci. Total Environ. 2018, 628–629, 53–63. [Google Scholar] [CrossRef]
  7. Memiaghe, J.D.; Cambouris, A.N.; Ziadi, N.; Karam, A.; Perron, I. Spatial variability of soil phosphorus indices under two contrasting grassland fields in Eastern Canada. Agronomy 2021, 11, 24. [Google Scholar] [CrossRef]
  8. Aleixo, S.; Gama-Rodrigues, A.C.; Gama-Rodrigues, E.F.; Campello, E.F.C.; Silva, E.C.; Schripsema, J. Can soil phosphorus availability in tropical forest systems be increased by nitrogen-fixing leguminous trees? Sci. Total Environ. 2020, 712, 136405. [Google Scholar] [CrossRef] [PubMed]
  9. Luo, G.; Sun, B.; Li, L.; Li, M.; Liu, M.Q.; Zhu, Y.Y.; Guo, S.W.; Ling, N.; Shen, Q. Understanding how long-term organic amendments increase soil phosphatase activities: Insight into phod- and phoc-harboring functional microbial populations. Soil Biol. Biochem. 2019, 139, 107632. [Google Scholar] [CrossRef]
  10. Rawat, P.; Das, S.; Shankhdhar, D.; Shankhdhar, S.C. Phosphate-solubilizing microorganisms: Mechanism and their role in phosphate solubilization and uptake. J. Soil Sci. Plant Nutr. 2021, 21, 49–68. [Google Scholar] [CrossRef]
  11. Khoshgoftarmanesh, A.H.; Nourbakhsh, F. Salinity and plant residue effects on soil available phosphorus. J. Plant Nutr. 2009, 32, 954–966. [Google Scholar] [CrossRef]
  12. Wang, Y.; Zhang, F.S.; Marschner, P. Soil pH is the main factor influencing growth and rhizosphere properties of wheat following different pre-crops. Plant Soil 2012, 360, 271–286. [Google Scholar] [CrossRef]
  13. Zhang, Y.; Cao, C.Y.; Han, X.S.; Jiang, S.Y. Soil nutrient and microbiological property recoveries via native shrub and semi-shrub plantations on moving sand dunes in Northeast China. Ecol. Eng. 2013, 53, 1–5. [Google Scholar] [CrossRef]
  14. Pan, C.C.; Liu, C.G.; Zhao, H.L.; Wang, Y. Changes of soil physico-chemical properties and enzyme activities in relation to grassland salinization. Eur. J. Soil Biol. 2013, 55, 13–19. [Google Scholar] [CrossRef]
  15. Rodriguez, H.; Fraga, R. Phosphate solubilizing bacteria and their role in plant growth promotion. Biotechnol. Adv. 1999, 17, 319–339. [Google Scholar] [CrossRef] [PubMed]
  16. Richardson, A.E.; Simpson, R.J. Soil microorganisms mediating phosphorus availability update on microbial phosphorus. Plant Physiol. 2011, 156, 989–996. [Google Scholar] [CrossRef]
  17. Kaur, G.; Reddy, M.S. Effects of phosphate-solubilizing bacteria, rock phosphate and chemical fertilizers on maize-wheat cropping cycle and economics. Pedosphere 2015, 25, 428–437. [Google Scholar] [CrossRef]
  18. Zeng, Q.W.; Wu, X.Q.; Wen, X.Y. Effects of soluble phosphate on phosphate-solubilizing characteristics and expression of gcd gene in Pseudomonas frederiksbergensis JW-SD2. Curr. Microbiol. 2016, 72, 198–206. [Google Scholar] [CrossRef]
  19. Zaheer, R.; Morton, R.; Proudfoot, M.; Yakunin, A.; Finan, T.M. Genetic and biochemical properties of an alkaline phosphatase PhoX family protein found in many bacteria. Environ. Microbiol. 2009, 11, 1572–1587. [Google Scholar] [CrossRef]
  20. Kageyama, H.; Tripathi, K.; Rai, A.K.; Cha-um, S.; Waditee-Sirisattha, R.; Takabe, T. An alkaline phosphatase/phosphodiesterase, PhoD, induced by salt stress and secreted out of the cells of Aphanothece halophytica, a halotolerant cyanobacterium. Appl. Environ. Microb. 2011, 77, 5178–5183. [Google Scholar] [CrossRef]
  21. Zhang, P.; Xie, X.H.; Li, C.L.; Sun, Y.H.; Zhang, J.J.; Gao, Q.; Wang, L.C. Forms of phosphorus in several zonal soils of China. Spectrosc. Spectr. Anal. 2019, 39, 3210–3216. [Google Scholar]
  22. Acuña, J.J.; Durán, P.; Lagos, L.M.; Ogram, A.; Mora, M.L.; Jorquera, M.A. Bacterial alkaline phosphomonoesterase in the rhizospheres of plants grown in Chilean extreme environments. Biol. Fert. Soils 2016, 52, 763–773. [Google Scholar] [CrossRef]
  23. Tan, H.; Barret, M.; Mooij, M.J.; Rice, O.; Morrissey, J.P.; Dobson, A.; Griffiths, B.; O’Gara, F. Long-term phosphorus fertilisation increased the diversity of the total bacterial community and the phoD phosphorus mineraliser group in pasture soils. Biol. Fert. Soils 2013, 49, 661–672. [Google Scholar] [CrossRef]
  24. Bergkemper, F.; Kublik, S.; Lang, F.; Krüger, J.; Vestergaard, G.; Schloter, M.; Schulz, S. Novel oligonucleotide primers reveal a high diversity of microbes which drive phosphorous turnover in Soil. J. Microbiol. Methods 2016, 125, 91–97. [Google Scholar] [CrossRef] [PubMed]
  25. Mander, C.; Wakelin, S.; Young, S.; Condron, L.; O’Callaghan, M. Incidence and diversity of phosphate-solubilising bacteria are linked to phosphorus status in grassland soils. Soil Biol. Biochem. 2012, 44, 93–101. [Google Scholar] [CrossRef]
  26. Ragot, S.A.; Kertesz, M.A.; Bünemann, E.K. phoD alkaline phosphatase gene diversity in Soil. Appl. Environ. Microb. 2015, 81, 7281–7289. [Google Scholar] [CrossRef]
  27. Chen, X.; Jiang, N.; Chen, Z.; Tian, J.; Sun, N.; Xu, M.; Chen, L.J. Response of soil phoD phosphatase gene to long-term combined applications of chemical fertilizers and organic materials. Appl. Soil Ecol. 2017, 119, 197–204. [Google Scholar] [CrossRef]
  28. Li, Y.; Zhang, J.Q.; Gong, Z.L.; Xu, W.L.; Mou, Z.S. Gcd gene diversity of quinoprotein glucose dehydrogenase in the sediment of Sancha Lake and its response to the environment. J. Environ. Res. Public Health 2019, 16, 1. [Google Scholar] [CrossRef] [PubMed]
  29. Randall, K.; Brennan, F.; Clipson, N.; Creamer, R.; Griffiths, B.; Storey, S.; Doyle, E. Soil bacterial community structure and functional responses across a long-term mineral phosphorus (Pi) fertilisation gradient differ in grazed and cut grasslands. Appl. Soil Ecol. 2019, 138, 134–143. [Google Scholar] [CrossRef]
  30. Zheng, B.X.; Zhang, D.P.; Wang, Y.; Hao, X.L.; Wadaan, M.A.M.; Hozzein, W.N.; Penuelas, J.; Zhu, Y.G.; Yang, X.R. Responses to soil pH gradients of inorganic phosphate solubilizing bacteria community. Sci. Rep. 2019, 9, 25. [Google Scholar] [CrossRef]
  31. Wan, W.J.; Li, X.; Han, S.; Wang, L.; Luo, X.S.; Chen, W.L.; Huang, Q.Y. Soil aggregate fractionation and phosphorus fraction driven by long-term fertilization regimes affect the abundance and composition of P-cycling related bacteria. Soil Tillage Res. 2020, 196, 104475. [Google Scholar] [CrossRef]
  32. Zhang, Y.; Cao, C.; Guo, L.; Wu, Q.; Cui, Z. Soil properties, bacterial community composition, and metabolic diversity responses to soil salinization of a semiarid grassland in northeast Chin. J. Soil Water Conserv. 2015, 70, 110–120. [Google Scholar] [CrossRef]
  33. Cao, C.Y.; Tao, S.; Cui, Z.B.; Zhang, Y. Response of soil properties and microbial communities to increasing salinization in the meadow grassland of Northeast China. Microb. Ecol. 2021, 82, 722–735. [Google Scholar] [CrossRef]
  34. Naheed, G.; Shahbaz, M.; Latif, A.; Rha, E.S. Alleviation of the adverse effects of salt stress on rice (Oryza sativa L.) by phosphorus applied through rooting medium: Growth and gas exchange characteristics. Pak. J. Bot. 2007, 39, 729–737. [Google Scholar]
  35. Wilson, B.J.; Servais, S.; Charles, S.P.; Mazzei, V.; Gaiser, E.E.; Kominoski, J.S.; Richards, J.H.; Troxler, T.G. Phosphorus alleviation of salinity stress: Effects of saltwater intrusion on an Everglades freshwater peat marsh. Ecology 2019, 100, e02672. [Google Scholar] [CrossRef]
  36. Waldrip-Dail, H.; He, Z.; Erich, S.M.; Honeycutt, W.C. Soil phosphorus dynamics in response to poultry manure amendment. Soil Sci. 2009, 174, 195–201. [Google Scholar] [CrossRef]
  37. Institute of Soil Science, Chinese Academy of Sciences (ISSCAS). Methods on Soil Microorganism Study; Science Press: Beijing, China, 1985; pp. 260–275. [Google Scholar]
  38. Sardans, J.; Peñuelas, J. Drought decreases soil enzyme activity in a Mediterranean Quercus ilex L. forest. Soil Biol. Biochem. 2005, 37, 455–461. [Google Scholar] [CrossRef]
  39. Nelson, D.W.; Sommers, L.E. Total carbon, organic carbon and organic matter. In Methods of Soil Analysis, 2nd ed.; Part 2; American Society of Agronomy: Madison, WI, USA, 1982; Volume 9, pp. 539–577. [Google Scholar]
  40. Zheng, H.Y.; Zhang, D.S. Methods on Dynamics of Soil Biochemistry Study; Science Press: Beijing, China, 1982; pp. 167–169. [Google Scholar]
  41. Tunesi, S.; Poggi, V.; Gessa, C. Phosphate adsorption and precipitation in calcareous soils: The role of calcium ions in solution and carbonate minerals. Nutr. Cycl. Agroecosyst. 1999, 53, 219–227. [Google Scholar] [CrossRef]
  42. Qadir, M.; Schubert, S. Degradation processes and nutrient constraints in sodic soils. Land. Degrad. Dev. 2002, 13, 275–294. [Google Scholar] [CrossRef]
  43. Hu, B.; Yang, B.; Pang, X.Y.; Bao, W.K.; Tian, G.L. Responses of soil phosphorus fractions to gap size in a reforested spruce forest. Geoderma 2016, 279, 61–66. [Google Scholar] [CrossRef]
  44. Zeng, Q.; Fan, Y.; Yuan, X.; Zhou, J.; Lin, H.; Xie, H.; Cui, J.; Wu, Y.; Chen, Y. Differential factors determine the response of soil P fractions to N deposition in wet and dry seasons in a subtropical Moso bamboo forest. Plant Soil 2022, 498, 161–179. [Google Scholar] [CrossRef]
  45. Yang, J.J.; Wu, X.F.; Ruan, H.; Song, Y.Q.; Xu, M.; Wang, S.N.; Wang, D.L.; Wu, D.H. How does grassland degradation affect soil enzyme activity and microbial nutrient limitation in saline-alkaline meadow? Land. Degrad. Dev. 2023, 34, 5863–5875. [Google Scholar] [CrossRef]
  46. Perroni, Y.; García-Oliva, F.; Tapia-Torres, Y.; Souza, V. Relationship between soil P fractions and microbial biomass in an oligotrophic grassland-desert scrub system. Ecol. Res. 2014, 29, 463–472. [Google Scholar] [CrossRef]
  47. Cross, A.F.; Schlesinger, W.H. Biological and geochemical controls on phosphorus fractions in semiarid soils. Biogeochemistry 2001, 52, 155–172. [Google Scholar] [CrossRef]
  48. Khan, K.S.; Joergensen, R.G. Relationships between P fractions and the microbial biomass in soils under different land use management. Geoderma 2012, 173–174, 274–281. [Google Scholar] [CrossRef]
  49. Stahr, S.; Graf-Rosenfellner, M.; Klysubun, W.; Mikutta, R.; Prietzel, J.; Lang, F. Phosphorus speciation and C:N:P stoichiometry of functional organic matter fractions in temperate forest soils. Plant Soil 2018, 427, 53–69. [Google Scholar] [CrossRef]
  50. Rose, T.J.; Hardiputra, B.; Rengel, Z. Wheat, canola and grain legume access to soil phosphorus fractions differs in soils with contrasting phosphorus dynamics. Plant Soil 2010, 326, 159–170. [Google Scholar] [CrossRef]
  51. Khan, A.; Jin, X.; Yang, X.Y.; Guo, S.L.; Zhang, S.L. Phosphorus fractions affected by land use changes in soil profile on the loess Soil. J. Soil Sci. Plant Nutr. 2021, 21, 722–732. [Google Scholar] [CrossRef]
  52. Wang, C.Q.; Xue, L.; Jiao, R.Z. Soil phosphorus fractions, phosphatase activity, and the abundance of phoC and phoD genes vary with planting density in subtropical Chinese fir plantations. Soil Tillage Res. 2021, 209, 104946. [Google Scholar] [CrossRef]
  53. Fu, D.G.; Wu, X.N.; Duan, C.Q.; Chadwick, D.R.; Jones, D.L. Response of soil phosphorus fractions and fluxes to different vegetation restoration types in a subtropical mountain ecosystem. Catena 2020, 193, 104663. [Google Scholar] [CrossRef]
  54. Zhu, M.N.; Guo, Y.F.; Cao, X.D.; Yang, Y.B.; Du, Q.; Lou, J.; Wang, W.J.; Wu, Y.; Wang, H.M. Shelterbelt-farmland differences in P fractions interacted with soil alkalization, geoclimatic conditions, and soil fungi in Northeast China Plain. J. Soils Sediments 2023, 23, 3937–3957. [Google Scholar] [CrossRef]
  55. Heng, T.; Hermansen, C.; de Jonge, L.W.; Chen, J.; Yang, L.L.; Zhao, L.; He, X.L. Differential responses of soil nutrients to edaphic properties and microbial attributes following reclamation of abandoned salinized farmland. Agric. Ecosyst. Environ. 2023, 347, 108373. [Google Scholar] [CrossRef]
  56. Kristin, M.R.; Noah, F.; Daniel, V.M.; Johannes, R. Linking bacterial community composition to soil salinity along environmental gradients. ISME J. 2019, 13, 836–846. [Google Scholar]
  57. Zhang, K.P.; Cui, X.Q.; Yue, P.; Li, K.H.; Liu, X.J.; Tripathi, B.M.; Chu, H.Y. Salinity is a key determinant for soil microbial communities in a desert ecosystem. mSystems 2019, 4, e00225-18. [Google Scholar] [CrossRef] [PubMed]
  58. Chen, H.H.; Ma, K.Y.; Huang, Y.; Fu, Q.; Qiu, Y.B.; Yao, Z.Y. Significant response of microbial community to increased salinity across wetland ecosystems. Geoderma 2022, 415, 115778. [Google Scholar] [CrossRef]
  59. Park, H.J.; Chae, N.; Sul, W.J.; Lee, B.Y.; Lee, Y.K.; Kim, D. Temporal changes in soil bacterial diversity and humic substances degradation in subarctic Tundra Soil. Microb. Ecol. 2015, 69, 668–675. [Google Scholar]
  60. Ding, Y.; Ye, Q.; Liu, M.; Shi, Z.; Liang, Y. Reductive release of Fe mineral-associated organic matter accelerated by oxalic acid. Sci. Total Environ. 2020, 763, 142937. [Google Scholar] [CrossRef]
  61. Yang, J.J.; Li, W.J.; Teng, D.X.; Yang, X.D.; Zhang, Y.J.; Li, Y. Metagenomic insights into microbial community structure, function, and salt adaptation in saline soils of arid land, China. Microorganisms 2022, 10, 2183. [Google Scholar] [CrossRef]
  62. Guan, T.W.; Lin, Y.J.; Ou, M.Y.; Chen, K.B. Isolation and diversity of sediment bacteria in the hypersaline aiding lake, China. PLoS ONE 2020, 15, e0236006. [Google Scholar] [CrossRef]
  63. Liu, Q.; Zhao, X.; Liu, Y.; Xie, S.; Xing, Y.; Dao, J.; Wei, B.; Peng, Y.; Duan, W.; Wang, Z. Response of sugarcane rhizosphere bacterial community to drought stress. Front. Microbiol. 2021, 12, 716196. [Google Scholar] [CrossRef]
  64. Kim, Y.; Liesack, W. Differential assemblage of functional units in paddy soil microbiomes. PLoS ONE 2015, 10, e0122221. [Google Scholar] [CrossRef] [PubMed]
  65. Singh, P.; Yadav, V.; Deshmukh, Y.; Das, P.; Singh, R.P.; Bano, N.; Kumar, M.; Shukla, A.K.; Krishna, A.; Khare, P. Decoding the link between bacterial diversity and enzymatic activities of soil from Cymbopogon flexuosus growing dryland. Appl. Soil Ecol. 2021, 168, 10415. [Google Scholar] [CrossRef]
  66. Bainard, L.D.; Hamel, C.; Gan, Y.T. Edaphic properties override the influence of crops on the composition of the soil bacterial community in a semiarid agroecosystem. Appl. Soil Ecol. 2016, 105, 160–168. [Google Scholar] [CrossRef]
  67. Li, W.J.; Wang, J.L.; Jiang, L.M.; Lv, G.H.; Hu, D.; Wu, D.Y.; Yang, X.D. Rhizosphere effect and water constraint jointly determined the roles of microorganism in soil phosphorus cycling in arid desert regions. Catena 2023, 222, 106809. [Google Scholar] [CrossRef]
  68. Wang, L.; Wang, J.; Yuan, J.; Tang, Z.H.; Wang, J.D.; Zhang, Y.C. Long-term organic fertilization strengthens the soil phosphorus cycle and phosphorus availability by regulating the pqqC- and phoD-harboring bacterial communities. Microb. Ecol. 2023, 86, 2716–2732. [Google Scholar] [CrossRef]
  69. Zhang, L.C.; Ren, G.; Chu, G.X. Land reclamation increased labile and moderately labile P fractions and strengthened co-occurrence network of gcd community in calcareous soils. Land. Degrad. Dev. 2023, 34, 5542–5555. [Google Scholar] [CrossRef]
  70. Fan, T.N.; Luo, M.; Tan, J.; Hu, D.H.; Chen, X.; Huang, J.F.; Li, S.H.; Guo, P.P.; Chen, J. Incorporating biotic phosphorus-acquisition strategies into soil phosphorus transformation under long-term salinization in a tidal wetland. Catena 2023, 231, 107274. [Google Scholar] [CrossRef]
Figure 1. Potentials of P transformation: (a) organic P mineralization (estimated by the loss rates of lecithin quantitatively added in a microbial medium); (b) phosphate mineral dissolution (estimated by the loss rates of phosphorite quantitatively added in a microbial medium). Means of the loss rates of lecithin and phosphorite followed by different letter (n = 3) are significantly different (p < 0.05). LD: lightly degraded grassland, average salt content = 0.11%; MD: moderately degraded grassland, average salt content = 0.44%; HD: heavily degraded grassland, average salt content = 1.07%.
Agronomy 15 00960 g001
Figure 2. The abundance of the phoD and gcd genes in soil from the LD, MD, and HD sites (n = 3): (a) the phoD gene; (b) the gcd gene. LD: lightly degraded grassland, average salt content = 0.11%; MD: moderately degraded grassland, average salt content = 0.44%; HD: heavily degraded grassland, average salt content = 1.07%.
Agronomy 15 00960 g002
Figure 3. Non-metric multidimensional scaling (NMDS) analysis of the phoD and gcd community structures using the method of Jaccard distance: (a) the phoD gene; (b) the gcd gene. LD: lightly degraded grassland, average salt content = 0.11%; MD: moderately degraded grassland, average salt content = 0.44%; HD: heavily degraded grassland, average salt content = 1.07%.
Agronomy 15 00960 g003
Figure 4. Relative abundance of taxonomic groups of the phoD and gcd communities at the phylum, order, family (phoD), and genus (gcd) levels (n = 3). LD: lightly degraded grassland, average salt content = 0.11%; MD: moderately degraded grassland, average salt content = 0.44%; HD: heavily degraded grassland, average salt content = 1.07%.
Agronomy 15 00960 g004
Figure 5. Redundancy analysis (RDA) of the community structures of the phoD and gcd genes, along with the soil properties and P fractions: (a) phoD community and soil properties; (b) gcd community and soil properties; (c) phoD community and P fractions; (d) gcd community and P fractions. SOM: soil organic matter; TN: total N; TP: total P; SM: soil moisture; SS: soil salt contents. LD: lightly degraded grassland, average salt content = 0.11%; MD: moderately degraded grassland, average salt content = 0.44%; HD: heavily degraded grassland, average salt content = 1.07%.
Agronomy 15 00960 g005
Table 1. Soil physicochemical properties and enzymatic activities in the soils with a gradient of salinization.
IndexLDMDHDANOVA in Response to Salt Content
Regression EquationR2Fp
SOM (%)4.50 ± 0.6263.17 ± 0.5272.16 ± 0.380y = −2.2362x + 4.48210.729218.8470.003
TN (%)0.18 ± 0.0160.15 ± 0.0080.11 ± 0.001y = −0.0665x + 0.18240.820932.090.001
TP (%)0.042 ± 0.0130.027 ± 0.0040.060 ± 00.04ns---
TK (%)2.15 ± 0.0412.30 ± 0.0622.41 ± 0.038y = 0.2589x + 2.14430.867545.826<0.001
NH4-N (mg·kg−1)2.51 ± 0.312.48 ± 0.191.51 ± 0.26y = −1.053x + 2.73160.686515.3280.00
NO3-N (mg·kg−1)1.49 ± 0.680.39 ± 0.060.17 ± 0.04y = −1.2345x + 1.34570.55858.8540.021
AK (mg·kg−1)88.2 ± 0.28194 ± 13.5137 ± 31.6ns---
pH7.82 ± 0.0017.93 ± 0.058.38 ± 0.16y = 0.601x + 7.72060.881652.144<0.001
EC (µs·cm−1)186 ± 17.2270 ± 8.02400 ± 631y = 2407.4x − 345.120.815330.9020.001
SM (%)0.30 ± 0.020.07 ± 0.010.03 ± 0.001y = −0.2448x + 0.26360.676314.6260.007
BD (g·cm−3)1.54 ± 0.061.63 ± 0.041.76 ± 0.06y = 0.2196x + 1.52620.82132.1940.001
ALP (mg g−1 h−1)0.797 ± 0.2670.443 ± 0.7970.388 ± 0.352y = 1.598x + 0.3320.71917.9480.004
DHA (mg TPF·kg−1soil·24 h−1)12.94 ± 0.7711.84 ± 0.708.53 ± 1.00y = −4.599x + 13.5820.85022.753<0.001
ns: not significant. Values are means ± SD (n = 3). LD: lightly degraded grassland, average salt content = 0.11%; MD: moderately degraded grassland, average salt content = 0.44%; HD: heavily degraded grassland, average salt content = 1.07%. SOM: soil organic matter; TN: total N; TP: total P; TK: total K; AK: available K; EC: electrical conductivity; SM: soil moisture; BD: bulk density; ALP: alkaline phosphomonoesterase; DHA: dehydrogenase.
Table 2. Soil phosphorus (P) fractions (mg kg−1) in the soils with a gradient of salinization.
IndexLDMDHDANOVA in Response to Salt Content
R2Fp
H2O-P0.74 ± 0.081.77 ± 0.2411.55 ± 9.190.4956.8540.035
NaHCO3-Pi 12.10 ± 0.718.89 ± 1.096.88 ± 0.400.83836.2070.001
NaHCO3-Po 53.90 ± 9.7067.11 ± 18.3383.12 ± 21.670.4746.3170.040
NaOH-Pi 23.01 ± 1.829.48 ± 0.436.83 ± 0.770.69315.8110.005
NaOH-Po42.99 ± 26.3396.52 ± 3.1277.17 ± 6.770.4051.3720.080
HCl-Pi11.08 ± 0.8820.32 ± 0.5128.87 ± 5.480.83535.3770.001
HCl-Po88.93 ± 19.20135.68 ± 0.4175.13 ± 30.400.0710.5380.087
Residual-P261.33 ± 29.84291.00 ± 42.14245.67 ± 37.230.0780.5960.465
H2O-P + NaHCO3-Pi12.84 ± 0.7610.66 ± 1.0218.43 ± 8.810.2272.0530.555
LD: lightly degraded grassland, average salt content = 0.11%; MD: moderately degraded grassland, average salt content = 0.44%; HD: heavily degraded grassland, average salt content = 1.07%. All values shown are the mean ± SD (n = 3).
Table 3. Alpha diversity indices of the phoD and gcd communities across a gradient of soil salinization.
GenesSitesChao1Observed SpeciesShannon–WienerSimpson
phoDLD1635.3 ± 96.61246.1 ± 46.87.33 ± 0.110.98 ± 0.001
MD1823.5 ± 175.11404.2 ± 119.37.50 ± 0.610.96 ± 0.030
HD1331.0 ± 772.91119.83 ± 644.07.20 ± 2.020.96 ± 0.050
gcdLD1497.2 ± 86.31267.7 ± 136.28.39 ± 0.160.99 ± 0.001
MD1287.8 ± 393.51042.2 ± 342.07.67 ± 0.340.99 ± 0.001
HD1082.4 ± 165.0785.5 ± 114.86.82 ± 0.420.98 ± 0.001
LD: lightly degraded grassland, average salt content = 0.11%; MD: moderately degraded grassland, average salt content = 0.44%; HD: heavily degraded grassland, average salt content = 1.07%. Values are means ± SD (n = 3).
Disclaimer/Publisher’s Note: The statements, opinions and data contained in all publications are solely those of the individual author(s) and contributor(s) and not of MDPI and/or the editor(s). MDPI and/or the editor(s) disclaim responsibility for any injury to people or property resulting from any ideas, methods, instructions or products referred to in the content.

