Abstract
Anthocyanins are key metabolites that determine red pigmentation in pear skin (Pyrus spp.) and their biosynthesis is controlled by multiple transcription factors. Although phytochrome-interacting factors (PIFs) of the bHLH family have been shown to regulate anthocyanin biosynthesis in Arabidopsis thaliana, their genome-wide identification and regulatory mechanisms in pear (Pyrus spp.) anthocyanin synthesis remain unclear. Here, we characterized PIFs family in pear, identifying eight PbPIF proteins. Promoter cis-elements and expression patterns analysis suggested that PbPIF3a and PbPIF4 might be involved in anthocyanin biosynthesis. Subcellular localization confirmed nuclear enrichment of PbPIF3a and PbPIF4. Functional studies demonstrated that overexpression of PbPIF3a and PbPIF4 significantly suppressed anthocyanin accumulation in fruit skins, downregulating key biosynthetic genes such as PbDFR and PbUFGT. In contrast, the silencing of related genes led to an enhancement of anthocyanin accumulation. Dual-luciferase reporter assays and yeast one-hybrid assays confirmed that PbPIF3a directly bound to the promoters of PbDFR and PbUFGT and repressed their transcriptional activation, while PbPIF4 specifically inhibited the activity of the PbDFR promoter. Taken together, we demonstrated that PbPIF3a and PbPIF4 negatively regulated pear fruit coloration by directly repressing the transcriptional activity of key anthocyanin biosynthesis genes, providing novel insights into PIF-mediated regulation of anthocyanin biosynthesis.
1. Introduction
Pear (Pyrus spp.) is a globally cultivated and economically vital fruit crop. According to FAO, pears occupy 20% of the world’s total fruit cultivation area, ranking second only to apples. Red-skinned pear cultivars are commercially valuable due to their visually appealing anthocyanin-rich pigmentation [1]. Anthocyanins have a strong antioxidant capacity and demonstrate protective effects against cancer, cardiovascular diseases, and other chronic disorders [2,3].
Anthocyanin biosynthesis is regulated not only by light but also by transcription factors that include MYB, bHLH, WD40, bIZP, and other transcription factor families. Phytochrome-interacting factors (PIFs) are a subfamily of the basic helix-loop-helix (bHLH) transcription factor superfamily. PIFs are first identified in Arabidopsis thaliana. In Arabidopsis thaliana, there are eight PIF members identified, all harboring conserved Active Phytochrome B-binding (APB) and bHLH domain critical for light signaling and developmental regulation [4]. Subsequently, PIF members have been identified in Oryza sativa [5], Zea mays [6], Solanum tuberosum [7], Solanum lycopersicum [8], Malus domestica [9], and other plants. Recent studies highlight the pivotal role of bHLH transcription factors, including PIFs, in modulating anthocyanin biosynthesis across plant species [10,11]. In Arabidopsis thaliana, PIF3 and HY5 cooperatively activate anthocyanin biosynthetic genes through direct promoter binding under light conditions [12]. Conversely, PIF4 and PIF5 exhibit antagonistic roles, suppressing anthocyanin accumulation under red light [13]. Notably, PIF5 mediates nitrogen-deficiency-induced anthocyanin hyperaccumulation, while PIF3 modulates NaCl-stress responses by enhancing anthocyanin synthesis [14].
It has been shown that bHLH also regulates anthocyanin biosynthesis by synergizing with other transcription factors to form complexes. PIF4 negatively regulates anthocyanin biosynthesis by physically interacting with the Production of Anthocyanin Pigment 1 (PAP1) under 6-BA, MeJA, and abiotic stress treatments [14]. In Cerasus humilis, co-expression of ChEGL1 (bHLH) and ChMYB1 significantly promotes anthocyanin accumulation in transgenic tomato plants by synergistically activating the anthocyanin biosynthetic pathway [15]. Similarly, in Medicago truncatula, MtTT8 and MtWD40-1 interact with MYB partners (MtPAR and MtLAP1) to transactivate the ANS promoter, driving anthocyanin accumulation [16]. In strawberry (Fragaria × ananassa), FaEGL3 and FaLWD1/FaLWD1-like interact with R2R3-FaMYB5 to form the MBW complex, which greatly enhances anthocyanin accumulation [17]. FabHLH3 binds to FaMYB10 and activates DFR and UFGT expression [18]. In apple (Malus domestica), MdbHLH3 and MdbHLH33 binds to MdMYB10 and directly activates anthocyanin biosynthesis genes [19]. PybHLH3 and PyWRKY26 co-target the PyMYB114 promoter to promote the expression of anthocyanin biosynthesis genes through the formation of the MBW complex in ‘Red Xiangsu’ pear (Pyrus pyrifolia) [20]. bHLH64 is a positive regulator of anthocyanin biosynthesis in pear by binding to the MYB10, WD40 proteins to form a complex that regulates the expression of biosynthetic genes for anthocyanin biosynthesis [21]. Intriguingly, CmbHLH16 is a red/far-red light-responsive PIF homolog, which competitively binds to CmMYB4 to liberate CmbHLH2, thereby activating chrysanthemum-flower anthocyanin pathway genes [22].
Currently, there are relatively few reports in Rosaceae on the regulation of anthocyanoside biosynthesis by PIFs in the bHLH family. Under low-light conditions, MdPIF7 interacts with MdBBX23 and represses the transcriptional activation of MdBBX23 on MdHY5, thereby negatively regulating anthocyanidin biosynthesis in apple material [23]. Contrastingly, MdPIF1 functions as a positive regulator, directly binding G-box cis-elements in promoters of anthocyanin biosynthetic genes (MdPAL and MdF3H) to enhance pigment production [24]. In ‘Yunhongyihao’ pear (Pyrus pyrifolia), PyPIF5 exemplifies negative regulation through the miR156a-SPL9-MYB10/MYB114 cascade: PyPIF5 represses miR156a transcription via G-box binding, enabling SPL9 accumulation to inhibit MYB10/MYB114-driven anthocyanin synthesis [25]. Conversely, PpPIF8 exhibits antagonistic functionality, directly activating anthocyanin pathway genes to promote pigmentation in ‘Red Zaosu’ pear (Pyrus pyrifolia × Pyrus communis) [26]. The functions of most PIF members in pear have not been explored, and it remains unknown whether any other PIFs are involved in anthocyanin regulation.
Here, we integrated bioinformatics with molecular biology approaches to identify PbPIF family members in the pear genome and conducted a comprehensive analysis of their phylogenetic relationships, protein structural characteristics, and cis-elements. Based on the analysis of promoter cis-elements and expression patterns, we hypothesized that PbPIF3a/PbPIF4 might be involved in anthocyanoside anabolism. To elucidate their functional roles in this biological process, we employed transient expression systems, yeast one-hybrid assays, and dual-luciferase reporter assays to investigate the regulatory mechanisms of PbPIF3a/PbPIF4 in pear anthocyanin biosynthesis. Our findings not only elucidate the functional roles of PbPIF3a/PbPIF4 in pigmentation regulation but also establish a foundation for further exploration of PIF-mediated anthocyanin biosynthesis in pear.
2. Materials and Methods
2.1. The Plant Materials
The fruits of ‘Red Zaosu’ (Pyrus pyrifolia × Pyrus communis) were sourced from the Modern Agricultural Base of Sichuan Agricultural University. We bagged the small ‘Red Zaosu’ fruits with double-layer paper bags 30 days after full bloom and removed them before injection [25]. The seeds of Nicotiana benthamiana and the plasmids used in the experiments were both sourced from the laboratory’s storage. Seed germination conditions of Nicotiana benthamiana: 23 °C, 6000 lux, with a relative humidity (RH) of approximately 75%. Plant growth environment: 14 h light (approximately 8000 lux)/10 h dark cycle at 23 °C, with RH maintained between 60% and 70%.
2.2. Identification of PbPIFs, Conservation Domain Check, Physicochemical Property Prediction
Genomic resources, including the Pyrus bretschneideri ‘DangshanSuli’ V1.1 genome assembly, annotation files, and protein sequences, were retrieved from the Rosaceae Genome Database (GDR; https://www.rosaceae.org/, accessed on 20 December 2024). AtPIFs sequences were downloaded from the Arabidopsis thaliana database TAIR (https://www.arabidopsis.org/, accessed on 20 December 2024) to be used as query sequences. The BLAST function in TBtools (version 2.154) software was used to align against the pear genome database, screening out 8 candidate protein sequences. Subsequently, the NCBI-CDD (https://www.ncbi.nlm.nih.gov/, accessed on 22 December 2024), Pfam (http://pfam-legacy.xfam.org/, accessed on 22 December 2024), and SMART (https://smart.embl.de/, accessed on 22 December 2024) databases were used to check if these candidate proteins contained conserved domains. The online tool ProtParam (https://web.expasy.org/protparam/, accessed on 22 December 2024) was used to analyze the molecular weight, theoretical isoelectric point, and protein hydrophobicity of these PbPIF proteins [27].
2.3. Chromosome Location, Phylogenetic, Motif, Gene Structure, Promoter Cis-Element Analysis
Based on the pear genome annotation file, the PbPIF genes were subjected to chromosome localization and gene structure visualization using TBtools (version 2.154) software. A phylogenetic tree was constructed using MEGA (version 10.0.5) software with the neighbor-joining method. Bootstrap analysis was set to 500 replicates, and other parameters remained default. The analysis was based on the PIF protein sequences from Arabidopsis, apple, and pear. Sequence alignment was performed using DANMAN (version 7) software. MEME program was used for the analysis of conserved motifs, with the maximum number of motifs set to ten, and TBtools (version 2.154) software was used for visualization. The 2000 bp fragment upstream of the PbPIF genes’ start codon was considered the promoter region, and all PbPIFs promoter regions were extracted. The PlantCARE online tool (https://bioinformatics.psb.ugent.be/webtools/plantcare/html/, accessed on 22 December 2024) was used to analyze the promoter cis-elements, and finally, visualization was performed using TBtools (version 2.154) software [9,28,29,30].
2.4. RNA Extraction and Quantitative Real-Time Fluorescent PCR (qRT-PCR)
Total RNA was extracted following the modified CTAB method [17], followed by cDNA synthesis with TransScript® Reverse Transcriptase (TransGen Biotech, Beijing, China). The extracted RNA was treated with DNase, and all consumables used during the RNA extraction and reverse transcription into cDNA samples were sterile and enzyme-free to avoid contamination. All RNA samples demonstrated acceptable purity with an OD260/280 ratio between 1.8 and 2.1, and only those meeting this criterion were processed for downstream experiments. qRT-PCR was performed following the instructions of the qRT-PCR enzyme (Yeasen Biotechnology, Shanghai, China), with all reactions having three replicates. Additionally, validated qPCR primer sets exhibited amplification efficiencies of 90–100%. Melting curve analyses confirmed amplification specificity through the observation of single distinct peaks for all targets, with no primer-dimer formation or non-specific products detected. PbActin was used as the reference gene, and the 2−ΔΔCt method was used to calculate the relative gene expression levels. All primer sequences were listed in the Table S1.
2.5. Subcellular Localization
The coding sequences of PbPIF3a and PbPIF4 were cloned into the 35S::GFP vector, fusing with green fluorescent protein (GFP). The recombinant expression vector 35S::PbPIFs-GFP was transformed into GV3101 Agrobacterium tumefacines. Then, the Agrobacterium containing 35S::PbPIFs-GFP was infiltrated into the leaves of Nicotiana benthamiana and placed in a dark environment for 16 h, followed by light cultivation for one day. High-resolution confocal microscopy (FV3000, Olympus (Beijing) Sales and Service Co., Ltd., Beijing, China) was used for observation and photography [31].
2.6. Transient Injection of Pear Fruits
The coding sequences of PbPIF3a and PbPIF4 were cloned into the pCambia1301 overexpression vector and then transformed into GV3101 Agrobacterium. The Agrobacterium containing the recombinant expression vector was infiltrated into the skins of ‘Red Zaosu’ pear fruits, placed in a dark environment for 16 h, and then placed in a light incubator (16 h of light/8 h of darkness, 25 °C). Three biological replicates were conducted for each sample. Samples were collected after seven days of cultivation, and all skins were immediately immersed in liquid nitrogen for storage at −80 °C for subsequent experiments [25].
2.7. Yeast One-Hybrid Assays
The CDs of PbPIFs were inserted into the pGADT7 vector, while the promoter fragments of PbDFR, PbUFGT, PbCHS, PbF3H, PbANS, and PbLAR were introduced into the pHIS2 vector. The primers used for fragment amplification are listed in Table S1. The correct recombinant pHIS vector and pGADT7 empty vector were co-expressed into the yeast strain Y187 (Angyu Biotechnology, Shanghai, China), and then the yeast strains were cultured on SD/-Trp-Leu screening medium with different 3-AT concentrations to determine the optimal concentration for the bait reporter strain. Then, the interaction between PbPIFs and promoter fragments was detected on SD/-His/-Leu/-Trp at the optimal 3-AT concentration. The pGADT7 empty vector and pHIS2-anthocyanin structural gene promoter combinations were the negative control, while the AD-PbPIF3a/pHIS2 or AD-PbPIF4/pHIS2 combinations served as the experimental groups. The yeast was cultured at 30 °C for 2–3 days, and the growth status of each recombinant yeast was observed on plates of optimal 3-AT concentration without activation to determine whether there was an interaction [23,25].
2.8. Dual-Luciferase Reporter Assays and Luminescence Detection
The coding sequences of PbPIF3a and PbPIF4 were cloned into the pCambia1301 overexpression vector, while the promoter sequences of PbUFGT and PbDFR (approximately 1500 bp and 1700 bp in length, respectively) were cloned into the pGreenII 0800-LUC vector. Recombinant plasmids were electroporated into Agrobacterium tumefaciens GV3101 (pSoup-p19) and infiltrated into Nicotiana benthamiana leaves using needleless syringes. After being kept in darkness for 16 h, the leaves were cultured at room temperature (25 °C) under light for 48 h for activity detection and luminescence detection. The activity detection was performed on an enzyme Standard instrument (Varioskan LUX), BIO-BRI LIMITED, Hong Kong, China) according to the instructions of the Dual-Luciferase Reporter Detection Kit (Yeasen Biotechnology, Shanghai, China). The LUC/REN ratios were normalized, with three biological replicates and three technical replicates performed. After applying 1 mmol/L D-luciferin potassium salt to the Nicotiana benthamiana leaves, they were placed in darkness for 7 min and then placed on a multicolor fluorescence imager (GelView6000PLUS, BLT Photon Technology, Guangzhou, China) for luminescence detection [32].
2.9. Determination of Anthocyanin Content
The anthocyanin content determination method was derived from Ahmed Alabd et al. [33]. The pear skins were ground into powder in liquid nitrogen, and 0.1 g was weighed and added to 1 mL of extraction solution (hydrochloric acid:methanol = 1:99, v/v), extracted in the dark at 4 °C for 24 h. The absorbance at 530 nm, 620 nm, and 650 nm was measured using an enzyme Standard instrument (Varioskan LUX). Anthocyanin content (μg·g−1) = ((OD530 − OD620) − 0.1 × (OD650 − OD620) × V × M × 1000)/(molar extinction coefficient × m). The anthocyanin molar extinction coefficient = 4.62 × 10⁴, M is the relative molecular mass of anthocyanin, and m is the sample amount, V is the volume of the extract, which is 800 μL.
2.10. Statistical Analyses
Statistical analysis was determined by one-way analysis of variance (ANOVA) with Tukey’s test and Student’s t-test.
2.11. Accession Numbers
Sequence data can be found using the accession number below: AtPIF1 (AT2G20180), AtPIF2 (AT2G46970), AtPIF3 (AT1G09530), AtPIF4 (AT2G43010), AtPIF5 (AT3G59060), AtPIF6 (AT3G62090), AtPIF7 (AT5G61270), AtPIF8 (AT4G00050), MdPIF1 (MDP0000289642), MdPIF2 (MDP0000205358), MdPIF3 (MDP0000290263), MdPIF4 (MDP0000198404), MdPIF5 (MDP0000254650), MdPIF7 (MDP0000319248), MdPIF8 (MDP0000439540).
3. Results
3.1. Identification of PbPIFs
Genome-wide analysis identified eight PIF transcription factors, and all PIF members were named based on homology to Arabidopsis. Physical and chemical properties analysis revealed considerable divergence among PbPIF proteins (Table 1). PbPIF proteins length ranged from 397 to 716 amino acids and predicted molecular weights spanned from 43.9 kDa to 76.6 kDa. The theoretical isoelectric point was distributed within the interval of 6.09–9.39, suggesting the potential functional diversity of PIF proteins across subcellular compartments. All PbPIFs exhibited instability indexes greater than 53, demonstrating that the PbPIF proteins were unstable in plants. Furthermore, the total average hydrophilicity of the PbPIF proteins was negative, indicating that they are all hydrophilic proteins, with PbPIF1 being the most hydrophilic.

Table 1.
Characterization of PbPIFs in pear.
3.2. Chromosomal Location and Phylogenetic Analysis of PbPIFs
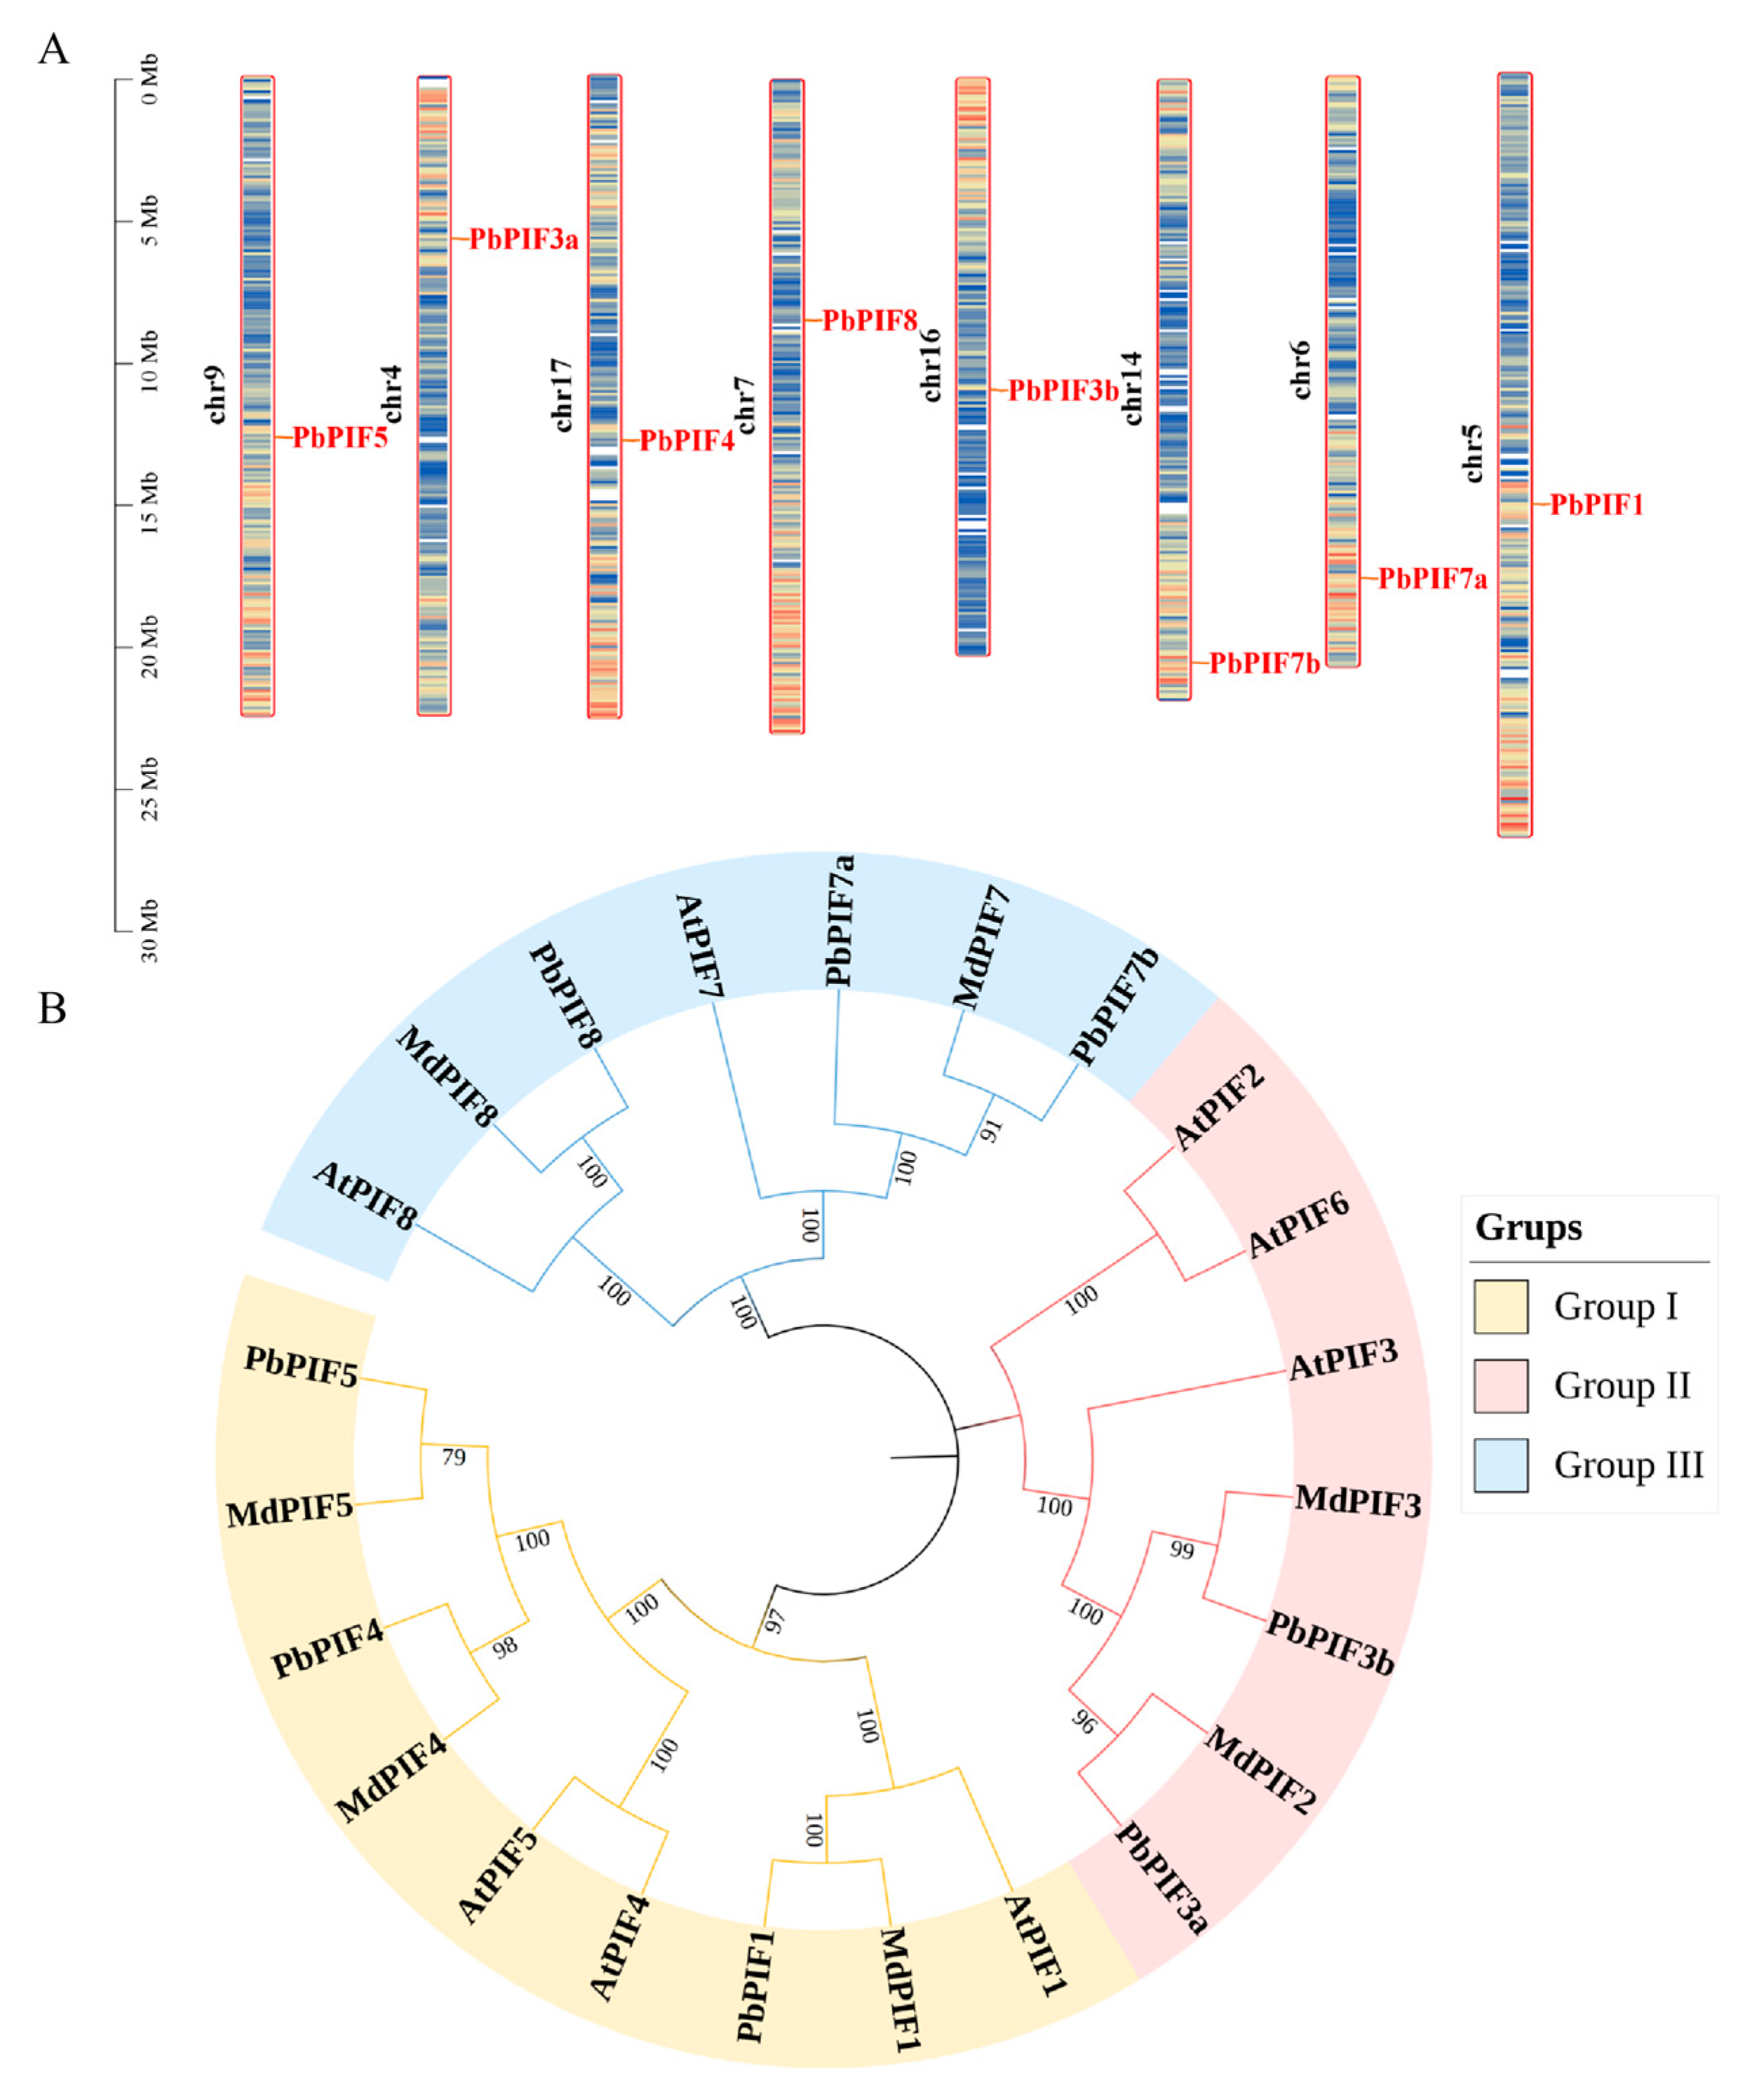
Chromosomal locations indicated that all PIFs were uniformly distributed across eight chromosomes, with each PIF gene being present on a single chromosome (Figure 1A). To investigate the evolutionary relationships of PIF proteins, we created a phylogenetic tree of PIFs protein sequences from three species (eight from Arabidopsis, seven from Malus domestica, and eight from Pyrus bretschneideri) by the neighbor-joining method (Figure 1B). Based on the evolutionary distance, the PIF proteins were classified into three groups: PbPIF1, PbPIF4, and PbPIF5 in the first group; PbPIF3 in the second group; and PbPIF7 with PbPIF8 in the third group. Within each group, all PbPIFs were clustered with their corresponding homologues in Arabidopsis and apple. Within each branch, PbPIFs aggregated with MdPIFs to a greater extent than AtPIFs, indicating that PbPIFs is more closely related to apple PIFs. Additionally, PIF2 was conserved in Arabidopsis and apple genomes, while PIF6 was present in Arabidopsis but absent from both pear and apple genomes.
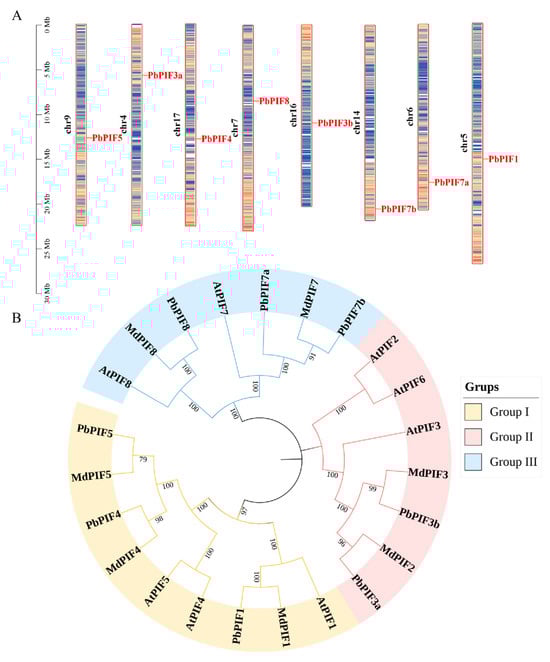
Figure 1.
Chromosomal location and phylogenetic analysis of PbPIFs. (A) Chromosomal location of PbPIF genes. Bar charts represent chromosomes, where chromosome numbers are labeled on the left in black font, and gene names are displayed on the right in red font. The relative chromosomal positions of each PIF gene are indicated by red lines. (B) Phylogenetic tree of PIFs in Arabidopsis thaliana, Malus domestica, and Pyrus bretschneideri. Group I is yellow, group II is pink, and group III is light blue. The numerical values positioned above the phylogenetic nodes represent bootstrap values (%).
3.3. Motifs, Conserved Domains, and Gene Structures Analysis of PIFs
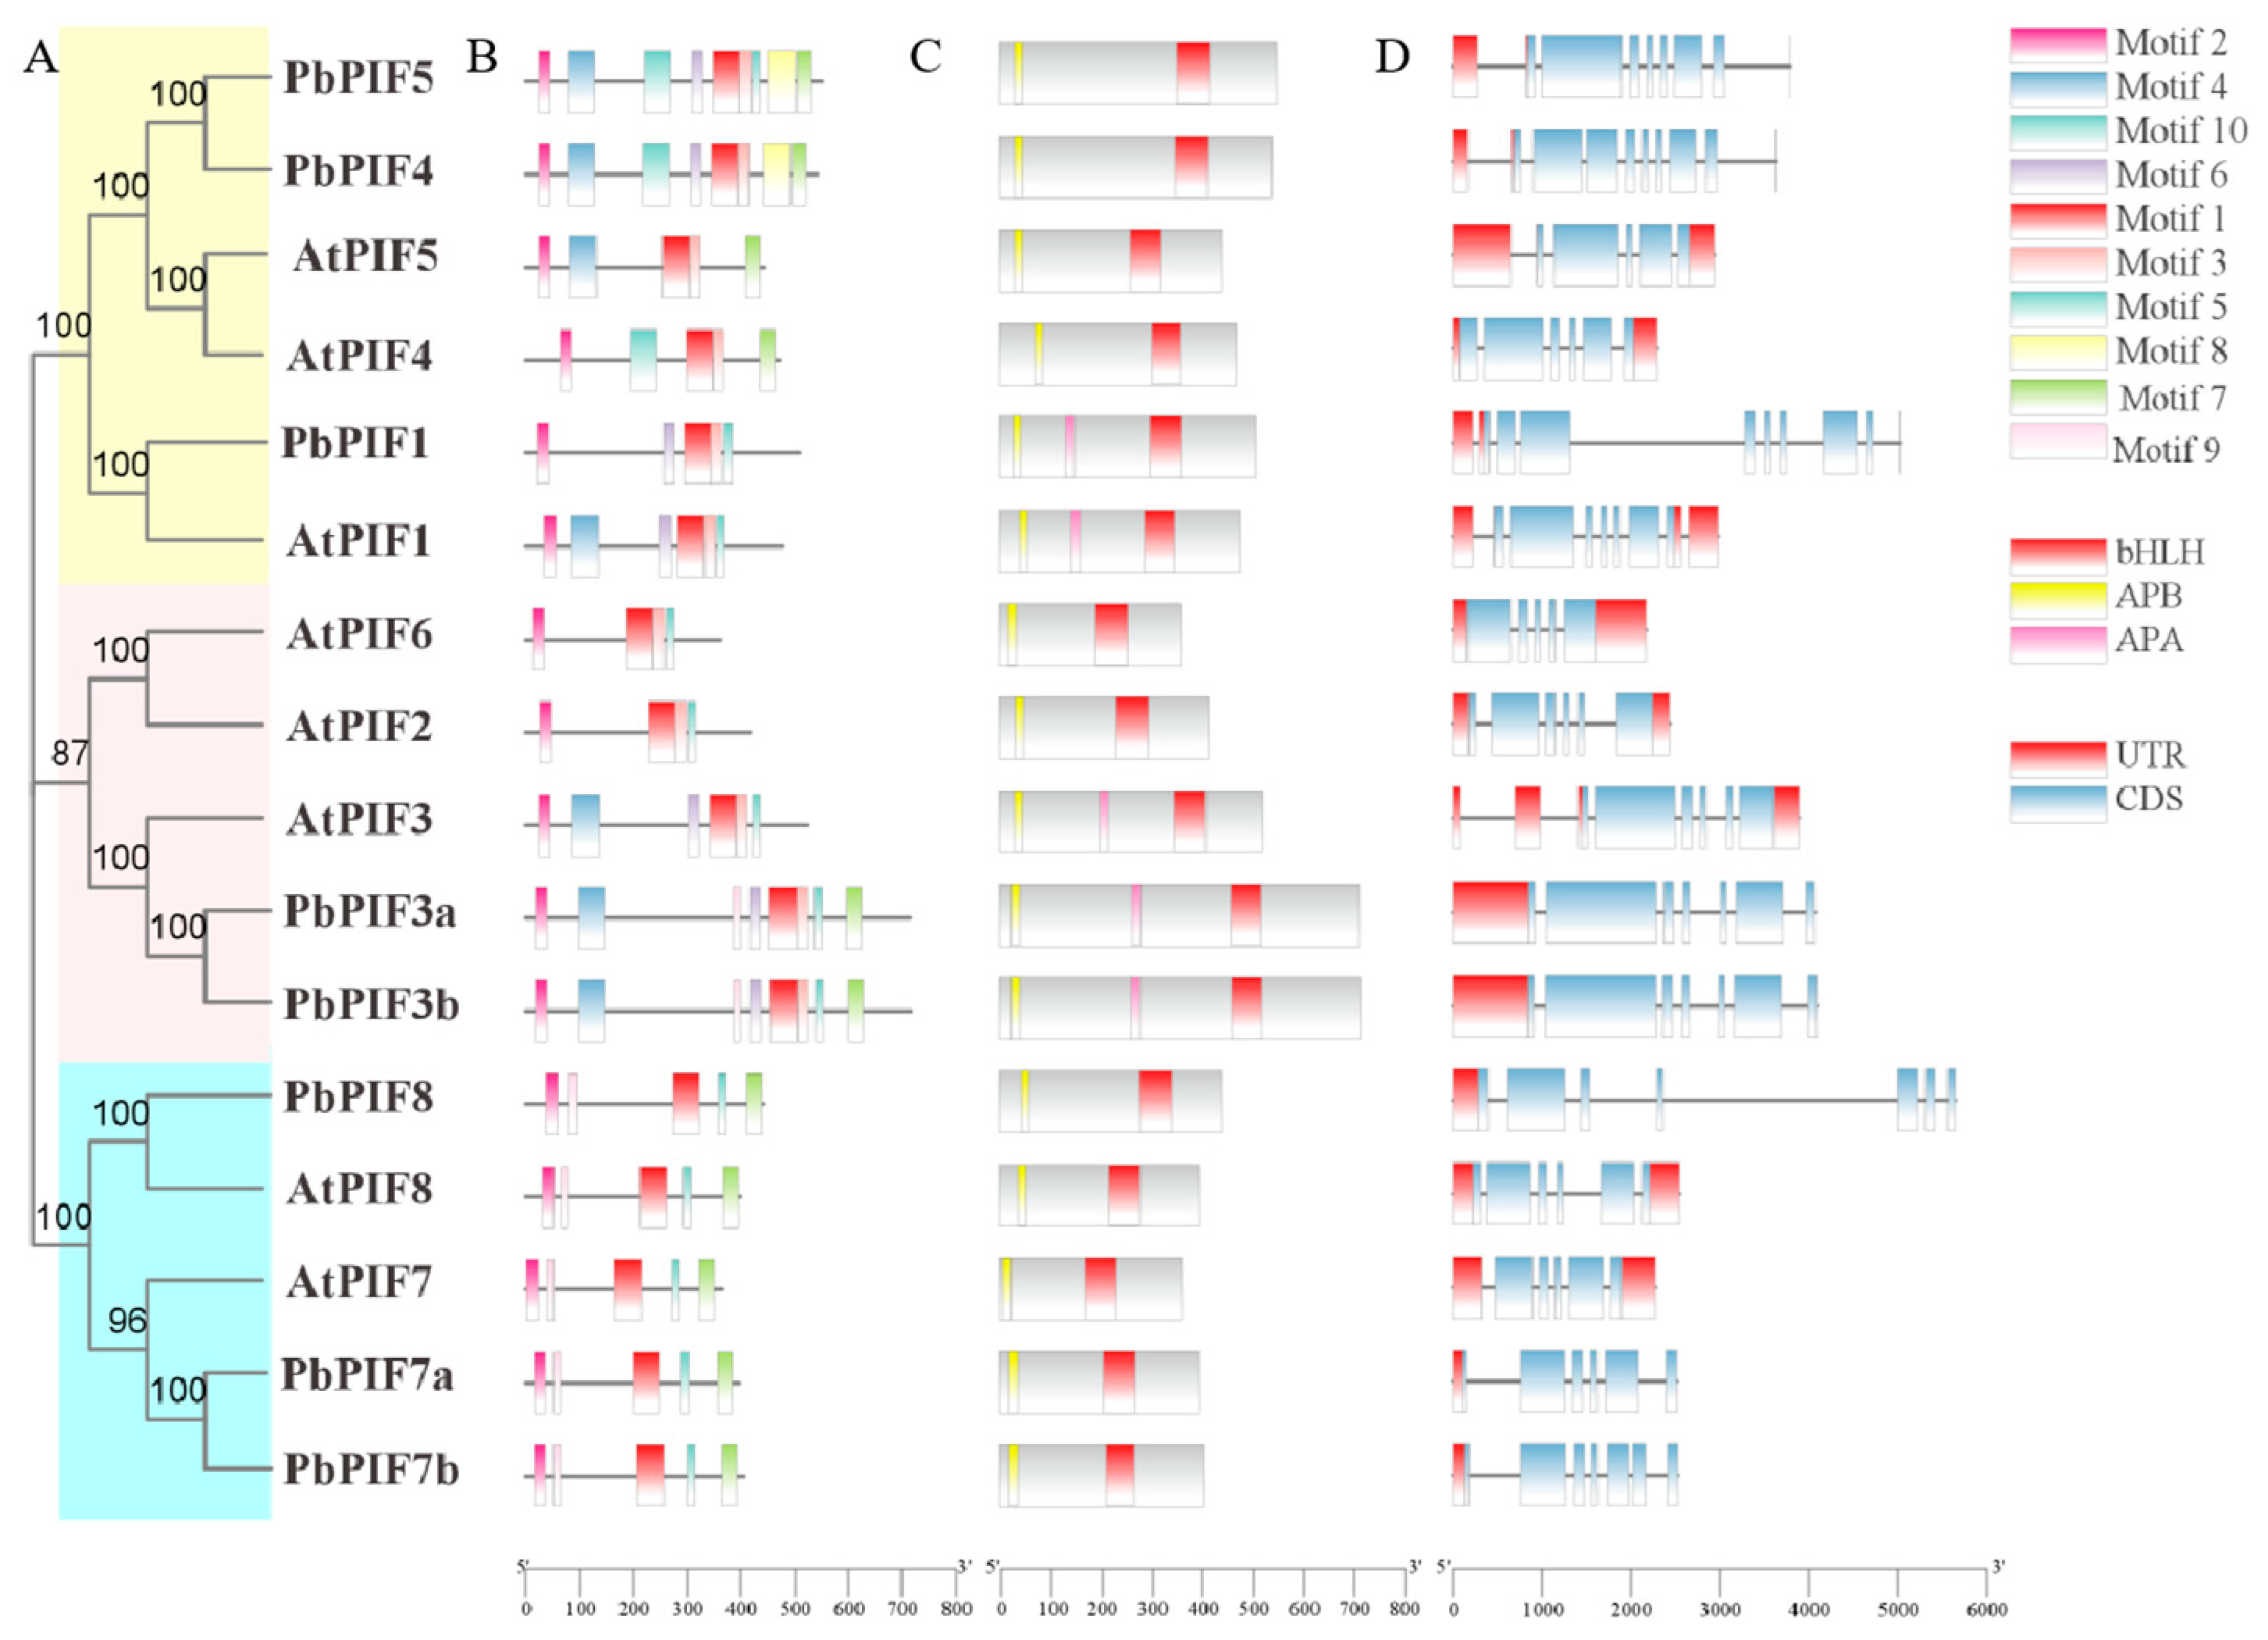
To further investigate the sequence characterization of the PbPIF proteins, we identified ten conserved motifs in the eight PIF members, named Motif 1-Motif 10 (Figure 2B). The length of these conserved motifs ranged from 15 to 50 amino acids, and the details of the motifs were summarized in Figure S2. All PbPIFs had motif 1 and motif 2, which may be conserved motifs in PbPIFs. The number of motifs contained in PIFs varied from five to nine, and the same evolutionary branch had a similar motif composition (Figure 2A,B). PbPIF8, AtPIF8, AtPIF7, PbPIF7a, and PbPIF7b contained the same number of motifs and types of motifs, and the motif position distribution was similar (Figure 2A,B). PbPIF3a and PbPIF3b consisted of one more motif than AtPIF3, and were otherwise identical. In addition, although PIF4 and PIF5 were clustered in the same branch, they had different motif compositions.
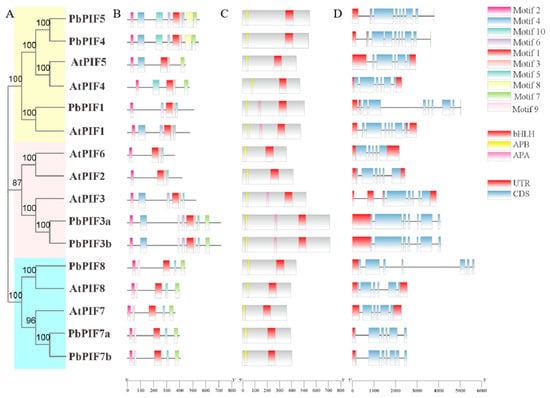
Figure 2.
Analysis of motifs, conserved domains, and gene structures of PIFs in Arabidopsis thaliana and Pyrus bretschneideri. (A) Phylogenetic tree of A. thaliana and P. bretschneideri PIFs. Based on the evolutionary distance, the PIF proteins were classified into three groups. Group I is yellow, group II is pink, and group III is light blue. (B) Conserved motifs of PIFs in A. thaliana and P. bretschneideri. (C) Conserved domains of PIFs in A. thaliana and P. bretschneideri. APB (yellow), APA (pink), and bHLH (crimson) domain were indicated. (D) Exon-intron structures of PIFs in A. thaliana and P. bretschneideri. UTRs (red boxes), exons (blue boxes), and introns (gray lines) were labeled.
The presence of bHLH and APB domain is one of the main features of PIF members. Analysis of eight PbPIF proteins revealed that all PbPIFs contained bHLH and APB domain; APA domain was also present in PbPIF1, PbPIF3a, and PbPIF3b (Figure 2C).
The structural diversity of the PIFs was better understood by examining the motif structures of the PIF genes. All PbPIFs had exons and introns ranging from 5 to 8. Among them, PbPIF7a contained the least number of exons and introns, divided into six exons and five introns (Figure 2D). Nevertheless, in the same branch, PbPIFs usually had similar exon and intron distributions, with little difference in the number and length of exons and introns (Figure 2A,D). In addition, PbPIFs contained one to two more exons compared with the corresponding homologs in Arabidopsis thaliana (Figure 2D).
3.4. Analysis of Cis-Elements in the Promoter of PbPIFs
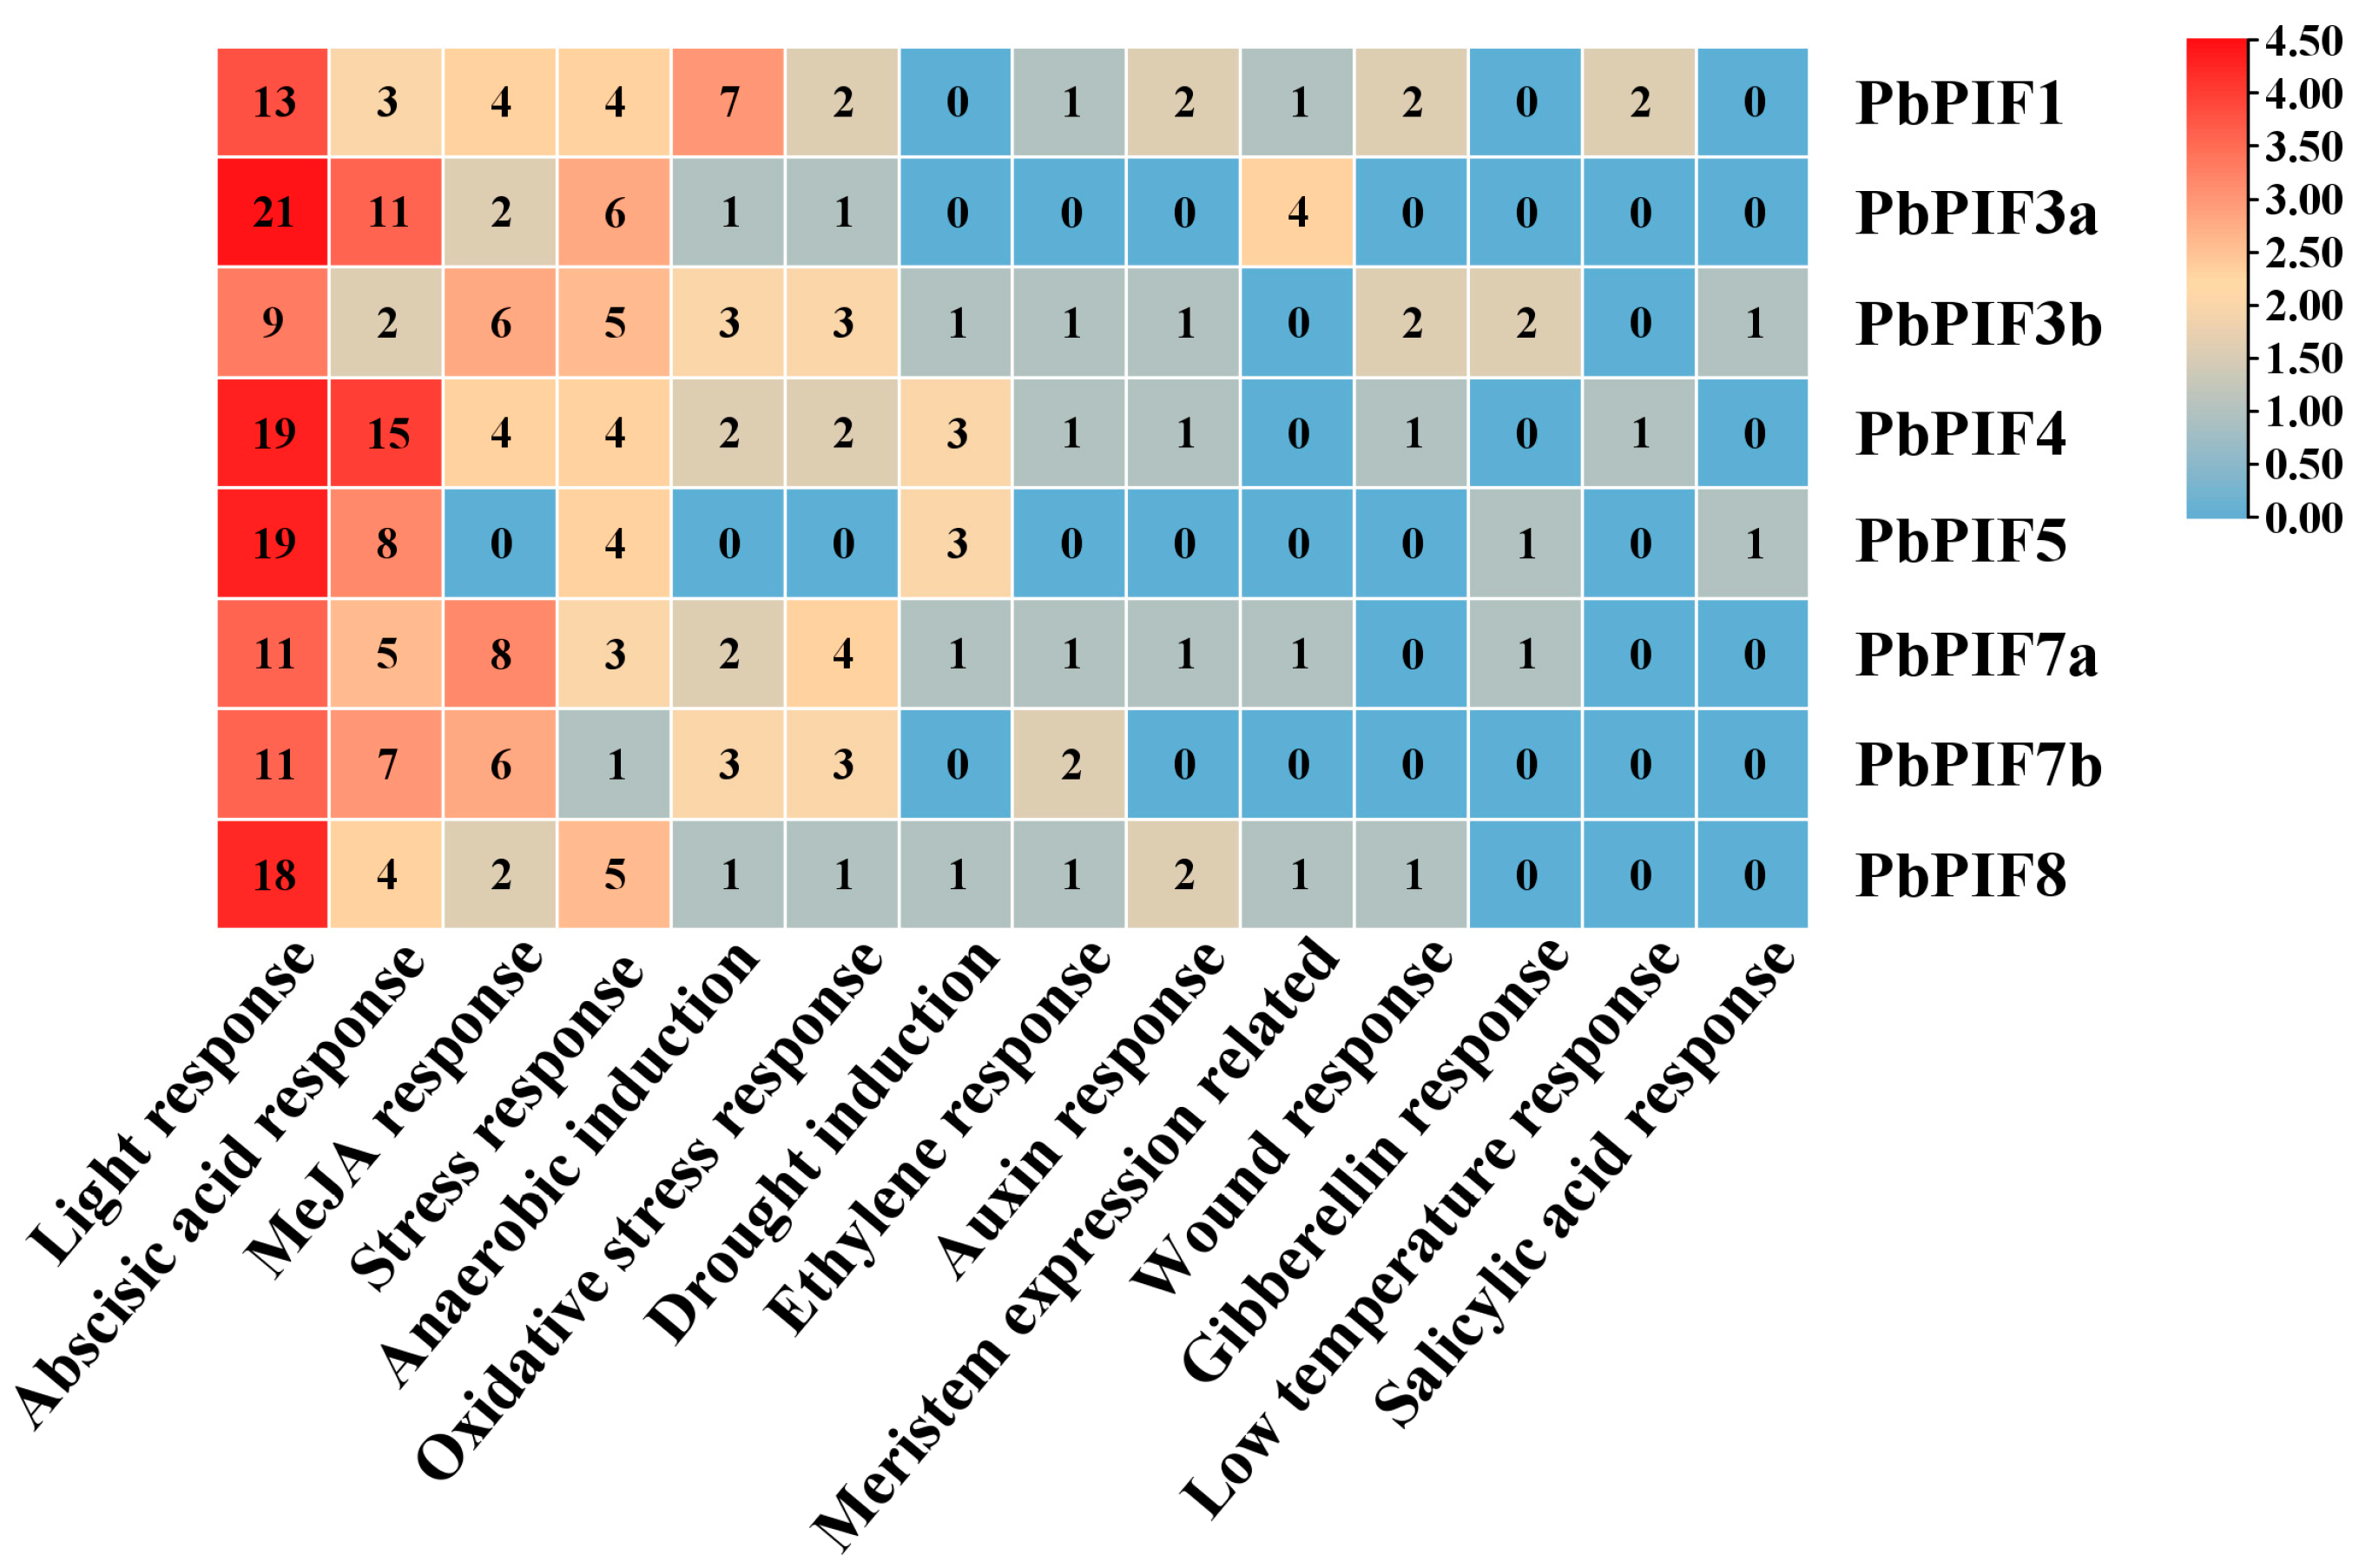
PIFs are involved in plant growth and development, various metabolic reactions, and stress response, and cis-elements in the promoter region play a key role in these processes. To further understand the transcriptional regulatory mechanism of PIFs, a sequence 2000 bp upstream of PbPIFs was used for cis-element analysis (Figure 3). The results revealed that the light-responsive elements were the most numerous and diverse, including: G-box (TACGAT), Box 4 (ATTAAT), TCT (TCTTAC), AE-box (AGAAACTT), G-box (GTATAAGGCC), ACE (CTAACGTATT), and LAMP (CTTTTATCA) (Figure 3). The hormone response elements included abscisic acid response element ABRE (ACGTG), jasmonic acid response element (CGTCA, TGACG), ethylene response element ERE (ATTTTTAAA), growth hormone response element AUX (GGTCCAT) and TGA (AACGAC), gibberellin response element GARE (TCTGTTG), P-box (CCTTTTG), and salicylic acid response element TCA (CCATCTTTTT) (Figure 3). In addition, a large number of elements responding to abiotic and biotic stresses, such as anaerobic response, oxidative stress response, drought response, low-temperature response, and stress-responsive elements, were also present in the PbPIFs promoter region (Figure 3). The results suggested that PbPIFs may be involved in complex regulatory networks to adapt to complex and variable environments. In addition, PbPIF3a and PbPIF4 contained more light-responsive elements and hormone acid-responsive elements, which may be closely related to anthocyanin regulation.
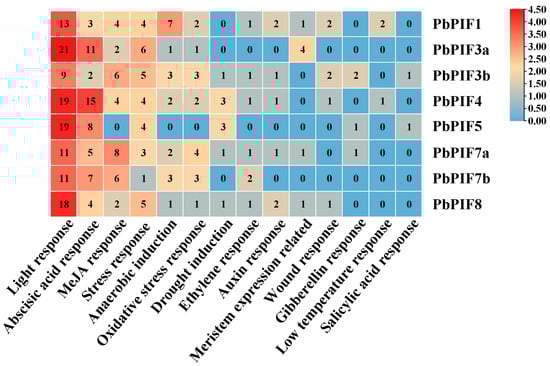
Figure 3.
Analysis of cis-elements in the PbPIFs promoter region. The abundance of cis-elements was represented by a color gradient from blue (lowest) to red (highest). Numerical values within each heatmap cell indicated the count of cis-elements corresponding to the regulatory category listed below.
3.5. Subcellular Localization of PbPIFs
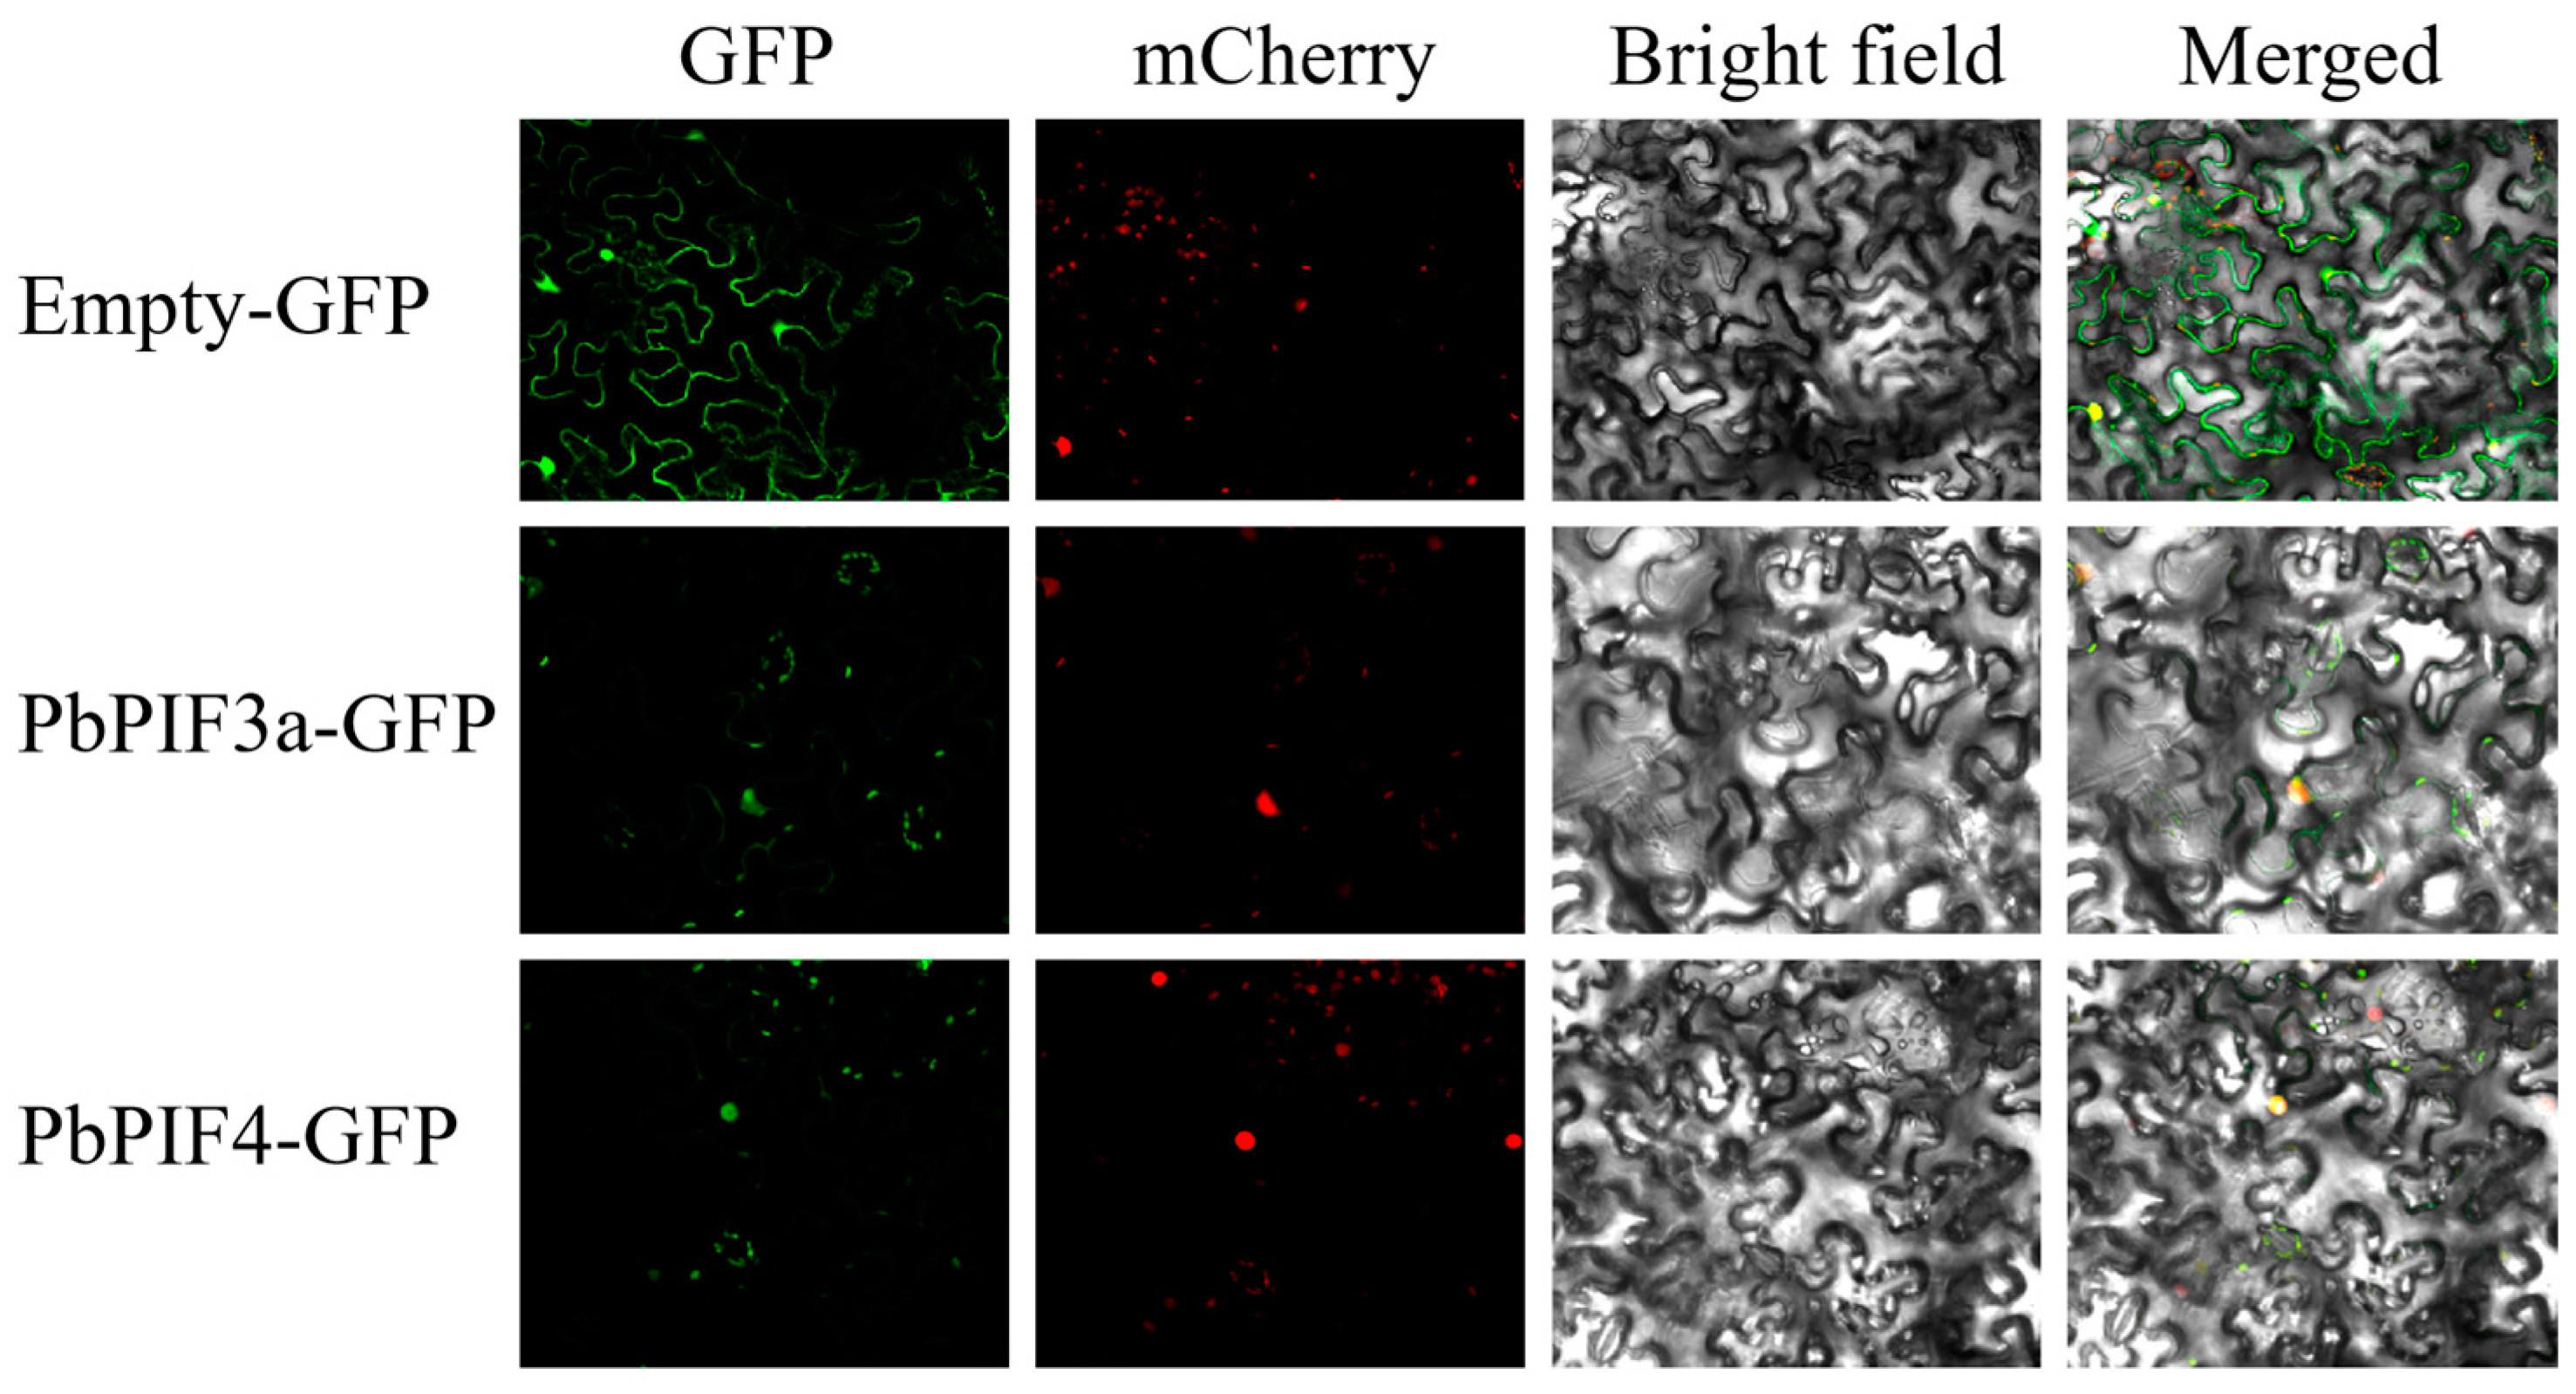
We cloned the full-length CDS of PbPIF3a and PbPIF4, and co-infiltrated Agrobacterium tumefaciens strains containing the p35S-PbPIF3a-GFP vector and p35S-PbPIF4-GFP vector with the nucleocyte nuclear signatures (NSL-mCherry) into Nicotiana benthamiana leaves. The results showed that the green fluorescence of PbPIF3a-GFP and PbPIF4-GFP was detected only in the nucleus and overlapped well with the red nucleus marker, whereas in control Nicotiana benthamiana leaf cells transformed with the empty vector, the green fluorescence was present in the nucleus and cytoplasm (Figure 4). These results suggested that both PbPIF3a and PbPIF4 are specifically localized in the nucleus.

Figure 4.
Subcellular localization and expression pattern analysis of PbPIFs. Bars, 41.4 μm.
3.6. Expression Pattern Analysis of PbPIFs
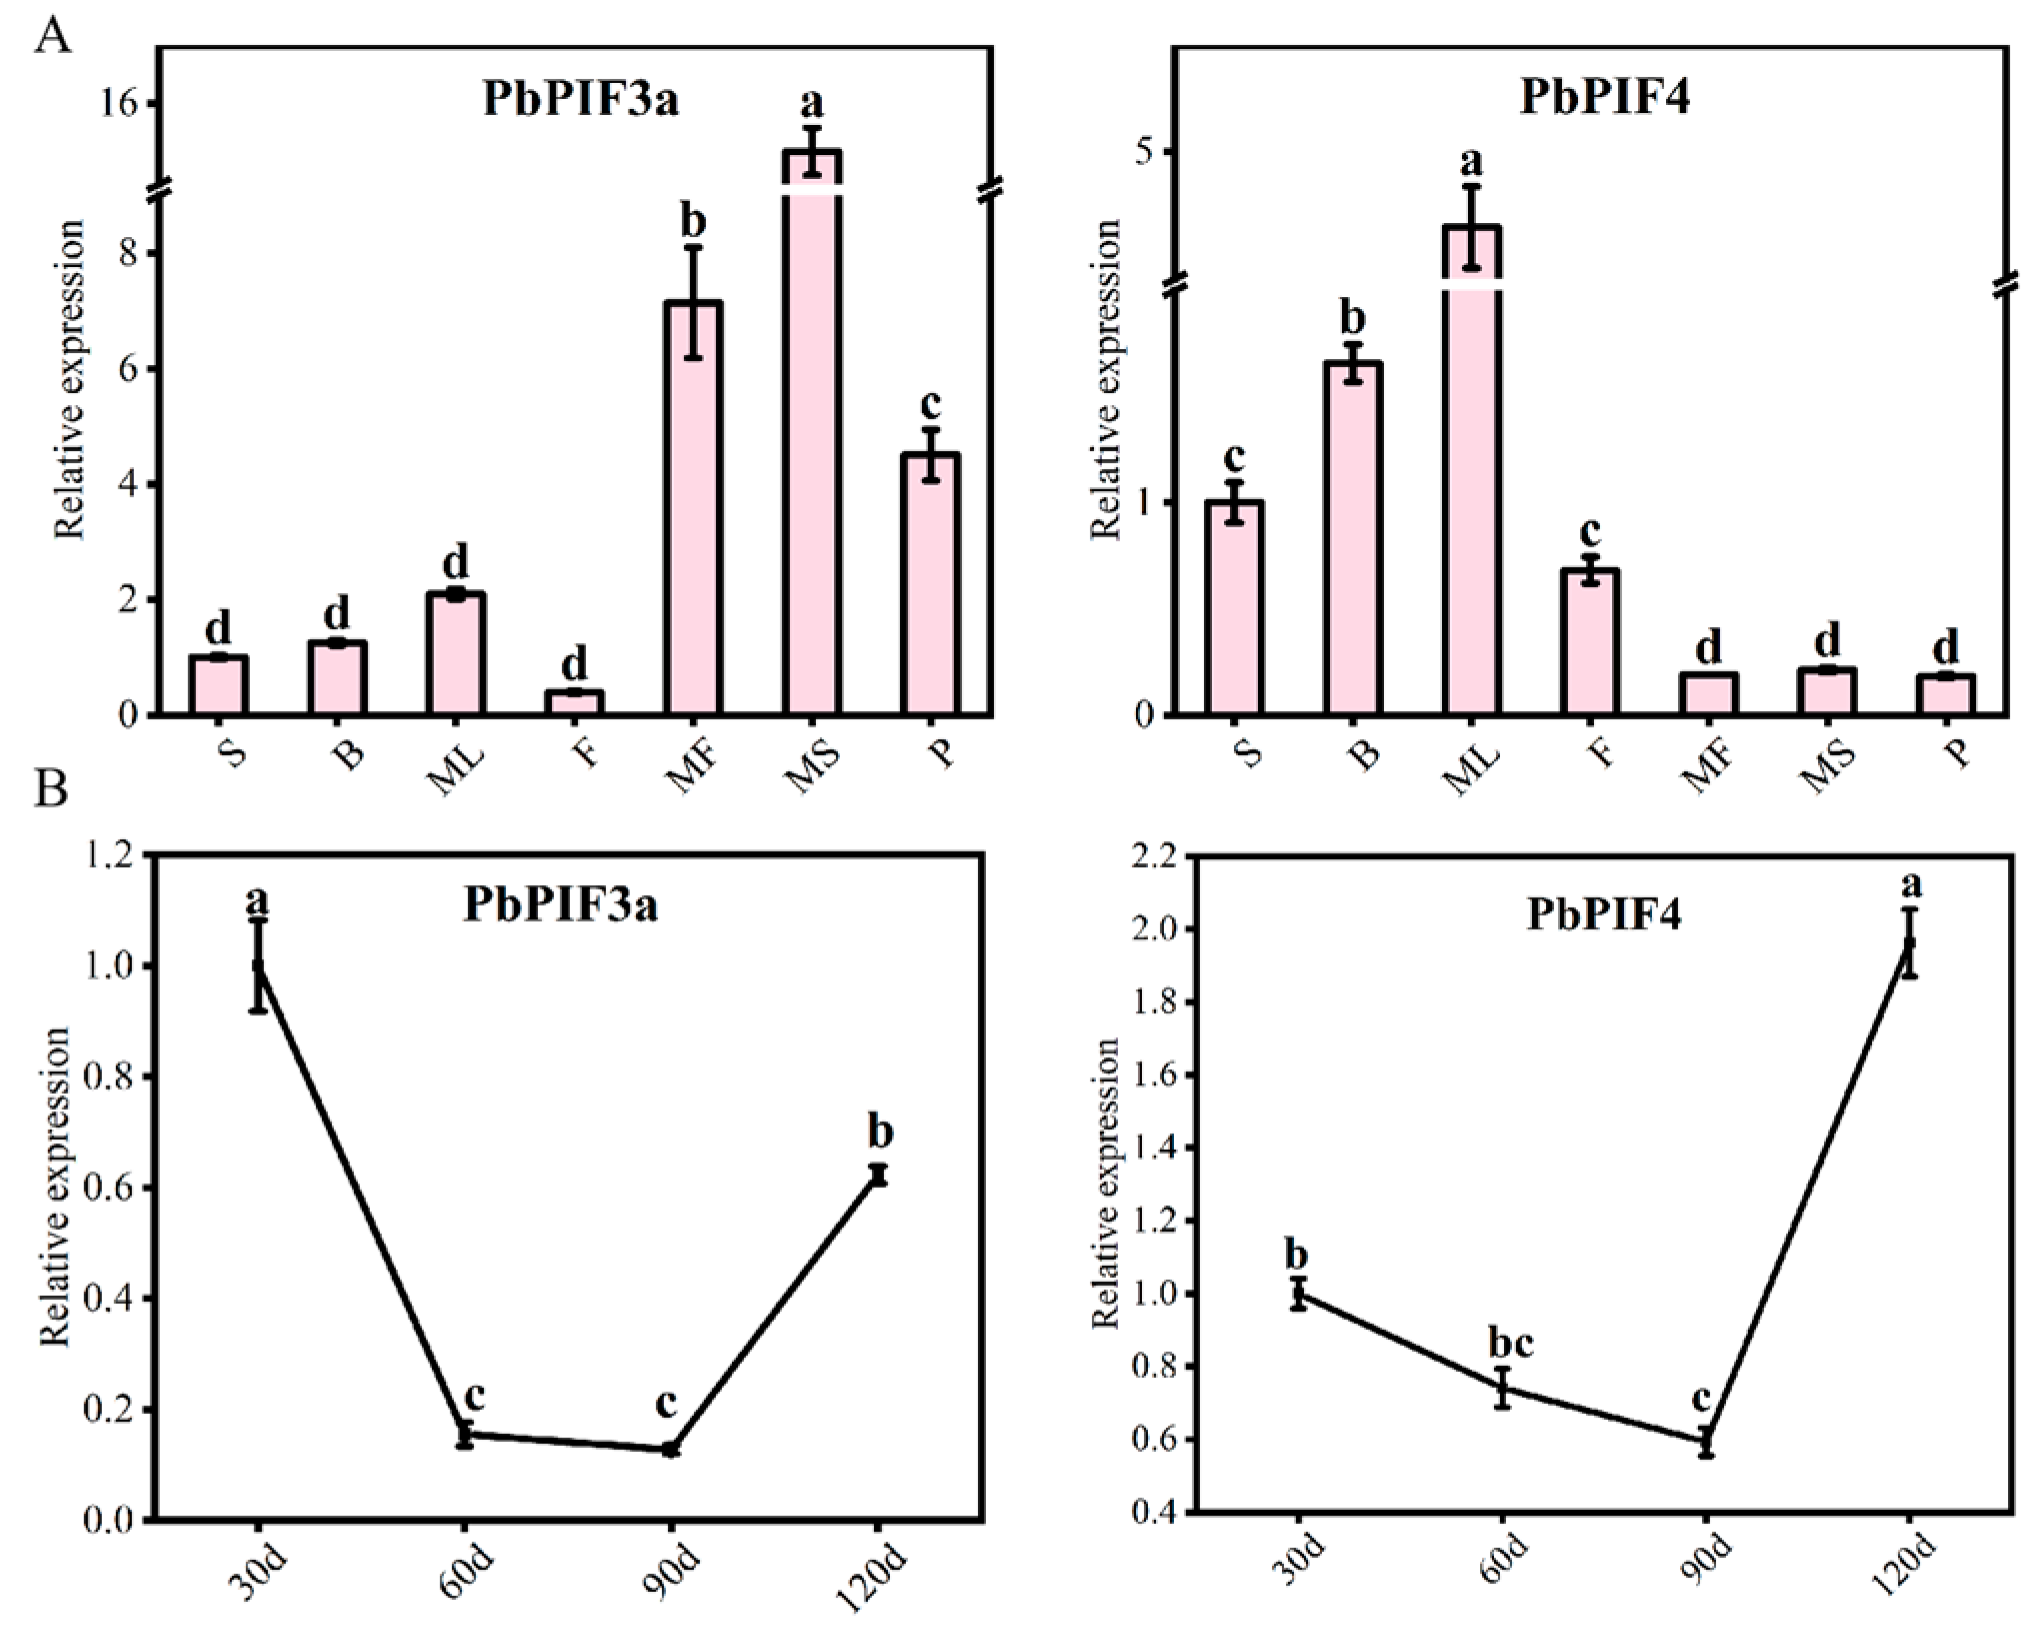
To explore the expression patterns of PbPIF3a and PbPIF4, total RNA was extracted from pear skins (30, 60, 90, and 120 days after full bloom) and other tissues (seeds, flowers, buds, mature leaves, mature-stage skins, mature-stage flesh, petioles) for qRT-PCR analysis (Figure 5). PbPIF3a exhibited peak expression in pear skins at 30 and 120 days of development, whereas PbPIF4 showed high expression in mature leaves and at 120 days of pear skins (Figure 5). According to the characteristics of the ‘Red Zaosu’ pear, the roots, stems, mature leaves, and mature-stage flesh exhibit relatively low levels of anthocyanins, whereas buds, flowers, and skins show high levels. Additionally, during different developmental stages, the skins’ red color gradually fades as development progresses. Therefore, we hypothesized that PbPIF3a and PbPIF4 play an important role in pear anthocyanin biosynthesis.
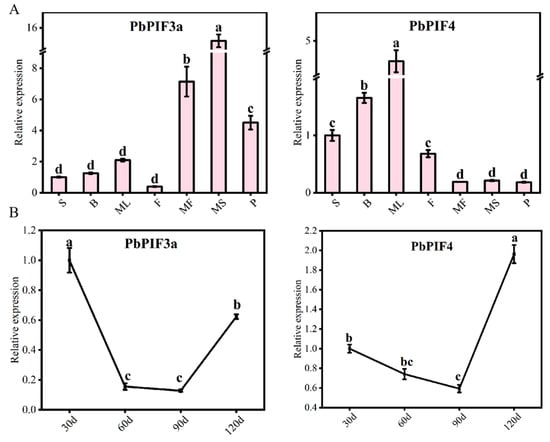
Figure 5.
Expression pattern analysis. (A) Expression patterns of PbPIF3a and PbPIF4 in different tissues of ‘Red Zaosu’. Abbreviations: S (Seeds), B (Buds), ML (Mature leaves), F (Flowers), MF (Mature-stage flesh), MS (Mature-stage skins), P (Petioles). (B) Expression patterns of PbPIFs in the skins of ‘Red Zaosu’ at different developmental stages. Time points: 30 d (30 days after full bloom), 60 d, 90 d, 120 d. Error bars represent standard deviation; lowercase letters indicate significant differences (p < 0.05, ANOVA with Tukey’s test).
3.7. Overexpression of PbPIFs Inhibits Anthocyanin Accumulation
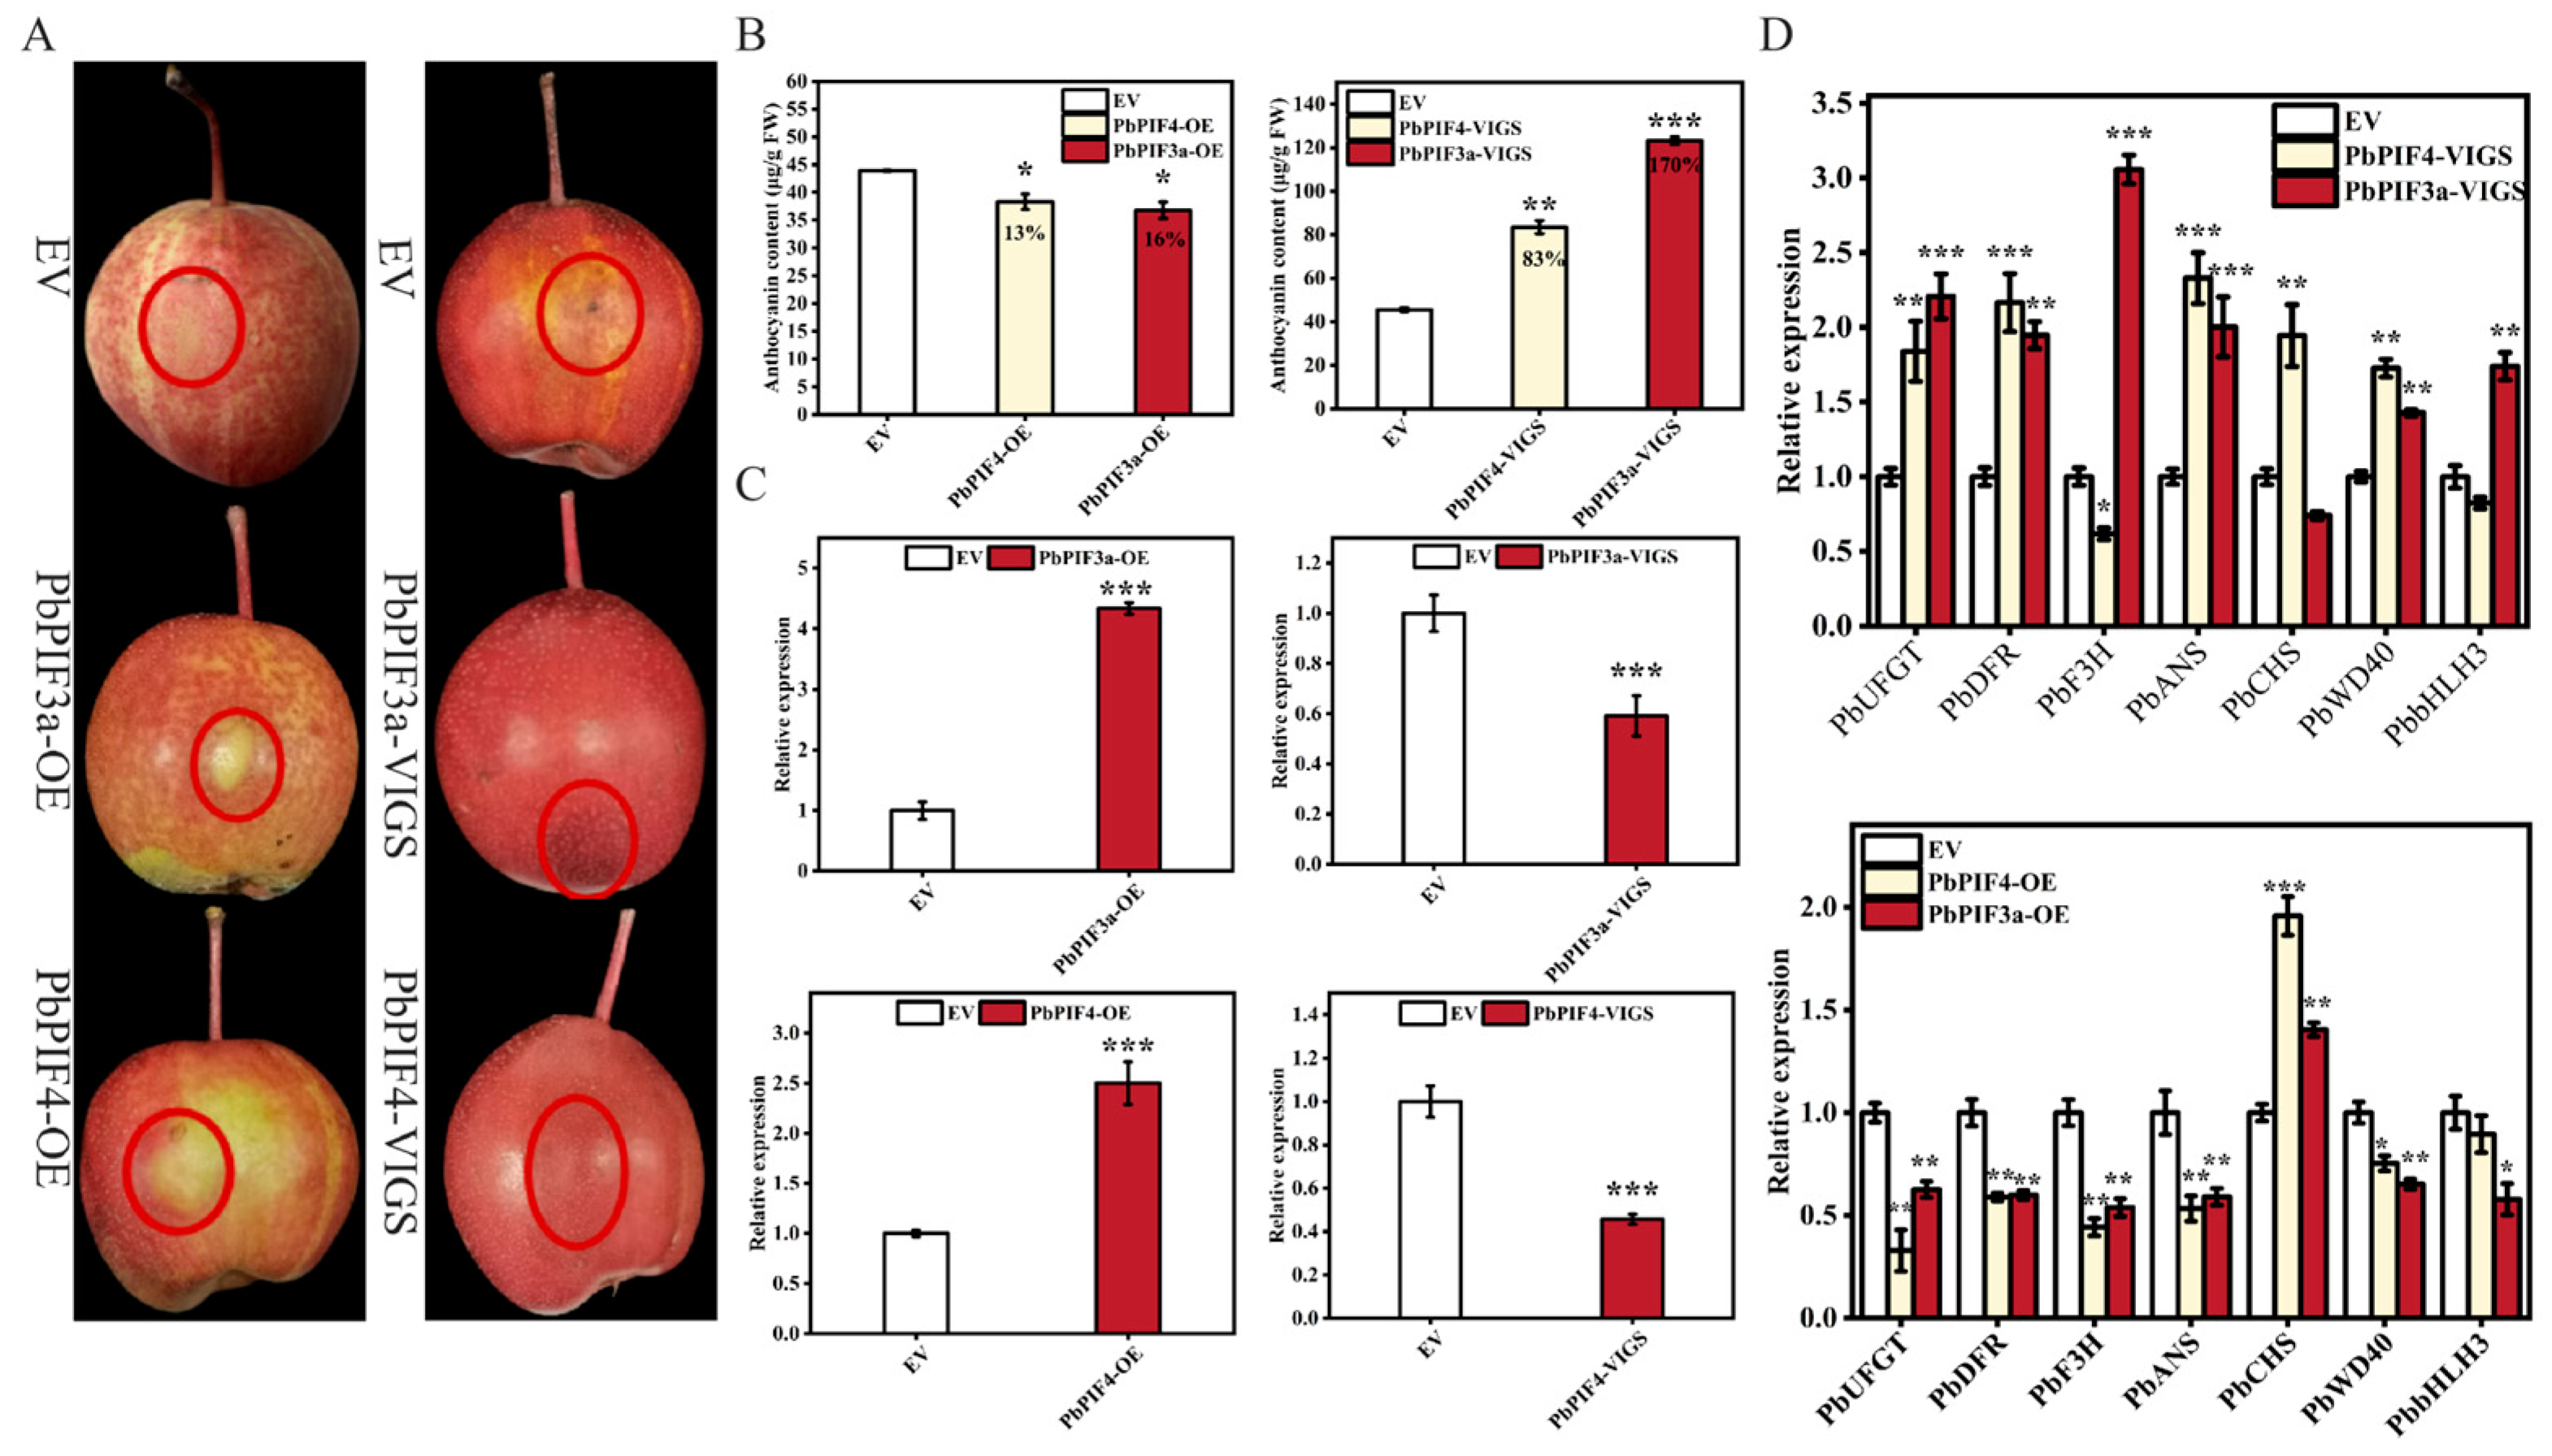
To confirm the role of PbPIF3a and PbPIF4 in pear anthocyanin biosynthesis, we transiently overexpressed and silenced PbPIF3a and PbPIF4 in the skins of ‘Red Zaosu’ pear. In PbPIF3a-OE and PbPIF4-OE infiltrated portion skins, PbPIF3a and PbPIF4 expression was significantly up-regulated compared to the empty vector (Figure 6C). PbPIF3a and PbPIF4 expression was significantly down-regulated in PbPIF3a-VIGS and PbPIF4-VIGS infiltrated pear skins compared to the empty vector (Figure 6C). The transient expression of PbPIF3a and PbPIF4 resulted in chlorosis at the injection sites, while the empty vector infiltrated area exhibited localized anthocyanin accumulation (Figure 6A). The anthocyanin content in the skins of these pears was significantly lower than that of the empty vector-infiltrated pear skins. In contrast, the silencing-induced infiltrated pear skins exhibited a more pronounced accumulation of anthocyanin compared to the empty vector-infiltrated site (Figure 6B). In addition, overexpression of PbPIF3a and PbPIF4 decreased the expression of anthocyanin biosynthetic genes PbUFGT, PbDFR, PbF3H, and PbANS in the skins, whereas the opposite result occurred after silencing (Figure 6D). PbWD40 and PbbHLH3, which are closely related to anthocyanin biosynthesis, also revealed the same trend described above (Figure 6D). These results suggested that PbPIF3a and PbPIF4 negatively regulate anthocyanin biosynthesis.

Figure 6.
Overexpression of PbPIFs inhibits anthocyanin accumulation. (A) Transient overexpression and silencing of PbPIFs in ‘Red Zaosu’ pear fruit. The empty vector (EV) was used as a negative control, with the red dashed circle indicating the agroinfiltration site. (B) Anthocyanin content in treated pear skins. The percentages in the bar chart indicate the extent of increase or decrease relative to the control group. The x-axis represents different treatment groups. (C) Relative expression of PbPIFs in infiltrated pear skins. (D) Relative expression of anthocyanin biosynthetic genes in infiltrated pear skins. Error bars represent standard deviation (n = 3); asterisks denote significant differences determined by Student’s t-test (p < 0.05 *, p < 0.01 **, p < 0.001 ***).
3.8. PbPIFs Inhibits the Activity of Anthocyanin Biosynthetic Genes
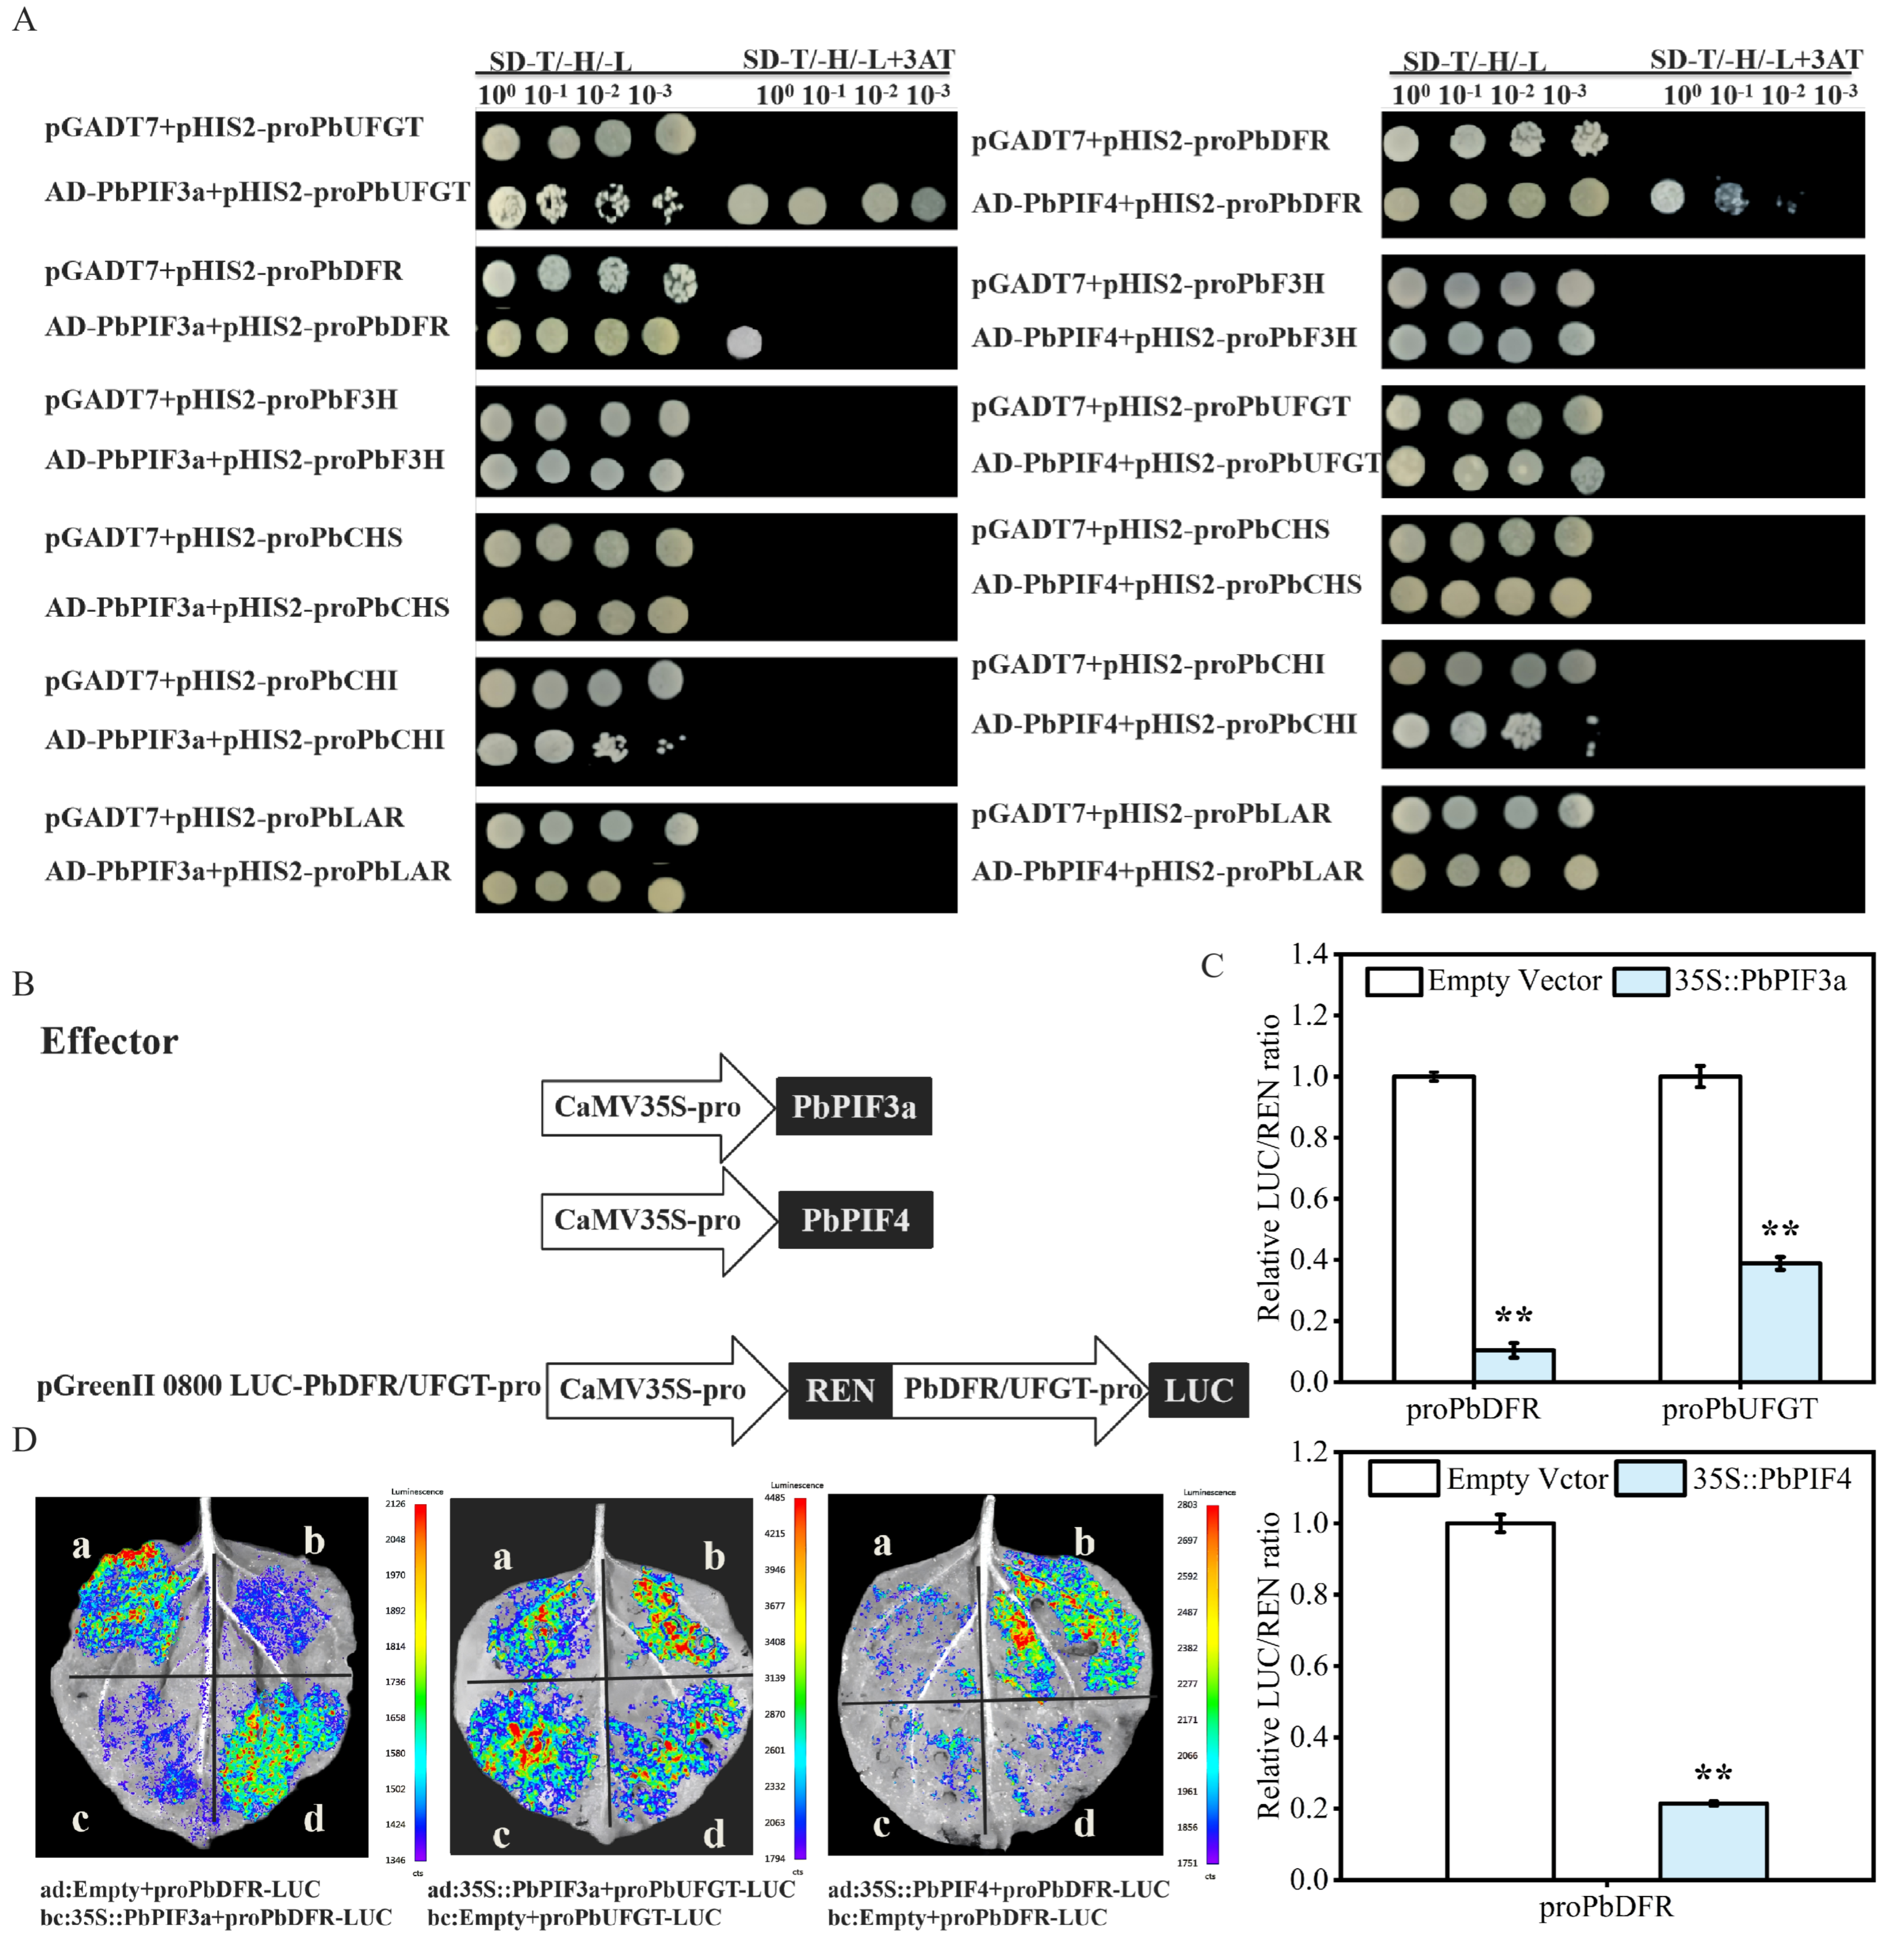
Anthocyanin biosynthetic genes are critical in the anthocyanin biosynthetic pathway. However, anthocyanin biosynthetic genes were downregulated in overexpression injections. Therefore, we hypothesized that PbPIF3a and PbPIF4 could directly regulate anthocyanin biosynthetic genes. To test this hypothesis, we performed yeast one-hybrid assays between PbPIF3a/PbPIF4 and the promoters of anthocyanin biosynthesis genes. According to the yeast one-hybrid principle, when prey proteins (e.g., AD-PbPIF3a or AD-PbPIF4 fused to GAL4 AD) bind to bait DNA sequences (e.g., the anthocyanin structural gene promoter cloned into pHIS2), the reconstituted GAL4 transcription complex activates expression of the HIS3 reporter gene. Yeast cells growing on 3-AT-containing medium thereby confirm specific DNA-protein interaction.
The pGADT7 empty vector and pHIS2-anthocyanin structural gene promoter combinations were the negative control, while the AD-PbPIF3a/pHIS2 or AD-PbPIF4/pHIS2 combinations served as the experimental groups. Yeast cells that co-expressed with an AD-PbPIF3a vector and a pHIS2-proPbDFR or pHIS2-proUFGT vector were able to proliferate in a medium designated as SD/-Leu/-Trp/-His, which was augmented with 3-AT (Figure 7A). In contrast, the yeast cells that served as the negative control did not demonstrate growth under identical conditions (Figure 7A). Similarly, yeast cells co-expressed with AD-PbPIF4 vector and pHIS2-proPbDFR vector grew on SD/-Leu/-Trp/-His medium supplemented with 3-AT, while the negative control showed no yeast growth (Figure 7A). These results indicated that PbPIF3a can bind to the PbDFR and PbUFGT promoters, and PbPIF4 can bind to the PbDFR promoter.

Figure 7.
PbPIFs repressed anthocyanin biosynthetic gene activity. (A) Yeast one-hybrid assay between PbPIFs and promoters of anthocyanin biosynthetic genes. The synthetic defined (SD) medium lacking leucine, tryptophan, and histidine (SD-Leu/-Trp/-His) with 3-aminotriazole (3-AT) was used for selection. (B) Schematic of dual-luciferase reporter vector construction. (C) Dual-luciferase activity assays. Firefly luciferase (FLUC) activity was normalized to Renilla luciferase (RLUC) as an internal control. LUC/REN values were presented as normalized. White bars indicate co-expression of the empty vector with PbDFR/PbUFGT, while blue bars indicate co-expression of the target gene with PbDFR/PbUFGT. (D) Luminescence detection between PbPIFs and PbDFR and PbUFGT promoters in Nicotiana benthamiana leaves. The white letters denote distinct injection combination areas, with corresponding explanations provided in the figure legend below. Error bars represent standard deviation (n = 3); asterisks denote significant differences by Student’s t-test (p < 0.01, **).
To further verify the regulatory role of PbPIF3a and PbPIF4 on the anthocyanin structural gene promoters, we performed dual-luciferase assays and luminescence detections. In the dual-luciferase system, Firefly luciferase (LUC) driven by the target promoter reflects transcriptional activity, while Renilla luciferase (REN) serves as an internal control to normalize transfection efficiency. The LUC/REN ratio quantifies promoter activity suppression or activation.
The LUC/REN ratio in the experimental group (35S::PbPIF3a + proPbDFR-LUC/proPbUFGT-LUC) was significantly lower than that in the control group (empty vector + proPbDFR-LUC/proPbUFGT-LUC) (Figure 7C). Similarly, the LUC/REN ratio of PbPIF4 was likewise significantly lower than that of the control group after co-expression with proPbDFR-LUC (Figure 7C). Luminescence detection revealed that co-expression of 35S::PIF3a with proPbUFGT-LUC or proPbDFR-LUC resulted in significantly weaker luminescence intensity compared to co-expression with empty vector and proPbUFGT-LUC or proPbDFR-LUC (Figure 7D). A similar suppression pattern was observed when 35S::PbPIF4 was co-expressed with proPbDFR-LUC (Figure 7D). This indicated that 35S::PbPIF3a and 35S::PbPIF4 can inhibit the activity of anthocyanin structural gene promoters.
In summary, PbPIF3a and PbPIF4 can negatively regulate pear anthocyanin biosynthesis by directly binding to anthocyanin biosynthetic genes.
4. Discussion
4.1. Characteristics and Evolutionary Conservation of the PbPIF Family
We identified 8 PIFs in the pear genome, which is similar to the number of PIFs identified in Arabidopsis and apple [4,9]. The 8 identified PbPIF proteins all contained bHLH and APB domain, and some members also had APA domain, which are highly consistent with the structural features of the PIFs family in other species (Figure 2C). For instance, in Arabidopsis, all eight AtPIF proteins possess APB domain, with AtPIF1 and AtPIF3 additionally containing APA domain [4]. Similarly, all seven MdPIF proteins in Malus domestica retain APB domain, while MdPIF1-MdPIF5 further harbor APA domain [9]. In Zea mays, conserved APB motifs are present in all seven ZmPIFs, with two members (ZmPIF3.1 and ZmPIF3.2) exhibiting APA domain [6]. This trend extends to Solanum lycopersicum, where all eight SlPIF proteins contain APB domain, though APA domains are exclusively observed in SlPIF1a, SlPIF1b, and SlPIF3 [8]. Furthermore, it is worth noting that PbPIF7a and PbPIF8 showed an amino acid substitution in the APB domain, changing the conserved (glycine) G residue and (glutamine) Q residue to (serine) S residue and (glutamic acid) E residue, respectively (Figure S1). Similarly, in apple MdPIF7 and MdPIF8, the conserved glutamine (Q) residue is mutated to an unknown amino acid (X) residue and a glutamic acid (E) residue [9]. In contrast to PbPIF7a and PbPIF8, the amino acid alterations in MdPIF7 and MdPIF8 are restricted to substitutions of the glutamine (Q) residue [9]. These variations in conserved residues imply that PbPIF7a and PbPIF8 may possess distinct functional properties. Phylogenetic analysis indicated that PbPIFs are more closely related to apple MdPIFs, implying that the function of PIF genes in Rosaceae plants may be conserved.
Notably, the pear genome lacked the PIF6 homolog gene specific to Arabidopsis, which may reflect the adaptive evolution of gene function differentiation between species. In addition, the number of exons in the PbPIFs were 1–2 more than that in the Arabidopsis homologous genes, suggesting that the divergence of gene structure may affect the complexity of its transcriptional regulation [27].
4.2. A Multi-Level Regulatory Network Revealed by Promoter Cis-Elements
PIFs act as central signaling hubs regulating multiple aspects of plant growth and development, including light perception, hormonal responses, thermoregulation, stress adaptation, and circadian clock modulation [4]. Transcription factors bind to cis-elements within PIFs promoter regions to orchestrate signal-responsive transcriptional regulation [34].
In Arabidopsis, PIF3 accumulates in etiolated seedlings but undergoes rapid light-mediated degradation [35]. PIF4 and PIF5 regulate diurnal growth rhythms, while PIF7 modulates shade avoidance responses [11,27]. Studies demonstrate that GhPIF4a activates the thermoresponsive GhFT promoter to accelerate flowering in Gossypium hirsutum [36]. CsPIF3 integrates phytochrome B (PHYB) and UV-B signaling to mediate gibberellin-dependent hypocotyl elongation [37]. OsPIL15 coordinates red light and abscisic acid signaling to control stomatal aperture in Oryza sativa [38]. Furthermore, in Cucurbita moschata, CmPIF8 directly binds to the promoters of CmWRKY42 and CmICS to suppress their transcription, thereby reducing jasmonic acid biosynthesis and compromising resistance to powdery mildew [39]. In this study, the promoters of PbPIFs contain a higher abundance of light-responsive elements (e.g., G-box, Box 4) and hormone-responsive elements (e.g., ABRE, ERE), with total numbers of 121 and 107, respectively, suggesting that their expression may be coordinately regulated by phytochrome-mediated light signals and plant hormones, including abscisic acid (ABA), ethylene, and auxin (Figure 3). Notably, the enrichment of both light-responsive and ABA-responsive elements in the promoters of PbPIF3a and PbPIF4 implies their potential involvement in secondary metabolism (e.g., anthocyanin biosynthesis) through the integration of light and ABA signaling pathways (Figure 3). This is similar to the coexistence of light-responsive and low-temperature responsive elements in the promoter of the AtPIF3, indicating the core role of the PIFs family in environmental signal integration [40]. In addition, the widespread presence of stress-responsive elements (such as drought, low temperature) suggests that PbPIFs may enhance plant stress resistance by regulating secondary metabolites (such as anthocyanins).
4.3. Functional Correlation of Subcellular Localization and Tissue-Specific Expression Patterns
PbPIF3a and PbPIF4 were located in the nucleus (Figure 4), which is consistent with their function as transcription factors, consistent with conclusions from Arabidopsis, apple, rice, and tomato [8,9,41,42].
PIFs exhibit tissue-specific expression patterns and perform distinct regulatory functions in plant development and physiology. In maize, ZmPIF1 and ZmPIF3 demonstrate preferential expression in pistils and leaves, where they enhance yield through tiller formation and spike number augmentation [6]. Conversely, SlPIF4 shows high transcriptional activity in tomato leaves and immature fruits, with expression markedly declining during fruit ripening [8]. Here, the high expression of PbPIF3a and PbPIF4 during the matural pear skins development (120 days) may be related to their inhibitory effect on the anthocyanin biosynthesis phase (Figure 5) [27]. Interestingly, PbPIFs were highly expressed in the later stage of pear skins development when anthocyanin levels decrease, suggesting a negative correlation between its expression pattern and anthocyanin accumulation, a phenomenon also reported in studies of negative regulatory factors such as grape VvMYBPA1 [43].
4.4. Molecular Mechanism of PbPIFs Negatively Regulating Anthocyanin Biosynthesis
The first reports on the involvement of PIFs in anthocyanoside regulation originated from Arabidopsis thaliana’s PIF3. AtPIF3 positively regulates anthocyanin biosynthesis in Arabidopsis under far-red light conditions by binding to the anthocyanin biosynthetic gene promoters on separate sequence elements together with HY5, while AtPIF4 and AtPIF5 inhibit AtDFR and AtF3H promoter activity under red light induction to negatively regulate anthocyanin [12,13]. Previous reports have shown that apple PIF7 can negatively regulate anthocyanin biosynthesis under weak light conditions by inhibiting BBX23 expression and interacting with bZIP44 and ERF38 [23]. In ‘Red Zaosu’ pear, PpPIF8 negatively and positively regulate anthocyanin biosynthesis, respectively [26]. In this study, transient overexpression of PbPIF3a and PbPIF4 indicated that PIFs inhibited anthocyanin accumulation in pear fruit, whereas silencing presented the opposite result (Figure 6). This is contrary to the role of PIF3 and the same as PIF4 and PIF5 in Arabidopsis [13]. Yeast one-hybrid and dual-luciferase assays confirmed direct binding of PbPIF3a to PbDFR and PbUFGT promoters, whereas PbPIF4 specifically suppressed PbDFR transcription via promoter interference (Figure 7A,C,D). This regulatory mechanism parallels observations in Arabidopsis, apple, and pear, where AtPIF3, AtPIF4, AtPIF5, MdPIF1, and PpPIF8 directly bind to anthocyanin biosynthetic gene promoters to suppress transcriptional activity [12,13,24,26]. Additionally, PyPIF5 also acts as an upstream light-signaling regulator, suppressing anthocyanin biosynthesis in pear fruits through a multi-tiered regulatory hierarchy in ‘Yunhongyihao’ (Pyrus pyrifolia) [25]. This indicates that the function of PIFs regulation of anthocyanin biosynthesis may differ due to the response differences of PIFs to different light quality signals or species specificity.
In the classical regulatory pathway of anthocyanin biosynthesis, the MYB-bHLH-WD40 complex plays a very important role. In Arabidopsis, AtPIF4 affects the integrity of the MBW complex by interacting with Production of Anthocyanin Pigment 1 (PAP1) under stress conditions, thereby negatively regulating anthocyanin biosynthesis [14]. In Pyrus pyrifolia, bHLH64 and bHLH3 form functional complexes with MYB transcription factors to synergistically promote anthocyanin biosynthesis, while PyMYB10 and PyMYB10.1 exhibit enhanced activation of PyDFR through cooperative interactions with bHLH transcription factors [20,21,44]. PbPIFs may also indirectly regulate the expression of anthocyanin biosynthesis genes by modulating these transcription factors, a hypothesis that warrants further investigation. Future studies should focus on elucidating the PIF regulatory network in pear through cross-species mechanistic comparisons, multi-dimensional functional validation, and exploration of breeding applications.
5. Conclusions
In this study, we identified 8 PIFs in the pear genome and conducted a systematic analysis. The research indicated that PbPIF3a and PbPIF4 were specifically localized in the nucleus and highly expressed in tissues and developmental stages with lower anthocyanin levels. Functional validation showed that PbPIF3a and PbPIF4 negatively regulated pear skins coloration by directly inhibiting the transcriptional activity of key anthocyanin biosynthesis genes. This study provides new insights into the understanding of PIFs-mediated anthocyanin biosynthesis and lays the foundation for further analysis of PIFs functions.
Supplementary Materials
The following supporting information can be downloaded at: https://www.mdpi.com/article/10.3390/agronomy15040959/s1, Table S1: Primer sequences used in the current study; Figure S1: Multiple sequence alignment of pear and Arabidopsis PIFs; Figure S2: Motif of pear and Arabidopsis PIFs.
Author Contributions
Y.Z. (Yong Zhang) and H.T. conceived and supervised the study; Q.C. and Y.L. (Yuanxiu Lin) revised the manuscript; Y.Z. (Yunting Zhang) and Y.L. (Ya Luo) analyzed the data; S.L. collected samples; X.Z. performed data visualization; D.L. conducted data analysis and wrote the manuscript; H.W. performed experimental verification, data organization and analysis, and wrote the manuscript. All authors have read and agreed to the published version of the manuscript.
Funding
This work was funded by the Sichuan Provincial Science and Technology Planning Project (Grant No. 2021YFYZ0023-03) and Natural Science Foundation of Sichuan Province (Grant No. 2024NSFSC0392).
Data Availability Statement
The data presented in this study are available on request from the corresponding author.
Conflicts of Interest
The authors declare no conflict of interest.
References
- Wu, M.; Liu, J.; Song, L.; Li, X.; Cong, L.; Yue, R.; Yang, C.; Liu, Z.; Xu, L.; Wang, Z. Differences among the anthocyanin accumulation patterns and related gene expression levels in red pears. Plants 2019, 8, 100. [Google Scholar] [CrossRef] [PubMed]
- Havsteen, B.H. The biochemistry and medical significance of the flavonoids. Pharmacol. Ther. 2002, 96, 67–202. [Google Scholar]
- Pervaiz, T.; Songtao, J.; Faghihi, F.; Haider, M.S.; Fang, J. Naturally occurring anthocyanin, structure, functions and biosynthetic pathway in fruit plants. J. Plant Biochem. Physiol. 2017, 5, 1–9. [Google Scholar] [CrossRef]
- Willige, B.C.; Zander, M.; Yoo, C.Y.; Phan, A.; Garza, R.M.; Wanamaker, S.A.; He, Y.; Nery, J.R.; Chen, H.; Chen, M.; et al. Phytochrome-Interacting factors trigger environmentally responsive chromatin dynamics in plants. Nat. Genet. 2021, 53, 955–961. [Google Scholar] [CrossRef]
- Nakamura, Y.; Kato, T.; Yamashino, T.; Murakami, M.; Mizuno, T. Characterization of a set of phytochrome-interacting factor-like bHLH proteins in Oryza sativa. Biosci. Biotechnol. Biochem. 2007, 71, 1183–1191. [Google Scholar] [CrossRef]
- Wu, G.; Zhao, Y.; Shen, R.; Wang, B.; Xie, Y.; Ma, X.; Zheng, Z.; Wang, H. Characterization of maize phytochrome-interacting factors in light signaling and photomorphogenesis. Plant Physiol. 2019, 181, 789–803. [Google Scholar] [CrossRef]
- Han, Y.; Yang, J.; Zhang, N.; Gong, Y.; Liu, M.; Qiao, R.; Jiao, X.; Zhu, F.; Li, X.; Si, H. Genome-wide identification of phytochrome-interacting factor (PIF) gene family in potatoes and functional characterization of StPIF3 in regulating shade-avoidance syndrome. Agronomy 2024, 14, 873. [Google Scholar] [CrossRef]
- Rosado, D.; Gramegna, G.; Cruz, A.; Lira, B.S.; Freschi, L.; de Setta, N.; Rossi, M. Phytochrome interacting factors (PIFs) in Solanum lycopersicum: Diversity, evolutionary history and expression profiling during different developmental processes. PLoS ONE 2016, 11, e0165929. [Google Scholar] [CrossRef]
- Zheng, P.F.; Wang, X.; Yang, Y.Y.; You, C.X.; Zhang, Z.L.; Hao, Y.J. Identification of phytochrome-interacting factor family members and functional analysis of MdPIF4 in Malus domestica. Int. J. Mol. Sci. 2020, 21, 7350. [Google Scholar] [CrossRef]
- Khanna, R.; Huq, E.; Kikis, E.A.; Al-Sady, B.; Lanzatella, C.; Quail, P.H. A novel molecular recognition motif necessary for targeting photoactivated phytochrome signaling to specific basic helix-loop-helix transcription factors. Plant Cell 2004, 16, 3033–3044. [Google Scholar] [CrossRef]
- Shen, H.; Zhu, L.; Castillon, A.; Majee, M.; Downie, B.; Huq, E. Light-induced phosphorylation and degradation of the negative regulator phytochrome-interacting factor1 from Arabidopsis depend upon its direct physical interactions with photoactivated phytochromes. Plant Cell 2008, 20, 1586–1602. [Google Scholar] [CrossRef] [PubMed]
- Shin, J.; Park, E.; Choi, G. Pif3 regulates anthocyanin biosynthesis in an HY5-dependent manner with both factors directly binding anthocyanin biosynthetic gene promoters in Arabidopsis. Plant J. 2007, 49, 981–994. [Google Scholar] [CrossRef]
- Liu, Z.; Zhang, Y.; Wang, J.; Li, P.; Zhao, C.; Chen, Y.; Bi, Y. Phytochrome-interacting factors PIF4 and PIF5 negatively regulate anthocyanin biosynthesis under red light in Arabidopsis Seedlings. Plant Sci. 2015, 238, 64–72. [Google Scholar] [CrossRef] [PubMed]
- Liu, Z.; Wang, Y.; Fan, K.; Li, Z.; Jia, Q.; Lin, W.; Zhang, Y. Phytochrome-interacting factor 4 (PIF4) negatively regulates anthocyanin accumulation by inhibiting PAP1 transcription in Arabidopsis seedlings. Plant Sci. 2021, 303, 110788. [Google Scholar] [CrossRef] [PubMed]
- Ji, X.; Yang, F.; Zhou, X.; Jia, W.; Zhu, X.; Mu, J.; Wang, Y.; Zhang, Y.; Mi, Z.; Zhang, S.; et al. Genome-wide identification of the bHLH gene family and the mechanism regulation of anthocyanin biosynthesis by ChEGL1 in Cerasus humilis. Int. J. Biol. Macromol. 2025, 288, 138783. [Google Scholar] [CrossRef]
- Li, P.; Chen, B.; Zhang, G.; Chen, L.; Dong, Q.; Wen, J.; Mysore, K.S.; Zhao, J. Regulation of anthocyanin and proanthocyanidin biosynthesis by Medicago truncatula bHLH transcription factor MtTT8. New Phytol. 2016, 210, 905–921. [Google Scholar] [CrossRef]
- Jiang, L.; Yue, M.; Liu, Y.; Zhang, N.; Lin, Y.; Zhang, Y.; Wang, Y.; Li, M.; Luo, Y.; Zhang, Y.; et al. A novel R2R3-MYB transcription factor FaMYB5 positively regulates anthocyanin and proanthocyanidin biosynthesis in cultivated strawberries (Fragaria × ananassa). Plant Biotechnol. J. 2023, 21, 1140–1158. [Google Scholar] [CrossRef]
- Martínez-Rivas, F.J.; Blanco-Portales, R.; Serratosa, M.P.; Ric-Varas, P.; Guerrero-Sánchez, V.; Medina-Puche, L.; Moyano, L.; Mercado, J.A.; Alseekh, S.; Caballero, J.L.; et al. FaMYB123 Interacts with FabHLH3 to regulate the late steps of anthocyanin and flavonol biosynthesis during ripening. Plant J. 2023, 114, 683–698. [Google Scholar] [CrossRef]
- Espley, R.V.; Hellens, R.P.; Putterill, J.; Stevenson, D.E.; Kutty-Amma, S.; Allan, A.C. Red colouration in apple fruit is due to the activity of the myb transcription factor, MdMYB10. Plant J. 2007, 49, 414–427. [Google Scholar] [CrossRef]
- Li, C.; Wu, J.; Hu, K.D.; Wei, S.W.; Sun, H.Y.; Hu, L.Y.; Han, Z.; Yao, G.F.; Zhang, H. PyWRKY26 and PybHLH3 cotargeted the PyMYB114 promoter to regulate anthocyanin biosynthesis and transport in red-skinned pears. Hortic. Res. 2020, 7, 37. [Google Scholar] [CrossRef]
- Tao, R.; Yu, W.; Gao, Y.; Ni, J.; Yin, L.; Zhang, X.; Li, H.; Wang, D.; Bai, S.; Teng, Y. Light-induced basic/helix-loop-helix64 enhances anthocyanin biosynthesis and undergoes constitutively photomorphogenic1-mediated degradation in pear. Plant Physiol. 2020, 184, 1684–1701. [Google Scholar] [CrossRef] [PubMed]
- Zhou, L.J.; Wang, Y.; Wang, Y.; Song, A.; Jiang, J.; Chen, S.; Ding, B.; Guan, Z.; Chen, F. Transcription factor CmbHLH16 regulates petal anthocyanin homeostasis under different lights in Chrysanthemum. Plant Physiol. 2022, 190, 1134–1152. [Google Scholar] [CrossRef]
- Liu, Y.; Zhang, X.W.; Liu, X.; Zheng, P.F.; Su, L.; Wang, G.L.; Wang, X.F.; Li, Y.Y.; You, C.X.; An, J.P. Phytochrome interacting factor MdPIF7 modulates anthocyanin biosynthesis and hypocotyl growth in apple. Plant Physiol. 2022, 188, 2342–2363. [Google Scholar] [CrossRef] [PubMed]
- Zhang, Z.; Li, Z.Y.; Zhang, F.J.; Zheng, P.F.; Ma, N.; Li, L.; Li, H.; Sun, P.; Zhang, S.; Wang, X.F.; et al. A viroid-derived small interfering rna targets bHLH transcription factor MdPIF1 to regulate anthocyanin biosynthesis in Malus domestica. Plant Cell Environ. 2024, 47, 4664–4682. [Google Scholar] [CrossRef]
- Liu, H.; Shu, Q.; Lin-Wang, K.; Allan, A.C.; Espley, R.V.; Su, J.; Pei, M.; Wu, J. The PyPIF5-PymiR156a-PySPL9-PyMYB114/MYB10 module regulates light-induced anthocyanin biosynthesis in red pear. Mol. Hortic. 2021, 1, 14. [Google Scholar] [CrossRef] [PubMed]
- Ma, Z.; Wei, C.; Cheng, Y.; Shang, Z.; Guo, X.; Guan, J. RNA-seq analysis identifies transcription factors involved in anthocyanin biosynthesis of ‘red zaosu’ pear peel and functional study of PpPIF8. Int. J. Mol. Sci. 2022, 23, 4798. [Google Scholar] [CrossRef]
- Sun, S.; Wu, P.; Gao, F.; Yu, X.; Liu, Y.; Zheng, C. Genome-wide identification and expression analysis of phytochrome-interacting factor genes during abiotic stress responses and secondary metabolism in the tea plant. Plant Physiol. Biochem. 2024, 215, 108988. [Google Scholar] [CrossRef]
- Zhang, X.; Xiong, L.; Luo, Y.; Wen, B.; Wang, K.; Liu, Z.; Huang, J.A.; Li, J. Identification, molecular characteristic, and expression analysis of PIFs related to chlorophyll metabolism in tea plant (Camellia sinensis). Int. J. Mol. Sci. 2021, 22, 10949. [Google Scholar] [CrossRef]
- Zhang, K.; Zheng, T.; Zhu, X.; Jiu, S.; Liu, Z.; Guan, L.; Jia, H.; Fang, J. Genome-wide identification of PIFs in grapes (Vitis vinifera L.) and their transcriptional analysis under lighting/shading conditions. Genes 2018, 9, 451. [Google Scholar] [CrossRef]
- Nie, N.; Huo, J.; Sun, S.; Zuo, Z.; Chen, Y.; Liu, Q.; He, S.; Gao, S.; Zhang, H.; Zhao, N.; et al. Genome-wide characterization of the PIFs family in sweet potato and functional identification of IbPIF3.1 under drought and Fusarium wilt stresses. Int. J. Mol. Sci. 2023, 24, 4092. [Google Scholar] [CrossRef]
- Liu, H.; Su, J.; Zhu, Y.; Yao, G.; Allan, A.C.; Ampomah-Dwamena, C.; Shu, Q.; Lin-Wang, K.; Zhang, S.; Wu, J. The involvement of PybZIPa in light-induced anthocyanin accumulation via the activation of PyUFGT through binding to tandem G-boxes in its promoter. Hortic. Res. 2019, 6, 134. [Google Scholar] [CrossRef]
- Li, Z.; Liu, W.; Chen, Q.; Zhang, S.; Mei, Z.; Yu, L.; Wang, C.; Mao, Z.; Chen, Z.; Chen, X.; et al. Mdm-miR858 targets MdMYB9 and MdMYBPA1 to participate anthocyanin biosynthesis in red-fleshed apple. Plant J. 2023, 113, 1295–1309. [Google Scholar] [CrossRef]
- Alabd, A.; Ahmad, M.; Zhang, X.; Gao, Y.; Peng, L.; Zhang, L.; Ni, J.; Bai, S.; Teng, Y. Light-responsive transcription factor PpWRKY44 induces anthocyanin accumulation by regulating PpMYB10 expression in pear. Hortic. Res. 2022, 9, uhac199. [Google Scholar] [CrossRef]
- Wang, P.; Abid, M.A.; Qanmber, G.; Askari, M.; Zhou, L.; Song, Y.; Liang, C.; Meng, Z.; Malik, W.; Wei, Y.; et al. Photomorphogenesis in plants: The central role of phytochrome interacting factors (PIFs). Environ. Exp. Bot. 2022, 194, 104704. [Google Scholar] [CrossRef]
- Ni, W.; Xu, S.L.; González-Grandío, E.; Chalkley, R.J.; Huhmer, A.F.R.; Burlingame, A.L.; Wang, Z.Y.; Quail, P.H. PPKs mediate direct signal transfer from phytochrome photoreceptors to transcription factor PIF3. Nat. Commun. 2017, 8, 15236. [Google Scholar] [CrossRef] [PubMed]
- Liu, L.; Jia, M.; Wang, S.; Han, S.; Jiang, J. Identification and characterization of cotton phytochrome-interacting factors in temperature-dependent flowering. J. Exp. Bot. 2023, 74, 3765–3780. [Google Scholar] [CrossRef] [PubMed]
- Zhao, J.; Bo, K.; Pan, Y.; Li, Y.; Yu, D.; Li, C.; Chang, J.; Wu, S.; Wang, Z.; Zhang, X.; et al. Phytochrome-interacting factor PIF3 integrates phytochrome B and UV-B signaling pathways to regulate gibberellin- and auxin-dependent growth in cucumber hypocotyls. J. Exp. Bot. 2023, 74, 4520–4539. [Google Scholar] [CrossRef]
- Li, Q.; Zhou, L.; Chen, Y.; Xiao, N.; Zhang, D.; Zhang, M.; Wang, W.; Zhang, C.; Zhang, A.; Li, H.; et al. Phytochrome interacting factor regulates stomatal aperture by coordinating red light and abscisic acid. Plant Cell 2022, 34, 4293–4312. [Google Scholar] [CrossRef]
- Wang, L.; Wu, X.; Xing, Q.; Zhao, Y.; Yu, B.; Ma, Y.; Wang, F.; Qi, H. PIF8-WRKY42-mediated salicylic acid synthesis modulates red light induced powdery mildew resistance in oriental melon. Plant Cell Environ. 2023, 46, 1726–1742. [Google Scholar] [CrossRef]
- Lin, L.; Liu, X.; Yin, R. PIF3 integrates light and low temperature signaling. Trends Plant Sci. 2018, 23, 93–95. [Google Scholar] [CrossRef]
- Ni, M.; Tepperman, J.M.; Quail, P.H. PIF3, a phytochrome-interacting factor necessary for normal photoinduced signal transduction, is a novel basic helix-loop-helix protein. Cell 1998, 95, 657–667. [Google Scholar] [CrossRef] [PubMed]
- Oh, J.; Park, E.; Song, K.; Bae, G.; Choi, G. Phytochrome interacting factor 8 inhibits phytochrome A-mediated far-red light responses in Arabidopsis. Plant Cell 2020, 32, 186–205. [Google Scholar] [CrossRef] [PubMed]
- Bogs, J.; Jaffé, F.W.; Takos, A.M.; Walker, A.R.; Robinson, S.P. The grapevine transcription factor VvMYBPA1 regulates proanthocyanidin synthesis during fruit development. Plant Physiol. 2007, 143, 1347–1361. [Google Scholar] [CrossRef]
- Feng, S.; Sun, S.; Chen, X.; Wu, S.; Wang, D.; Chen, X. PyMYB10 and PyMYB10.1 interact with bHLH to enhance anthocyanin accumulation in pears. PLoS ONE 2015, 10, e0142112. [Google Scholar] [CrossRef] [PubMed]
Disclaimer/Publisher’s Note: The statements, opinions and data contained in all publications are solely those of the individual author(s) and contributor(s) and not of MDPI and/or the editor(s). MDPI and/or the editor(s) disclaim responsibility for any injury to people or property resulting from any ideas, methods, instructions or products referred to in the content. |
© 2025 by the authors. Licensee MDPI, Basel, Switzerland. This article is an open access article distributed under the terms and conditions of the Creative Commons Attribution (CC BY) license (https://creativecommons.org/licenses/by/4.0/).