Abstract
Soybean production in the southern Great Plains (SGP) faces challenges due to yield-limiting factors, including high temperatures and inconsistent precipitation. These conditions can lead to excess vegetative growth, similar to what occurs in crops like cotton. Management strategies utilizing plant growth regulators (PGRs) have been applied to control this excessive growth, yet there is limited information on methods to mitigate vegetative growth in soybeans through modifications to the apical meristem. Field trials conducted in 2022 and 2023 investigated the effects of altering the apical growth using Ascend SL, Compact, Cobra, Cygin Pro, and physical removal, with treatments applied at the V4 and R2 growth stages. This study highlights the significance of customized application strategies to enhance profitability under diverse environmental conditions. Ascend and Cygin Pro demonstrate improving yield stability under adverse climatic conditions. Both applications of Compact produced relatively stable yields across site years, while Cobra and physical removal methods necessitate careful consideration of timing to minimize yield losses. Further research is essential to optimize these management strategies for soybean production in the SGP.
1. Introduction
Growing soybean can be a challenge in Oklahoma due to the yield-limiting environment in the region. Oklahoma is in the SGP region, which has noted suboptimal conditions of limited consistent precipitation and periods of excessive heat. This can limit the ability of soybean in Oklahoma to achieve the yield potential of other states that have a more suitable climate for soybean production. This region typically receives moderate rainfall during less critical periods of early spring and begins to experience either more inconsistent or limited rainfall during critical growth stages later in the summer. This can lead to the soybean plant producing excessive biomass that has to be sustained later in the summer when resources become limited.
Soybean can tolerate moisture stress relatively well during the vegetative stages of growth due to their limited daily moisture demand. If stress does occur, aboveground biomass will be reduced, but root growth will continue. Higher temperatures, such as those exceeding 32 degrees Celsius, decrease nodulation and N fixation [1]. Soybean are most sensitive to stressors during the reproductive growth stages. Moisture stress during flowering can lead to a 20–80% abortion of flowers [2]. Lower seed weights and yields can result from moisture stress during reproductive stages [3]. Limiting aboveground biomass while enhancing root growth in soybean plants during vegetative stages could improve the plants’ root-to-shoot ratio and create better drought tolerance during periods of abiotic stress [4]. Improving the plant’s water use efficiency could also help mitigate abiotic stress on soybean during droughts [5].
Plant growth regulators (PGRs) are defined as synthetic compounds that influence the developmental and metabolic processes in plants. These regulators affect the balance of naturally occurring hormones in the treated plants [6]. Several PGR products exist that have variable impacts on normal plant functions summarized in VanDerZanden [7]. Five major groups have received much of the attention of researchers, including auxins, gibberellins, cytokinins, abscisic acid (ABA), and ethylene; however, others have potential benefits to indeterminate crops. Kinetin, gibberellic acid (GA), indole-3-butyric acid, homobrassinolide, mepiquat chloride, and lactofen are utilized in this study, as well as the removal of the apical meristem to evaluate the impact of these treatments on the growth and development of soybean throughout the growing seasons and yield components. Kinetin, a synthetic cytokinin, acts as a PGR by encouraging cell division, stimulating lateral bud growth, and delaying senescence. Gibberellins stimulate cell division and elongation, break seed dormancy, and accelerate germination. Indole-3-butyric acid (IBA), a natural plant hormone belonging to the auxin family, has several impacts on plant growth. These effects include downward root growth, promotion of apical dominance, flower formation, fruit set and growth, and the formation of adventitious roots. Homobrassinolide, a synthetic PGR belonging to the brassinolide class, promotes stem elongation and increases the rate of photosynthesis and synthesis of amino acids and proteins [8]. Mepiquat chloride functions by inhibiting GA activity, leading to decreased cell elongation and expansion. Lactofen, while not a PGR has similar effects of physical removal of the apical meristem due to the level of damage that is thought to kill or damage the apical meristem [9].
Several studies have investigated the impact of PGRs on soybeans and are summarized well in [10]. Kinetin (cytokinin) applied at V4, V6, or both significantly increased yield over the control in a study in Brazil [11]. Other cytokines, such as 6-benzylaminopurine (BAP), have shown a strong correlation to flower set and retention, thus limiting yield [12]. A study in Poland shows a higher yield of soybean with foliar-applied IBA and IBA + BAP than the control treatments [13]. In Iowa, Enersol (humic, fulvic, and ulmic acid) and Radiate (IBA and cytokinin) were foliar applied to soybean at the V3–V4 growth stages. However, the study concluded that neither of the PGR products significantly affected soybean yield [14]. Prochaska and Hartschuh [15] discovered that applying Ascend (cytokinin, GA, IBA) had a significant impact on soybean yield compared to the control. Brassinolides (BRs) have been shown to improve the drought tolerance of soybean, which can mitigate yield losses from water stress [16]. Applications of mepiquat chloride inhibit plant growth by inhibiting the synthesis of several plant hormones that promote cell elongation and expansion, but can improve the drought tolerance in soybean [17]. Although not a PGR, lactofen has varied results based on environmental conditions. Yield differences are more likely to be detected with earlier applications of lactofen, were no different than the physical removal treatment, and were significantly higher than other treatments [9]. Removal of the apical meristem should alter the normal hormone balance, increase cytokinin concentration, and a reduction in auxin concentration, which is able to promote lateral bud development [18].
These studies demonstrate that PGRs do have effects on soybean; however, little research has been conducted on the impacts of PGR treatments on soybean in the SGP region. Earlier studies were performed in Iowa and Ohio, both of which experience higher amounts of annual rainfall and typically have a deeper soil profile than the SGP region [14,15]. More research is needed to assess the effects of PGRs on soybean in a yield-limited environment like the SGP region.
2. Materials and Methods
2.1. Data
Field trials were conducted during the 2022 and 2023 growing seasons to test the impact of four PGR products on soybean. Two additional treatments were added and used to compare the application of the chemical PGRs. One was a non-treated check plot where only water was applied at the time of application. The other was a treatment where the apical meristem was physically removed. Field trials were conducted in a randomized complete block design, which contained four repetitions of each treatment. Plot sizes were 1.5 m (two rows) by 6.1 m. There are twelve observations for each treatment in the year 2022 and eight observations for each treatment in the year 2023. Treatments were applied at either the V4, when the plant has four fully extended trifoliates, or R2, when the presence of an open flower is at one of the two uppermost nodes of the main stem, stages of growth. The trial consisted of ten treatment variables: four PGR products and physical removal of the apical meristem at the V4 and R2 stages of growth, with one control variable to compare the treatments against. The four PGR products examined in this study were Ascend SL (Winfield United, Arden Hills, MN, USA), Cygin Pro (CHS Inc., Inver Grove Heights, MN, USA) Compact (Winfield United, Arden Hills, MN, USA), and Cobra (Valent USA, LLC., San Ramon, CA, USA). Chemical active ingredients and application rates of the four PGR products are summarized in Table 1.

Table 1.
List of plant growth regulator (PGR) products applied in the study and their associated manufacturer, active ingredients, concentrations (ai L−1), and application rates (mL ha−1).
2.2. Site Descriptions
Trials were conducted at two locations across the state of Oklahoma in 2022 and 2023. The first location was in the central portion of the state at the Cimmaron Valley Research Station in Perkins, OK (35°98′58.89″ N, 97°04′60.92″ W). The soil series at the location was the Teller series, which is a fine sandy loam with a slope of 0–1%. The location receives 911.86 mm of rainfall on average annually. The second location was in the eastern portion of the state at the Mingo Valley Research Station in Bixby, OK (35°57′49″ N 95°51′44″ W). The soil series at the location was the Wynona series, which is a silty clay loam with a slope of 0–1%. The location receives 1093.7 mm of rainfall on average annually. Climate data was collected for each of the three sites from the Oklahoma Mesonet. The Mesonet is a statewide weather station system established and maintained by Oklahoma State University (www.mesonet.org; Accessed: 5 March 2025). Monthly average rainfall and temperature data for 2022 and 2023 are shown in Table 2 and Table 3. Soil type data were collected from the USDA NRCS Web Soil Survey for each site (https://websoilsurvey.nrcs.usda.gov/app/; Accessed: 5 March 2025).
Table 2.
Average monthly summary of rainfall received (mm) for the Bixby and Perkins locations in 2022 and 2023 for the growing season (May–October).
Table 3.
Average monthly summary of temperature (°C) for the Bixby and Perkins locations in 2022 and 2023 for the growing season (May–October).
2.3. Methodology
In 2022 and 2023, a Monosem (Monosem Inc., Edwardsville, KS, USA) 4-row planter was used to plant soybean on 76 cm row spacing at the Perkins and Bixby locations. All plots were planted at a depth of 1.27–1.91 cm. LG 4808XF soybean cultivar was used at Perkins and Bixby locations in 2022 but was changed to Armor 51-F29 in 2023 due to seed availability. Plots in Perkins were planted on 9 May 2022 and 2 May 2023. Plots in Bixby were planted on 18 May 2022 and 31 May 2023.
Irrigation was applied three times in 2022 at Perkins at a rate of 44.5 mm per application and five times in Bixby at a rate of 25.4 mm per application. In 2023, irrigation was applied one time in Perkins at a rate of 44.5 mm per application. Irrigation applications in Perkins were made using an OCMIS Irrigation Gun with a 200 m retractable line (Knutson Irrigation, El Reno, OK, USA). Irrigation applications in Bixby were made using a Valley lateral move irrigation tower. Irrigation was not a part of this study; however, due to drought conditions in both years, irrigation was necessary to keep the trials alive.
Ascend SL, Cygin Pro, Compact, and Cobra were foliar applied using a CO2 backpack sprayer with a spray pressure of 103.4 kPa, broadcast rate of 140 L of water per hectare, and application speed of 4.8 km per hour. Boom length was 1.67 m with nozzles (Teejet XR 11002; Teejet, Wheaton, IL, USA) spaced 50.8 cm apart. Physical removal of the apical meristem was performed by snapping off the apical meristem by hand.
Plots were harvested with a Wintersteiger Delta plot combine (Wintersteiger, Reid, Austria). Perkins was harvested on 4 October 2022 and 29 September 2023. Bixby was harvested on 13 October 2022 and 21 October 2023. Seed weight, moisture, and test weight were measured with an onboard Harvest Master weigh system (Juniper Systems, Logan, Utah). Yield was adjusted to 13.3% moisture.
Weekly in-season measurements were collected for six weeks beginning at V4. 0.61 m of row was marked with flags in each plot to maintain accuracy by ensuring that measurements were being taken from the same location within the plot each week. Plant height, branch number, and node count measurements were collected for each plot. Plant height was measured in cm by measuring from the soil surface to the top of the apical meristem. End-of-season measurements were collected by sampling three plants from each plot. These samples were used to evaluate soybean yield characteristics, including number of nodes, pods per node, and seeds per pod. Yield was determined by mechanically harvesting the two rows in each plot. Plot weights were then used to estimate grain yield on a per-hectare basis.
This manuscript was prepared with the assistance of Grammarly 9.0 (Grammarly, Inc., San Francisco, CA, USA). The software was used to help edit the writing to enhance flow and clarity. After using it, the authors verified that specific information was correct and revised anything that could alter or manipulate the details of the paper. The program was not involved in creating any of the writing; that was performed solely by the authors.
2.4. Statistical Analysis
Yield, height, and number of branches were analyzed using SAS software version 9.4 [19]. All sites and years were analyzed separately to represent better results for each area of Oklahoma where the trials were placed. An analysis of variance (ANOVA) was conducted using PROC MIXED. Mean separation was conducted using Dunnett’s analysis, comparing all treatments back to the check. Therefore, no analysis was performed comparing the individual treatments to each other. An α = 0.05 was used for all analyses.
3. Results
3.1. Bixby
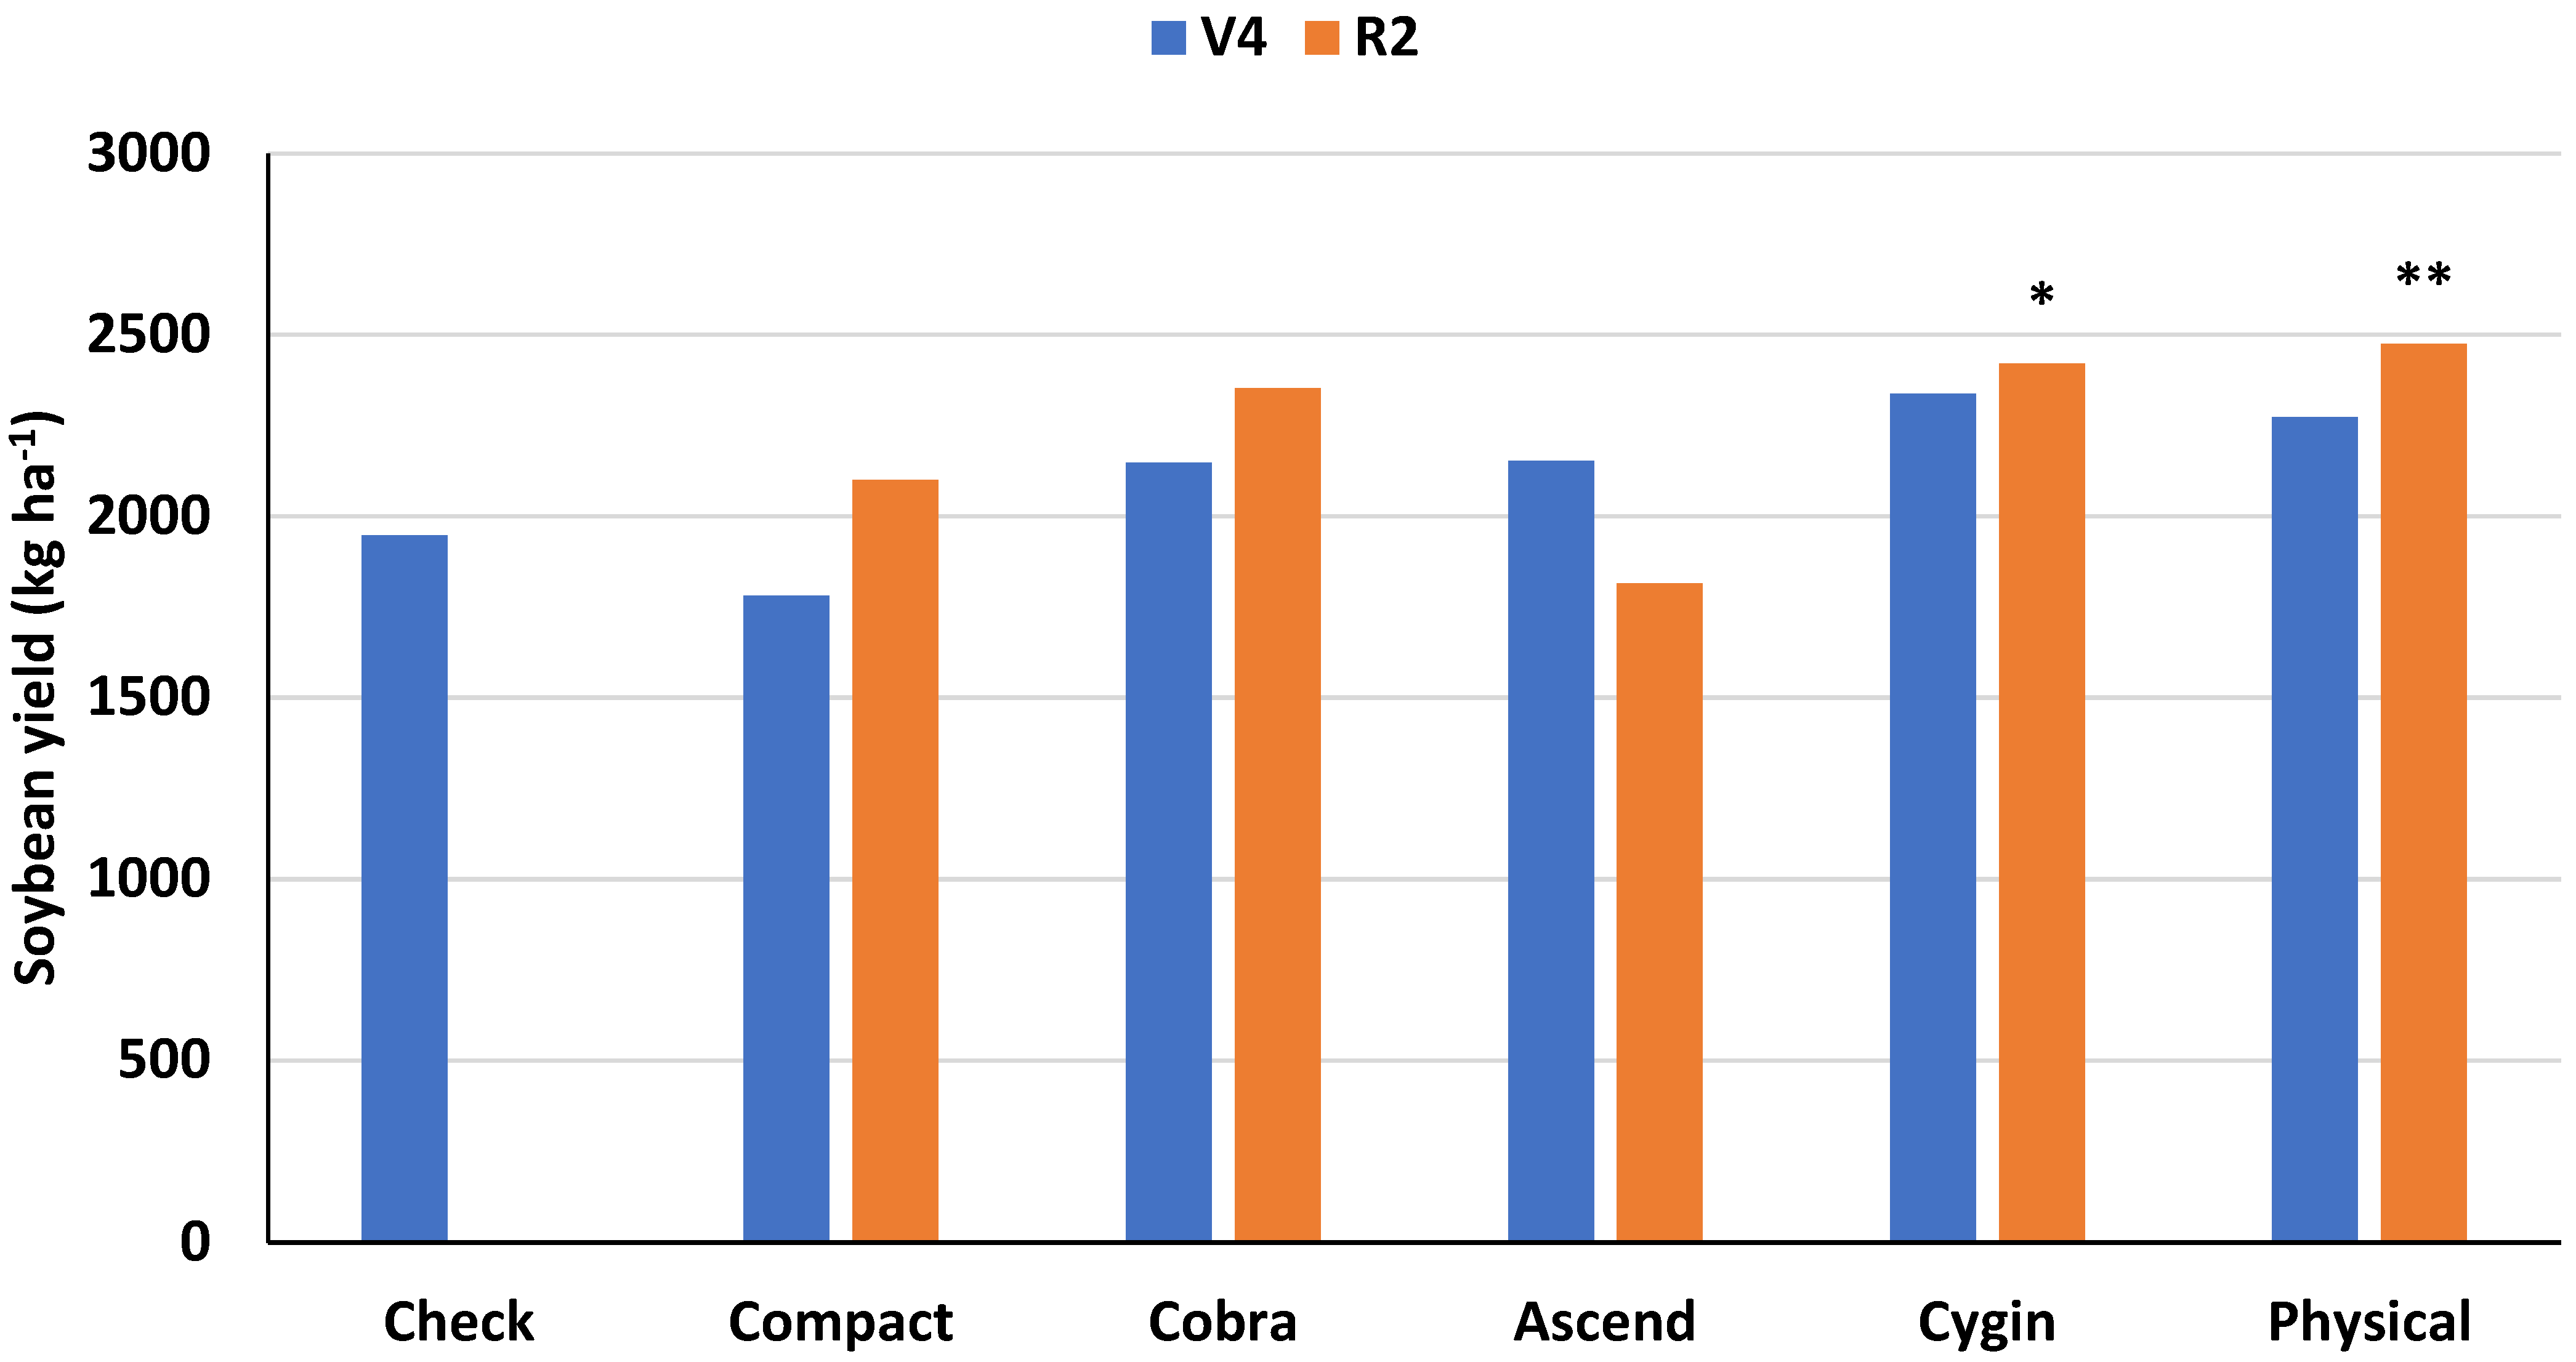
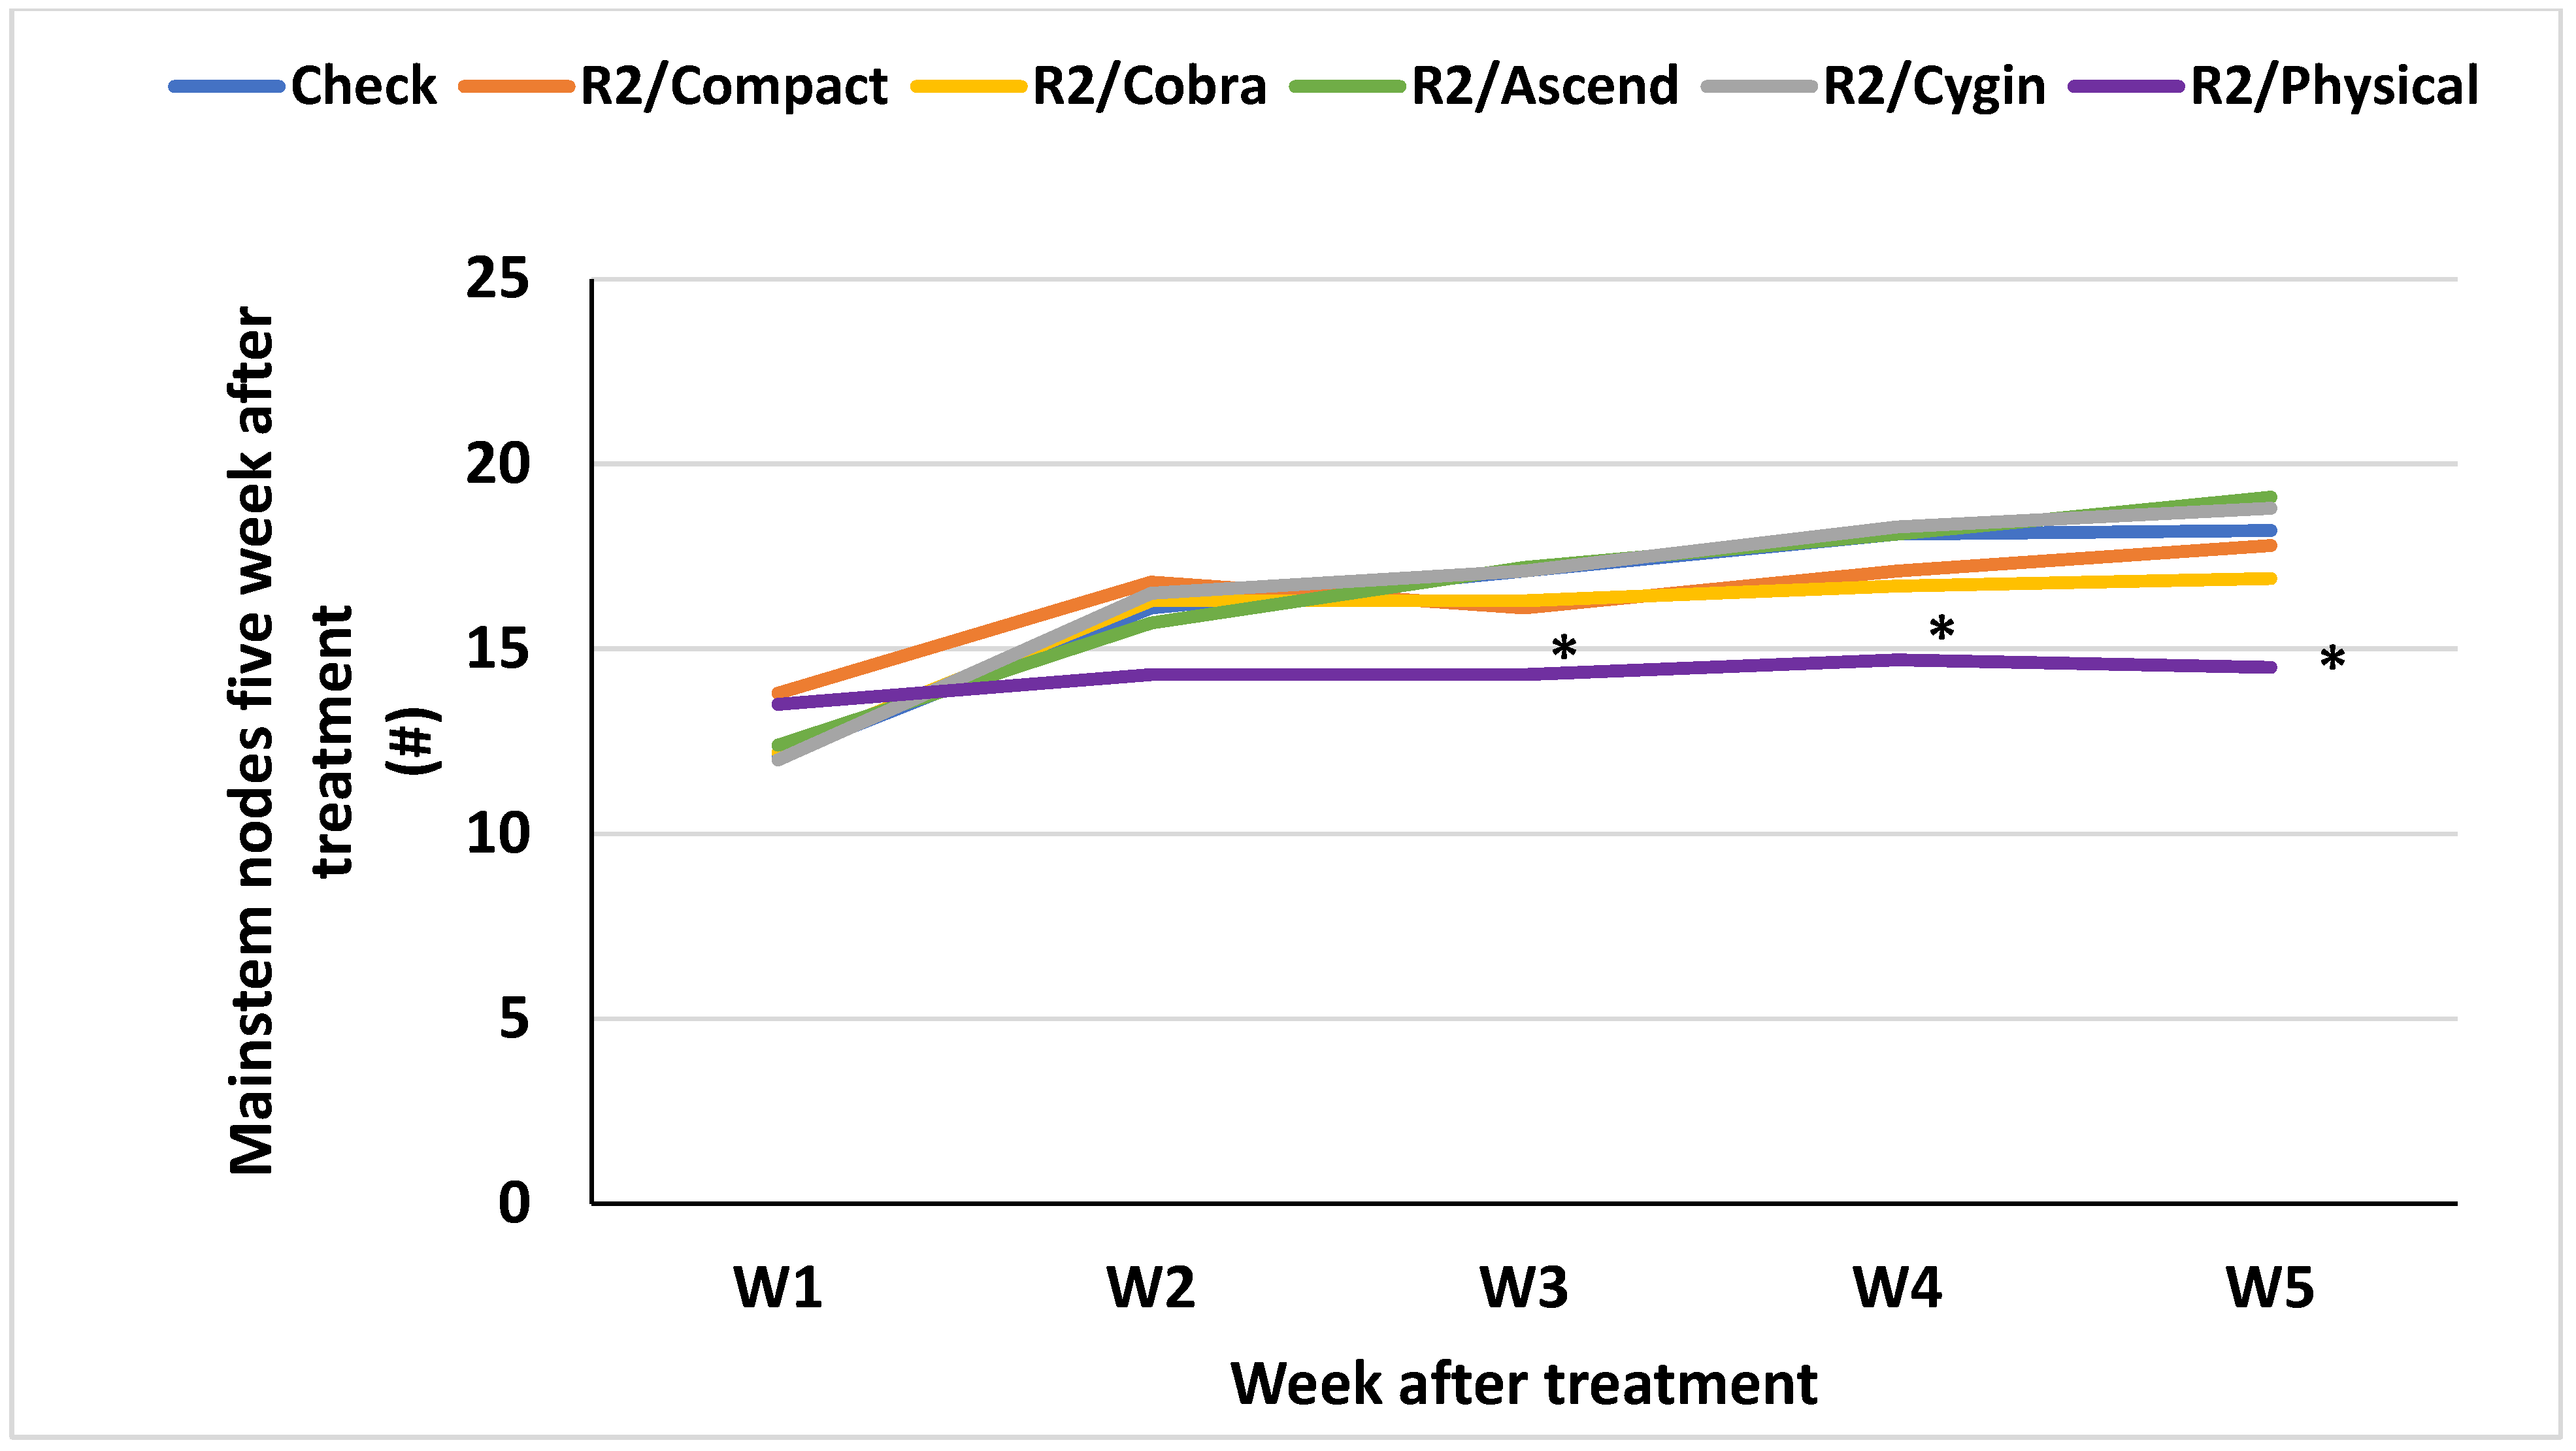
In 2022, only Cygin and the physical removal at R2 significantly influenced yields over the check treatment at the Bixby location (Figure 1). In both cases, yields were increased by 473 and 528 kg ha−1 for the Cygin and physical removal treatments, respectively. Most other treatments increased yields numerically but not to a significant level. Only Ascend applied at R2 and Compact at V4 decreased yields; however, this was not significant. A similar trend for both height and total mainstem nodes was found, with no significance between most treatments (Figure 2, Figure 3, Figure 4 and Figure 5). The only exception to this was with the physical removal at either the V4 or R2 stages. For both treatments, both height and total mainstem nodes did not significantly differ from the check treatment until three weeks (W3) after application. From that point until the end of the sampling period (W5), the physical removal was significantly lower than the non-treated check. Canopy development was not significantly impacted across treatments, including those that significantly increased yields.
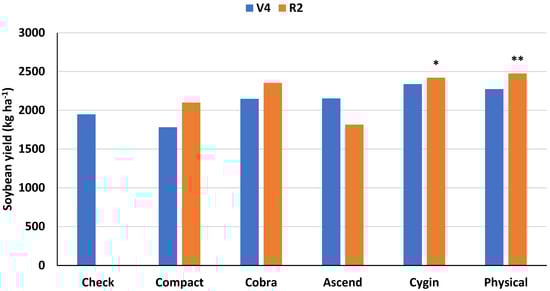
Figure 1.
Soybean yields (kg ha−1) by treatment timing for Bixby in 2022. Significance is denoted using * for α = 0.05 and ** for α = 0.01.
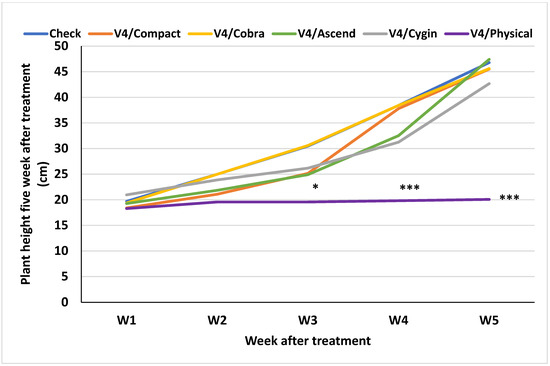
Figure 2.
Plant height measurements (cm) for each treatment at the V4 application timing one to five weeks after treatment application in Bixby during the 2022 growing season. Significance is denoted using * for α = 0.05 and *** for α < 0.01, respectively.
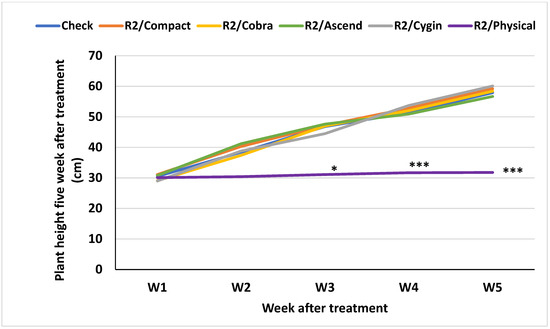
Figure 3.
Plant height measurements (cm) for each treatment at the R2 application timing one to five weeks after treatment application in Bixby during the 2022 growing season. Significance is denoted using * for α = 0.05 and *** for α < 0.01.
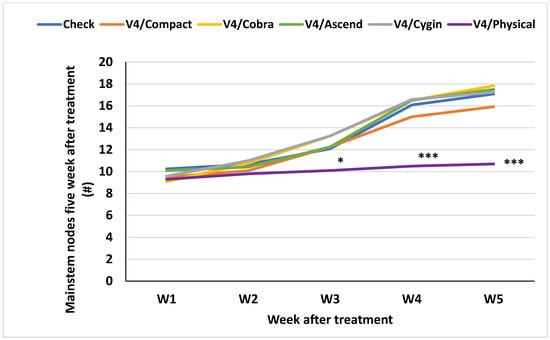
Figure 4.
Number of mainstem nodes for each treatment at the V4 application timing one to five weeks after treatment application in Bixby during the 2022 growing season. Significance is denoted using * for α = 0.05 and *** for α < 0.01. The # used indicates actual numbers counted.

Figure 5.
Number of mainstem nodes for each treatment at the R2 application timing one to five weeks after treatment application in Bixby during the 2022 growing season. Significance is denoted using * for α = 0.05. The # used indicates actual numbers counted.
At Bixby in 2023, the application of PGR did not significantly impact soybean yields for any treatment (Figure 6). Unlike the previous year, all treatments increased yields comparatively but did not reach significant levels. A similar trend was noted for the in-season measurements as well, with few significant differences for plant height or total nodes (Figure 7, Figure 8, Figure 9 and Figure 10). Previously seen in 2022, the exception to this trend was the total mainstem nodes and height for the physical removal at both V4 and R2. Similar to 2022, physical removal at V4 significantly reduced height and total nodes at three weeks (W3) after the implementation of treatments (Figure 7 and Figure 9). However, this difference was not seen until four weeks (W4) after the application of treatment applied at R2 in 2023 (Figure 8 and Figure 10).
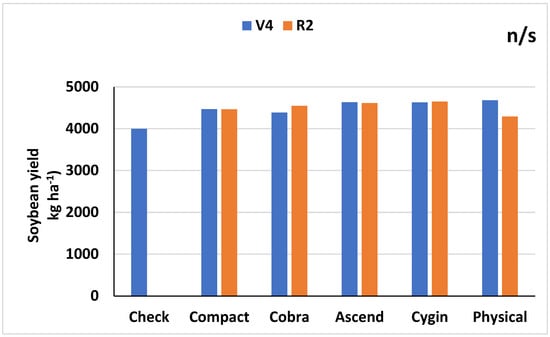
Figure 6.
Soybean yields (kg ha−1) by treatment timing for Bixby in 2023.
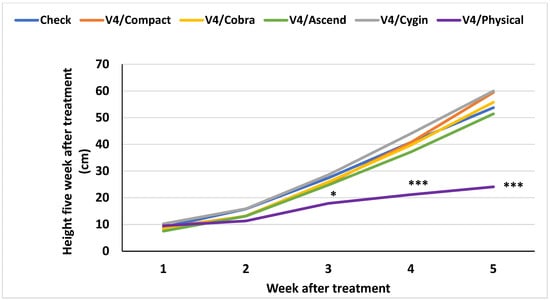
Figure 7.
Plant height measurements (cm) for each treatment at the V4 application timing one to five weeks after treatment application in Bixby during the 2023 growing season. Significance is denoted using * for α = 0.05, and *** for α < 0.01.
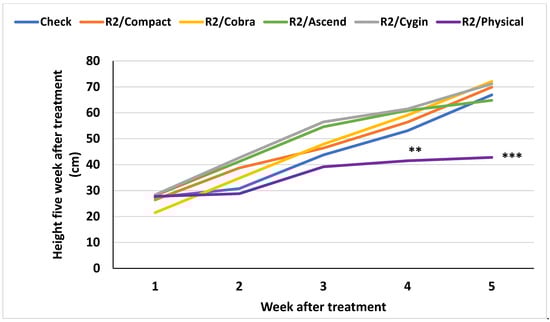
Figure 8.
Plant height measurements (cm) for each treatment at the R2 application timing one to five weeks after treatment application in Bixby during the 2023 growing season. Significance is denoted using ** for α = 0.01 and *** for α < 0.01.
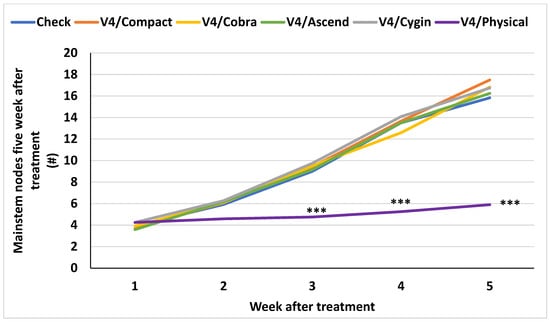
Figure 9.
Number of mainstem nodes for each treatment at the V4 application timing one to five weeks after treatment application in Bixby during the 2023 growing season. Significance is denoted using *** for α < 0.01. The # used indicates actual numbers counted.
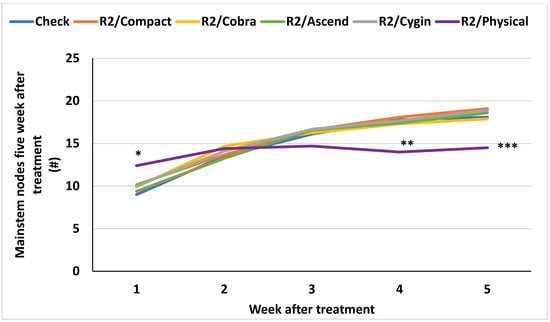
Figure 10.
Number of mainstem nodes for each treatment at the R2 application timing one to five weeks after treatment application in Bixby during the 2023 growing season. Significance is denoted using * for α = 0.05, ** for α = 0.01, and *** for α < 0.01. The # used indicates actual numbers counted.
3.2. Perkins
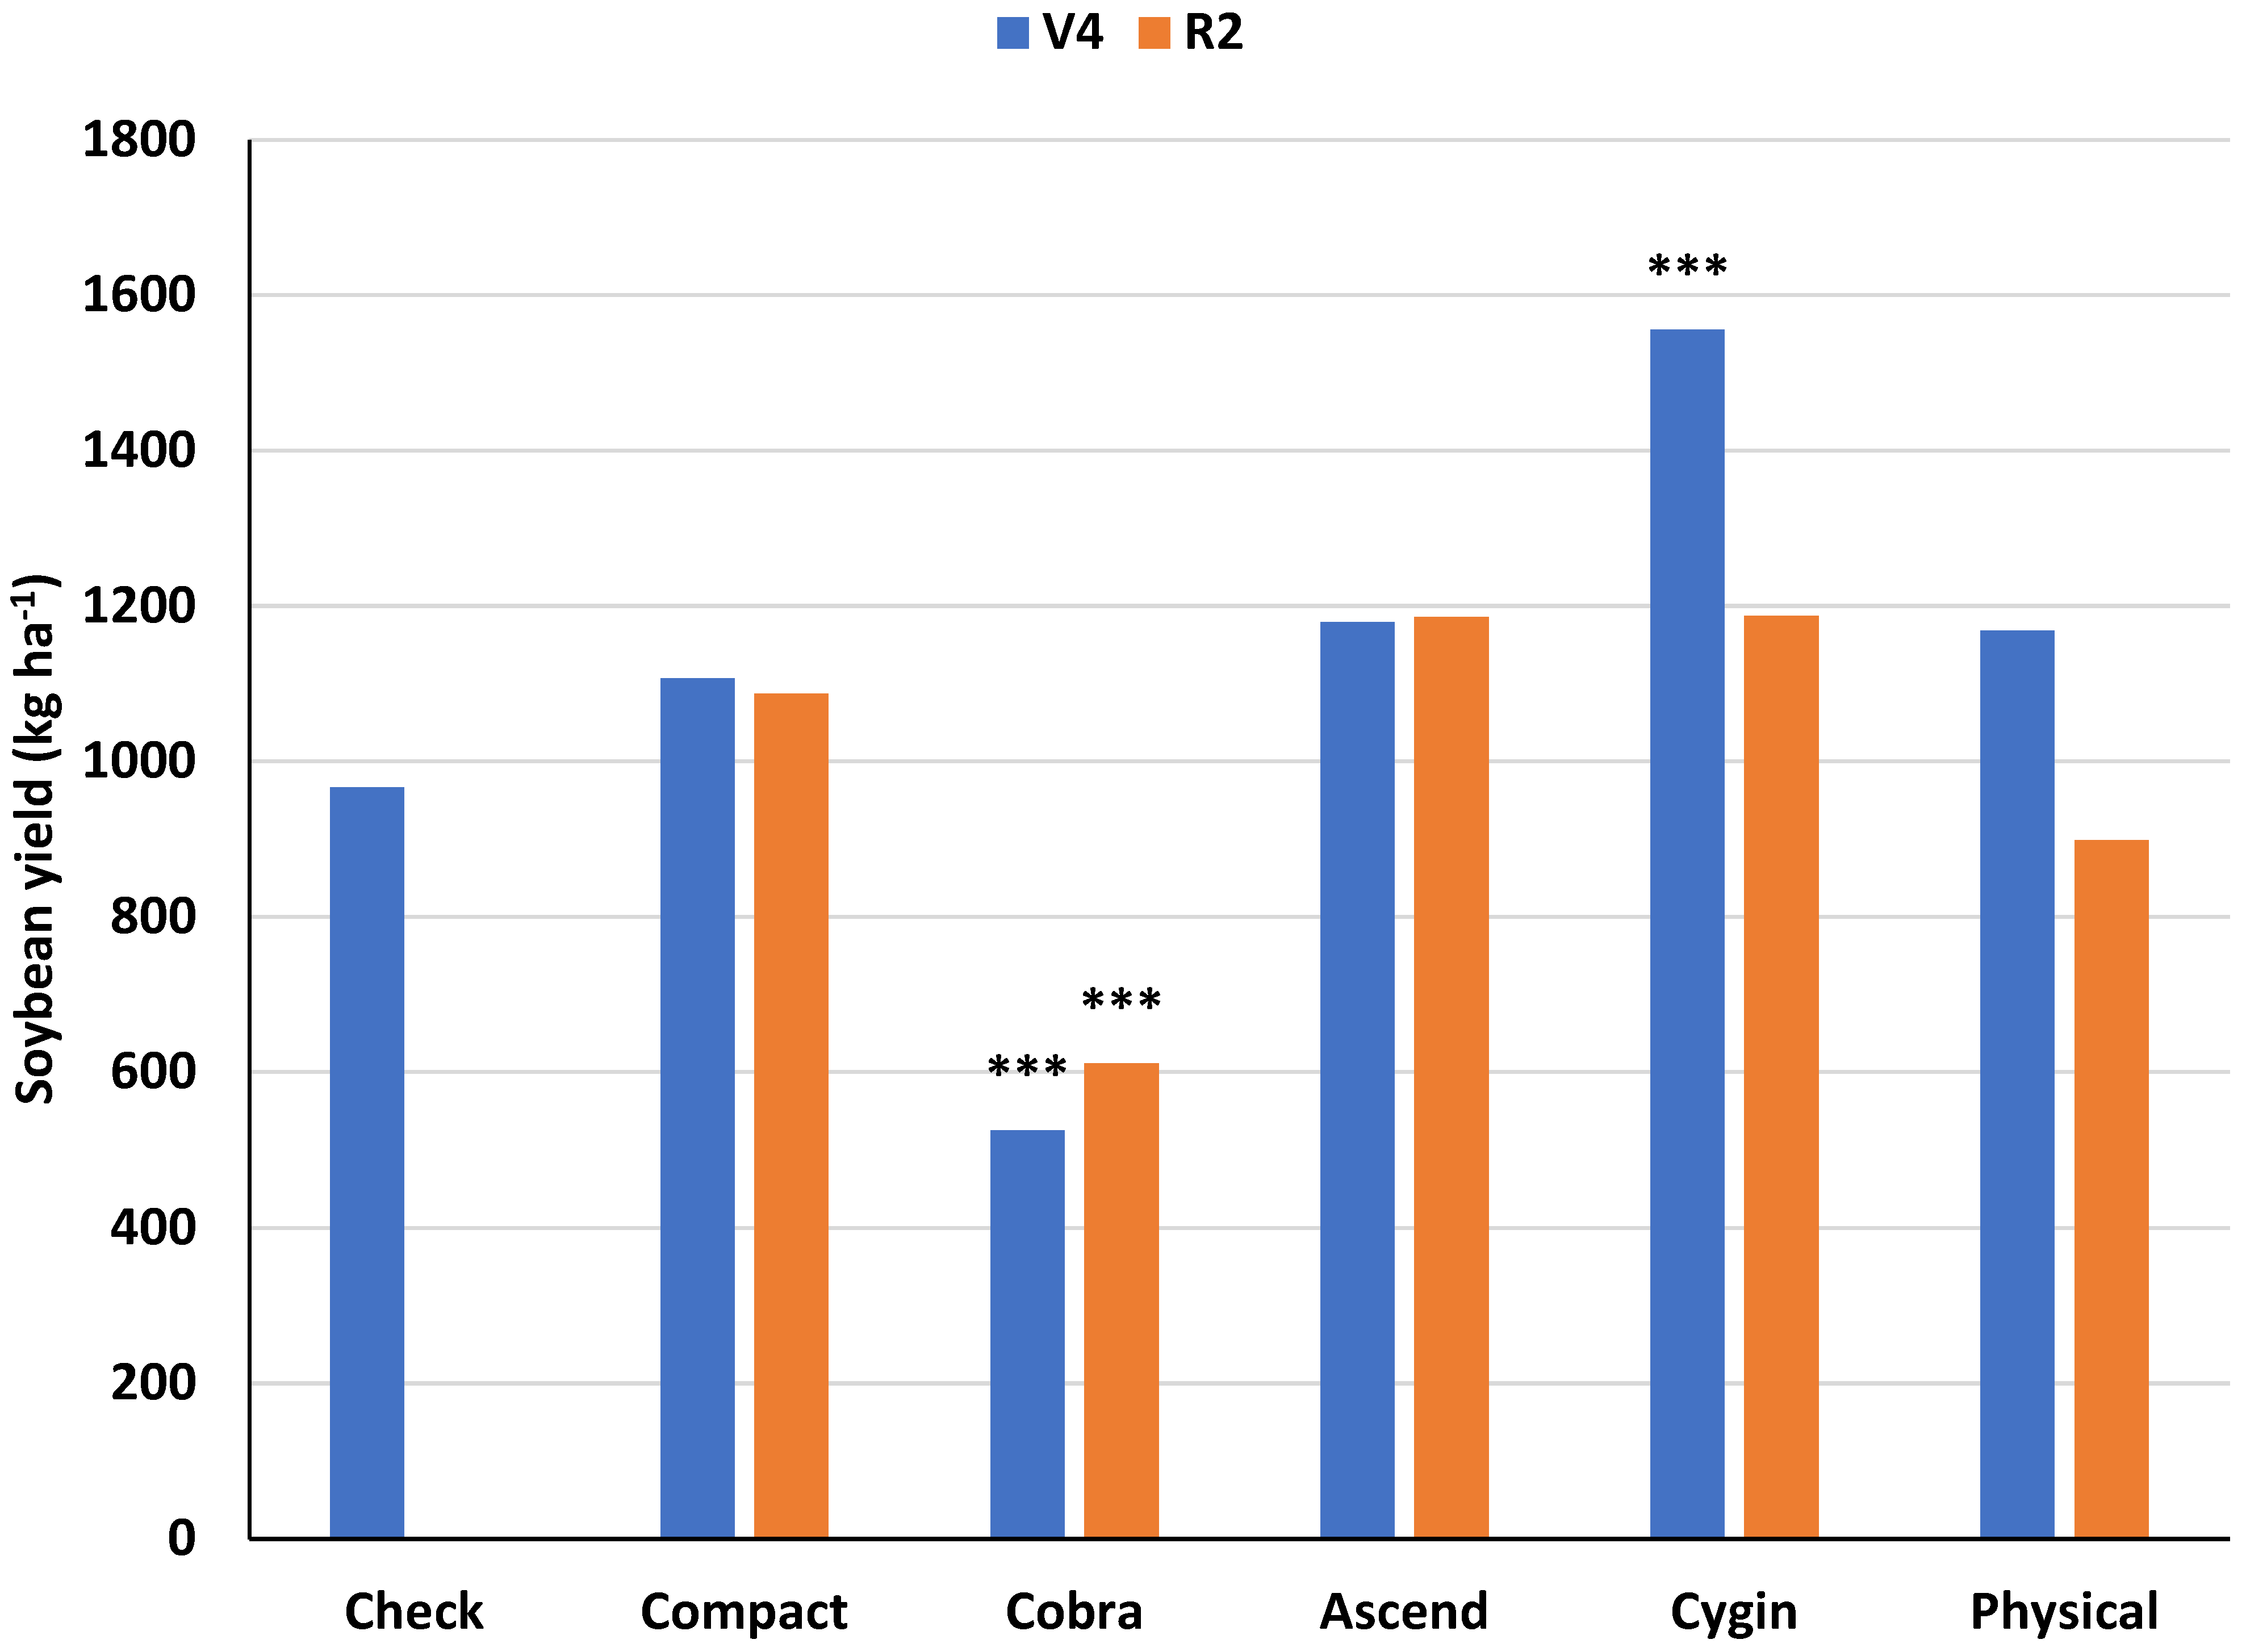
In 2022, three significant impacts were observed at Perkins. Similar to the Bixby location that year, Cygin applied at the V4 stage notably increased yields (p < 0.001) by 588 kg ha−1 (Figure 11). However, a significant difference was that the yields in the Cobra applied treatment decreased when applied at either the V4 or R2 stages compared to the non-treated control. In-season phenotypical measurements highlighted some of these yield differences. As seen in other locations and years, physical removal at the V4 stage significantly reduced height and node counts from three weeks (W3) after application through the five-week period (Figure 12 and Figure 13). Additionally, the application of Cygin significantly increased canopy development at W4 compared to the control (Figure 14). Interestingly, all treatments exhibited a slight decline in canopy development this week except for the Cygin treatment. There was no significant impact of the treatments on height, nodes, branches, or canopy coverage for the R2 applications.
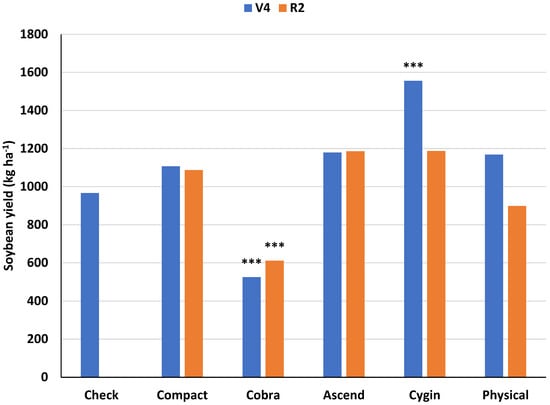
Figure 11.
Soybean yields (kg ha−1) by treatment timing for Perkins in 2022. Significance is denoted using *** α < 0.01.
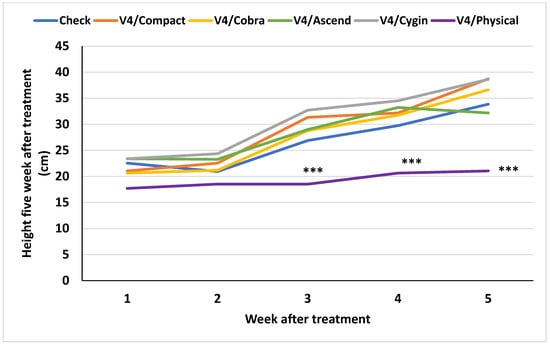
Figure 12.
Plant height measurements (cm) for each treatment at the R2 application timing one to five weeks after treatment application in Perkins during the 2022 growing season. Significance is denoted using *** for α < 0.01.
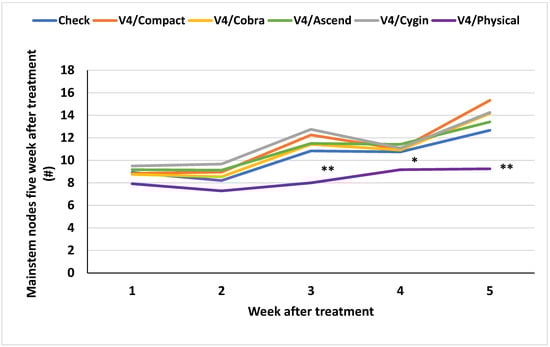
Figure 13.
Number of mainstem nodes for each treatment at the V4 application timing one to five weeks after treatment application in Perkins during the 2022 growing season. Significance is denoted using * for α = 0.05 and ** for α = 0.01. The # used indicates actual numbers counted.
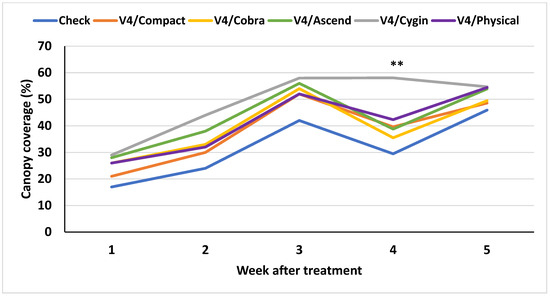
Figure 14.
Percent green canopy cover (%) collected using Canopeo mobile application at the V4 application timing one to five weeks after treatment application in Perkins during the 2022 growing season. Significance is denoted using ** for α = 0.01.
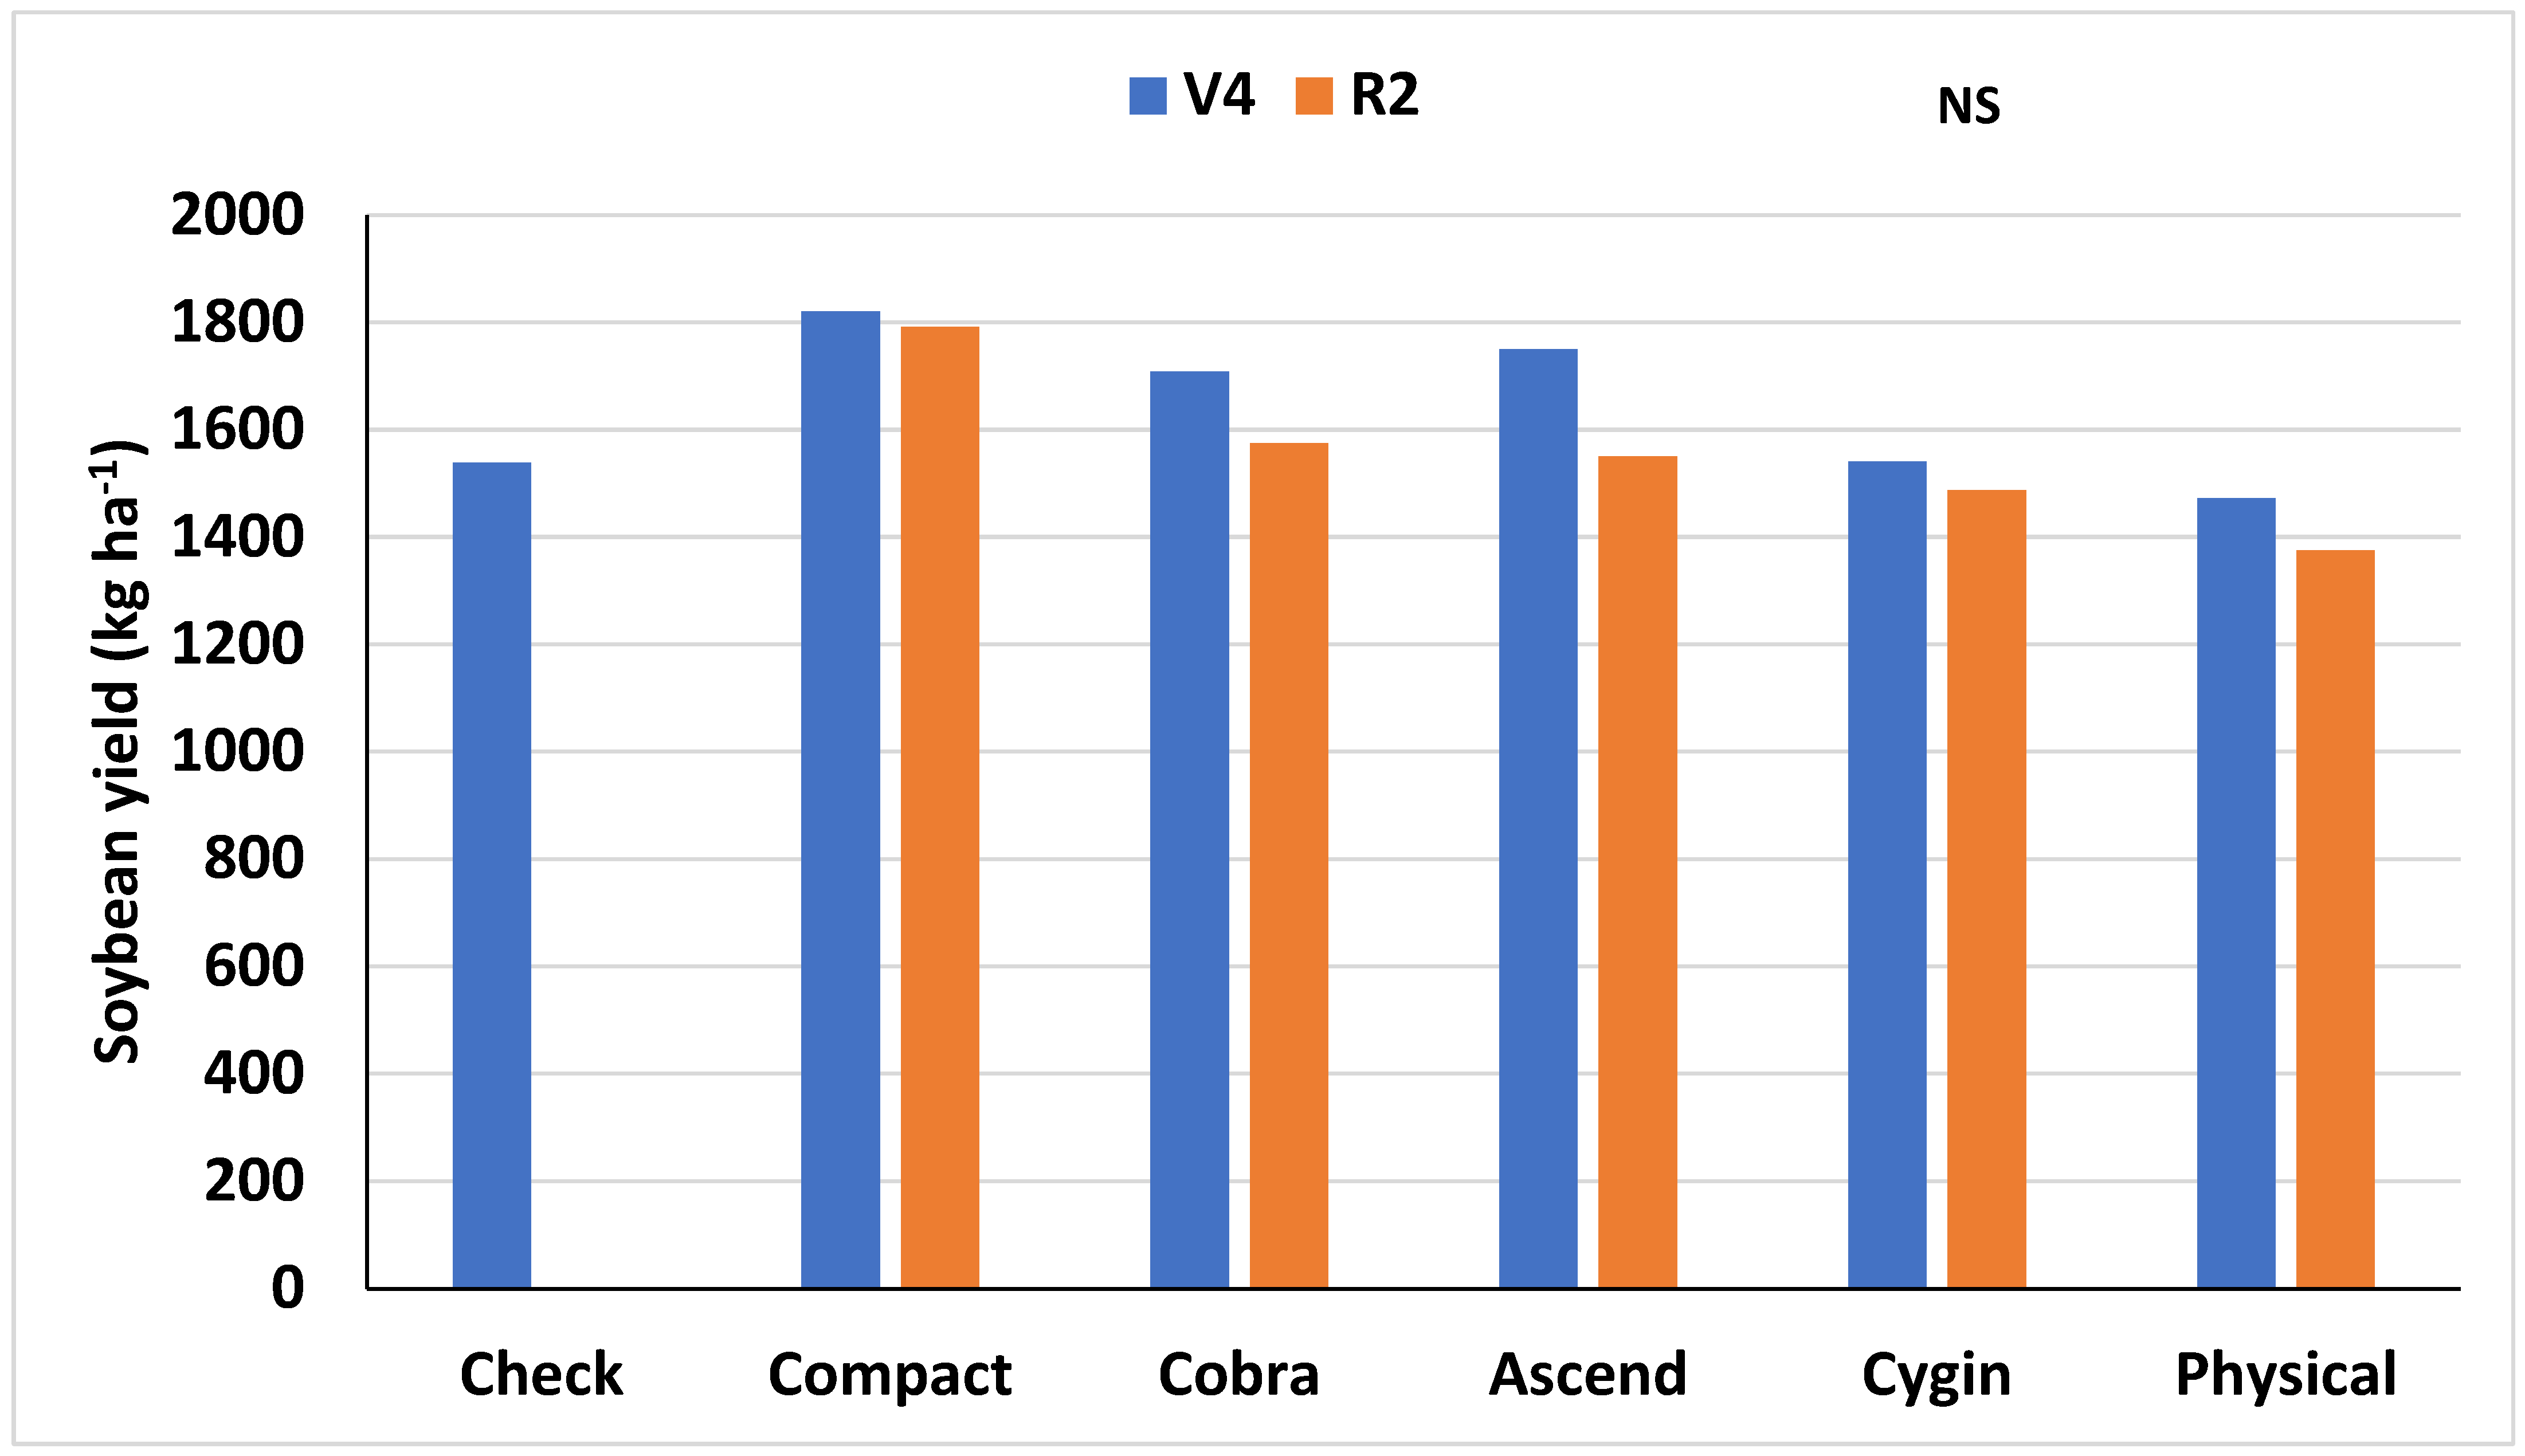
In 2023, no significant yield differences were noted between any associated treatments (Figure 15). However, some of the in-season measurement trends remained, namely the significant decrease in height and total node number of the physical removal at V4 (Figure 16, Figure 17, Figure 18 and Figure 19). This suggests that this shift in overall growth does not consistently impact yield for soybean in the SGP region.
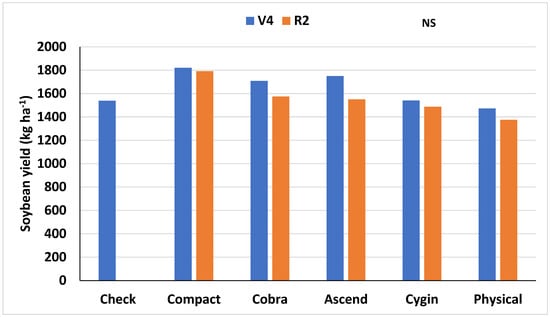
Figure 15.
Soybean yields (kg ha−1) by treatment timing for Perkins in 2023.
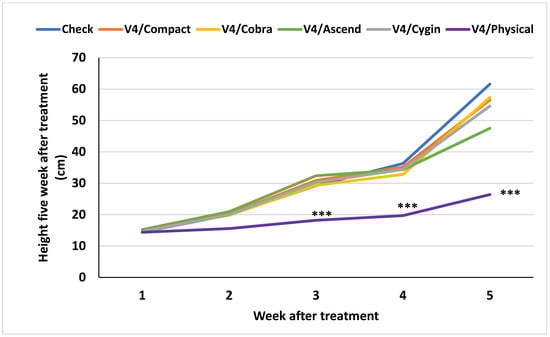
Figure 16.
Plant height measurements (cm) for each treatment at the V4 application timing one to five weeks after treatment application in Perkins during the 2023 growing season. Significance is denoted using *** for α < 0.01.
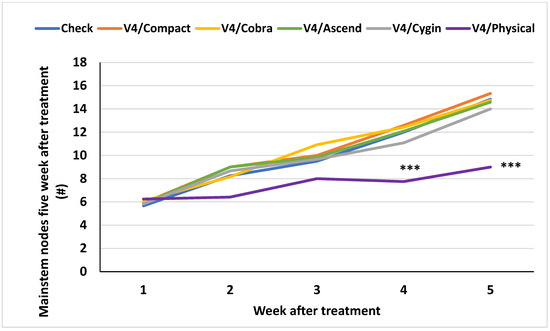
Figure 17.
Number of mainstem nodes for each treatment at the V4 application timing one to five weeks after treatment application in Perkins during the 2023 growing season. Significance is denoted using *** for α < 0.01. The # used indicates actual numbers counted.
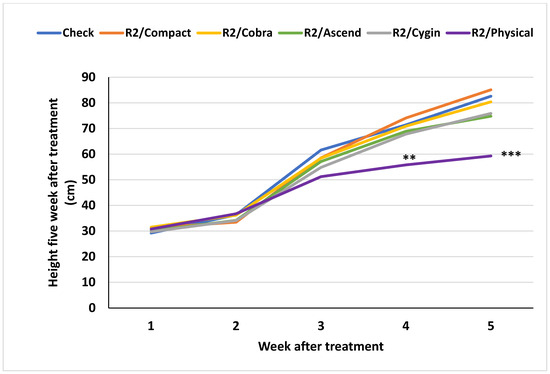
Figure 18.
Plant height measurements (cm) for each treatment at the R2 application timing one to five weeks after treatment application in Perkins during the 2023 growing season. Significance is denoted using ** for α = 0.01 and *** for α < 0.01.
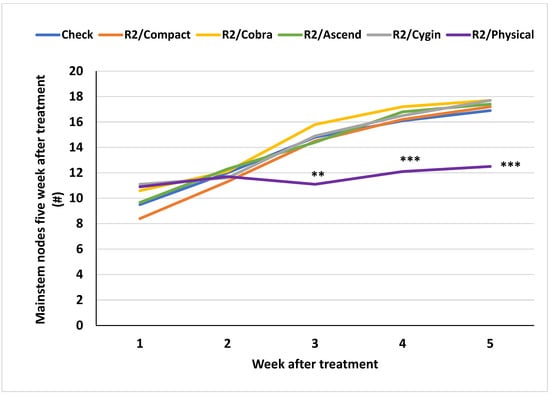
Figure 19.
Number of mainstem nodes for each treatment at the R2 application timing one to five weeks after treatment application in Bixby during the 2023 growing season. Significance is denoted using ** for α = 0.01 and *** for α < 0.01. The # used indicates actual numbers counted.
4. Discussion
The results of this study indicated inconsistencies in yield response to modifications of apical dominance using various methods. However, agronomic data, as well as previous studies, suggest that applying certain synthetic PGRs may enhance tolerance to abiotic stressors such as drought. Although irrigation was supplemented at both locations, the environmental conditions allowed for additional abiotic stressors that could have overshadowed yield impacts. Generally, the higher-than-average temperatures and drier conditions in 2022 may explain why treatment responses were more distinguishable in a year with greater environmental stress (Table 2 and Table 3).
Across all site years, Ascend exhibited the most consistent trend of a positive yield response compared to the check. Although the increase in yield was not statistically significant, it provides valuable insight into the potential benefit of PGRs during stress periods, especially those containing GA. The strong performance of Ascend in 2022, a year with heightened temperatures and drought stress, suggests that it is particularly effective in enhancing drought tolerance and maintaining yield under such conditions. The application of these products containing GA causes alteration of several normal plant processes that help the plant tolerate these abiotic stressors [20].
A similar but less consistent positive trend was observed with Cygin Pro, except for a negative yield response in both application timings in 2023. However, this numerical difference was not significant. The significant effects of Cygin Pro were seen in 2022 when environmental conditions were less favorable, suggesting a potential role in improving drought tolerance under stress. This is further supported by the observed increase in canopy coverage.
GA plays a complex role in the improvement of stress tolerance but has been proven to be an important part of the plants’ response to these abiotic stressors [21]. Previous studies have shown that drought stress reduces gibberellin levels in plants [21,22]. Additionally, PGRs containing GA have been reported to improve drought tolerance, which could explain the numerical yield increases observed in this study with Cygin Pro and Ascend as both contain GA. However, further experiments are needed to verify these findings.
Compact applications generally improved yield compared to the check, except for the V4 application at Bixby in 2022. The primary objective of this chemical application is to limit excess vegetative growth and redirect resources toward yield components. However, no reduction in plant height was observed, suggesting that rather than suppressing growth, this application—like others in this study—may have enhanced stress tolerance. Other studies have reported yield improvements associated with reductions in vegetative growth from applications of mepiquat chloride-containing products [23].
The yield response to Cobra applications varied, but a general trend emerged where the V4 application resulted in lower yields compared to the R2 application. This may be due to the physical injury Cobra caused to soybean plants at earlier growth stages. At these stages, visible injury symptoms do not affect new growth [24], suggesting that yield reductions should be less pronounced with later-season applications when plants have more leaf area to compensate for potential losses. In 2022, Cobra significantly reduced yield at the Perkins location regardless of application timing, likely due to physical injury, an effect that is less pronounced when plants are not exposed to additional stressors. Later applications (R2) produced better results, highlighting the importance of application timing in minimizing stress-induced damage. However, yield responses to Cobra remain inconsistent across studies, indicating that alternative management strategies should be considered [9,25,26].
Similarly, physical removal of the apical meristem resulted in inconsistent yield responses, particularly in 2023, indicating variable performance. Physically removing the apical meristem stopped the plant from developing additional mainstem nodes, but there was no significant difference in yields. No other treatments in this study were able to mimic the physiological effects of apical meristem removal in terms of reduced height or fewer mainstem nodes.
5. Conclusions
Soybean producers in the SGP region face suboptimal growing conditions, including inconsistent precipitation and periods of excessive heat. These factors limit the ability of soybean crops in Oklahoma to achieve the yield potential seen in other states that more commonly grow soybean. While plant growth regulators have been utilized in other crops to enhance yield or quality, little research has been conducted to analyze the effects of PGR applications on soybean. The objective of this research was to examine the physiological effects and economic impact of plant growth regulator applications and the manual removal of the apical meristem in soybean grown in the SGP region.
The average results of this study indicated that the application of plant growth regulators can influence soybean yield. On average, Cygin Pro applied at the V4 stage produced the largest increases in yield, while Cobra applied at the V4 stage resulted in the lowest yield increase due to the foliar damage. Yield outcomes varied more significantly between individual locations and years. The growing conditions for soybean in 2023 were more favorable than in 2022, but the yield response from PGR applications remained inconsistent. The Perkins, OK location in 2023 exhibited the most positive effects, with all PGR treatments leading to slightly elevated yield. The physical removal of the apical meristem was the only treatment that resulted in a decline in yield at this location in 2023. In Bixby, OK, in 2023, the results were highly variable, with many treatments causing reductions in yield. Further research is essential to better understand the effects of PGR applications on soybean, and producers should explore other management strategies to consistently enhance yield and profitability.
Author Contributions
Conceptualization, J.L. and C.J.; methodology, J.L., J.R., C.J. and H.S.; validation, J.L., C.J. and H.S.; formal analysis, B.C. and C.J.; investigation, J.L., C.J., J.R. and H.S.; data curation, J.L.; writing—original draft preparation, C.J. and B.C.; writing—review and editing, J.L., J.R. and H.S.; visualization, B.C.; supervision, J.L.; project administration, J.L.; funding acquisition, J.L. All authors have read and agreed to the published version of the manuscript.
Funding
This research was funded by the Oklahoma Soybean Checkoff Board.
Data Availability Statement
Dataset available upon request from the authors.
Acknowledgments
During the preparation of this manuscript, the authors used Grammarly for the purpose of improving the flow and clarity of the writing. At no point was the program used to originally generate the writing. The authors have reviewed and edited the output and take full responsibility for the content of this publication.
Conflicts of Interest
The authors declare no conflicts of interest.
Abbreviations
| PGR | Plant Growth Regulators |
| SGP | Southern Great Plains |
| GA | gibberellic acid |
| IBA | indole-3-butyric acid |
| BR | brassinolide |
| BAP | 6-Benzylaminopurine |
| ABA | abscisic acid |
References
- Staton, M. Moisture Stress and High Temperature Effects on Soybean Yields; MSU Extension: East Lansing, MI, USA, 2020; Available online: https://www.canr.msu.edu/news/moisture_stress_and_high_temperature_effects_on_soybean_yields (accessed on 5 March 2025).
- Vann, R. How Do High Temperatures Impact My Soybeans? NC State Extension: Louisburg, NC, USA, 2020; Available online: https://soybeans.ces.ncsu.edu/2020/07/how-do-high-temperatures-impact-my-soybeans (accessed on 5 March 2025).
- Licht, M.; Archontoulis, S. Influence of Drought on Corn and Soybean; Iastate.edu: Ames, IA, USA, 2017; Available online: https://crops.extension.iastate.edu/cropnews/2017/07/influence-drought-corn-and-soybean (accessed on 5 March 2025).
- Kou, X.; Han, W.; Kang, J. Responses of root system architecture to water stress at multiple levels: A meta-analysis of trials under controlled conditions. Front. Plant Sci. 2022, 13, 1085409. [Google Scholar] [CrossRef] [PubMed]
- Giri, M.; Jaybhaye, C.; Kanwade, D.; Tijare, B. Effect of foliar application of gibbrellic acid on pigeonpea [Cajanus cajan (L.)] under rainfed conditions. J. Pharmacogn. Phytochem. 2018, 7, 617–620. [Google Scholar]
- Rademacher, W. Plant growth regulators: Backgrounds and uses in plant production. J. Plant Growth Regul. 2015, 34, 845–872. [Google Scholar] [CrossRef]
- VanDerZanden, A.M. How Hormones and Growth Regulators Affect Your Plants; OSU Extension Service: Oakridge, OR, USA, 2012; Available online: https://extension.oregonstate.edu/gardening/techniques/how-hormones-growth-regulators-affect-your-plants (accessed on 14 April 2025).
- Khripach, V.A.; Zhabinskii, V.N.; Khripach, N.B. New practical aspects of brassinosteroids and results of their ten-year agricultural use in Russia and Belarus. In Brassinosteroids: Bioactivity and Crop Productivity; Hayat, S., Ahmad, A., Eds.; Springer: Dordrecht, The Netherlands, 2003; pp. 189–230. [Google Scholar]
- Martins, I.A.; Moreira, S.G.; Bruzi, A.T.; Pimentel, G.V.; Marchiori, P.E.R. Lactofen and kinetin in soybean yield. Pesqui. Agropecu. Trop 2021, 50, e64906. [Google Scholar] [CrossRef]
- Amoanimaa-Dede, H.; Su, C.; Yeboah, A.; Zhou, H.; Zheng, D.; Zhu, H. Growth regulators promote soybean productivity: A review. PeerJ 2022, 10, e12556. [Google Scholar] [CrossRef] [PubMed]
- Soares, L.H.; Dourado, D.; Fagan, E.B.; Teixeira, W.F.; Pereira, I.S. Physiological, phenometric and productive changes in soybean crop due to the use of kinetin. Pesqui. Agropecuária Trop. 2017, 47, 80–86. [Google Scholar] [CrossRef]
- Nagel, L.; Brewster, R.; Riedell, W.E.; Reese, R.N. Cytokinin Regulation of Flower and Pod Set in Soybeans (Glycine max (L.) Merr.). Ann. Bot. 2001, 88, 27–31. [Google Scholar] [CrossRef]
- Nowak, A.; Wróbel, J. Changes in the physiological activity of soybean (Glycine max L. Merr.) under the influence of exogenous growth regulators. Acta Agrobot. 2015, 68. [Google Scholar] [CrossRef]
- Fawcett, J.; Zack, A.; Miller, L. On-farm corn and soybean plant growth regulator trials. Farm Prog. Rep. 2015, 152. [Google Scholar] [CrossRef]
- Prochaska, S.; Hartschuh, J. Effect of Ascend Applied on R3 Soybeans in a Modified Relay Intercrop System; OSU Extension Service: Oakridge, OR, USA, 2013; Available online: https://agcrops.osu.edu/sites/agcrops/files/ofr_reports/Ascend-on-MRI-Soybeans.pdf (accessed on 14 April 2025).
- Zhang, M.; Zhai, Z.; Tian, X.; Duan, L.; Li, Z. Brassinolide alleviated the adverse effect of water deficits on photosynthesis and the antioxidant of soybean (Glycine max L.). Plant Growth Regul. 2018, 56, 257–264. [Google Scholar] [CrossRef]
- Wang, X.; Zhou, Q.; Wang, X.; Song, S.; Liu, J.; Dong, S. Mepiquat chloride inhibits soybean growth but improves drought resistance. Front. Plant Sci. 2022, 13, 982415. [Google Scholar] [CrossRef]
- Cline, M.G. Concepts and terminology of apical dominance. Am. J. Bot. 1997, 84, 1064–1069. [Google Scholar] [CrossRef] [PubMed]
- SAS Institute Inc. SAS/ACCESS® 9.4 Interface to ADABAS: Reference; SAS Institute Inc.: Cary, NC, USA, 2013. [Google Scholar]
- Shohat, H.; Eliaz, N.I.; Weiss, D. Gibberellin in tomato: Metabolism, signaling and role in drought responses. Mol. Hortic. 2021, 1, 15. [Google Scholar] [CrossRef] [PubMed]
- Colebrook, E.H.; Thomas, S.G.; Phillips, A.L.; Hedden, P. The role of gibberellin signalling in plant responses to abiotic stress. J. Exp. Biol. 2014, 217, 67–75. [Google Scholar] [CrossRef] [PubMed]
- Nir, I.; Moshelion, M.; Weiss, D. The rabidopsis 1 suppresses gibberellin activity, reduces whole-plant transpiration and promotes drought tolerance in transgenic tomato. Plant Cell Environ. 2014, 37, 113–123. [Google Scholar] [CrossRef] [PubMed]
- Wang, X.; Zhou, X.; Qu, Z.; Yan, C.; Ma, C.; Liu, J.; Dong, S. Regulation of soybean drought response by mepiquat chloride pretreatment. Front. Plant Sci. 2023, 14, 1149114. [Google Scholar] [CrossRef] [PubMed]
- Berglund, D.R.; McWilliams, D.; Endres, G.; Kandel, H.; Service, N.E. Soybean Growth and Management: Quick Guide; NDSU Extension, North Dakota State University: Fargo, ND, USA, 2021. [Google Scholar]
- Orlowski, J.M.; Gregg, G.L.; Lee, C.D.; Serson, W.R. Early-season lactofen application fails to increase soybean yield under weed-free conditions. Agron. J. 2016, 108, 1552–1560. [Google Scholar] [CrossRef]
- Wichert, R.A.; Talbert, R.E. Soybean [Glycine max (L.)] response to lactofen. Weed Sci. 1993, 41, 23–27. [Google Scholar] [CrossRef]


Disclaimer/Publisher’s Note: The statements, opinions and data contained in all publications are solely those of the individual author(s) and contributor(s) and not of MDPI and/or the editor(s). MDPI and/or the editor(s) disclaim responsibility for any injury to people or property resulting from any ideas, methods, instructions or products referred to in the content. |
© 2025 by the authors. Licensee MDPI, Basel, Switzerland. This article is an open access article distributed under the terms and conditions of the Creative Commons Attribution (CC BY) license (https://creativecommons.org/licenses/by/4.0/).