Article

Simulation of Soil Water Transport and Utilization in an Apple–Soybean Alley Cropping System Under Different Irrigation Methods Based on HYDRUS-2D

by
Xueying Zhang
1,
Ruoshui Wang
1,2,*,
Houshuai Dai
2,
Lisha Wang
2,
Li Chen
2,
Huiying Zheng
2 and
Feiyang Yu
2
1
School of Soil and Water Conservation, Beijing Forestry University, Beijing 100083, China
2
Forest Ecosystem Studies, National Observation and Research Station, Jixian 042200, China
*
Author to whom correspondence should be addressed.
Agronomy 2025, 15(4), 993; https://doi.org/10.3390/agronomy15040993
Submission received: 19 February 2025 / Revised: 15 April 2025 / Accepted: 16 April 2025 / Published: 21 April 2025
(This article belongs to the Section Water Use and Irrigation)

Abstract

:
This study employed the HYDRUS-2D model to simulate soil water movement and water productivity (WP) in an apple–soybean alley cropping system in the Loess Plateau region, Shanxi Province, China, under four irrigation methods: mulched drip irrigation, subsurface drip irrigation, bubbler irrigation, and rainwater-harvesting ditch irrigation, with varying water management treatments. Field experiments provided 2022 data for model calibration and 2023 data for validation using soil water content (SWC) measurements, achieving R2 = 0.80–0.87 and RMSE = 0.011–0.017 cm3·cm−3, confirming robust simulation accuracy. The simulation results indicated that different irrigation methods had a significant impact on the soil water distribution. Mulched drip irrigation enhanced the water content in the surface layer (0–20 cm), while subsurface drip irrigation increased the moisture in the middle soil layer (20–40 cm). Bubbler irrigation was most effective in replenishing both the surface (0–20 cm) and middle (20–40 cm) layers. Rainwater-harvesting ditch irrigation significantly improved the soil water content in both the surface (0–20 cm) and middle (20–40 cm) layers, with minimal changes observed in the deep layer (40–120 cm). Furthermore, soil water variations were significantly influenced by the water uptake of tree roots. In 2022, soil moisture initially increased with distance, then decreased, and subsequently increased again, while in 2023, it increased initially and then stabilized. When the irrigation amount was limited to 75% of the field capacity in the 0–60 cm soil layer, water productivity (WP) reached its optimum, with values of 4.79 kg/m3 (2022) and 5.56 kg/m3 (2023). Based on the simulation results, it is recommended that young apple trees be irrigated using subsurface drip irrigation with a soil layer depth of 30 cm, while soybeans should be irrigated with mulched drip irrigation. Both crops should be irrigated at the podding and filling stages of soybeans, and the irrigation amount should be limited to 75% of the field water capacity in the 0–60 cm soil layer. This study was designed to aid orchard growers in precision irrigation and water optimization.

1. Introduction

The Loess Plateau, located in northern China, is characterized by its hill-and-gully terrain, and it faces significant agricultural water scarcity challenges [1,2]. To improve land use efficiency and economic returns in this region, alley cropping systems—where crops are planted between rows of trees—have been introduced [3]. However, water scarcity, uneven precipitation, and differences in the root water uptake between the crops lead to water competition, which can reduce crop yields and economic benefits. In the context of alley cropping, irrigation plays a crucial role in mitigating water scarcity, especially for family farms in the Loess Plateau. This is particularly important for soybean cultivation, as irrigation for soybeans is not commonly practiced worldwide. The introduction of irrigation systems in the apple–soybean alley cropping system has become critical for enhancing crop yields. Our research team has conducted field experiments to explore how different irrigation methods and water amounts affect soil moisture distribution and crop growth in both apple–maize and apple–soybean systems [4,5,6].Our findings indicate that, in the apple–maize alley cropping system, the combination of mulched drip irrigation with an 85% field capacity (Fc) upper limit and 70% of the recommended fertilizer dose results in higher grain yields and partial productivity (PFP), which is the ratio of the economic yield to the fertilizer application per unit area. In the apple–soybean system, under sufficient water conditions, the recommended strategy is an 80% Fc irrigation upper limit coupled with full-growing-season plastic film mulching. In water-limited years, using a 65% Fc irrigation limit and plastic film mulching from the seedling to the pod-filling stage enhances the soil’s water-thermal environment and supports crop growth [4,5,6].While numerous studies on water management in alley cropping systems focus on the early stages of fruit tree growth, these studies often overlook the maturation of the system, where the intensity of water competition increases [7]. As fruit trees mature, the overlap between their root systems and the shallow root zones of intercropped crops become more pronounced. Furthermore, the expanding canopy of fruit trees shades the intercropped crops, reducing their photosynthetic efficiency and water productivity [8,9]. As a result, the effective management of water resources becomes even more important in mature alley cropping systems [10,11]. Short-term field experiments, however, often fail to capture the long-term interactions between tree growth, crop development, and water availability. Numerical models, which integrate meteorological data, hydraulic characteristics, and root water uptake parameters, offer an effective solution for simulating soil moisture dynamics over multiple years. These models can more accurately predict water uptake by both trees and crops, providing a clearer understanding of the impact of water competition on plant growth [12,13,14].
The HYDRUS model has been successfully applied in studies of monoculture and intercropping systems to simulate water movement [15,16,17,18,19,20,21]. However, fruit tree alley cropping systems present a more complex scenario due to the intricate interactions between crops, root zones, and varying water demands [17,18,19]. While the HYDRUS model has been used in systems such as rice–corn and corn–soybean intercropping, its application to fruit tree alley cropping systems requires further optimization, taking into account factors such as root distribution, canopy shading, and water consumption dynamics. In the Loess Plateau, various water-saving irrigation methods have been adopted, including mulched drip irrigation, subsurface drip irrigation, bubbler irrigation, and rainwater-harvesting ditch irrigation. These techniques help reduce water competition between trees and crops. However, there remains a lack of research on simulating water movement in these systems, hindering the optimization of irrigation strategies. The effectiveness of these methods is influenced by soil properties, root distribution, and climate, adding complexity to simulation studies. This study seeks to investigate soil moisture dynamics and water productivity in the apple–soybean alley cropping system of the Loess Plateau. By conducting field experiments and using the HYDRUS-2D model, this study aims to assess the impact of mulched drip, subsurface drip, bubbler irrigation, and rainwater-harvesting on soil moisture and crop growth [21]. The ultimate goal is to propose optimized water-saving strategies to improve the irrigation efficiency in alley cropping systems. It is hypothesized that different irrigation methods and water amounts will significantly influence the soil moisture distribution and water productivity (WP) in the apple–soybean alley cropping system. The specific objectives are to analyze the spatial and temporal dynamics of soil moisture under different irrigation methods, evaluate variations in water productivity across these strategies, and suggest optimal water-saving management practices to enhance the irrigation efficiency in the Loess Plateau’s alley cropping systems, with the aim of assisting local orchard growers in achieving precision irrigation and optimizing water resource allocation, thereby advancing the region’s sustainable agricultural objectives of “water conservation without yield reduction” and “intercropping-enhanced productivity”.

2. Materials and Methods

2.1. Field Experiment
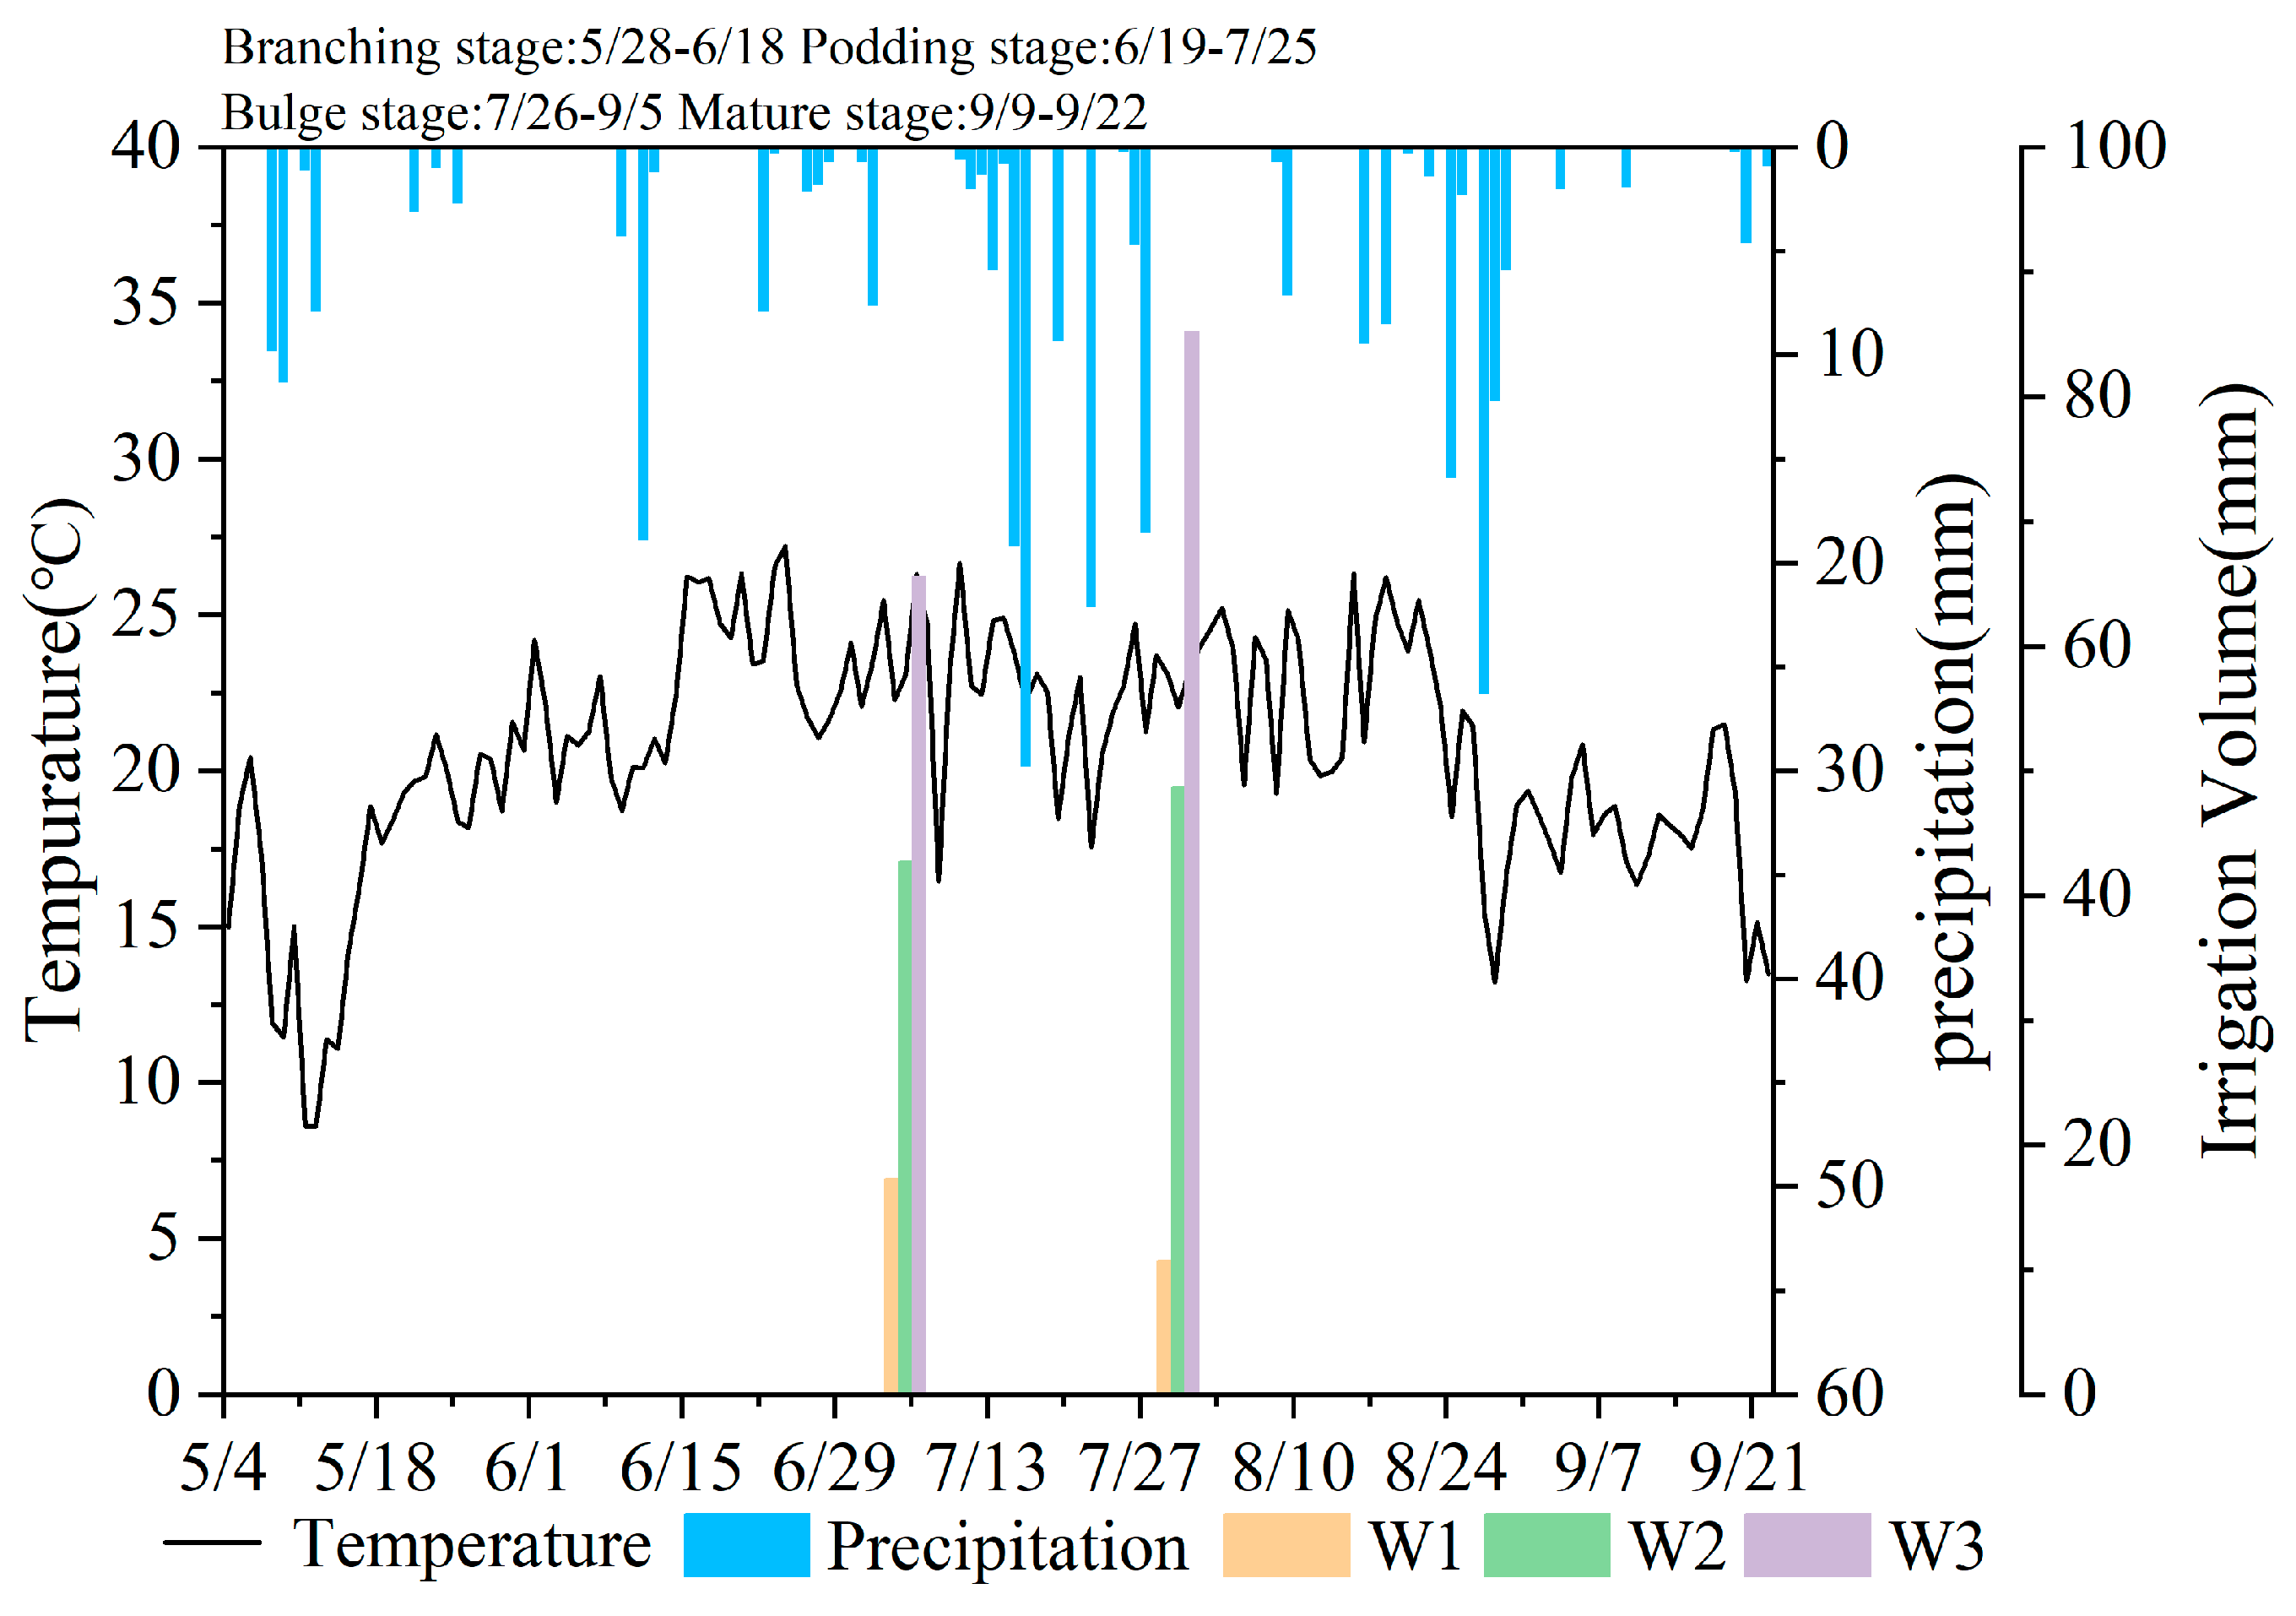
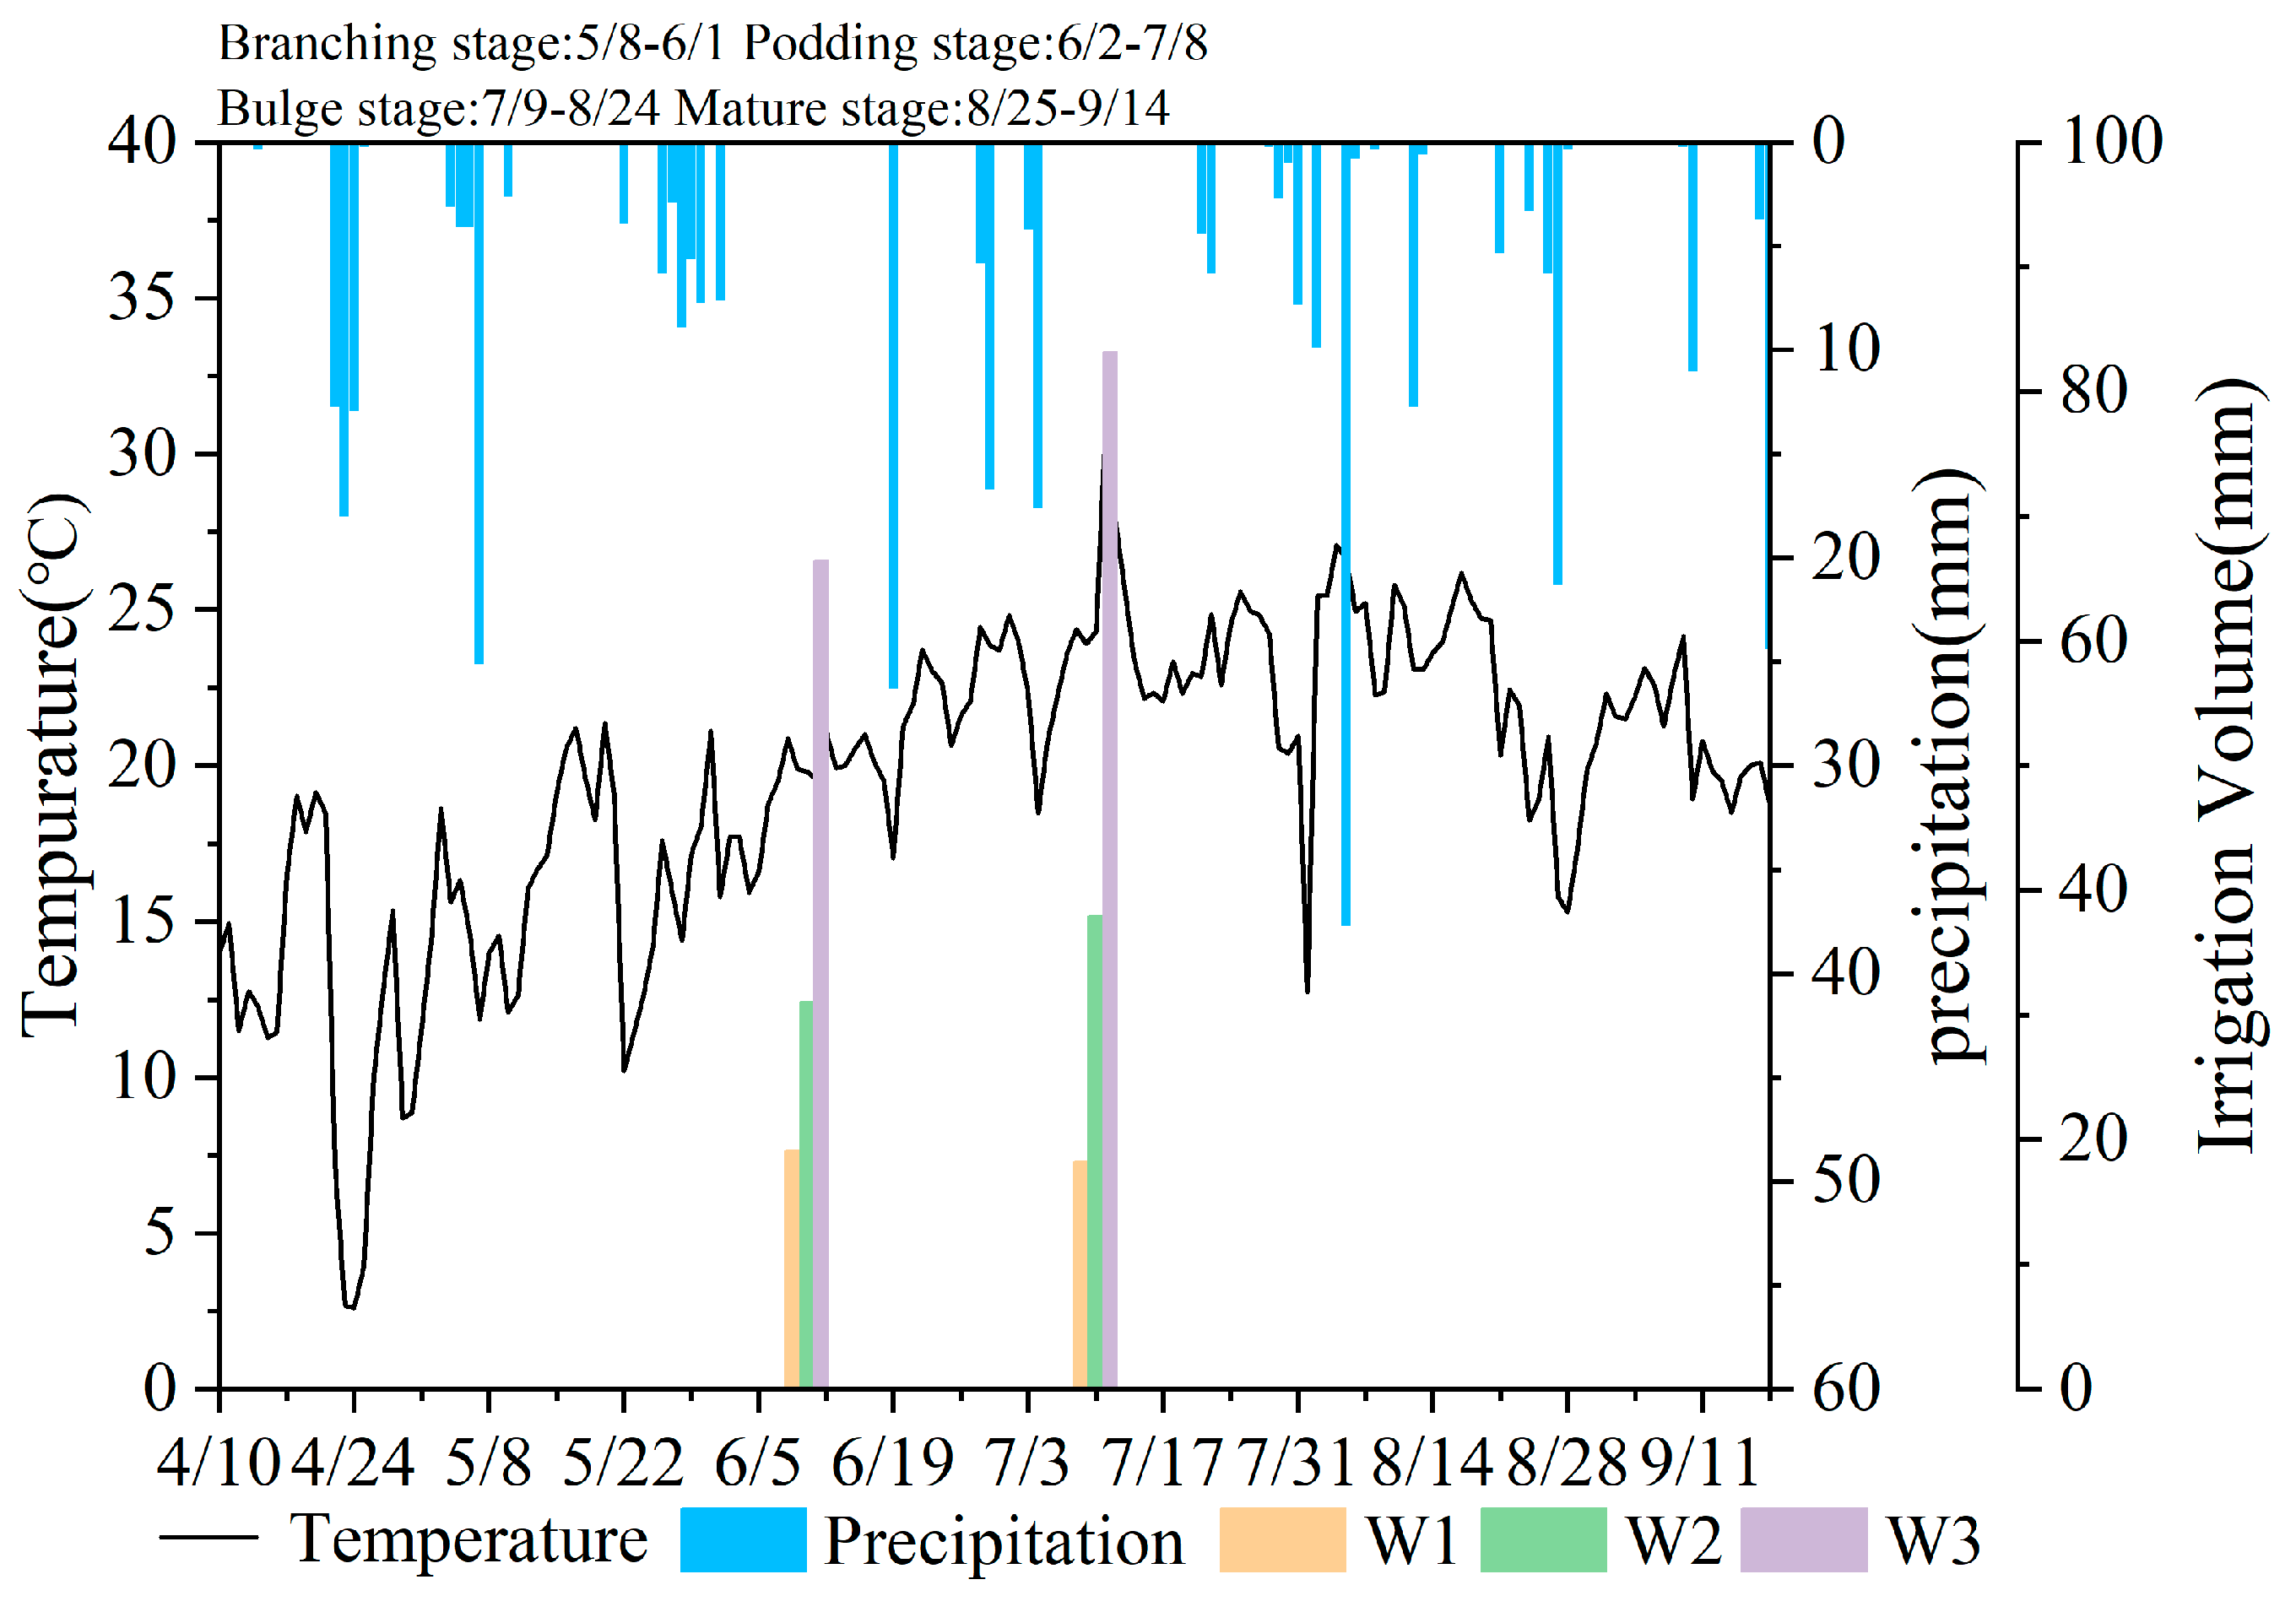
2.1.1. Location

The study site is located in the Forest Ecosystem Studies, National Observation and Research Station, Jixian, Shanxi, China (110°26′28″–111°07′21″ E, 35°53′13″–36°21′03″ N), in a typical remnant gully area of the Loess Plateau. The soil has poor fertility, and the experiment was conducted there from 2022 to 2023. The region has a temperate continental climate, with abundant sunlight. The average frost-free period is 175 days, the annual average temperature is 10 °C, the annual accumulated temperature is 3357.9 °C, and the annual precipitation is 576 mm, primarily concentrated from June to September. The average growing season temperatures in 2022 and 2023 were 21 °C and 20 °C, respectively, with precipitation amounts of 297 mm and 357 mm, as shown in Figure 1 and Figure 2. The average soil bulk density of the 0–120 cm soil layer at the experimental site is 1.27 g/cm3, and the average field capacity is 26.87%. The soil in the region was classified according to the USDA Soil Taxonomy as sandy loam and loam. A single soil profile was opened for characterization, and three samples were collected at each soil layer, defined as depth ranges of 0–10 cm, 10–20 cm, and so on, until 100–120 cm. Each sample had a mass of approximately 500 g (±10 g). According to the soil particle size distribution, the soil in this region is primarily loam, with the specific parameters shown in Table 1.

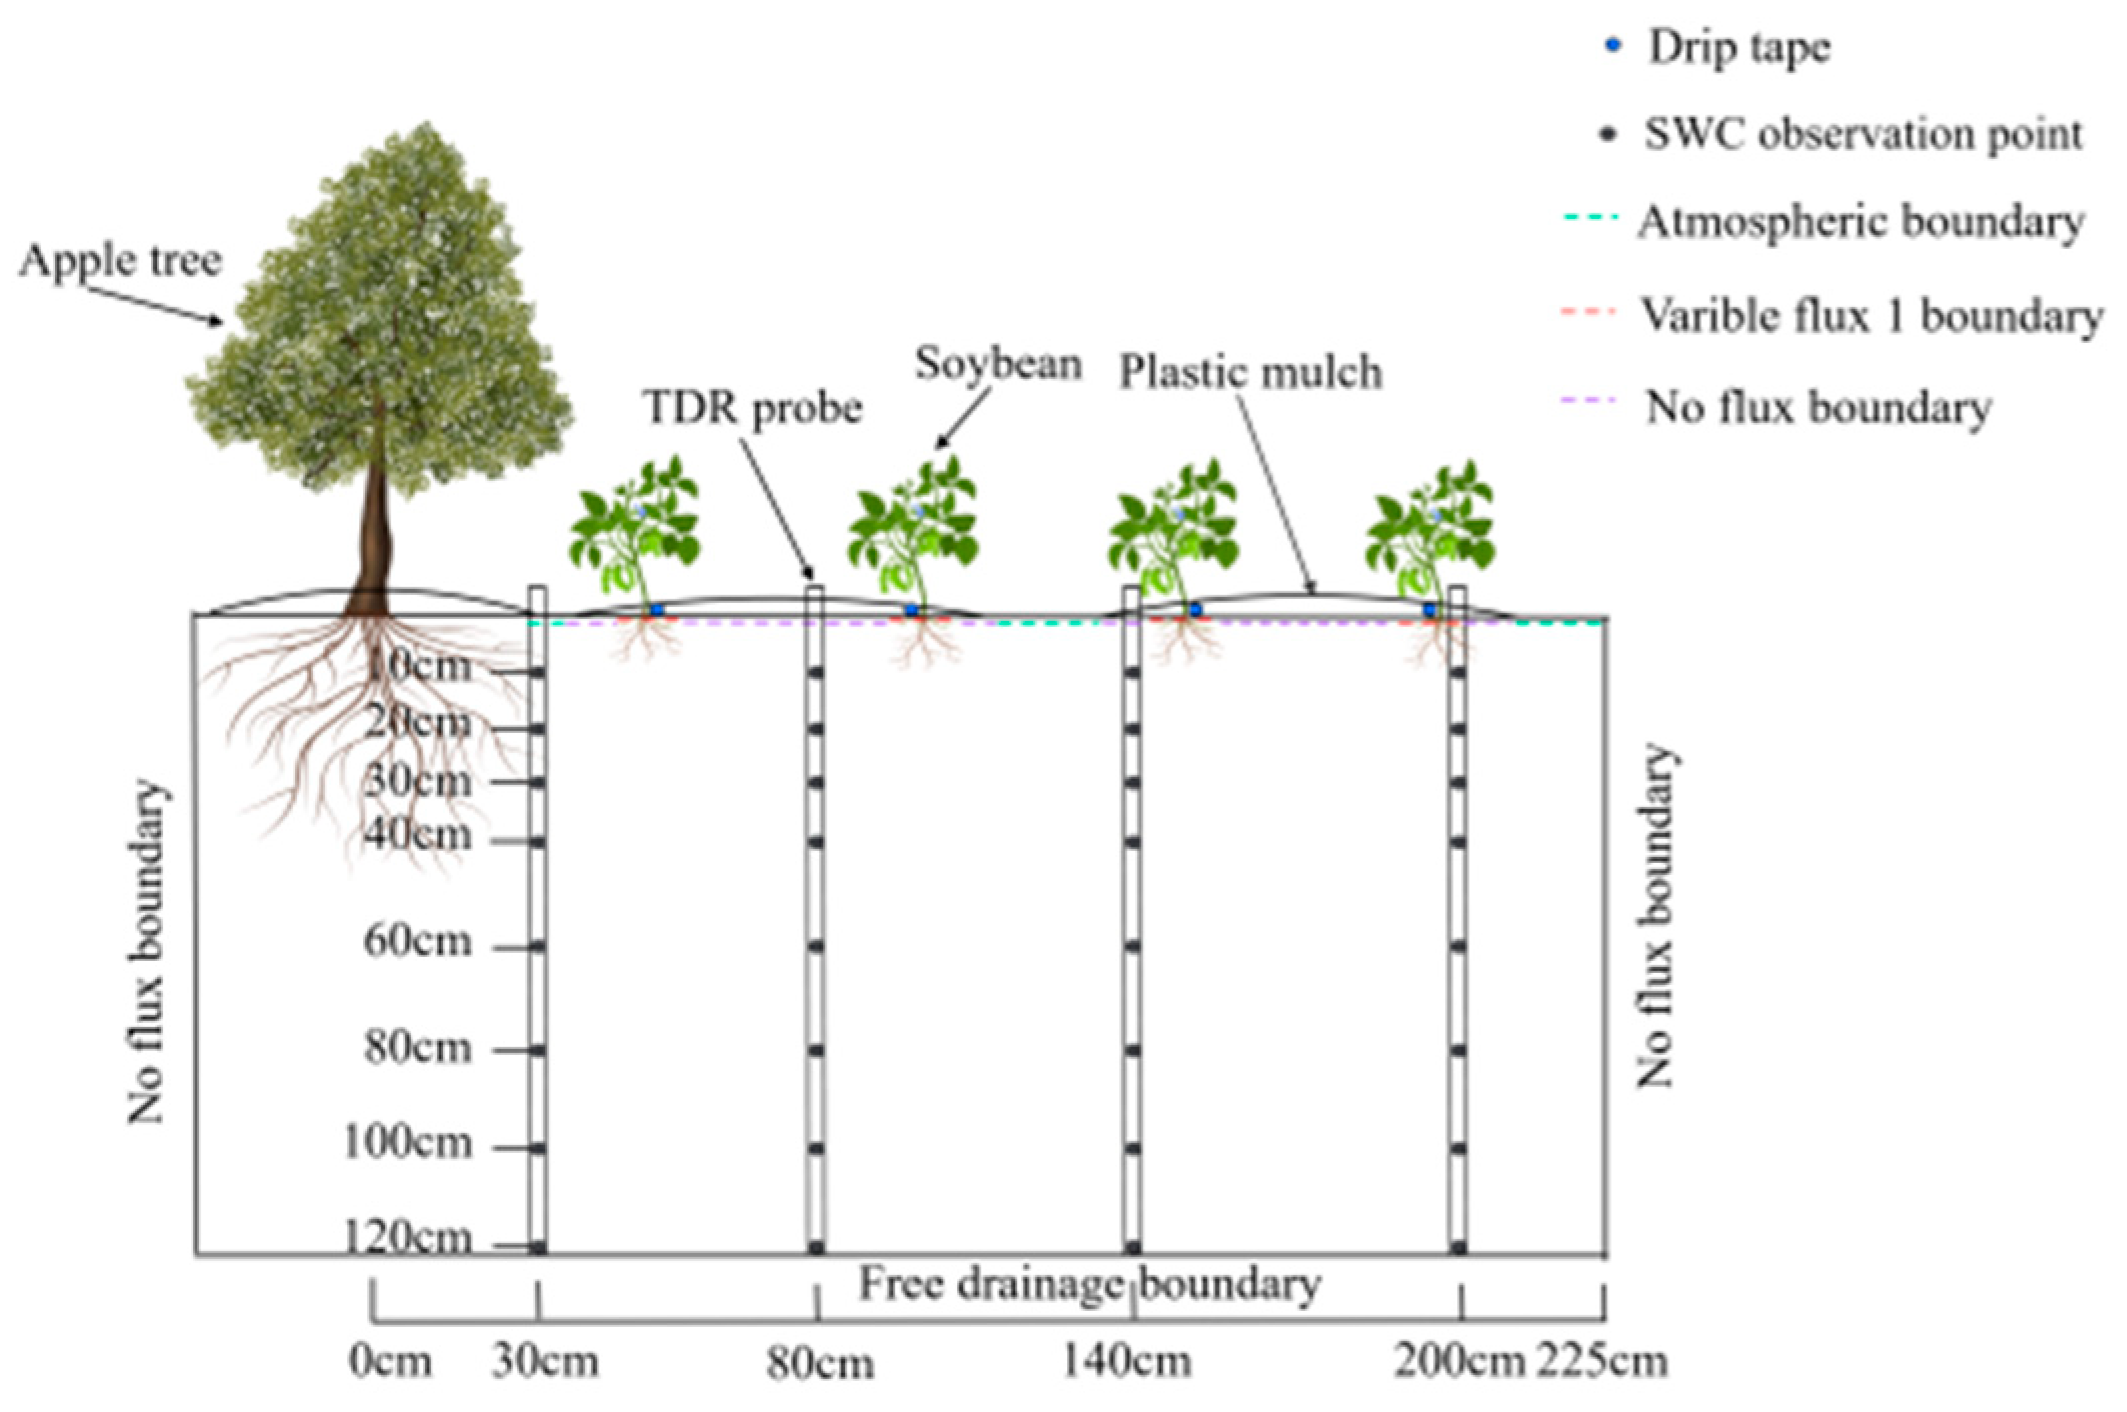
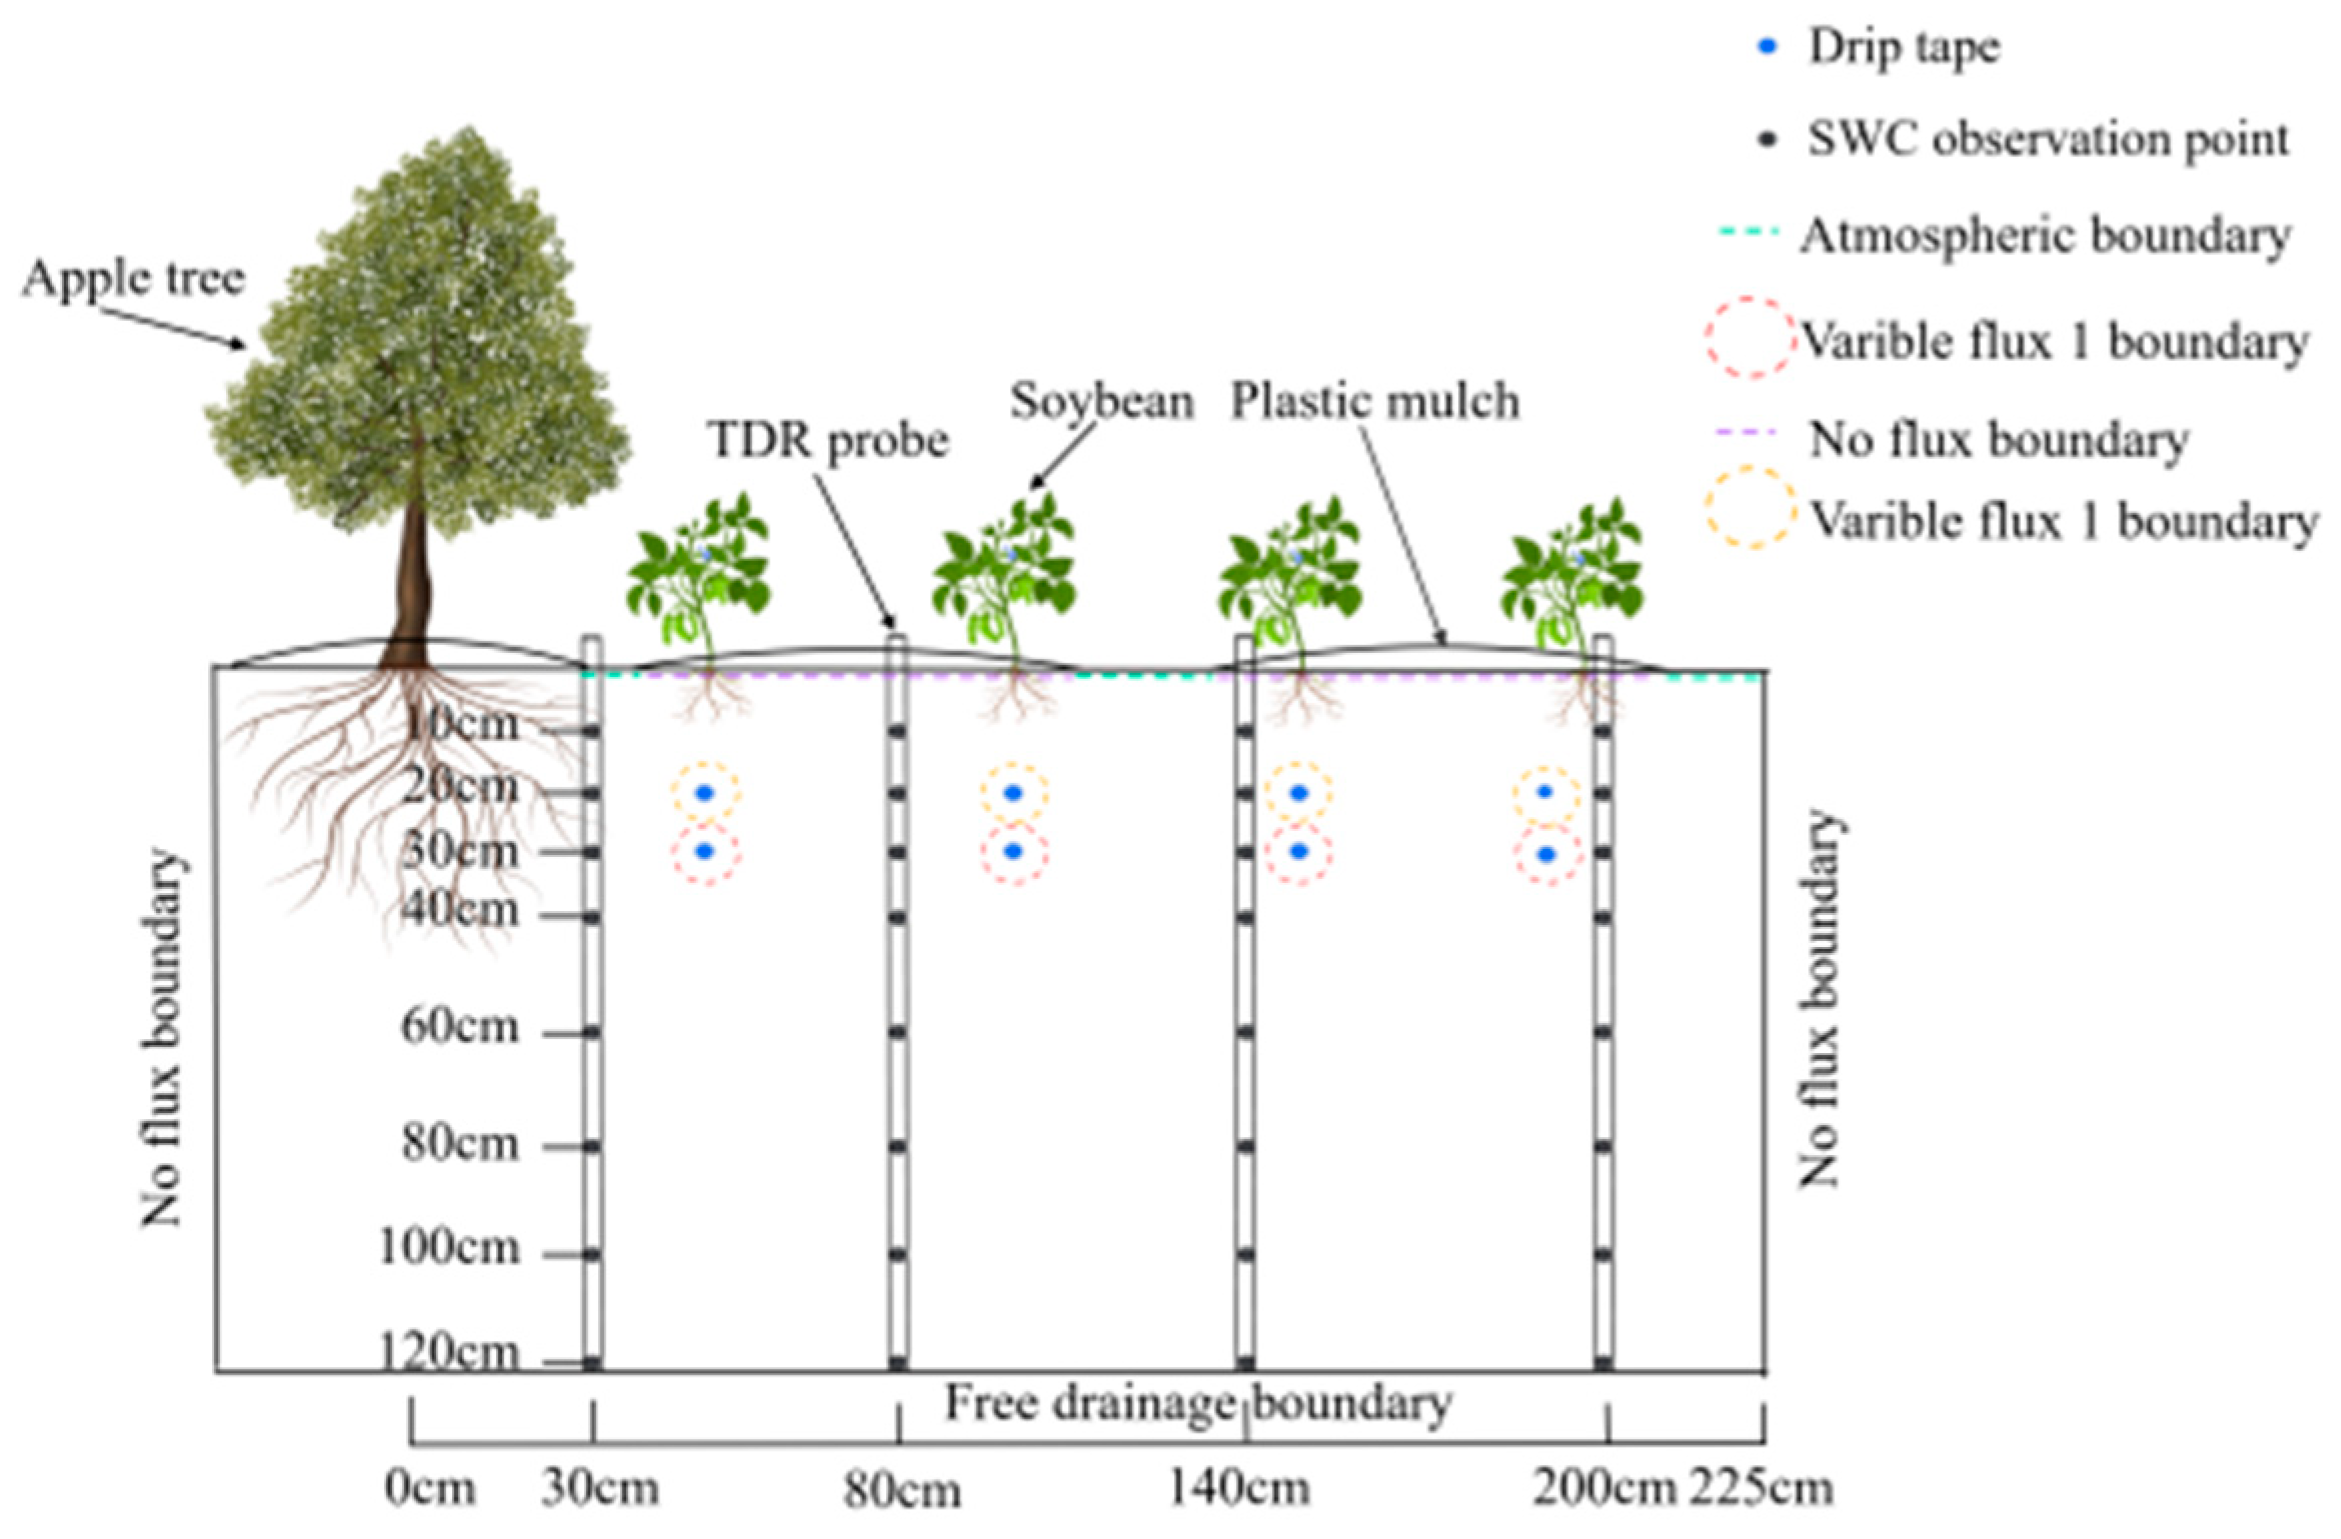
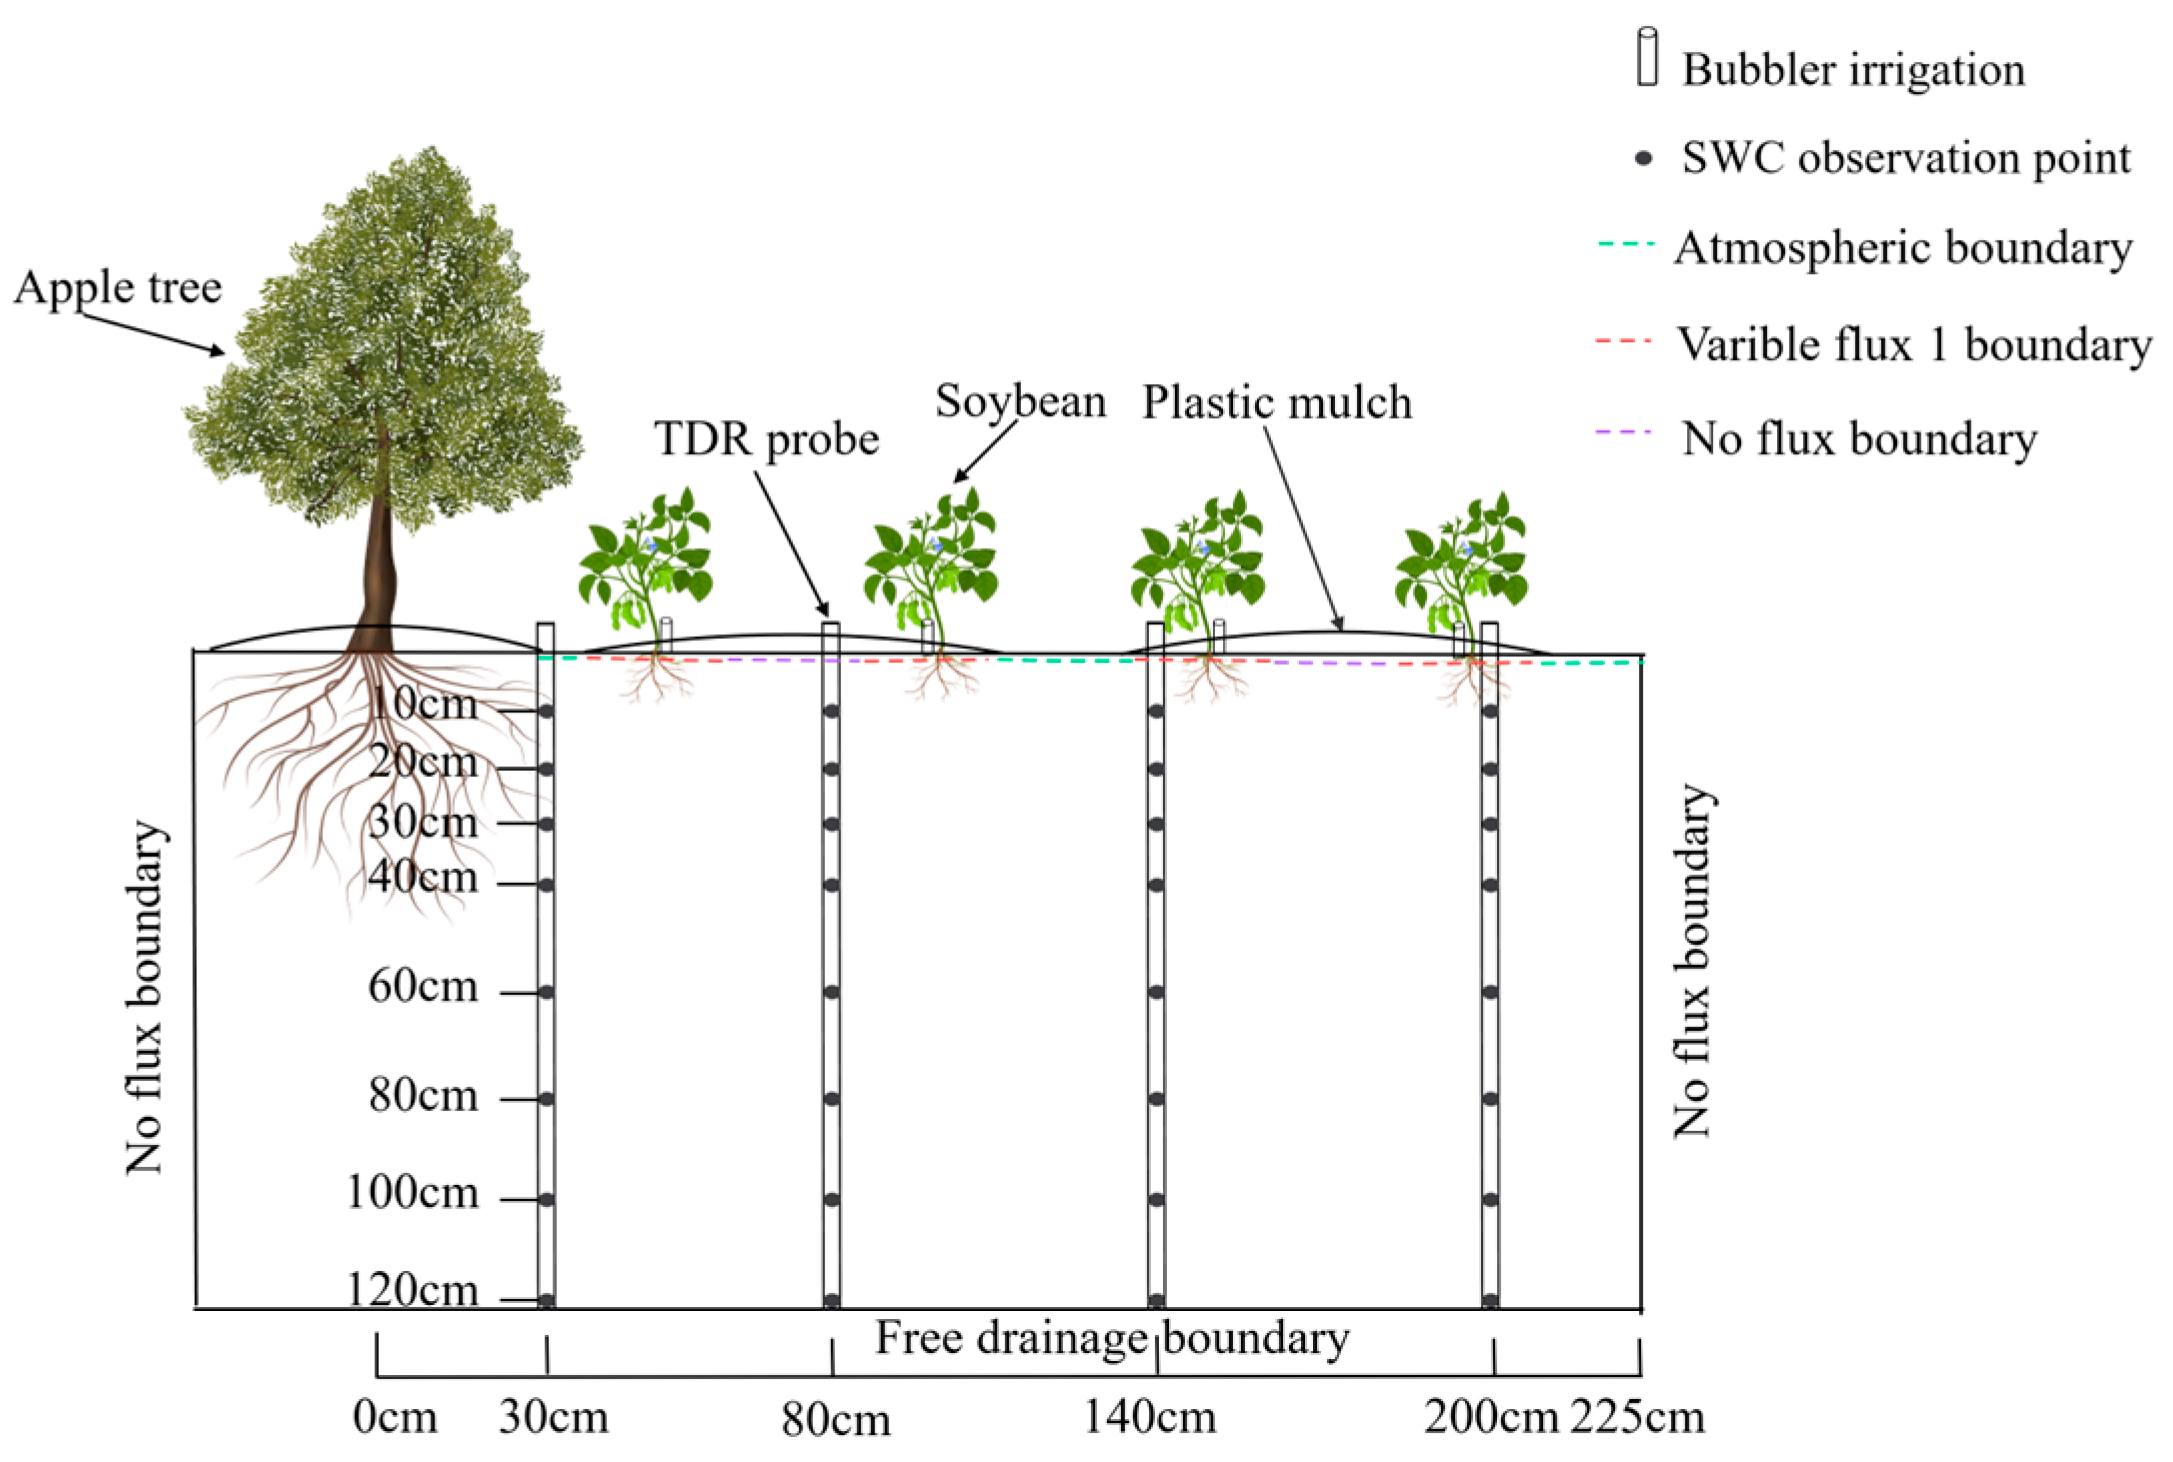
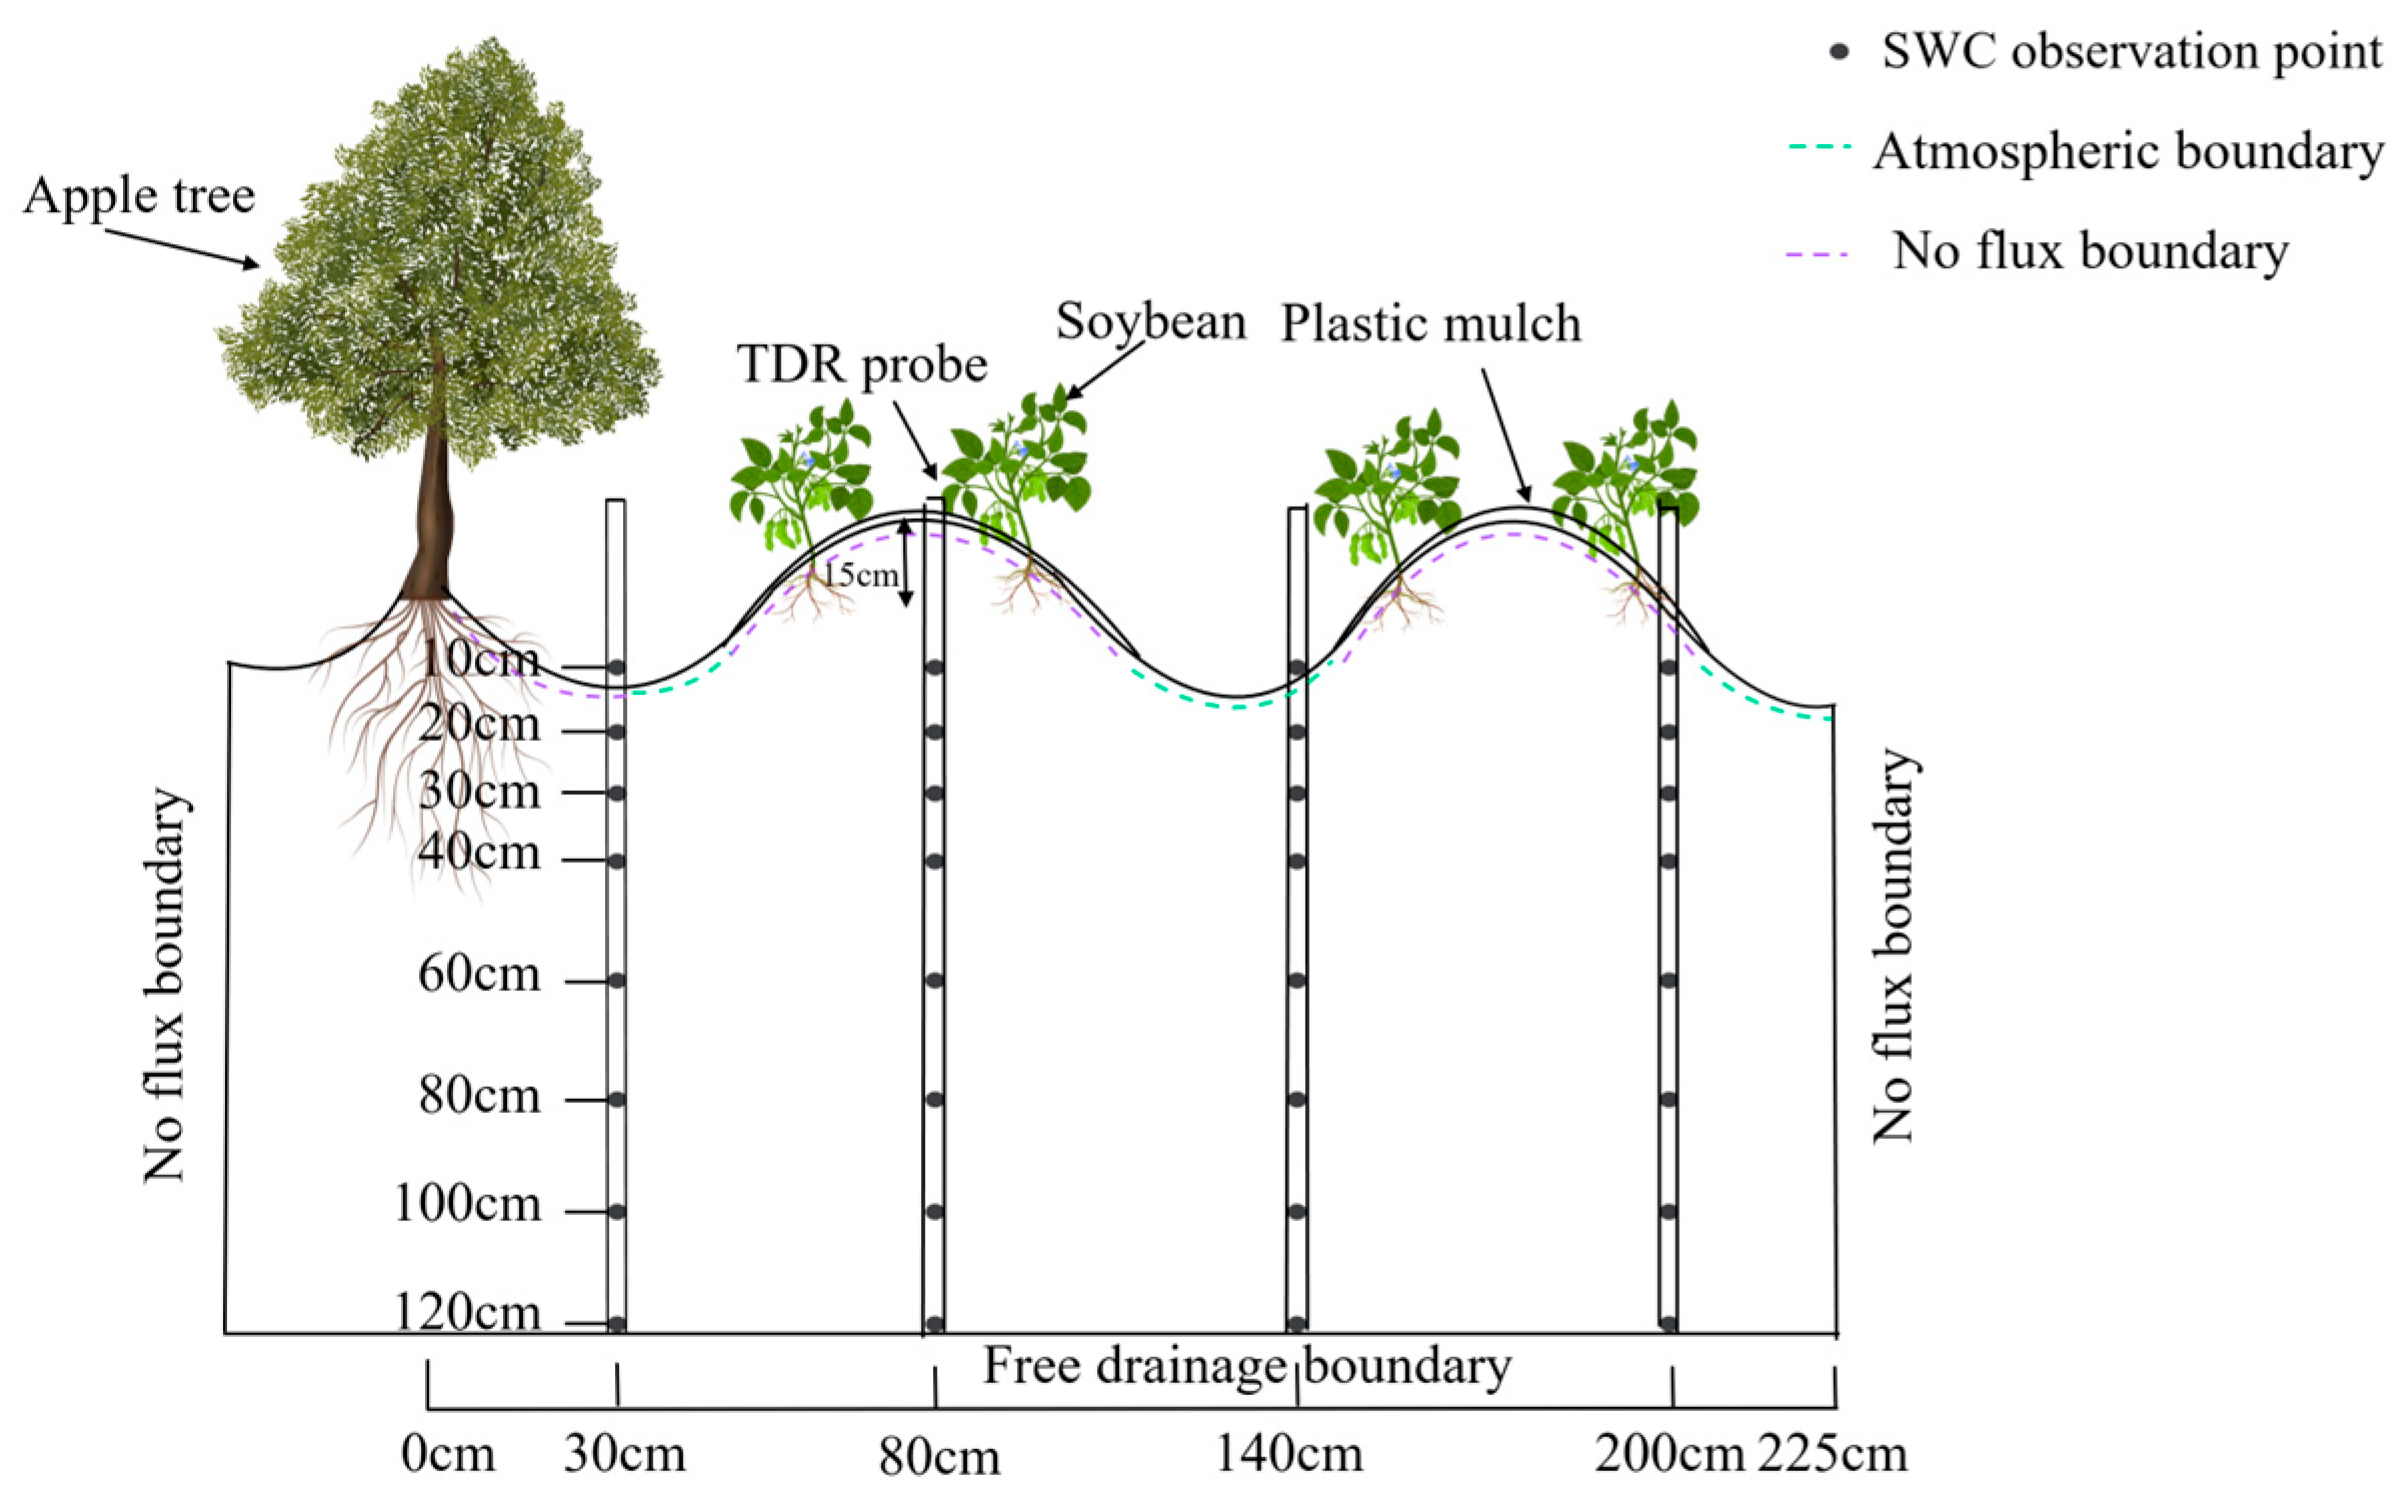
2.1.2. Design of Field Experiment

The field experiments were conducted from April to October in 2022 and 2023, focusing on an apple–soybean alley cropping system. The experimental site was located in Sanhou Village, Jixian County, Shanxi Province. The apple variety used was Yanfu 38, planted in 2018, and had not yet entered the bearing stage. The planting arrangement for the young apple trees was 5 × 5 m, oriented in a north–south direction, with an average tree height of 3.3 m. The soybean variety was Jindou 37, which was sown on 10 May 2022 and 20 April 2023. The soybean plants were spaced 0.3 × 0.5 m, with a planting distance of 0.5 m from the young apple trees. Each experimental plot consisted of one apple tree and eight rows of soybean, covering an area of 17 m2. The plots were separated by a 2 m buffer zone to minimize interference between treatments. The field experiment employed a two-factor randomized block design, with three micro-irrigation methods and three irrigation levels (Figure 3, Figure 4 and Figure 5), along with the inclusion of a rainwater-harvesting ditch irrigation (GL), where the ridge height was set at 15 cm (Figure 6). Each treatment was replicated three times, resulting in a total of 30 experimental plots. All the treatments incorporated mulching measures. Furthermore, since rainwater-harvesting gutter irrigation (GL) was considered a gradient-free independent control due to its reliance on rainwater-harvesting, a total of nine factors were analyzed statistically. Specifically, a two-way ANOVA was employed to examine the effects of irrigation methods, water application levels, and their interaction effects. The water application levels (denoted as W1/W2/W3) were independently applied (non-cumulative)—for instance, the W1/W2/W3 treatments under drip irrigation under mulch were implemented in separate experimental plots.
This study employed three irrigation methods: mulched drip irrigation (D), subsurface seepage irrigation (S), and bubbler irrigation (Y). The upper limits of the irrigation amounts were set at 60%, 75%, and 90% of the field capacity (Fc) in the 0–60 cm soil layer, corresponding to low (W1), medium (W2), and high (W3) water levels, respectively. Irrigation was primarily scheduled during the pod-setting and grain-filling stages of soybean growth to ensure that the crops received sufficient water during critical growth periods. The irrigation amount during the soybean pod-setting and grain-filling stages are shown in Table 2. The drip emitter flow rate for the mulched drip irrigation system was 2.7 L/h, with an emitter spacing of 0.3 m and a drip tape spacing of 0.5 m (Figure 3). The emitter flow rate of the buried mulched drip irrigation pipe was 2.0 L/h, with an emitter spacing of 0.3 m and a drip tape spacing of 0.5 m. The installation depth was 30 cm in 2022 (Figure 4) and was adjusted to 20 cm in 2023 (Figure 4). Two different installation depths were chosen to compare the effects of depth on soil moisture distribution and evaluate their impact on irrigation efficiency. The discharge flow rate of the bubbler irrigation collector was 4.5 L/h, with a spacing of 0.5 m (Figure 5) and a height of 20 cm.

2.1.3. Measurement of Meteorological Data, Soil Moisture Content, Leaf Area, and Plant Height

Meteorological data: An automatic weather station (TG15m, Hebei Hengshui) was set up at the Shishanwan Hongqi Forest Farm in Jixian County, Shanxi Province, to collect daily rainfall, solar radiation, temperature, air humidity, atmospheric pressure, wind speed, and other meteorological data. Measurements were taken every 30 s, recorded every 30 min, and daily averages were computed, as shown in Figure 1 and Figure 2.
Soil moisture content: The initial moisture content before sowing was determined using the soil auger and oven-drying method. One TRIME-TDR probe was installed at distances of 30 cm, 80 cm, 140 cm, and 200 cm from the apple trees (Figure 3, Figure 4, Figure 5 and Figure 6). Every 7 days, soil moisture was measured at the following depths: 0–10 cm, 10–20 cm, 20–30 cm, 30–40 cm, 40–60 cm, 60–100 cm, and 100–120 cm, using a Time Domain Reflectometry (TDR) probe (TRIME-PICO-IPH, IMKO, Ettlingen, Germany). Soil moisture readings were calibrated using the oven-drying method.
Soybean yield measurement: At the end of the growing season, the crops were harvested. During the soybean maturity stage, two 1 m × 2.5 m sample plots were established on the north and south sides of the fruit trees. Soybean seeds from each plot were harvested and subjected to a heat treatment at 105 °C to terminate the enzymatic activity (also known as a kill-green treatment), followed by drying at 75 °C until reaching a constant weight. After cooling, the seeds were weighed. The average yield was calculated and converted to the per-hectare yield.

2.2. Numerical Modeling

2.2.1. Water Flow Equations

Based on the HYDRUS-2D model [22], numerical simulations of soil water movement in the apple–soybean alley cropping system under different micro-irrigation methods were conducted. The model employs the Galerkin finite element method to solve the Richards equation [23], and the formula is as follows:
θ τ = x K h h x + z k h h z + K h S h
In the equation, θ represents the soil volumetric water content (cm3/cm3); h represents the pressure head (cm); K(h) refers to the soil hydraulic conductivity (cm/d); t is the simulation time (d); x and z represent the horizontal and vertical coordinates (cm), respectively; and S indicates the root water uptake term, which represents the rate of water absorption by roots per unit time per unit volume of soil (d−1).
The soil hydraulic function follows the van Genuchten model [24], as shown below:
θ = θ r + θ s θ r 1 + α h n m m = 1 1 n
K h = k s S e l 1 1 S e l / m m 2
S e = θ θ r θ s θ r
In the formula, θs is representative of the saturation soil moisture content, cm3/cm3; θr is the residual soil moisture content, cm3/cm3; n, m, and α are shape parameters; and l is the pore connectivity parameter, l = 0.5.
The soil hydraulic characteristic parameters were predicted using the Rosetta model integrated within the HYDRUS-2D model [25], based on the soil particle composition (i.e., the volumetric percentages of clay, silt, and sand) and the initial bulk density (see Table 1). Subsequently, the model was then calibrated using the soil moisture data measured in 2022, with manual adjustment of the parameters. The inverse method was applied to select the optimal parameters, which were subsequently validated using the 2023 experimental data. To accurately describe the hydraulic characteristics of the soil profile, the soil profile from 0 to 120 cm depth was divided into eight layers. The specific soil hydraulic characteristic parameters are shown in Table 3.

2.2.2. Domain and Boundary Conditions

In 2022 and 2023, the experimental plot included one apple tree and eight rows of soybeans, with a left–right symmetry. Therefore, half of the experimental plot was chosen for the simulation, with a horizontal distance set to 0–225 cm. The upper boundary was divided into mulched and non-mulched areas: the mulched area (0–35 cm, 65–115 cm, 135–215 cm) was set as a known flux boundary, while the non-mulched area (35–65 cm and 115–135 cm) was set as the atmospheric boundary conditions. The lower boundary was set as a free infiltration boundary, and the left and right boundaries were set as zero-flux boundaries. The point source infiltration problem was converted into the linear water flux [26], calculated using the following formula:
q = Q × L L
In the formula, q represents the water flux passing through the upper boundary, cm/d; Q represents the drip irrigation flow rate under the mulch, cm/d; L represents the drip head control boundary length, cm; and L’ represents the drip head input flow boundary, cm.
Initial conditions: h ( x , z , t ) = h 0 ( x , z )
0 x 225 , t = 0 , 120 z 0
Variable flux boundary conditions:
K h h z + 1 = q ( t )
0 x 30 ,   35 x 115 ,   135 x 215 , t 0 , z = 0
Atmospheric boundary conditions:
K h h z + 1 = E t
30 x 35 ,   115 x 135 ,   215 x 225 , t 0 , z = 0
Lower boundary condition: h x , z , t = h ( t )
0 x 225 , t > 0 , z = 120
Left and right boundary conditions: K h h x = 0
x = 0 , x = 225 , t 0 , 120 z 0
In the equation, h0 is the initial head, cm; h′ represents the groundwater table, cm; and E is the infiltration or evaporation rate under current atmospheric conditions, cm/d.

2.2.3. Root Water Uptake

The root water uptake, term S, is modeled using the Feddes model [27], as follows:
S h = h × b x , z × T P × S t
b x , z = b x , z Ω R b x , z d Ω
h = h 1 h h 1 h 2           h 2 < h h 1 1                                   h 3 < h h 2 h h 4 h 3 h 4         h 4 < h h 3
In the equation, b(x,z) represents the root water uptake distribution parameter, which is determined based on the actual root distribution; Tp represents the potential transpiration rate, cm/d; a(h) is the dimensionless soil water pressure parameter; St refers to the soil surface width related to the crop transpiration process, cm; h1 represents the anaerobic point pressure head for root water uptake, cm; h2 represents the optimal pressure head for root water uptake, cm; h3 represents the cessation pressure head for root water uptake, cm; and h4 represents the wilting pressure head for root water uptake, cm. The specific parameters for the root water uptake were referenced from Wesseling et al. [28] and were directly selected in the HYDRUS-2D (version 5.01).

2.2.4. Estimating Evaporation and Transpiration

The HYDRUS-2D model completes the crop–soil water exchange process by inputting potential evapotranspiration. During the computation, the potential evapotranspiration is converted into actual evapotranspiration using a certain proportional factor [15]. However, since the current version does not support input for parameters of two crops, in order to minimize errors, this study estimates the potential evapotranspiration for the apple–soybean alley cropping system using a comprehensive coefficient method [16]. The specific formula is as follows:
E T p = k c × E T o
K c = f 1 l 1 k c 1 + f 2 l 2 k c 2 f 1 l 1 + f 2 l 2
ETo is the potential evapotranspiration of the crop, mm; ETp is the crop’s water requirement, mm; f1 and f2 are fractions of the soil surface planted by apple and soybean in an intercropping field; l1 and l2 are the plant heights of apple and soybean, respectively (cm); and Kc1 and Kc2 are the crop coefficients for apple and soybean, respectively, based on the FAO56 [16] recommended values; research-based Kc values were derived from the studies by Pereira et al. (2021) [29] and López-Urrea et al. (2024) [30]. Locally adjusted Kc values were calculated based on the average minimum relative humidity, plant height, and daily average wind speed at 2 m above the canopy during the mid-season growth period in Jixian, Shanxi Province. The same method was applied for soybean’s late-season crop coefficient adjustment, while no adjustment was needed for apple if the late-season crop coefficient was less than 0.45. Consequently, the composite Kc values were determined as 0.59 (early stage), 0.98 (mid stage), and 0.85 (late stage) across the growing period, and the data are shown in Table 4.

2.2.5. Criteria of Model Evaluation

In this study, three evaluation metrics were used to compare the difference between the simulated and measured values of the soil moisture content: the mean relative error (MRE), the coefficient of determination (R2), and the root mean square error (RMSE).
M R E = 1 n i = 1 n S i M i S i × 100%
R M S E = 1 n i = 1 n S i M i 2
R 2 = i = 1 n M i M ¯ S i S ¯ i = 1 n M i M ¯ × i = 1 n S i S ¯
In the equation, Si represents the simulated value; Mi represents the measured value; i is the observation point; and n is the total number of observation points. There were 672 observation points in total across the three irrigation levels for the different irrigation types. For rainwater-harvesting ditch irrigation, the number of observation points was n = 210, with S and M representing the average simulated and measured values, respectively.

2.2.6. Calculation of Irrigation Amount and Total Water Use

In this experiment, the irrigation quota for dryland crops was used to calculate the irrigation amount using the following formula:
M = 10 γ H θ w θ 0
where M is the irrigation amount (mm); γ is the soil bulk density in the moist layer of the soil; H is the depth of the planned moist layer in the soil (cm); θw is the target gravimetric water content of the soil; and θ0 is the soil mass water content at the time of measurement. The H values were 20, 40, and 60 cm at the branching, podding, and maturing stages, respectively.
The experimental site is flat, with the surface runoff considered negligible (i.e., zero). The groundwater table is located below 30 m, with no groundwater recharge. Deep percolation is not considered under the different irrigation methods, and deep percolation is assumed to be zero. Therefore, the calculation of the total water use (TWU) was simplified to [31]:
T W U a = I + P ± Δ S a
T W U s = I + P ± Δ S s
In the formula, TWUa represents the actual total water use during the stage (mm); TWUs represents the simulated total water use during the stage (mm); I is the irrigation amount during the stage (mm); P is the effective precipitation during the stage (mm); ΔSa is the difference in soil water storage consumption in the 0–120 cm soil layer between the beginning and end of the actual measurement stage (mm). ΔSs is the difference in the soil water storage consumption in the 0–120 cm soil layer between the beginning and the end of the simulated stage (mm).

2.2.7. Water Productivity

The water productivity (WP) in the apple–soybean alley cropping system was deter-mined as the ratio of the soybean grain yield (GY) to the total water use (TWU), and is expressed in kg/m3 [32]:
W P a = G Y T W U a
W P s = G Y T W U s
In the formula, WPa represents the actual water productivity (kg/m3); WPs represents the simulated water productivity (kg/m3); GY represents the soybean grain yield (kg/hm2).

3. Results

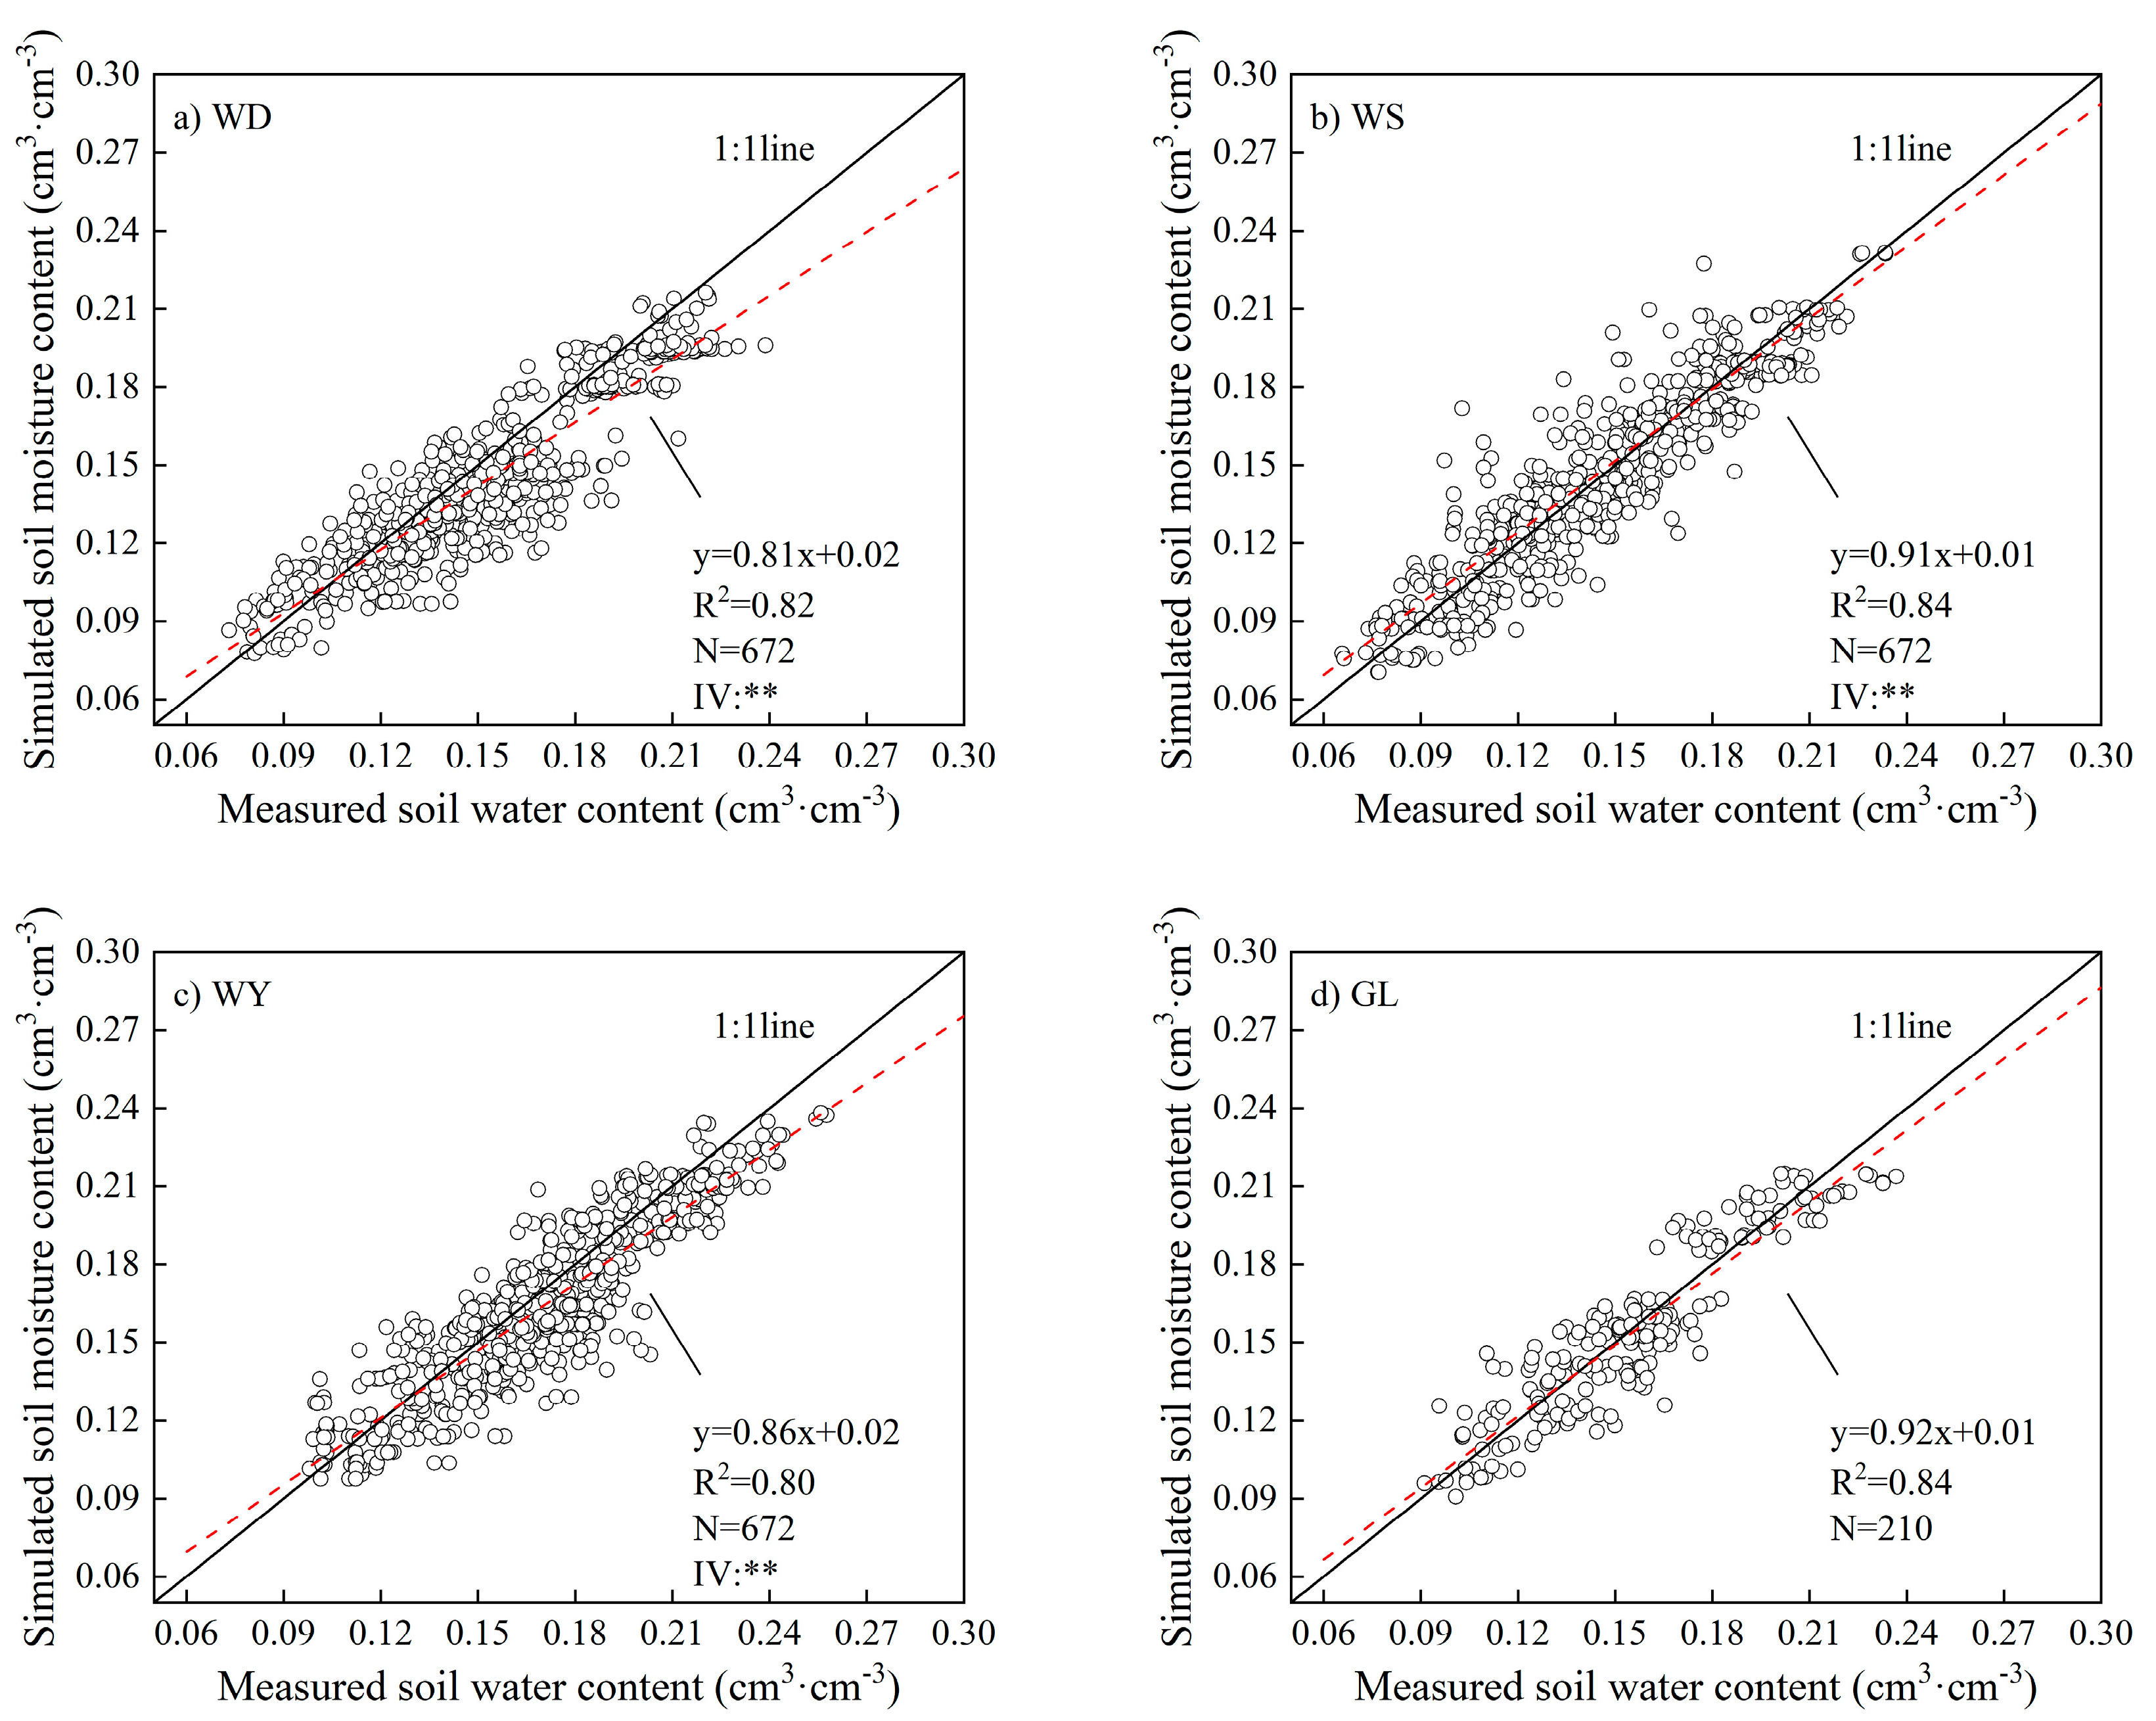
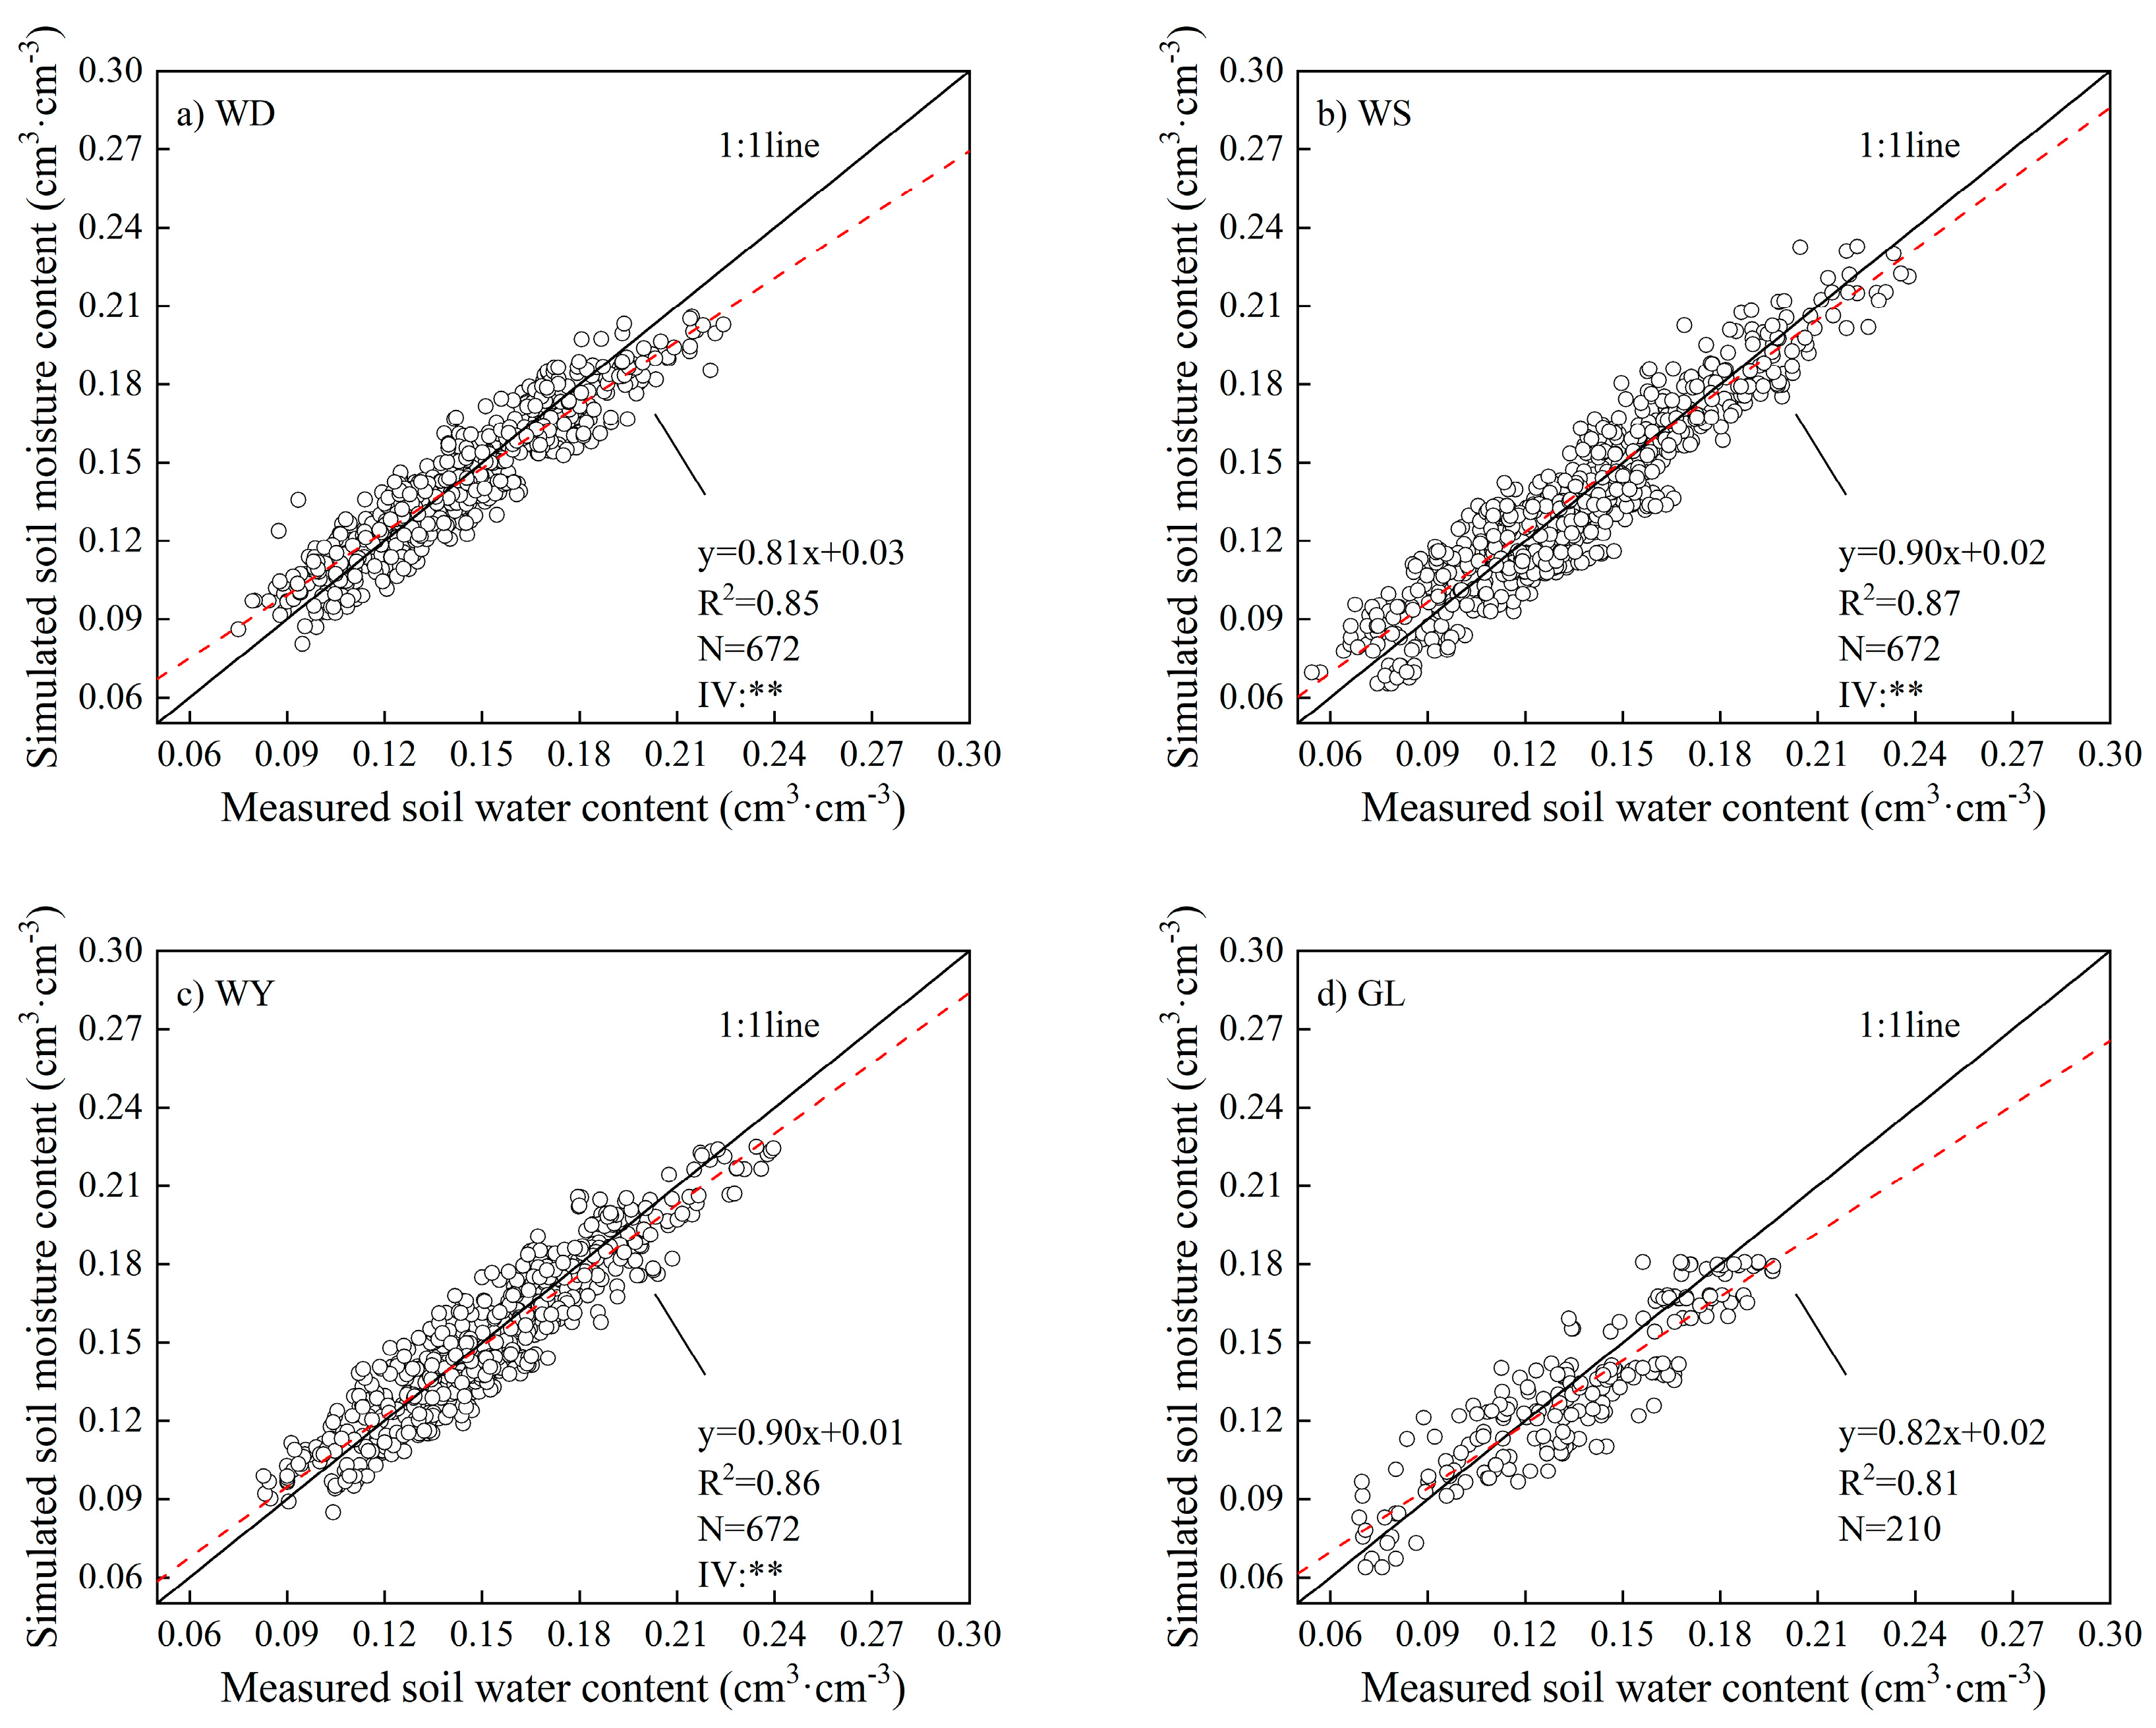
3.1. Model Evaluation

The model parameters were calibrated using experimental data from 2022, and model validation was conducted with experimental data from 2023. The measured and simulated values for different treatments, soil layers, and time points are shown in Figure 7 and Figure 8. For the three irrigation methods—plastic-mulched drip irrigation, subsurface drip irrigation, and bubbler irrigation—each treatment consisted of 672 data points, while the rainwater-harvesting furrow irrigation treatment included 210 data points. As shown in Figure 7 and Figure 8, the simulated values and the measured values are generally distributed on either side of the 1:1 line. In the 2022 experiment, for the different micro-irrigation treatments, the coefficient of determination (R2) ranged from 0.80 to 0.84, the mean relative error (MRE) was between 6.63% and 9.44%, and the root mean square error (RMSE) was between 0.013 and 0.017 cm3/cm3, indicating a high degree of accuracy in the model calibration process. When validating the model using the 2023 experimental data, the corresponding R2 values ranged from 0.81 to 0.87, the MRE values ranged from 6.72% to 9.28%, and the RMSE values ranged from 0.011 to 0.014 cm3/cm3 (Table 5). These results further demonstrate that the model’s predictive ability for 2023 was stable and consistent with the calibration results from 2022, indicating that the model can reliably predict soil moisture movement. Therefore, the HYDRUS-2D-based soil moisture transport simulation can accurately reflect the moisture dynamics in the fruit tree alley cropping system under different irrigation treatments, meeting the experimental requirements.

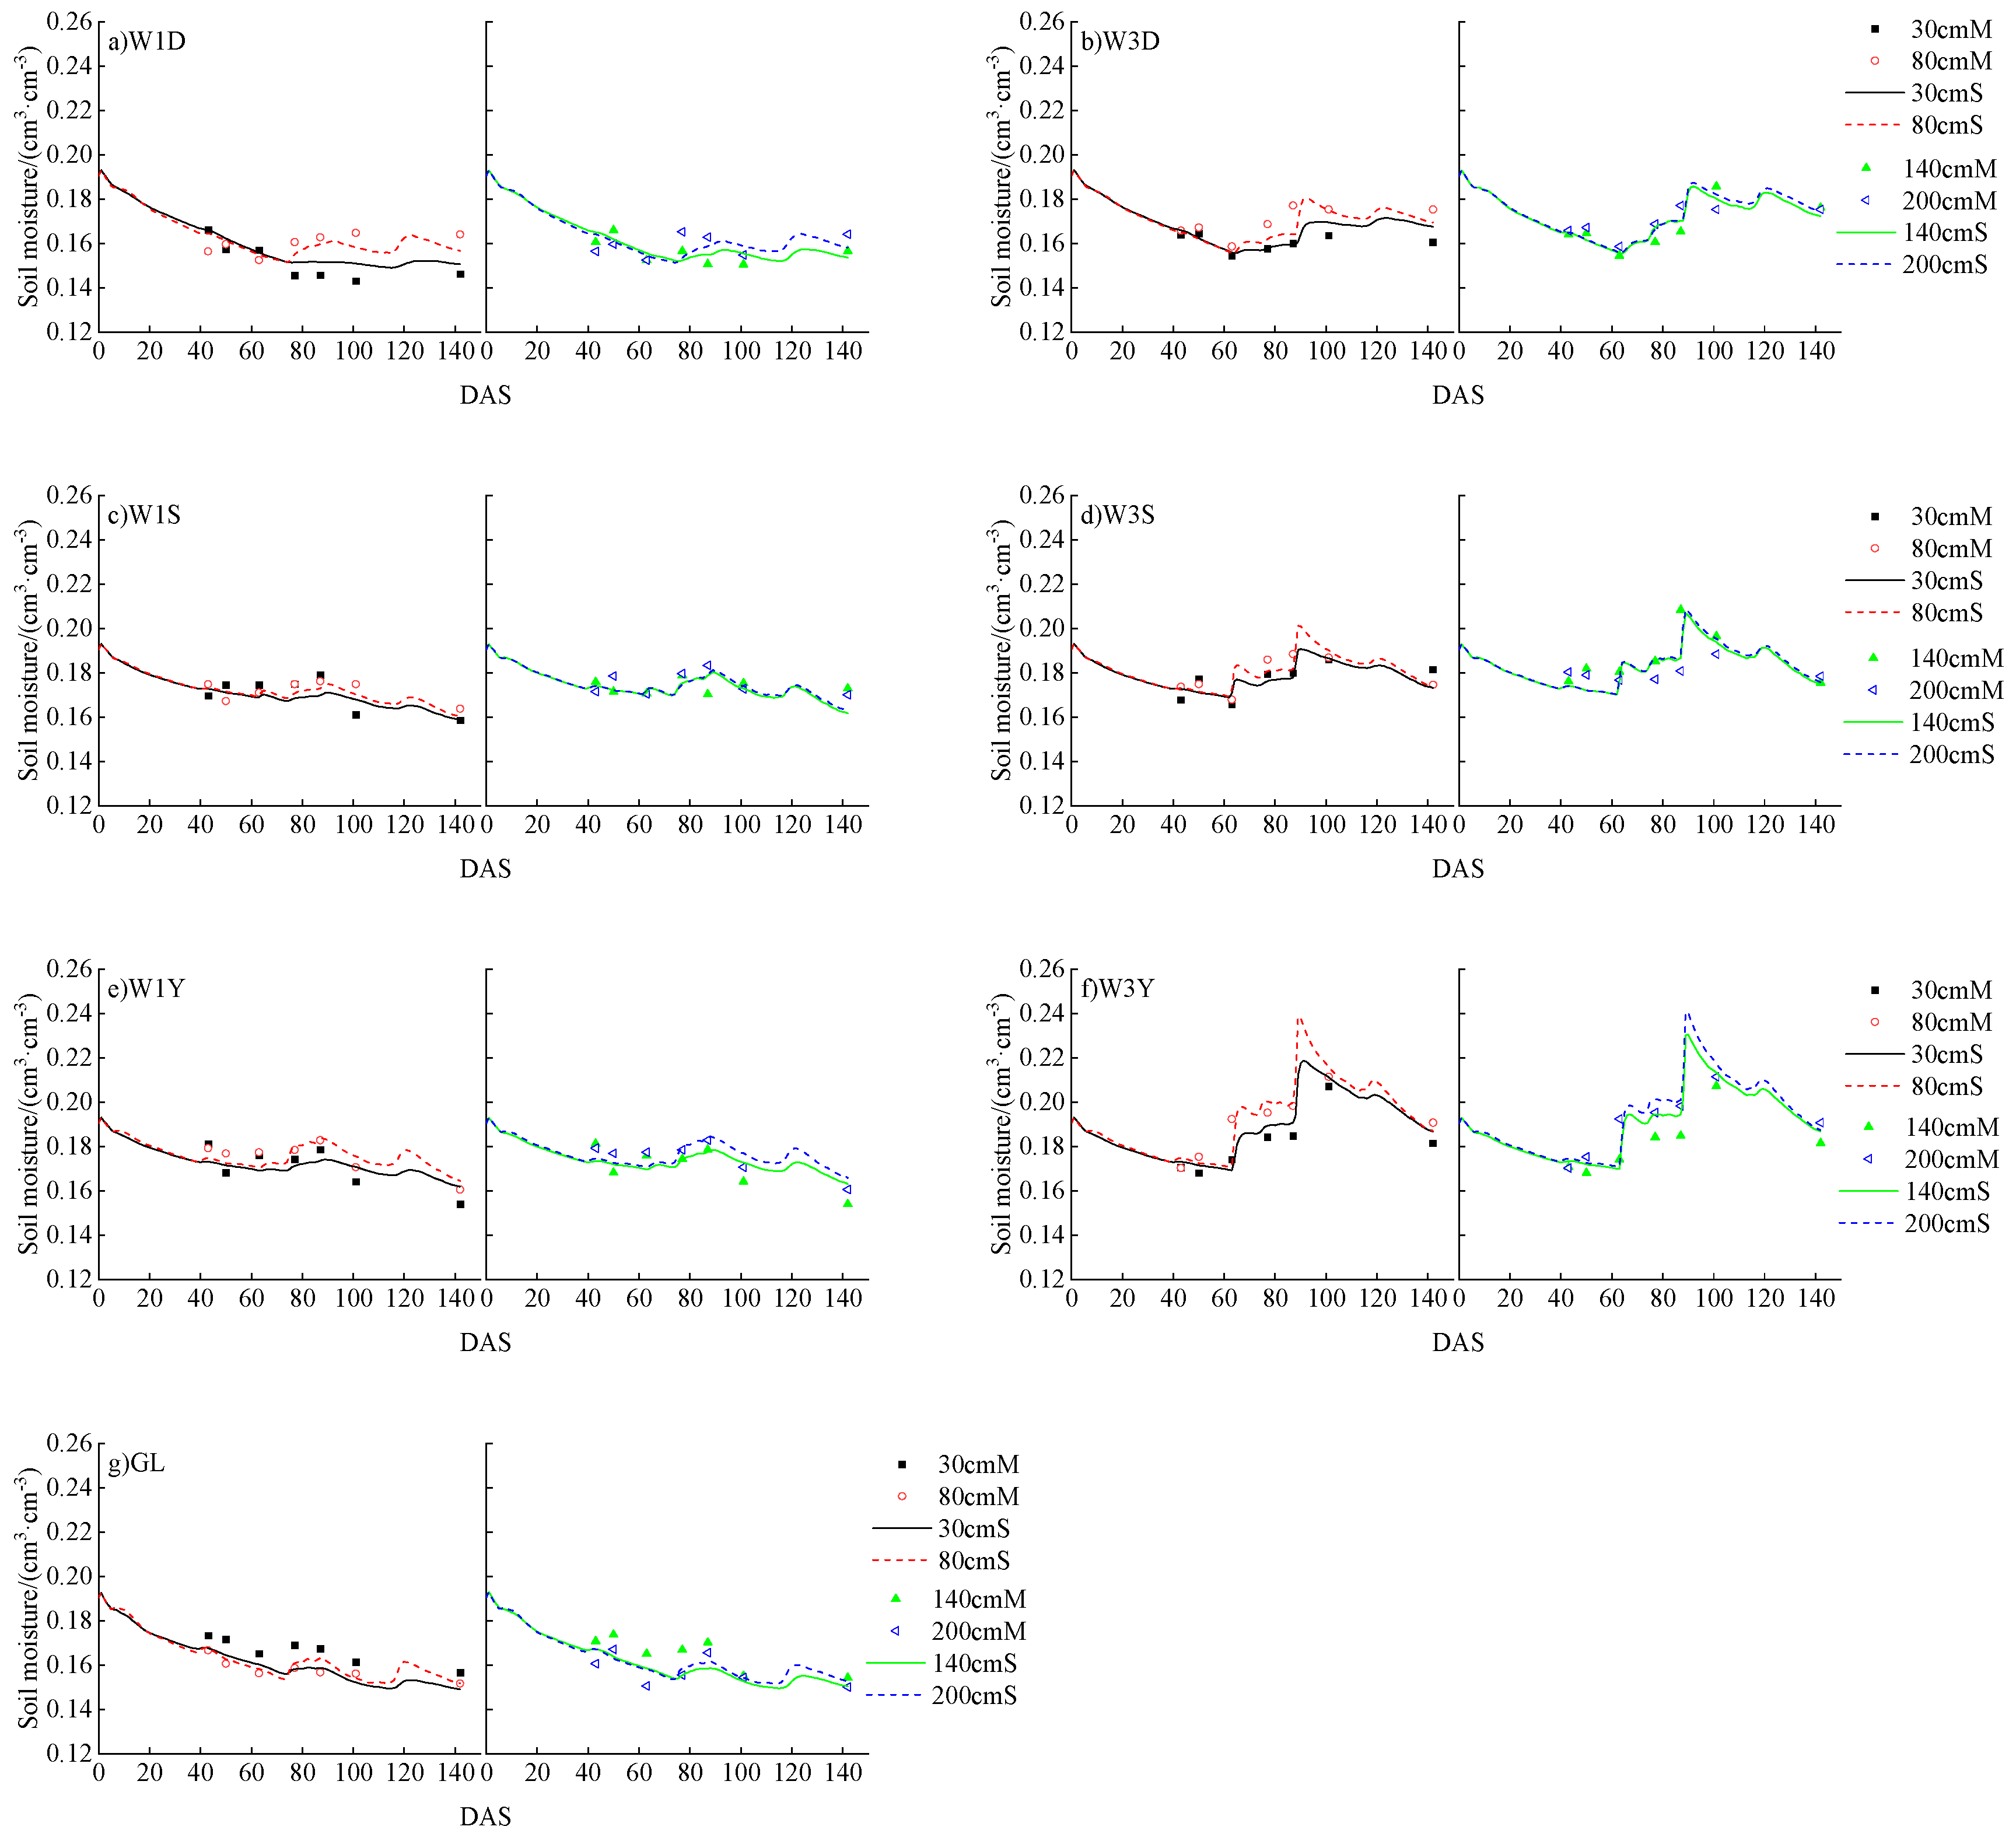
3.2. Water Content Dynamics at Different Depths in the Apple–Soybean Alley Cropping System

The dynamic changes in soil moisture under different irrigation methods and irrigation amounts in the apple–soybean alley cropping system for 2022 and 2023 are presented, covering the average moisture content at different depths (0–20 cm, 20–40 cm, 40–80 cm, 80–120 cm) (Figure 9 and Figure 10). For the 0–40 cm soil layer, 10 cm and 30 cm depths were selected as representative data points. In the 40–120 cm layer, the 60 cm depth served as the representative value, while for the 80–120 cm sublayer, the 100 cm depth was chosen. For rainwater-harvesting gutter irrigation (GL), soil moisture data from the 10–20 cm layer were adopted due to missing measurements in the 0–10 cm layer at 30 cm from the tree trunk and the 10 cm layer at 140 cm from the trunk. By comparing the simulated and measured values, the effects of different irrigation methods on the soil moisture distribution in the apple–soybean alley cropping system and the model fitting accuracy were revealed. Mulched drip irrigation mainly affected the surface soil (0–20 cm) in the apple–soybean alley cropping system. The errors between the simulated and measured values for 2022 and 2023 ranged from 0.0001 to 0.0265 cm3/cm3 and from 0.0001 to 0.0190 cm3/cm3, respectively, indicating high accuracy in the simulation of surface soil moisture dynamics. In 2022, the simulated value for the surface soil increased from 0.1086 cm3/cm3 before irrigation to 0.1143 cm3/cm3, with the measured value being 0.1187 cm3/cm3, with a difference of less than 0.0044 cm3/cm3. In 2023, the simulated value increased from 0.1105 cm3/cm3 to 0.1270 cm3/cm3, with the measured value being 0.1260 cm3/cm3. These results show that mulched drip irrigation significantly increased the surface soil moisture but had little effect on the deeper soil (20–120 cm). In 2022, the simulated value for the 20–40 cm soil layer increased slightly from 0.1329 cm3/cm3 to 0.1337 cm3/cm3, with minimal changes in the measured values.
Subsurface drip irrigation significantly improved water replenishment in the deeper soil (20–120 cm) of the apple–soybean alley cropping system. The errors between the simulated and measured values for 2022 and 2023 ranged from 0.0009 to 0.0216 cm3/cm3 and from 0.0002 to 0.0154 cm3/cm3, respectively, indicating high accuracy in simulating deep soil moisture dynamics. In 2022, the simulated value for the 20–40 cm soil layer increased from 0.1510 cm3/cm3 to 0.1638 cm3/cm3, with the measured value being 0.1556 cm3/cm3, showing a difference of 0.0082 cm3/cm3. In 2023, the simulated value increased from 0.1250 cm3/cm3 to 0.1343 cm3/cm3, with the measured value being 0.1373 cm3/cm3, with a difference of 0.0030 cm3/cm3. Subsurface drip irrigation significantly improved deep soil moisture, especially the replenishment effect in the 20–40 cm soil layer.
Bubbler irrigation had the most significant effect on surface soil moisture (0–20 cm) and also had a certain water-replenishing effect on the 20–40 cm soil layer. The errors between the simulated and measured values for 2022 and 2023 ranged from 0.00035 to 0.0190 cm3/cm3 and from 0.0001 to 0.0198 cm3/cm3, respectively. In 2022, the simulated value for the surface soil increased from 0.1337 cm3/cm3 to 0.1949 cm3/cm3, with the measured value being 0.1906 cm3/cm3, showing a difference of 0.0044 cm3/cm3. The simulated value for the 20–40 cm soil layer increased from 0.1564 cm3/cm3 to 0.1799 cm3/cm3, with the measured value being 0.1755 cm3/cm3. In 2023, the trends in surface and 20–40 cm soil moisture were similar to those in 2022, showing the same increasing trend. However, moisture changes in the deeper soil (40–120 cm) were small, which was evident in both years, indicating that the water replenishment effect of bubbler irrigation was mainly concentrated in the surface and middle soil layers.
Rainwater-harvesting ditch irrigation significantly increased the moisture content in the surface and middle soil layers and effectively improved the surface soil moisture content, but the changes in deep soil moisture were small. The errors between the simulated and measured values for 2022 and 2023 ranged from 0.0028 to 0.0154 cm3/cm3 and from 0.0001 to 0.0168 cm3/cm3, respectively, indicating high accuracy in simulating deep soil moisture dynamics. In 2022, the simulated value for the surface soil increased from 0.1300 cm3/cm3 before irrigation to 0.1773 cm3/cm3, while the moisture content in the 20–40 cm soil layer increased from 0.1490 cm3/cm3 to 0.1678 cm3/cm3. In 2023, the simulated value for the surface soil increased from 0.0900 cm3/cm3 to 0.1827 cm3/cm3, while the moisture content in the middle soil layer increased from 0.1223 cm3/cm3 to 0.1528 cm3/cm3. These results indicate that rainwater-harvesting ditch irrigation effectively balances the moisture distribution in the apple–soybean alley cropping system, especially in the surface and middle soil layers.

3.3. Dynamic Characteristics of Soil Water Content Distribution at Different Levels in the Apple–Soybean Alley Cropping System

This study investigated the effects of different irrigation methods (mulched drip irrigation, subsurface drip irrigation, bubbler irrigation, and rainwater-harvesting ditch irrigation) on soil moisture dynamics in the apple–soybean alley cropping system, with a comparative analysis based on simulated and measured data from 2022 and 2023 (Figure 11 and Figure 12). The results indicate that the errors between the simulated and the measured values were as follows: mulched drip irrigation (0.0003–0.0075 cm3/cm3 and 0.0001–0.0118 cm3/cm3), subsurface drip irrigation (0.0042–0.0259 cm3/cm3 and 0.0004–0.0164 cm3/cm3), bubbler irrigation (0.0003–0.0127 cm3/cm3 and 0.0008–0.0118 cm3/cm3), and rainwater-harvesting ditch irrigation (0.0004–0.0114 cm3/cm3 and 0.0002–0.0118 cm3/cm3). These results demonstrate that the model effectively simulates changes in soil moisture in the apple–soybean alley cropping system.
In 2022, soil moisture distribution increased, then decreased, and then increased again as the distance from the apple tree increased. Specifically, at distances of 30 cm, 80 cm, 140 cm, and 200 cm, the moisture content was 0.1717%, 0.1743%, 0.1741%, and 0.1756%, respectively. In 2023, soil moisture increased initially and then stabilized with increasing distance, with moisture content values of 0.1370%, 0.1410%, 0.1450%, and 0.1450%. Although the moisture variation trends differed between 2022 and 2023, in general, the moisture content increased with horizontal distance. The moisture content in 2023 was generally lower than in 2022, which may be related to differences in apple tree root distribution and precipitation.
Different irrigation methods had significant impacts on soil moisture fluctuations in the apple–soybean alley cropping system. In 2022, the fluctuations in moisture content under the four irrigation methods were as follows: mulched drip irrigation (25.17%), subsurface drip irrigation (23.35%), bubbler irrigation (29.19%), and rainwater-harvesting ditch irrigation (25.99%). Bubbler irrigation exhibited the largest moisture fluctuation, while subsurface drip irrigation showed the smallest fluctuation. In 2023, the fluctuations were as follows: mulched drip irrigation (30.30%), subsurface drip irrigation (30.81%), bubbler irrigation (49.44%), and rainwater-harvesting ditch irrigation (16.71%). Bubbler irrigation exhibited larger fluctuations, primarily due to an uneven water distribution and soil moisture retention characteristics. Specifically, bubbler irrigation showed noticeable non-uniformity in moisture distribution, leading to moisture accumulation in some areas and relative dryness in others, causing larger fluctuations.
Additionally, the study found that as the irrigation volume increased, the amplitude of soil moisture fluctuations in the apple–soybean alley cropping system also increased. In 2022, under low water (W1) and high water (W3) treatments, the fluctuation amplitudes were 24.69% and 42.14%, respectively. In 2023, under low and high water treatments, the fluctuation amplitudes were 16.94% and 48.83%, respectively. This trend suggests that under high water irrigation, soil moisture fluctuations significantly increased, while under low water conditions, smaller fluctuations were observed. This phenomenon indicates that under high water irrigation, moisture distribution may become more uneven, leading to increased moisture fluctuations, while low water treatments help maintain relative moisture stability. Therefore, refined irrigation management, particularly in water volume regulation, will help reduce the negative impacts of moisture fluctuations on crop growth, thereby enhancing the crop growth stability and yield.

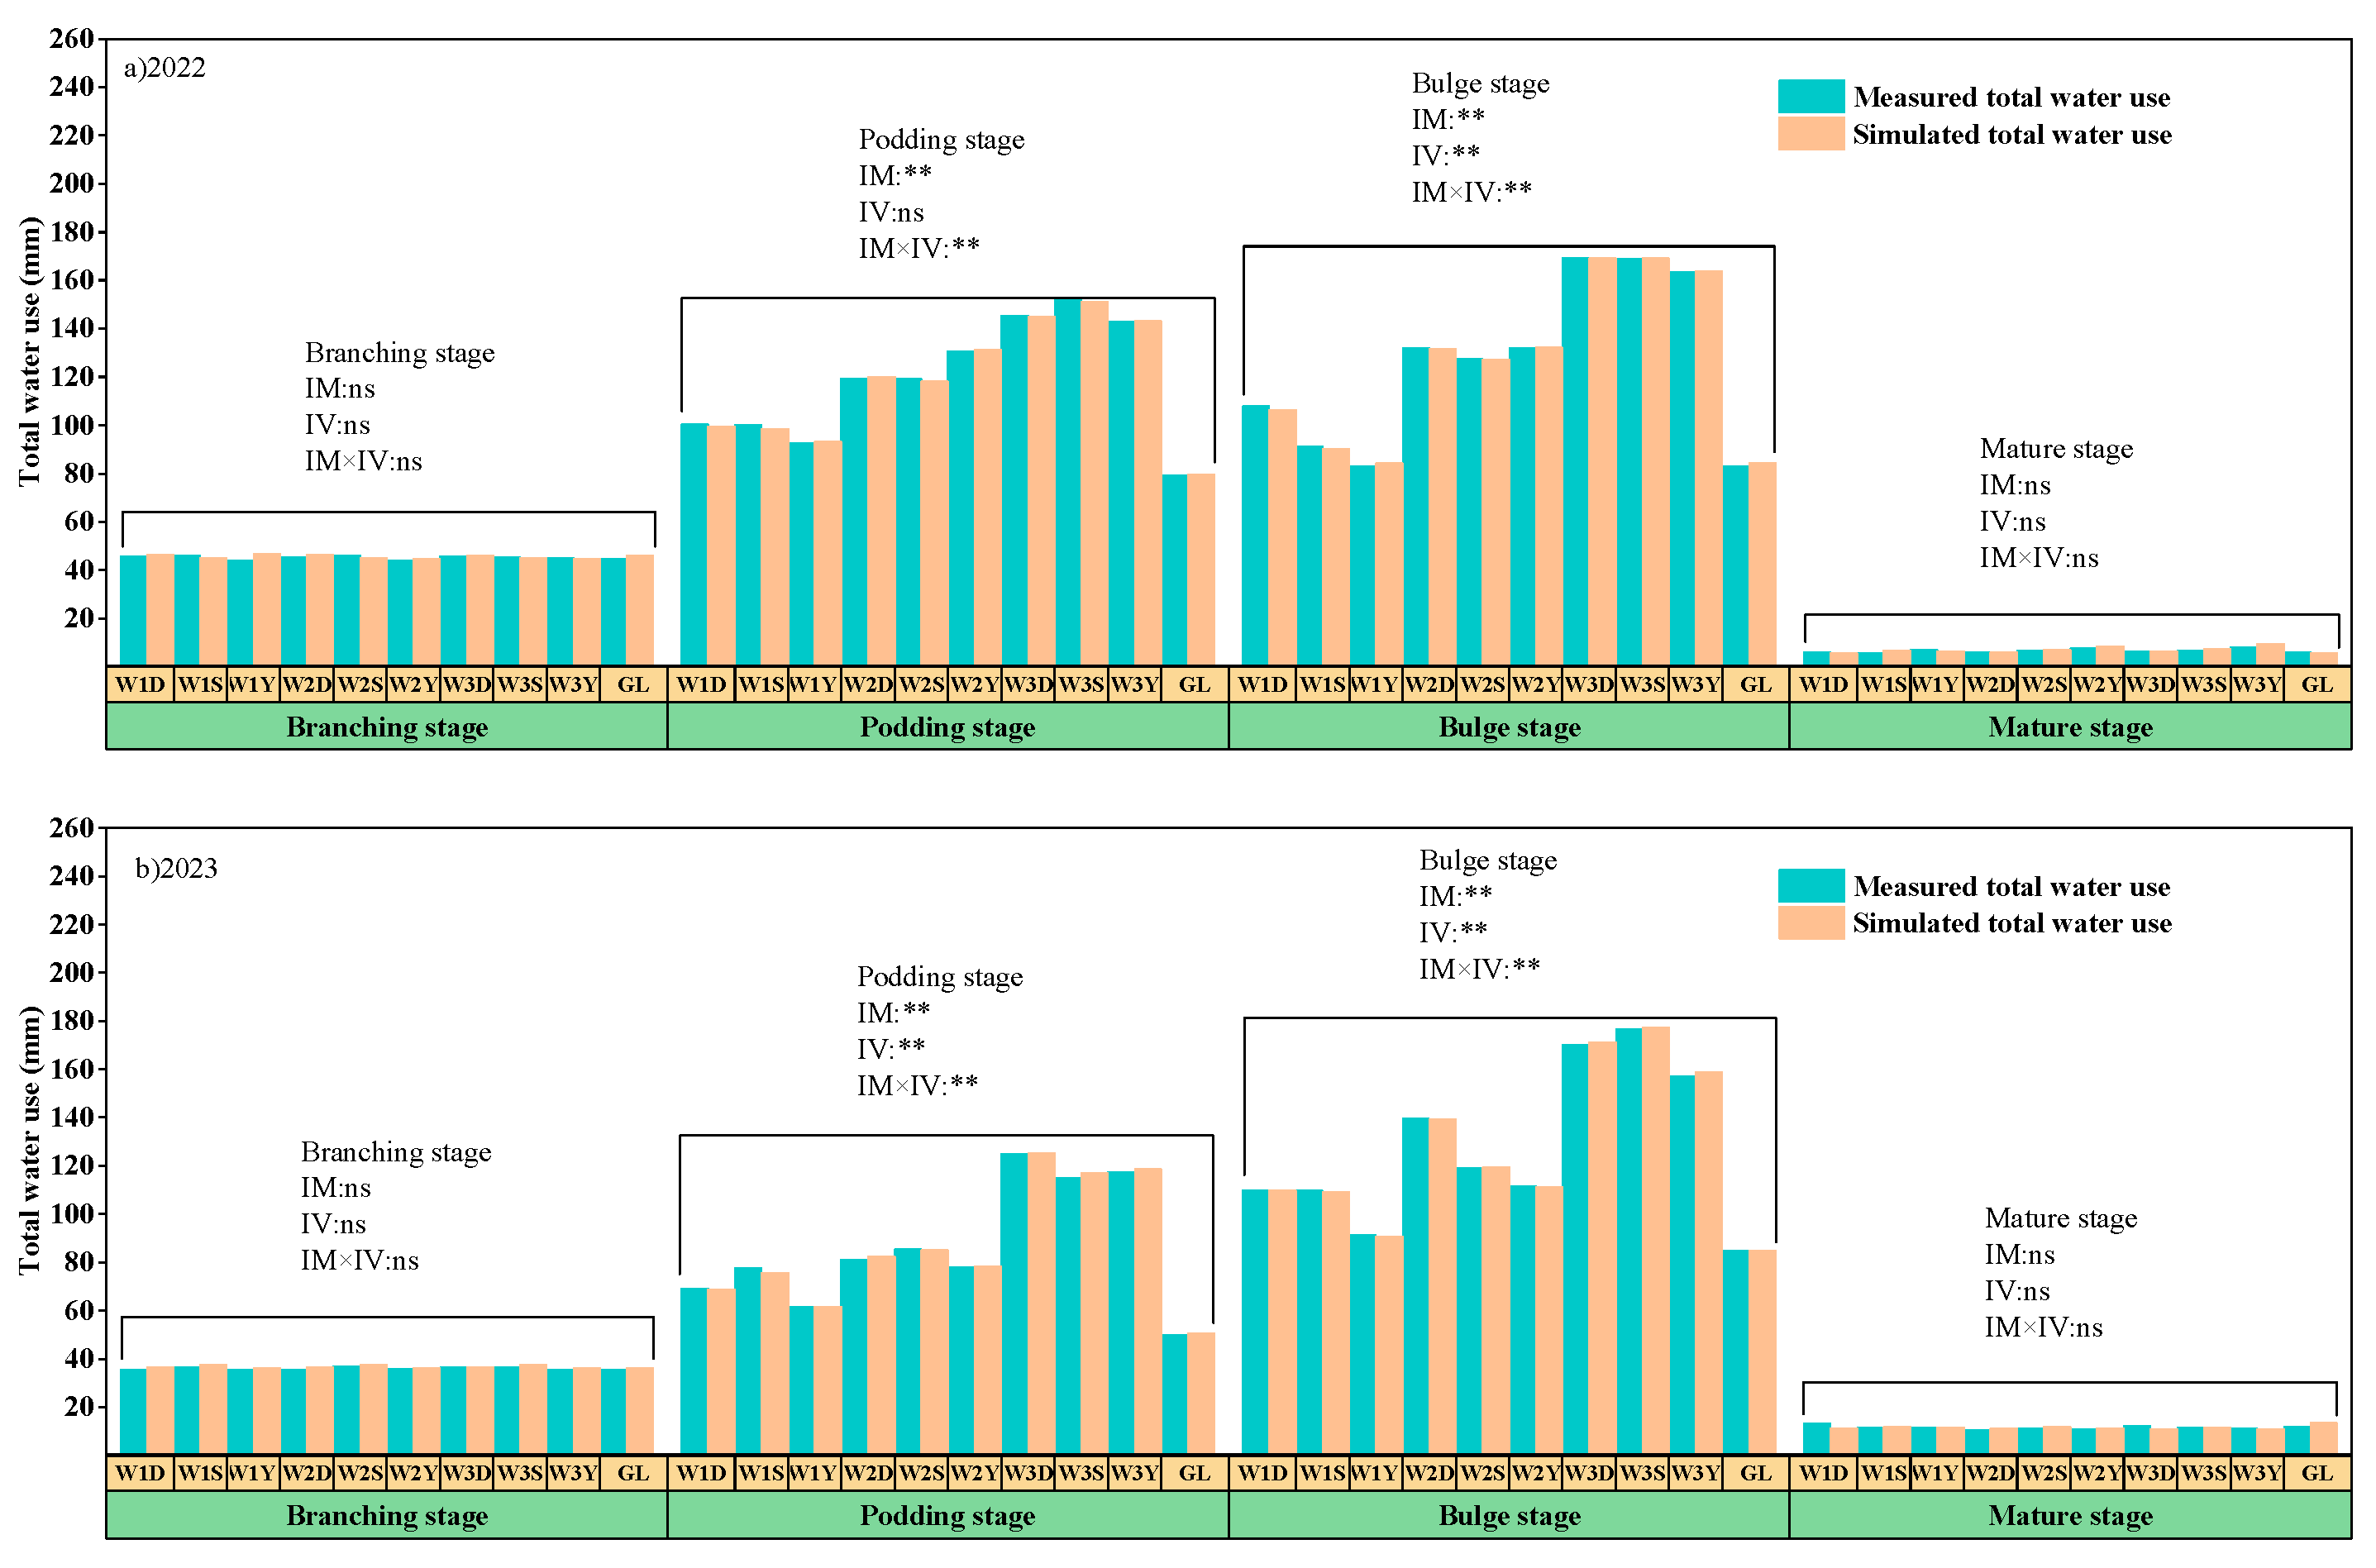
3.4. Water Productivity of Soybean Throughout Its Entire Growing Season in the Apple–Soybean Alley Cropping System

The HYDRUS model demonstrated a high degree of accuracy in simulating water productivity (WP) under most irrigation treatments in the apple–soybean alley cropping system, with a strong agreement between the simulated and the measured values (Figure 13). In 2022, the root mean square error (RMSE) ranged from 0.0026 to 0.0119, indicating minimal simulation errors and high prediction accuracy. For instance, the RMSE values for mulched drip irrigation (WD), subsurface drip irrigation (WS), and rainwater-harvesting ditch irrigation (GL) were 0.0055, 0.0119, and 0.0026, respectively, suggesting high model accuracy in predicting these irrigation methods. The RMSE for bubbler irrigation (WY) was 0.0100, which was slightly higher but still within an acceptable range. The abbreviations WD, WS, and WY represent the mean values of the three different irrigation levels within each treatment. In 2023, model prediction errors increased, with the RMSE expanding to a range of 0.0276–0.1553. For example, the RMSE for WD rose to 0.0606, while that for WS remained relatively low at 0.0276, maintaining a good predictive performance. However, the RMSE for WY and GL increased significantly to 0.1553 and 0.1148, respectively, indicating a decline in accuracy. This deterioration may have been influenced by environmental variations, such as changes in precipitation distribution, which affected soil moisture dynamics.
In 2022, bubbler irrigation (WY) exhibited the highest WP, reaching 4.56 kg/m3, followed by rainwater-harvesting ditch irrigation (GL) at 4.42 kg/m3. The WP values for mulched drip irrigation (WD) and subsurface drip irrigation (WS) were 4.36 kg/m3 and 3.94 kg/m3, respectively. The superior efficiency of PMDI over SII may be attributed to its precise water distribution, whereas the lower efficiency of SII might be due to deep percolation losses, leading to a reduction in effective water utilization. In 2023, the WP improved across all irrigation treatments. Rainwater-harvesting ditch irrigation (GL) achieved the highest WP at 5.96 kg/m3, followed by bubbler irrigation (WY) at 5.71 kg/m3. The WP of mulched drip irrigation (WD) and subsurface drip irrigation (WS) increased to 5.00 kg/m3 and 4.49 kg/m3, respectively. The total water use varied significantly across different growth stages. Due to the non-fruiting state of the 7-year-old apple trees and the early vegetative growth stage of soybeans, the water demand was relatively low. The observed total water use ranged from 33 to 47 mm. However, during the pod-setting and grain-filling stages, the water demand increased substantially. In 2022 and 2023, the recorded total water use ranged from 78 to 152 mm and 48 to 126 mm, respectively, with peak values reaching 170 mm. During the maturity stage, the water demand decreased, with observed values of 5–10 mm in 2022 and 10–14 mm in 2023.
Figure 13 and Figure 14 illustrate the impact of the irrigation volume on the WP and the total water use in the apple–soybean alley cropping system. The medium irrigation level (W2) exhibited the highest WP, whereas the high irrigation level (W3) resulted in the greatest total water use. In 2022, the average WP for W2 was 4.79 kg/m3, with W2D and W2Y achieving 5.00 and 4.87 kg/m3, respectively, outperforming both the low (W1) and high (W3) irrigation levels. In 2023, the WP further increased to 5.56 kg/m3, with W2Y achieving the highest efficiency at 6.57 kg/m3. The total water use patterns (Figure 14) varied significantly based on the growth stage and the irrigation volume. During the pod-setting and grain-filling stages, the W1 treatment exhibited the lowest total water use (91–94 mm in 2022; 70–104 mm in 2023), leading to mild water stress in the soybean. The W2 treatment demonstrated a balanced water supply, with a total water use of 123 mm and 130 mm in 2022 and 82 mm and 123 mm in 2023, contributing to an optimal water balance, thereby enhancing the WP. The W3 treatment exhibited the highest total water use (147 mm and 167 mm in 2022; 119 mm and 168 mm in 2023), but the WP declined, likely due to excessive surface soil moisture.

4. Discussion

4.1. Spatial Dynamics of Water Distribution in the Apple–Soybean Alley Cropping System Based on HYDRUS-2D

This study employed the HYDRUS-2D model to simulate soil moisture dynamics under different irrigation methods. The model demonstrated high accuracy in predicting the soil moisture distribution, with a coefficient of determination (R2) of above 0.80 and a root mean square error (RMSE) of 0.0110–0.0170 cm3/cm3. The results indicate that irrigation methods significantly influence the soil moisture spatial distribution in the apple–soybean alley cropping system. Subsurface drip irrigation effectively improved deep soil moisture (20–40 cm). In 2022, the moisture content in this layer increased from 0.1510 cm3/cm3 to 0.1638 cm3/cm3, and in 2023, it increased from 0.1250 cm3/cm3 to 0.1343 cm3/cm3, ensuring the apple tree root water supply while reducing surface evaporation. Similar studies have reported that subsurface drip irrigation enhances the apple yield and root length density in deep soils, particularly in the 20–40 cm layer [33]. In contrast, bubbler irrigation primarily replenished surface soil moisture (0–20 cm) but also influenced the 20–40 cm layer. In 2022, surface soil moisture increased from 0.1337 cm3/cm3 to 0.1949 cm3/cm3, while moisture in the 20–40 cm layer rose from 0.1564 cm3/cm3 to 0.1799 cm3/cm3, with a similar trend observed in 2023. This irrigation method effectively met the moisture demands of the soybean root zone and benefited the shallow roots of young apple trees. Previous studies have shown that bubbler irrigation forms a semi-ellipsoidal wetting pattern, facilitating deep water infiltration while minimizing evaporation losses [34]. Mulched drip irrigation mainly influenced surface soil moisture (0–20 cm). In 2022, the surface moisture increased from 0.1086 cm3/cm3 to 0.1143 cm3/cm3, and in 2023, it increased from 0.1105 cm3/cm3 to 0.1270 cm3/cm3. While this method efficiently replenished the shallow root zone of soybeans, it was less effective for the deep soil moisture supply required by young apple trees [35]. Rainwater-harvesting ditch irrigation significantly increased the moisture in the surface and middle soil layers, with relatively smaller effects on deep soil. In 2022, surface soil moisture increased from 0.1300 cm3/cm3 to 0.1773 cm3/cm3, while the 20–40 cm layer increased from 0.1490 cm3/cm3 to 0.1678 cm3/cm3. This method improved the water infiltration efficiency, reduced surface runoff, and minimized water wastage, making it suitable for regions with limited or uneven precipitation.
The soil moisture distribution was influenced by the apple tree root system and shading effects. In 2022, as the distance from the apple tree increased, soil moisture first rose, then decreased, and increased again. The moisture content at 30 cm, 80 cm, 140 cm, and 200 cm from the tree was 0.1717%, 0.1743%, 0.1741%, and 0.1756%, respectively, with the highest content at 200 cm. The near-root zone exhibited strong water absorption, leading to lower moisture levels, while further from the roots, moisture increased due to reduced uptake. However, the increased distance also reduced the tree’s shading effect, leading to higher evaporation and moisture decline [36,37,38]. In 2023, lower precipitation intensified apple tree root water absorption, causing greater depletion in the near-root zone. The moisture content at 30 cm was 0.1370%, at 80 cm 0.1410%, and at 140–200 cm around 0.1450%, stabilizing at greater distances. This suggests that water absorption is most pronounced near the root zone, while farther areas experience slower moisture loss due to reduced transpiration effects. Similar findings indicate that root water uptake and transpiration lead to lower near-root moisture while maintaining stable levels further away [39]. Understanding the interactions between apple tree root water uptake, shading effects, and soil moisture distribution is essential for optimizing irrigation strategies and improving water productivity in the apple–soybean alley cropping system.

4.2. Water Use and Irrigation Optimization Strategies in the Apple–Soybean Alley Cropping System Under Different Irrigation Methods and Water Volumes Based on HYDRUS-2D

This study utilized the HYDRUS model to assess the impact of different irrigation methods on water productivity (WP) in the apple–soybean alley cropping system, including mulched drip irrigation (WD), subsurface drip irrigation (WS), bubbler irrigation (WY), and rainwater-harvesting ditch irrigation (GL). In 2022, the model’s simulated WP values were highly consistent with the measured values, with the RMSE values ranging from 0.00256 to 0.01195. The RMSE for WD, WS, and GL were 0.005472, 0.01195, and 0.00256, respectively, while WY had an RMSE of 0.0100, with small errors falling within a reasonable range. In 2023, prediction errors increased, with the RMSE values ranging from 0.0276 to 0.1553, likely due to environmental variations, such as precipitation distribution. Bubbler irrigation showed a superior WP compared to mulched and subsurface drip irrigation in both years. In 2022, the WP for WY was 4.56 kg/m3, approximately 10–20% higher than WD (4.36 kg/m3), WS (3.94 kg/m3), and GL (4.42 kg/m3). In 2023, WY further increased to 5.71 kg/m3, demonstrating its ability to enhance the WP by meeting the crop water demand while minimizing evaporation. However, excessive irrigation led to a declining WP, indicating that an optimal irrigation volume is crucial [40,41]. The medium irrigation treatment (W2) consistently resulted in the highest WP. In 2022, the WP for W2 averaged 4.79 kg/m3, with W2D and W2Y reaching 5.00 and 4.87 kg/m3, respectively. This was significantly higher than the low (W1: 4.35 kg/m3) and high (W3: 3.73 kg/m3) irrigation treatments. In 2023, the WP under W2 increased to 5.56 kg/m3, with W2Y reaching 6.57 kg/m3, outperforming W1 (5.21 kg/m3) and W3 (4.43 kg/m3). During the pod-setting and grain-filling stages, the total water use increased with the irrigation amount. In 2022, the total water use for W1, W2, and W3 was 91 mm and 94 mm, 123 mm and 130 mm, and 147 mm and 167 mm, respectively. In 2023, these values were 70 mm and 104 mm, 82 mm and 123 mm, and 119 mm and 168 mm. The results highlight that a moderate irrigation volume optimizes the balance between the water supply and the demand, enhancing the WP. This study corroborates the findings of Gajić et al. (2018), which demonstrate that, in arid and semi-arid climates, 65% deficit irrigation (I₆₅) significantly reduces non-productive soil evaporation while enhancing the soybean yield and water productivity, with the highest observed water productivity (WP = 0.90 kg/m3) and irrigation water productivity (WPI = 1.08 kg/m3) [42]. Likewise, Wei et al. (2015) found that a 75% field capacity irrigation threshold effectively reduces non-productive evaporation and increases consumptive water productivity (WPET) by 10% compared to the 60% threshold [43]. These studies highlight the critical role of moderate irrigation strategies in optimizing water use efficiency and root water uptake.
In the apple–soybean alley cropping system, moderate irrigation improves the water availability for both apple trees and soybeans while preventing water wastage. Although WY exhibited the highest WP, WS and WD better addressed the water requirements at different soil depths. In 2022, the subsurface drip irrigation system used in this study had a drip tape burial depth of 30 cm, which was adjusted to 20 cm in 2023. The water productivity (WP) at 20 cm was 4.48 kg/m3, significantly higher than the 3.95 kg/m3 at 30 cm. Zheng et al. [44]. (2023) reported that, at a burial depth of 20 cm, the hay yield increased by 1.35% and water productivity improved by 0.89%, with both differences being statistically significant at p < 0.05. Although subsurface drip irrigation was not applied to apple trees in this study, Liu et al. [33]. (2025) found in their two-year field trial in an apple orchard in Shaanxi that subsurface drip irrigation at a depth of 30 cm significantly increased the apple yield (29.37–37.97%) and promoted root development in the 20–40 cm soil layer. Based on previous studies and the root characteristics of apple trees, it is recommended to use a subsurface drip irrigation system with a burial depth of 30 cm for apple cultivation.
This study, by analyzing the dynamic changes in soil moisture at different depths in the apple–soybean alley cropping system and considering the water productivity under different irrigation methods, offers the following recommendations: For young apple trees, it is recommended to use a subsurface drip irrigation system with a depth of 30 cm, as its deeper roots can effectively meet water demands. For soybeans, as a shallow-rooted crop, mulched drip irrigation is recommended, with irrigation during the pod-setting and grain-filling stages. The irrigation amount should be controlled within 75% of the field capacity to promote moisture absorption by the soybean roots, enhance water productivity, and improve the overall efficiency of the alley cropping system.

5. Conclusions

This study evaluated the effects of different irrigation methods and water volumes on soil moisture dynamics and water productivity (WP) in the apple–soybean alley cropping system using HYDRUS-2D. The model demonstrated high simulation accuracy, with R2 values of 0.80–0.87 and RMSE values of 0.011–0.017 cm3/cm3. The irrigation methods significantly influenced the soil moisture distribution. Mulched drip irrigation enhanced surface soil moisture (0–20 cm) but had limited impacts on deeper layers. Subsurface drip irrigation improved moisture in the middle layer (20–40 cm), while bubbler irrigation effectively replenished both the surface and middle layers. Rainwater-harvesting channel irrigation also increased surface- and middle-layer moisture but had minimal impacts on deeper layers.
The WP was highest under bubbler irrigation and rainwater-harvesting ditch irrigation, reaching 5.71 kg/m3 and 5.96 kg/m3 in 2023, respectively. The optimal irrigation volume was 75% of the field capacity (0–60 cm soil layer), with WP values of 4.79 kg/m3 (2022) and 5.56 kg/m3 (2023). Based on the simulation research results, it is recommended that apple tree growers adopt subsurface drip irrigation (at a 30 cm soil layer), and soybean growers use mulched drip irrigation, with timely irrigation during the soybean pod-setting and grain-filling stages. In summary, this study employed the HYDRUS-2D model to simulate the impact of different irrigation methods on soil water dynamics in an apple–soybean alley cropping system, validating the model’s high accuracy and proposing optimized irrigation strategies to improve water productivity (WP). The strengths of this study lie in its efficient water management model and regional applicability; however, it is limited by short-term experiments and the pre-fruiting phase of the apple trees. Future research could expand to multi-region validation, the long-term monitoring of soil water dynamics during tree maturation, and the exploration of smart irrigation technologies and new WP indicators.

Author Contributions

Conceptualization, X.Z. and R.W.; methodology, H.D.; software, X.Z.; validation, R.W.; formal analysis, L.W.; investigation, H.D., L.W., L.C., H.Z. and F.Y.; resources, R.W.; data curation, X.Z.; writing—original draft preparation, X.Z.; writing—review and editing, X.Z. and R.W.; visualization, X.Z.; supervision, R.W. and L.W.; project administration, R.W. All authors have read and agreed to the published version of the manuscript.

Funding

This research was funded by the National Natural Science Fund (32271960) and the National Key Research and Development Program of China (2022YFE0115300).

Data Availability Statement

The data presented in this study are available on request from the corresponding author. The data are not publicly available due to ethical restrictions.

Acknowledgments

We are grateful for the support from the Forest Ecosystem Studies, National Observation and Research Station, Jixian, Shanxi, China.

Conflicts of Interest

The authors declare no conflicts of interest.

References

  1. Xie, J.; Wang, L.; Li, L.; Anwar, S.; Luo, Z.; Zechariah, E.; Fudjoe, S.K. Yield, Economic Benefit, Soil Water Balance, and Water Use Efficiency of Intercropped Maize/Potato in Responses to Mulching Practices on the Semiarid Loess Plateau. Agriculture 2021, 11, 1100. [Google Scholar] [CrossRef]
  2. Wang, Z.; Wu, Y.; Cao, Q.; Shen, Y.; Zhang, B. Modeling the coupling processes of evapotranspiration and soil water balance in agroforestry systems. Agric. Water Manag. 2021, 250, 106839. [Google Scholar] [CrossRef]
  3. Sun, Y.; Bi, H.; Xu, H.; Duan, H.; Peng, R.; Wang, J. Below-Ground Interspecific Competition of Apple (Malus pumila M.)–Soybean (Glycine max L. Merr.) Intercropping Systems Based Niche Overlap Loess Plateau China. Sustainability 2018, 10, 3022. [Google Scholar]
  4. Dou, X.; Wang, R.; Zhou, X.; Gao, F.; Yu, Y.; Li, C.; Zheng, C. Soil water, nutrient distribution and use efficiencies under different water and fertilizer coupling in an apple–maize alley cropping system in the Loess Plateau, China. Soil Tillage Res. 2022, 218, 105308. [Google Scholar] [CrossRef]
  5. Wang, L.; Wang, R.; Luo, C.; Dai, H.; Xiong, C.; Wang, X.; Zhang, M.; Xiao, W. Effects of Different Soil Water and Heat Regulation Patterns on the Physiological Growth and Water Use in an Apple–Soybean Intercropping System. Agronomy 2023, 13, 511. [Google Scholar] [CrossRef]
  6. Dou, X.; Wang, R.; Li, C.; Zheng, C.; Zhou, X. Spatial distribution of soil water, plant roots, and water use pattern under different drip fertigation regimes in an apple-soybean intercropping system on the Loess Plateau, China. Agric. Water Manag. 2022, 269, 107718. [Google Scholar] [CrossRef]
  7. Yin, W.; Yu, A.; Guo, Y.; Wang, Y.; Zhao, C.; Fan, Z.; Falong, H.; Chai, Q. Straw retention and plastic mulching enhance water use via synergistic regulation of water competition and compensation in wheat-maize intercropping systems. Field Crops Res. 2018, 229, 78–94. [Google Scholar] [CrossRef]
  8. Gao, Y.; Duan, A.; Qiu, X.; Liu, Z.; Sun, J.; Zhang, J.; Wang, H. Distribution of roots and root length density in a maize/soybean strip intercropping system. Agric. Water Manag. 2010, 98, 99–212. [Google Scholar] [CrossRef]
  9. Zhang, Y.; Sun, Z.; Su, Z.; Du, G.; Bai, W.; Wang, Q.; Wang, R.; Nie, J.; Sun, T.; Feng, C.; et al. Root plasticity and interspecific complementarity improve yields and water use efficiency of maize/soybean intercropping in a water-limited condition. Field Crops Res. 2022, 282, 108523. [Google Scholar] [CrossRef]
  10. Dilla, A.; Smethurst, P.J.; Barry, K.; Parsons, D.; Denboba, M. Potential of the APSIM model to simulate impacts of shading on maize productivity. Agrofor. Syst. 2017, 92, 1699–1709. [Google Scholar] [CrossRef]
  11. Eugenia, G.A.; Angélique, C.; Magali, P.; Romain, B.; Gaëlle, R.; Alejandro, P.J.; Thierry, S.; Benoît, P. Effects of acclimation to long-term shading on photosynthesis in grapevines: Roles of non-structural carbohydrates and stomatal conductance. Physiol. Plant. 2024, 176, e14636. [Google Scholar]
  12. Lin, D.; Jin, Y.; Li, Y. Spatial pattern and water-saving mechanism of wheat and maize under the condition of strip-ridge intercropping. Acta Agric. Boreali-Occident. Sin. 2014, 23, 56–63. [Google Scholar]
  13. Mbangiwa, N.C.; Savage, M.J.; Mabhaudhi, T. Modelling and measurement of water productivity and total evaporation in a dryland soybean crop. Agric. For. Meteorol. 2019, 266–267, 65–72. [Google Scholar] [CrossRef]
  14. Dabach, S.; Lazarovitch, N.; Šimůnek, J.; Shani, U. Numerical investigation of irrigation scheduling based on soil water status. Irrig. Sci. 2013, 31, 27–36. [Google Scholar] [CrossRef]
  15. Simunek, J.; van Genuchten, M.T.; Sejna, M. Development and applications of the HYDRUS and STANMOD software packages and related codes. Vadose Zone J. 2008, 72, 587–600. [Google Scholar] [CrossRef]
  16. Allen, R.G.; Pereira, L.S.; Raes, D.; Smith, M. Crop evapotranspiration: Guidelines for computing crop water requirements, Agricultural and Food Sciences. Environ. Sci. 1998, 300, D05109. [Google Scholar]
  17. Chen, N.; Li, X.; Šimůnek, J.; Shi, H.; Zhang, Y.; Hu, Q. Quantifying inter-species nitrogen competition in the tomato-corn intercropping system with different spatial arrangements. Agric. Syst. 2022, 201, 103461. [Google Scholar] [CrossRef]
  18. Chen, N.; Li, X.; Šimůnek, J.; Shi, H.; Hu, Q.; Zhang, Y. Evaluating soil nitrate dynamics in an intercropping dripped ecosystem using HYDRUS-2D. Sci. Total Environ. 2020, 718, 137314. [Google Scholar] [CrossRef]
  19. Su, K.; Mu, L.; Zhou, T.; Yang, H. Quantifying spatiotemporal transfer of soil water and salt between intercrop root zones under alfalfa/spring wheat strip intercropping based on HYDRUS-2D. Agric. Ecosyst. Environ. 2024, 375, 109172. [Google Scholar] [CrossRef]
  20. Matteau, J.P.; Gumiere, S.J.; Gallichand, J.; Létourneau, G.; Khiari, L.; Gasser, M.O.; Michaud, A. Coupling of a nitrate production model with HYDRUS to predict nitrate leaching. Agric. Water Manag. 2019, 231, 616–626. [Google Scholar] [CrossRef]
  21. Surendran, U.; Chandran, K.M. Development and evaluation of drip irrigation and fertigation scheduling to improve water productivity and sustainable crop production using HYDRUS. Agric. Water Manag. 2022, 269, 107668. [Google Scholar] [CrossRef]
  22. Jia, Q.; Shi, H.; Li, R.; Miao, Q.; Feng, Y.; Wang, N.; Li, J. Evaporation of maize crop under mulch film and soil covered drip irrigation: Field assessment and modelling on West Liaohe Plain, China. Agric. Water Manag. 2021, 253, 106894. [Google Scholar] [CrossRef]
  23. Richards, L. Capillary conduction of liquids in soil through porous media. Physics 1931, 1, 318–333. [Google Scholar] [CrossRef]
  24. van Genuchten, M.T. A closed-form equation for predicting the hydraulic conductivity of unsaturated soils. Soil Sci. Soc. Am. 1980, 44, 892–898. [Google Scholar] [CrossRef]
  25. Giannakoulias, S.; Shringari, S.R.; Liu, C.; Phan, H.A.T.; Barrett, T.M.; Ferrie, J.J.; Petersson, E.J. Rosetta Machine Learning Models Accurately Classify Positional Effects of Thioamides on Proteolysis. J. Phys. Chem. B 2020, 124, 8032–8041. [Google Scholar] [CrossRef] [PubMed]
  26. Han, M.; Zhao, C.; Feng, G.; Yan, Y.; Sheng, Y. Evaluating the effects of mulch and irrigation amount on soil water distribution and root zone water balance using HYDRUS-2D. Water 2015, 7, 2622–2640. [Google Scholar] [CrossRef]
  27. Feddes, R.A.; Kowalik, P.J.; Zaradny, H. Simulation of field water use and crop yield. Soil Sci. 1982, 129, 193. [Google Scholar]
  28. Wesseling, J.G.; Brandyk, T. Introduction of the Occurrence of High Groundwater Levels and Surface Water Storage in Computer Program SWATRE; Institute for Land and Water Management Research (ICW): Wageningen, The Netherlands, 1985. [Google Scholar]
  29. Pereira, L.S.; Paredes, P.; Hunsaker, D.J.; López-Urrea, R.; Mohammadi Shad, Z. Standard single and basal crop coefficients for field crops. Updates and advances to the FAO56 crop water requirements method. Agric. Water Manag. 2021, 243, 106466. [Google Scholar] [CrossRef]
  30. López-Urrea, R.; Oliveira, C.M.; Montoya, F.; Paredes, P.; Pereira, L.S. Single and basal crop coefficients for temperate climate fruit trees, vines and shrubs with consideration of fraction of ground cover, height, and training system. Irrig. Sci. 2024, 42, 1099–1135. [Google Scholar] [CrossRef]
  31. Fernández, J.E.; Alcon, F.; Diaz-Espejo, A.; Hernandez-Santana, V.; Cuevas, M.V. Water use indicators and economic analysis for on-farm irrigation decision: A case study of a super high density olive tree orchard. Agric. Water Manag. 2020, 237, 106074. [Google Scholar] [CrossRef]
  32. Pereira, L.S.; Cordery, I.; Iacovides, I. Improved indicators of water use performance and productivity for sustainable water conservation and saving. Agric. Water Manag. 2012, 108, 39–51. [Google Scholar] [CrossRef]
  33. Liu, J.; Gao, X.; Song, J.; Wen, M.; Wang, J.; Cai, Y.; Zhao, X. Subsurface drip irrigation mitigated greenhouse gas emission and improved root growth and yield in apple in semi-arid region. Agric. Water Manag. 2025, 308, 109290. [Google Scholar] [CrossRef]
  34. Fu, Y.; Cao, Y.; Wang, H.; He, Z.; Wang, S. The effects of different fertilizer rates on water and nitrogen transport characteristics in the wetted body of bubbled-root irrigation. Arab. J. Geosci. 2021, 14, 1876. [Google Scholar] [CrossRef]
  35. Chen, Y.; Zhang, J.; Wang, Z.; Li, H.; Chen, R.; Zhao, Y.; Huang, T.; Luo, P. Influence of Long-Term Mulched Drip Irrigation on Upward Capillary Water Movement Characteristics in the Saline–Sodic Region of Northwest China. Agronomy 2024, 14, 1300. [Google Scholar] [CrossRef]
  36. Raz-Yaseef, N.; Rotenberg, E.; Yakir, D. Effects of spatial variations in soil evaporation caused by tree shading on water flux partitioning in a semi-arid pine forest. Agric. For. Meteorol. 2010, 150, 454–462. [Google Scholar] [CrossRef]
  37. Wang, Y.; Jiang, Y.; Zhao, Y.; Li, X.; Xie, K.; Yan, T.; Wei, T.; Li, P.; Li, H. Modeling the impact of long-term land use changes on deep soil hydrological processes in the Loess Plateau, China. J. Hydrol. 2024, 643, 131944. [Google Scholar] [CrossRef]
  38. Green, S.; Clothier, B. The root zone dynamics of water uptake by a mature apple tree. Plant Soil 1998, 206, 61–77. [Google Scholar] [CrossRef]
  39. Boini, A.; Manfrini, L.; Morandi, B.; Grappadelli, L.C.; Predieri, S.; Daniele, G.M.; López, G. High Levels of Shading as A Sustainable Application for Mitigating Drought, in Modern Apple Production. Agronomy 2021, 11, 422. [Google Scholar] [CrossRef]
  40. Bandala, M.G.; Rovelo, C.O.R.; Bautista-Capetillo, C.; González-Trinidad, J.; Júnez-Ferreira, H.E.; Palestina, M.S.; Martínez, H.P.; de Avila, H.M.; Recendez, M.I.R. Analysis of Irrigation Performance of a Solid-Set Sprinkler Irrigation System at Different Experimental Conditions. Water 2022, 14, 2641. [Google Scholar] [CrossRef]
  41. Hamdy, A. Water use efficiency in irrigated agriculture: An analytical review. ResearchGate 2007, 57, 9–19. [Google Scholar]
  42. Gajić, B.; Kresović, B.; Tapanarova, A.; Životić, L.; Todorović, M. Effect of irrigation regime on yield, harvest index and water productivity of soybean grown under different precipitation conditions in a temperate environment. Agric. Water Manag. 2018, 210, 224–231. [Google Scholar] [CrossRef]
  43. Wei, Z.; Paredes, P.; Liu, Y.; Chi, W.W.; Pereira, L.S. Modelling transpiration, soil evaporation and yield prediction of soybean in North China Plain. Agric. Water Manag. 2015, 147, 43–53. [Google Scholar] [CrossRef]
  44. Zheng, H.; Wang, B.; Cao, X.; Wu, J.; Yan, H.; Tian, D. Optimization of Subsurface Drip Irrigation Schedule of Alfalfa in Northwest China. Water 2023, 15, 2242. [Google Scholar] [CrossRef]
Figure 1. Precipitation and temperature during the soybean growth period in 2022. Note: W1, W2, and W3 represent low (60%), medium (75%), and high (90%) irrigation levels based on field capacity, applied during the pod-setting (2022/7/6) and grain-filling (2022/7/30) stages.
Agronomy 15 00993 g001
Figure 2. Precipitation and temperature during the soybean growth period in 2023. Note: W1, W2, and W3 represent low (60%), medium (75%), and high (90%) irrigation levels based on field capacity, applied during the pod-setting (2023/6/10) and grain-filling (2023/7/10) stages.
Agronomy 15 00993 g002
Figure 3. Schematic of the flow domain and boundary conditions simulated by HYDRUS (2D) in under mulched drip irrigation (WD).
Agronomy 15 00993 g003
Figure 4. Schematic of the flow domain and boundary conditions for 2022 subsurface seepage irrigation (WS) simulation using HYDRUS-2D, with the buried depth of the drip irrigation pipes set at 30 cm. The schematic of the flow domain and boundary conditions for the 2023 subsurface seepage irrigation (WS) simulation using HYDRUS-2D, with the buried depth of the drip irrigation pipes set at 20 cm.
Agronomy 15 00993 g004
Figure 5. Schematic of the flow domain and boundary conditions simulated by HYDRUS (2D) in bubbler irrigation (WY).
Agronomy 15 00993 g005
Figure 6. Schematic of the flow domain and boundary conditions simulated by HYDRUS (2D) in the rainwater-harvesting ditch irrigation treatment (GL).
Agronomy 15 00993 g006
Figure 7. Calibration and validation of observed and simulated water content under (a) mulched drip irrigation (WD), (b) subsurface drip irrigation (WS), (c) bubbler irrigation (WY), and (d) rainwater-harvesting ditch irrigation (GL) in 2022. Note: The red dotted line represents the fitting line between the simulated value and the observed value. ** indicates a highly significant correlation (p < 0.01). IV, the irrigation volume; N, the total number of samples with different irrigation volumes under the same irrigation method.
Agronomy 15 00993 g007
Figure 8. Calibration and validation of observed and simulated water content under (a) mulched drip irrigation (WD), (b) subsurface drip irrigation (WS), (c) bubbler irrigation (WY), and (d) rainwater-harvesting ditch irrigation (GL) in 2023. Note: The red dotted line represents the fitting line between the simulated value and the observed value. ** indicates a highly significant correlation (p < 0.01); IV, irrigation volume. N is the total number of samples with different irrigation volumes under the same irrigation method.
Agronomy 15 00993 g008
Figure 9. A comparison of the simulated and the observed soil water content in the soil profile (0–120 cm) under low (W1), medium (W2), and high (W3) irrigation treatments for mulched drip irrigation (D), subsurface drip irrigation (S), bubbler irrigation (Y), and rainwater-harvesting ditch irrigation (GL) in 2022.
Agronomy 15 00993 g009
Figure 10. A comparison of the simulated and the observed soil water content in the soil profile (0–120 cm) under low (W1), medium (W2), and high (W3) irrigation treatments for mulched drip irrigation (D), subsurface drip irrigation (S), bubbler irrigation (Y), and rainwater-harvesting ditch irrigation (GL) in 2023.
Agronomy 15 00993 g010
Figure 11. Comparison of simulated and observed soil water content under low (W1) and high (W3) irrigation treatments for mulched drip irrigation (D), subsurface drip irrigation (S), bubbler irrigation (Y), and rainwater-harvesting ditch irrigation (GL) at distances of 30 cm, 80 cm, 140 cm, and 200 cm from fruit trees in 2022.
Agronomy 15 00993 g011
Figure 12. Comparison of simulated and observed soil water content under low (W1) and high (W3) irrigation treatments for drip irrigation under mulch (D), subsurface drip irrigation (S), bubbler irrigation (Y), and rainwater-harvesting ditch irrigation (GL) at distances of 30 cm, 80 cm, 140 cm, and 200 cm from fruit trees in 2023.
Agronomy 15 00993 g012
Figure 13. A comparison of the measured and the simulated total water use values of soybean during the growing season in 2022 and 2023. Note: ** indicates a highly significant correlation (p < 0.01); and ns indicates an insignificant correlation (p > 0.05). IM, irrigation method; IV, irrigation volume.
Agronomy 15 00993 g013
Figure 14. Comparing the simulated and measured water productivity values under different irrigation methods and water application amounts in 2022 and 2023, along with the yield data from both years. Note: * indicates a significant correlation (p < 0.05); ** indicates a highly significant correlation (p < 0.01). IM, irrigation method; IV, irrigation volume. The figure shows the significance of water productivity.
Agronomy 15 00993 g014
Table 1. Soil physical properties in the experimental field.
Soil Layer
(cm)
Soil TextureSoil Particle Size Distribution
(%)
Bulk
Density
Field Capacity
SandSiltClay(g·cm−3)(cm3·cm−3)
0–10Sandy loam23.272.54.21.110.28
10–20Loam45.550.54.01.200.28
20–30Loam47.548.93.61.310.26
30–40Loam42.554.52.91.390.26
40–60Loam47.448.13.91.300.27
60–80Loam43.951.84.31.280.26
80–100Loam40.457.42.21.290.27
100–120Loam39.857.13.11.280.27
Table 2. Irrigation time and irrigation amount of different treatments in 2022–2023.
Micro-Irrigation MethodIrrigation VolumeIrrigation Amount/mm
Pod-Setting StageGrain-Filling StagePod-Setting StageGrain-Filling Stage
2022/7/62022/7/302023/6/102023/7/10
DW120.123.819.124.9
W240.149.831.253.9
W365.187.172.285.4
SW119.57.926.223.8
W238.845.835.334.1
W371.287.565.191.9
YW112.30.612.16.0
W249.350.626.625.9
W360.581.061.972.3
GL00000
Table 3. Soil hydraulic parameters for the 0–120 cm soil layer.
Soil Layer
(cm)
Residual Soil Water Content
θr
Saturated Soil Water Content
θs
Shape Parameter
α
Shape Parameter
n
Saturated Hydraulic Conductivity
ks
(cm3·cm−3)(cm3·cm−3)(cm−1)(-)(cm·day−1)
0–100.0510.4400.0201.71100.00
10–200.0540.3930.0052.5380.00
20–300.0530.3710.0111.6960.00
30–400.0540.3530.0091.6450.00
40–600.0530.3740.0111.6270.00
60–800.0510.3710.0231.4074.42
80–1000.0530.37000171.3384.25
100–1200.0500.3740.0111.3486.21
Table 4. Research-derived, locally calibrated, and composite crop coefficients (Kc) for apple, soybean, and an intercropping system across different growth stages.
Growth StageResearch-Based KcLocally Calibrated KcComposite Kc
AppleSoybeanAppleSoybeanAlley Cropping System
Early-season0.430.50.430.50.59
Mid-season0.681.150.71.170.98
Late-season0.41.050.40.980.85
Table 5. RMSE, NSE, and MRE of measured and simulated soil water content (SWC) under mulched drip irrigation (WD), subsurface drip irrigation (WS), bubbler irrigation (WY), and rainwater-harvesting ditch irrigation (GL) during 2022 and 2023.
YearErrorTreatments
WDWSWYGL
2022MAE (cm3·cm−3)0.0140.0110.0140.011
MRE (%)9.446.638.357.30
RMSE (cm3·cm−3)0.0170.0140.0160.013
2023MAE (cm3·cm−3)0.0090.0110.0100.012
MRE (%)6.957.166.729.28
RMSE (cm3·cm−3)0.0110.0130.0120.014
Disclaimer/Publisher’s Note: The statements, opinions and data contained in all publications are solely those of the individual author(s) and contributor(s) and not of MDPI and/or the editor(s). MDPI and/or the editor(s) disclaim responsibility for any injury to people or property resulting from any ideas, methods, instructions or products referred to in the content.

