Abstract
Biochar has gained significant attention for its potential in carbon sequestration, soil health improvement, and crop production sustainability. However, the existing studies predominantly focus on short-term experiments conducted in acidic or neutral soils. This study investigates the long-term effects of biochar application in a calcaric cambisol in a field experiment with four treatments: CK (no fertilizer or biochar), B (only biochar), NPK (chemical fertilizer), and NPKB (combination of chemical fertilizer and biochar). This study assessed soil organic carbon (SOC), sorghum yield, soil bacteria, plant nutrient accumulation in 2020 and 2022, and soil chemical properties after 12 years of consecutive application in 2022. The results revealed a significant increase in SOC due to biochar application in both 2020 and 2022 compared to the treatments without biochar. The 12-year biochar application also significantly enhanced soil total nitrogen (N), available phosphorus (P), and available potassium (K), irrespective of chemical fertilizer application. Notably, sorghum plant N and P accumulation remained unaffected by biochar, and plant N accumulation induced by NPKB was even lower than that of the NPK treatment in 2022. Furthermore, soil bacterial diversity and composition, as well as sorghum yield, showed no significant alterations due to biochar application in both years, despite increased soil nutrient content. These findings affirmed the benefits of carbon accumulation through long-term biochar application in calcaric cambisols, but the positive effects on crop production were found to be negligible.
1. Introduction
Biochar, a by-product derived from the pyrolysis of crop straw or manure in an oxygen-depleted atmosphere, contains a porous carbonaceous structure and a significant presence of functional groups [1]. With its high specific surface area and a diverse array of polar or nonpolar substances, biochar has a strong affinity for inorganic ions, including phosphate and nitrate [2,3]. Over the past decade, biochar has received increasing attention, supported by a substantial body of studies highlighting its role as a multifunctional soil conditioner capable of enhancing soil health and crop production while mitigating greenhouse gas emissions [4,5,6]. The use of biochar solutions was envisioned to contribute to achieving carbon-neutral staple crop production [7] and enhancing green infrastructure [8].
Fresh biochar has the potential for nutrient availability and could release substantial amounts of N, P, and K [9,10]. However, over the long term, the positive effect of biochar on crop yield is diminished [11] or disappears [12]. What is more, the application of biochar may have adverse effects on soil microbiota, earthworms, and the root biomass of rice and tomato plants after a few years [13]. A decline in pore volume was observed in aged biochar compared to fresh biochar after multiple crop cycles [14]. The adverse effects of aged biochar might offset the positive effects of fresh biochar, causing its positive effects on crop growth to diminish over time with long-term consecutive biochar application. Therefore, the long-term impacts of biochar application significantly differ from its immediate effects. Biochar addition for 1 and 2 years significantly outperformed 5–6 years in enhancing maize yield in a recent report [15]. Nevertheless, the existing studies predominantly evaluated the benefits of biochar through short-time experiments, lacking sufficient evidence to evaluate the influences of long-term (more than 10 years) consecutive biochar application on agricultural production.
Biochar applied at the rate of 5–20 t ha−1 has been associated with a greater crop yield [16]. However, prolonged and consecutive addition of biochar may result in an accumulation of a large amount of biochar in soil, and high biochar rates have been reported to negatively affect rice yield [17,18]. Economic analyses conducted by Robb et al. [19] suggested that combining biochar with fertilizer at low rates is likely the most cost-effective approach for broadacre cropping. A six-year field experiment showed that the crop yield of an annual low-rate biochar application pattern exceeded that of a high single dose [20]. Therefore, comprehensive evaluations of the effects of biochar at low rates in long-term field experiments are essential for informed decision-making in agricultural practices.
Numerous studies have reported the positive effects of biochar on agricultural production and soil organic carbon (SOC). A meta-analysis involving 381 datasets worldwide demonstrated that the addition of biochar resulted in a significant increase in crop yield by 14.45%, water use efficiency by 14.28%, and N use efficiency by 13.97% [21]. SOC was increased by 32.9–34.8% in another report after biochar was applied [22]. However, despite the increasing evidence supporting the positive effects of biochar, it is essential to recognize that these impacts on soil and crop yield are influenced by biochar characteristics, soil properties, and agricultural management practices [23]. Among these factors, one study found that soil pH was one of the most important factors determining the effect size of biochar application, as it explained 15.6–22.8% of the variation in the effect size on crop yield [22]. Other studies found that increased soil pH decreased the impact of biochar on crop yield [22,24] and SOC stock [25]. Notably, the majority of the previous studies conducted substantial biochar experiments in soils with acid or neutral pH values, which underscores the need for a better understanding of biochar’s performance under diverse soil conditions, especially in calcaric cambisol with a higher pH [26]. Given the above, it was hypothesized that the long-term consecutive biochar application in soil with a high pH would have negligible effects on crop yield and SOC.
Sorghum, the fifth most extensively cultivated cereal crop globally, is recognized for its exceptional resilience to barren and drought conditions [27]. Therefore, sorghum is considered a vital resource in ensuring food security. This study focused on a long-term field experiment conducted since 2011 in a calcaric cambisol, characterized by a pH value higher than 8, in a semiarid area of north China. The primary objective was to evaluate how long-term biochar application impacted sorghum yield and SOC in the calcaric cambisol, thereby elucidating the long-term effects of biochar application.
2. Methods and Materials
2.1. Site Description and Experimental Design
The long-term field experiment was initiated in 2011 at the Dongyang experimental station (37°33′21″ N, 112°40′2″ E) of the Shanxi Academy of Agricultural Sciences, Shanxi Province, China. The site is situated in a temperate continental monsoon climate zone, experiencing an average annual temperature of 9.7 °C and an average of 441 mm of precipitation per year. This experimental site has a sorghum–maize rotation system, with one year for sorghum and another year for maize. The soil at the site is characterized as a typical calcaric cambisol according to IUSS Working Group WRB [28], containing 25.7% clay, 26.3% silt, and 48.0% sand. Prior to the commencement of the experiment, the 0–20 cm soil pH was 8.5, and the soil total N, soil organic matter, available P, and available K were 0.71 g kg−1, 9.60 g kg−1, 9.48 mg kg−1, and 123.00 mg kg−1, respectively.
The experiment comprised four treatments, each with three replicates (15 × 5 m2 for each plot): neither fertilizer nor biochar (CK), biochar only application (B), chemical fertilizer (NPK), and a combination of chemical fertilizer and biochar (NPKB). Chemical fertilizer was applied in the form of urea (225 kg N ha−1), diammonium phosphate (75 kg P2O5ha−1), and potassium sulphate (75 kg K2O ha−1). The biochar was provided by Shanxi Santianyulong Agriculture Technology Co., Ltd. (Taiyuan, Shanxi Province, China), which was derived from maize straw through a controlled production process at temperatures ranging between 400 and 500 °C. The biochar had a pH of 10.06, with total C and N contents of 56.9% and 0.66 g kg−1, respectively. The available P and K contents of the biochar were 0.69 and 29.3 g kg−1, respectively. Biochar application occurred at a low rate of 4.5 t ha−1 annually during the autumn, following the harvest of the previous crop. All the P and K fertilizers, and 50% of the N fertilizer, were applied during the spring before sowing. The remaining N fertilizer was topdressed at the bolting stage, approximately 2 months later. The cultivar was Jinza 2001 for the years 2020 and 2022, a widely adopted sorghum variety in this region, with a plant density of 120,000 plants ha−1. Notably, the growing season experienced no obvious issues with pests, diseases, or weed infestations.
2.2. Sampling and Measurement
Sorghum grains were harvested at maturity in 2020 and 2022 (2021 planted to maize), followed by air-drying for the determination of grain yield. Concurrently, aboveground sorghum plant and soil samples were collected at the maturity stage in both years. The sorghum plant tissues were ground after drying at 65 °C to a constant weight to determine the N, P, and K contents. The accumulation of N, P, and K was derived from the combination of plant weight and the nutrient content. The soil samples were divided into two parts: the first part was used for the determination of SOC content using the dichromate oxidation method; the other part was transported in an ice box to the laboratory, sieved to less than 2 mm, and frozen at −80 °C for molecular analyses. Following the 2022 sorghum harvest, additional soil samples were collected for soil pH determination (at a 1:2.5 soil–water ratio), total N (using the Kjeldahl acid-digestion method), available P, available K, and NO3−-N measurement, according to the methods described by Sparks et al. [29].
Soil mineralized N over the sorghum growth period was also measured by referring to Raison et al. [30] and Tian et al. [31]. In 2022, on the sorghum sowing day, two PVC pipes (30 cm in height and 10 cm in diameter) were placed adjacent and 10 cm away from the plants for three replications in each plot, with 25 cm of each pipe in the soil and 5 cm in the air. Soil samples were collected to measure inorganic N content (including NO3−-N and NH4+-N) from one pipe on the first day (noted as N1) and the other pipe after 30 days (noted as N2). To avoid rainfall, the pipes were covered by a plastic plate on their tops. The difference in inorganic N by N2 minus N1 was used to illustrate the soil N mineralization over the 30 days. On the 30th day, immediately after the soil sample for N2 was collected, the PVC pipes were taken out from each plot, and two other PVC pipes were placed differently but close to the previous pipes for the subsequent 30-day soil N mineralization measurement. This recycling operation was terminated at sorghum harvest, and the last soil sample for the final-stage N2 was collected on the harvesting day. The total soil N mineralization during the sorghum growth period was the sum of soil N mineralization at each recycle. Both the soil NH4+-N and NO3−-N contents were measured according to the methods described by Sparks et al. [29].
2.3. Genomic DNA Extraction, Amplicon Sequencing, and Bioinformatic Analyses
To extract DNA from the soil samples, we followed the manufacturer’s instructions for the DNeasy Power Soil DNA Isolation kit (Qiagen, Hilden, Germany). We used the primer sets 799F/1193R [32] to amplify the 16S rRNA gene for bacteria. The amplified products were sequenced on the Illumina MiSeq platform (Majorbio, Shanghai, China). After removing the low-quality sequences and singletons, the high-quality sequences were analyzed using the QIIME standard operating procedure [33]. The SILVA (v13.2) database was used to identify bacterial sequences. We identified operational taxonomic units (OTUs) at 97% similarity using UPARSE v7.0.1090 [34], resulting in 12,722 and 13,335 OTUs for bacteria in 2020 and 2022, respectively. To account for variations in sequencing depth across the samples, we resampled 18,077 reads for bacteria per sample.
2.4. Statistical Analyses
The statistical analysis of soil chemical properties, sorghum yield, and nutrient accumulation across different treatments was performed using SPSS 18.0 (SPSS Inc., Chicago, IL, USA) software. Mean comparisons were conducted using the LSD test at the 0.05 level of probability. Three-way and two-way ANOVA were performed with the factorial randomized block design to evaluate the interactions among chemical fertilizer, biochar, and year. We calculated the Simpson index to evaluate soil bacterial alpha diversity and determined significant differences between treatments using Welch’s t-test at p < 0.05. Beta diversity was assessed using weighted UniFrac distance matrices for the bacterial community, and principal coordinates analysis (PCoA) was used for ordination.
3. Results
3.1. SOC and Sorghum Yield
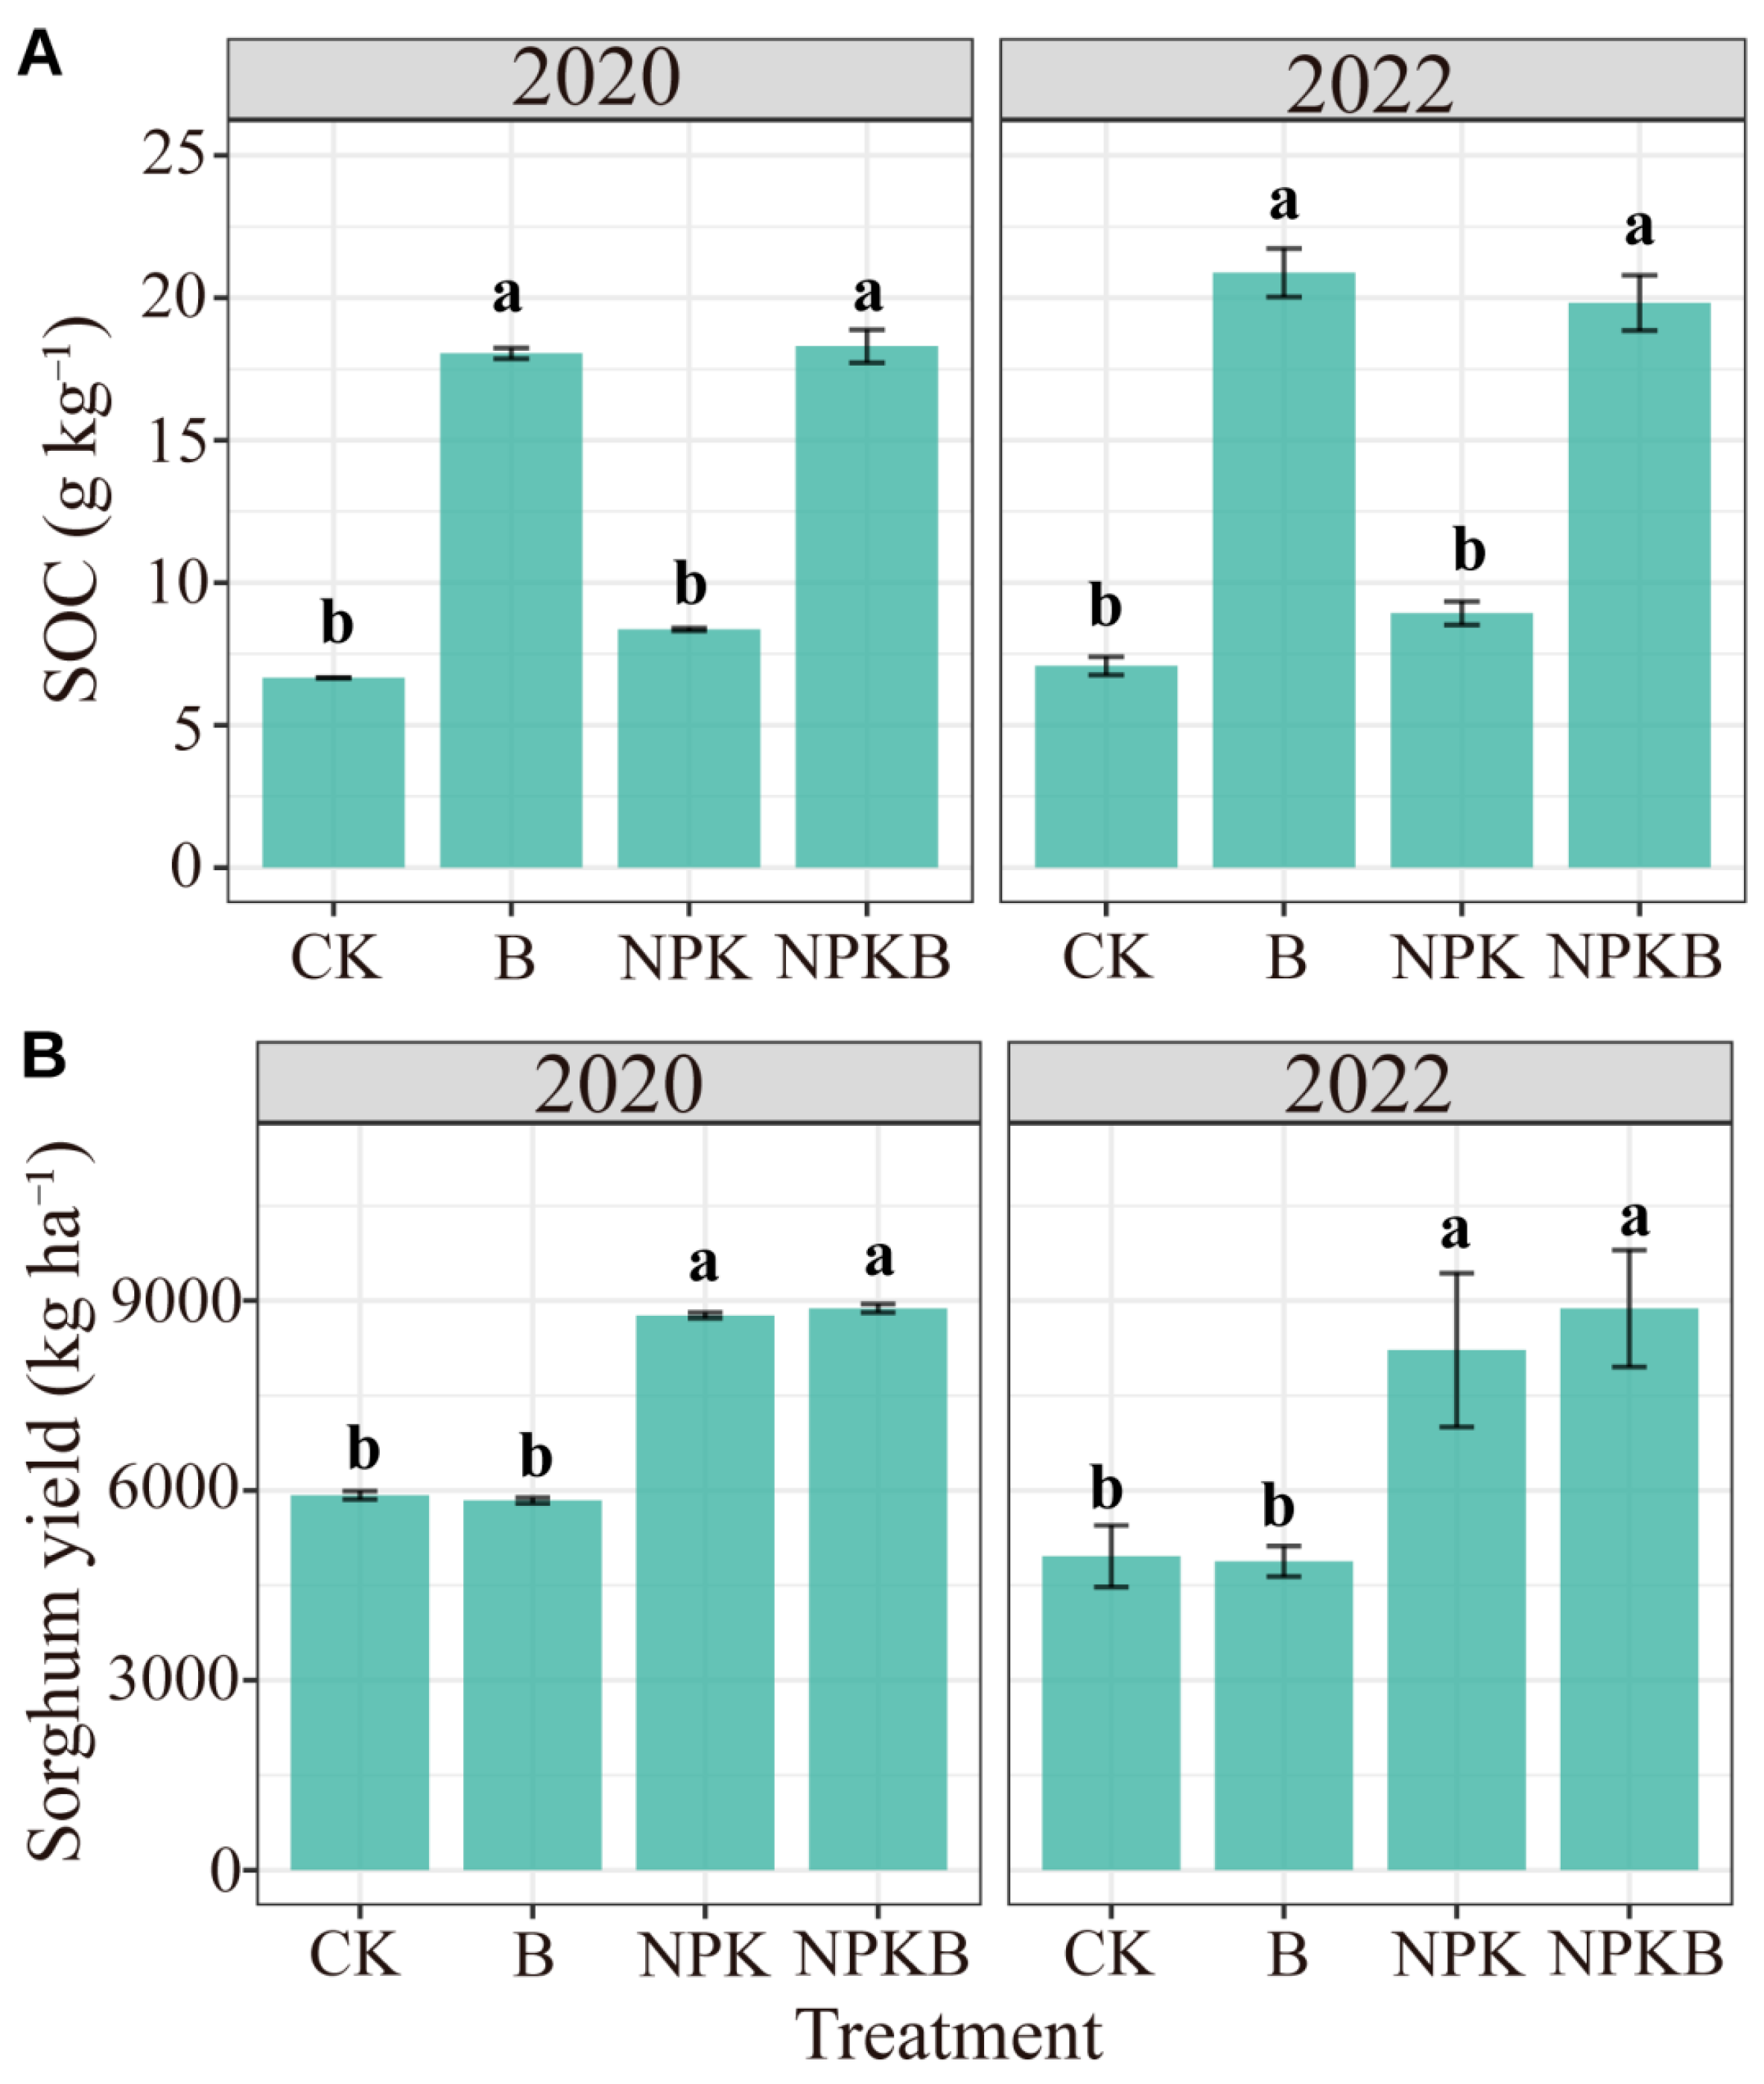
The long-term consecutive application of biochar in the calcaric cambisol significantly increased SOC (Figure 1A). Compared to the CK treatment, the SOC contents in the B treatment increased by 171% and 195% in 2020 and 2022, respectively. The increments reached 119% and 122% in the NPKB treatment compared to the NPK treatment in 2020 and 2022, respectively. The NPK treatment had no significant effects on SOC (Figure 1A). Biochar had no significant effects on sorghum yield in both years, but the addition of chemical fertilizer significantly enhanced the sorghum yield (Figure 1B and Table 1). The percentage of the sum of squares in the ANOVA analysis also showed that the variations in SOC and yield were mainly explained by biochar and fertilizer addition, respectively (Table 1).
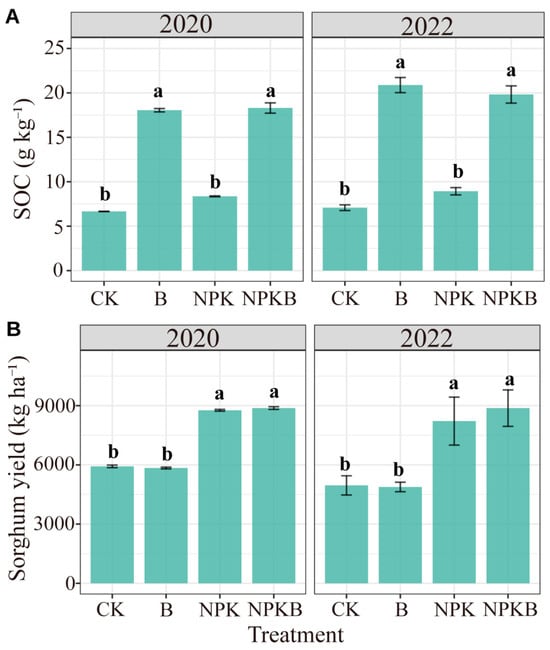
Figure 1.
Effects of long-term biochar and chemical fertilizer application on soil organic carbon (SOC) (A) and sorghum yield (B) in 2020 and 2022. Different letters indicate significant differences among the treatments at the p < 0.05 level.

Table 1.
Three-way ANOVA analysis of SOC, sorghum yield, and nutrient accumulation. The degrees of freedom of each factor were 1. The F value, the percentage of the sum of squares (SS%), and the p value for each factor are presented.
3.2. Diversity and Composition of Bacterial Communities
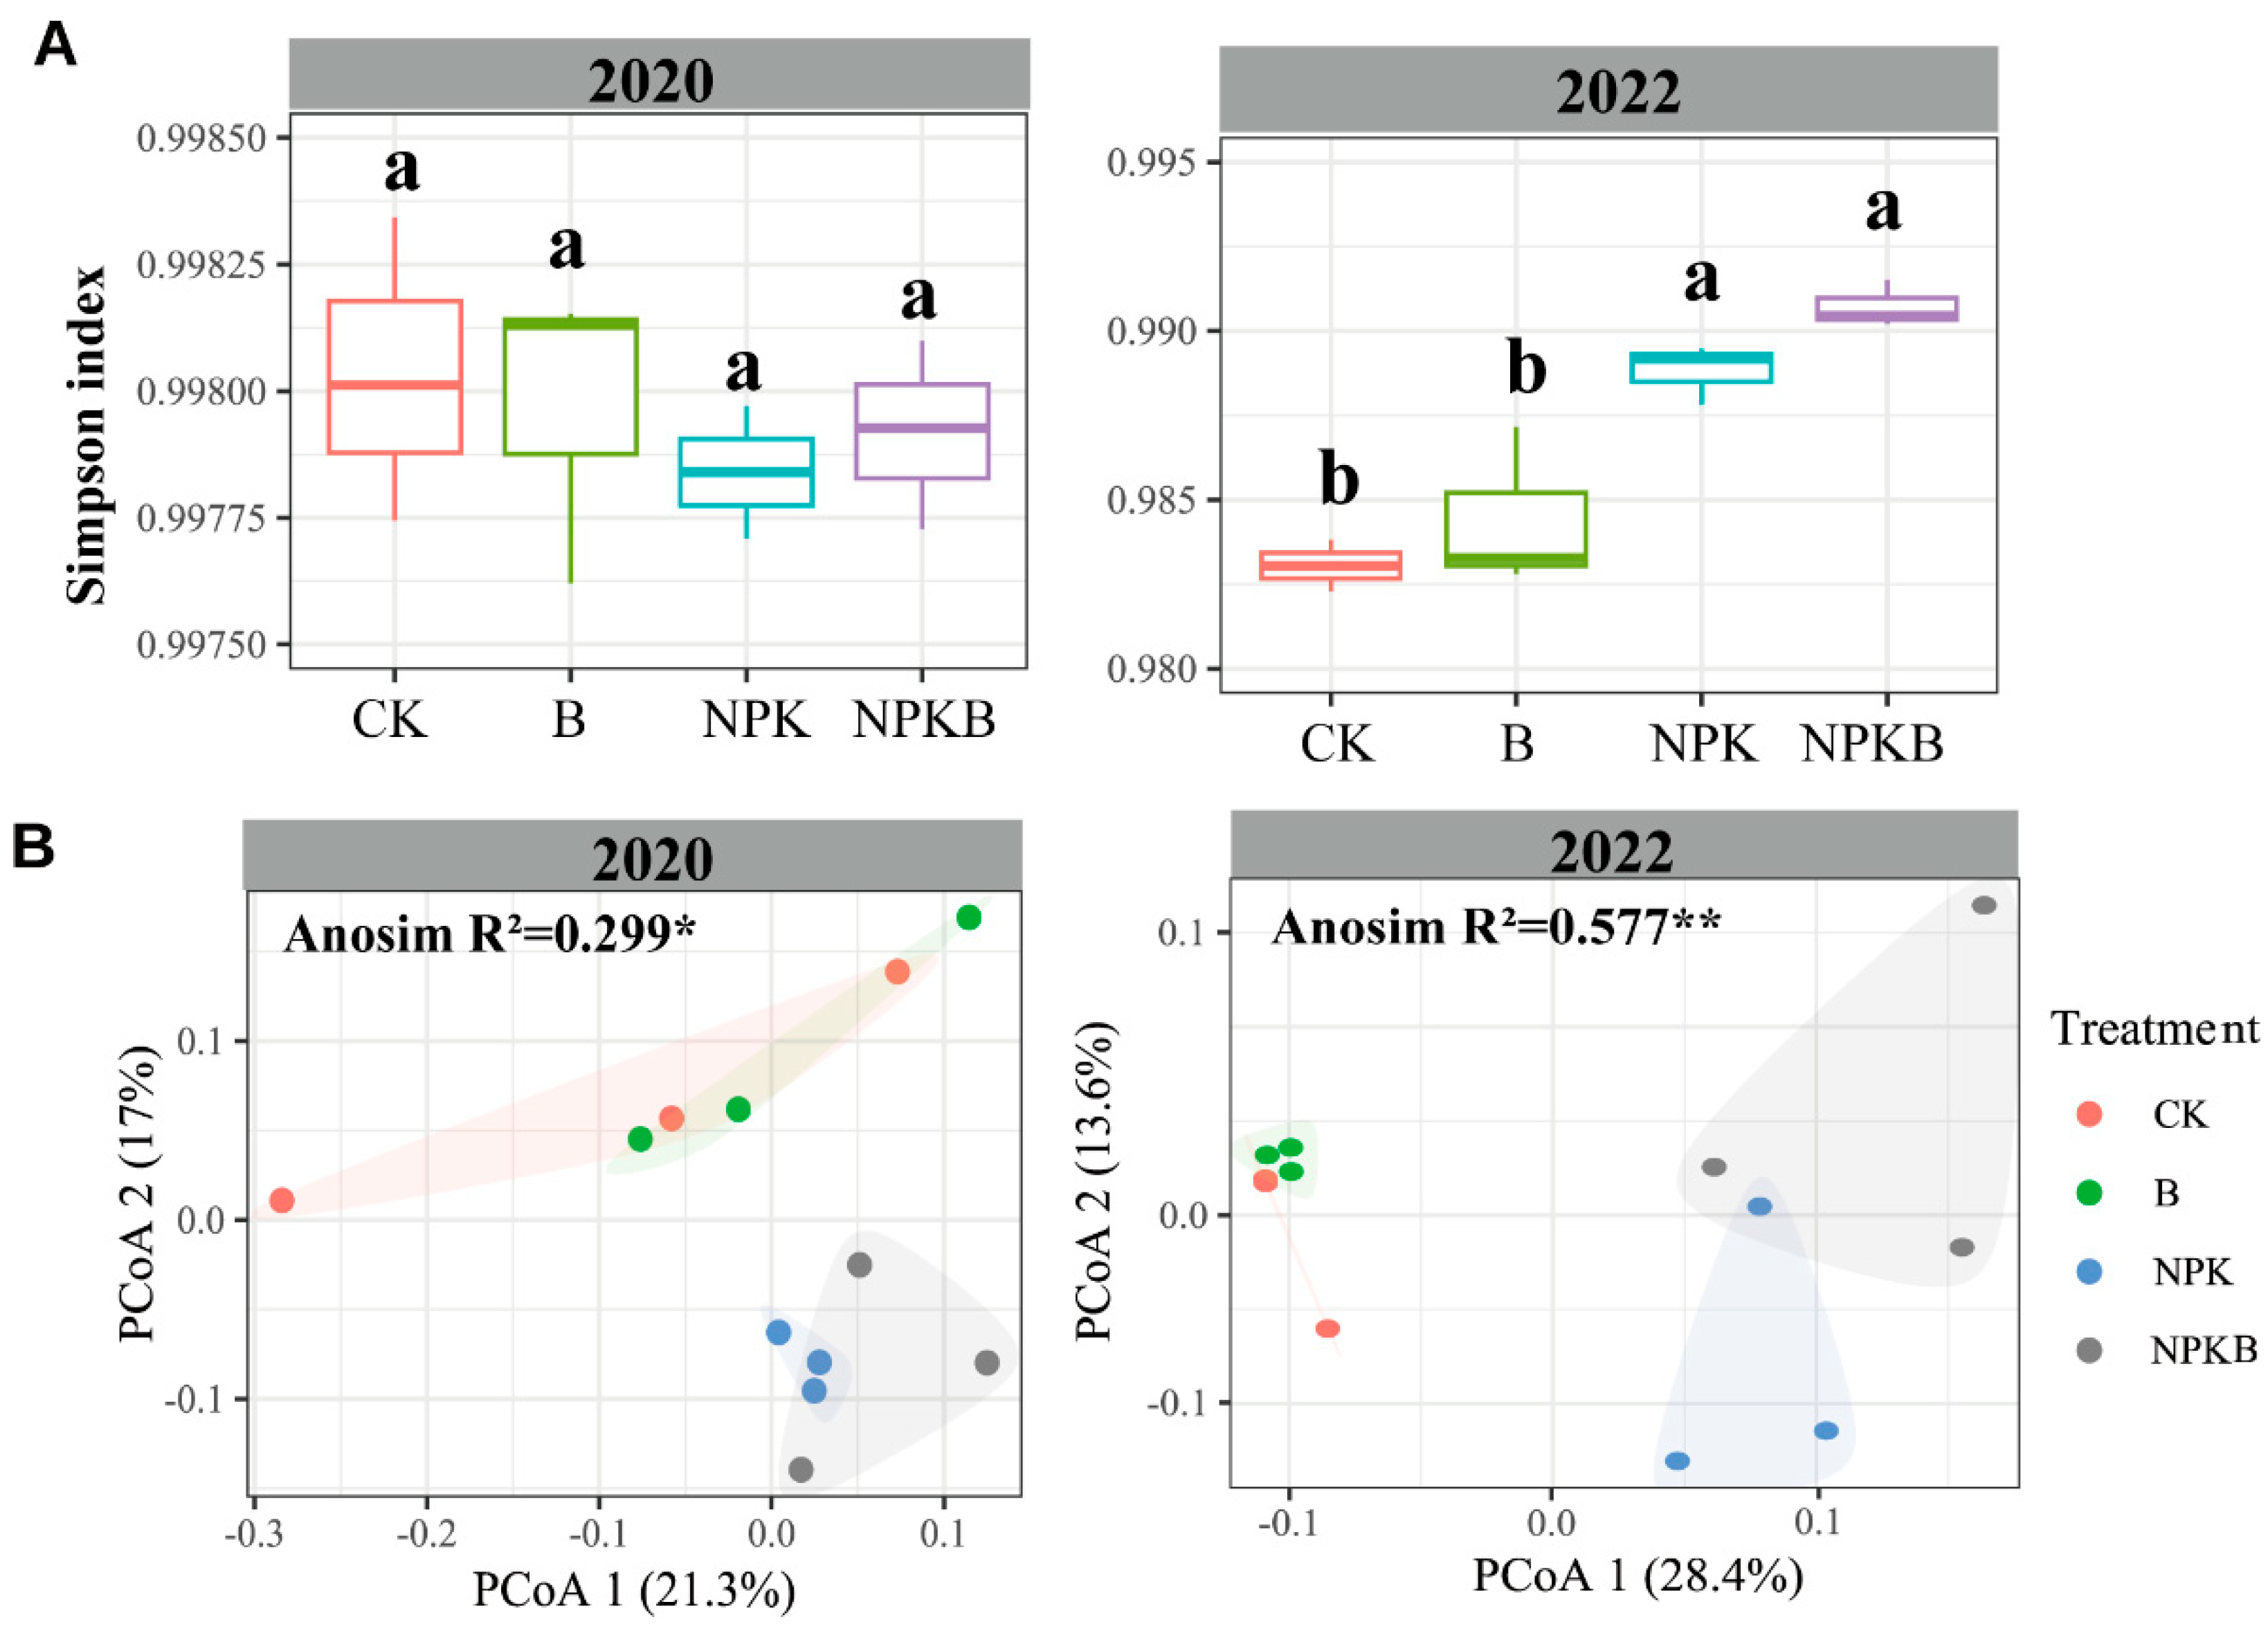
There was no significant difference in the bacterial alpha diversity, represented by the Simpson index, among the four treatments in 2020 (Figure 2A). The Simpson index in the NPK and NPKB treatments was significantly higher than that in the CK and B treatments in 2022. No significant difference in the Simpson index was observed between the CK and B treatments or between the NPK and NPKB treatments (Figure 2A). Obviously, the biochar had no significant effects on the bacterial alpha diversity. The PCoA results revealed no effects of the biochar on the bacterial community composition (Figure 2B). The scatters of bacterial communities in the CK and NPK treatments were closer to the B and NPKB treatments, respectively, and the scatters in the CK and B treatments were far away from the NPK and NPKB treatments (Figure 2B).
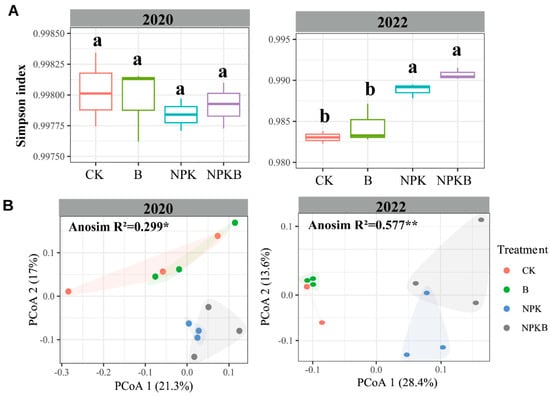
Figure 2.
Changes in the soil bacterial alpha diversity (as measured by the Simpson index) (A) and principal coordinate analysis (PCoA) of the bacterial community based on Bray–Curtis distances (B). The different letters in A indicate significant differences among the varying treatments at the p < 0.05 level. The * and ** in B represent significant difference of community composition at the p < 0.05 and p < 0.01 level, respectively.
3.3. Sorghum Plant N, P, and K Accumulation and Soil Chemical Properties
The biochar application combined with chemical fertilizer enhanced the K accumulation in the plants in both 2020 and 2022, with an increment of 18% and 29% in the NPKB treatment compared to the NPK treatment, respectively (Figure 3C). The biochar had no significant effects on P accumulation, irrespective of the addition of chemical fertilizer (Figure 3B). In 2020, there were no significant effects of the biochar on plant N accumulation, regardless of the chemical fertilizer application. However, in 2022, the N accumulation in the NPKB treatment was significantly lower than that in the NPK treatment (Figure 3A).
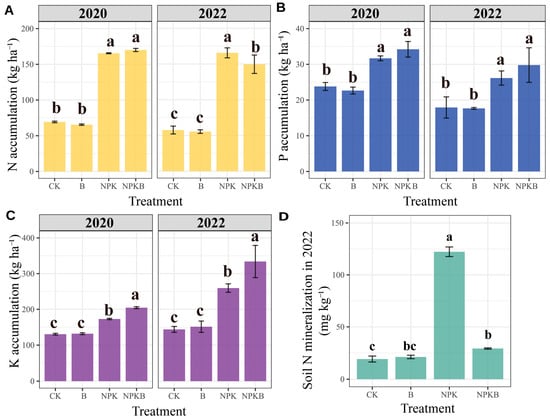
Figure 3.
Effects of long-term biochar and chemical fertilizer application on aboveground sorghum plant N (A), P (B), and K (C) accumulation and the soil N mineralization during the sorghum growth period in 2022 across different treatments (D). Different letters indicate significant differences across the treatments at the p < 0.05 level.
Over the course of 12 years of consecutive application, the biochar induced a significant decrease in soil pH while remarkably increasing the contents of total N, available P, and available K compared to the treatments without biochar (Table 2). The chemical fertilizer application only improved soil available P, available K, and NO3−-N contents relative to those in the CK treatment. Compared to the CK treatment, total N, available P, and available K in the B treatment increased by 49%, 64%, and 145%, respectively. Furthermore, in the NPKB treatment, only the available K increased by 85% relative to the NPK treatment. NO3−-N was lower in the NPKB treatment than in the NPK treatment, but no difference was observed between the B and CK treatments. Obviously, the biochar application had a substantial influence on soil chemical nutrients, especially soil available K, but it decreased NO3−-N (Table 2). The soil N mineralization in the NPK treatment was significantly higher than in the CK, B, and NPKB treatments (Figure 3D). The soil N mineralization was not significantly different between the CK and B treatments, or between treatments B and NPKB. Evidently, the chemical fertilizer increased the mineralized N, but the 12 years of consecutive biochar application diminished mineralization.
Table 2.
Soil chemical properties after biochar application for 12 consecutive years and the two-way ANOVA analysis. The degrees of freedom of each factor were 1. The F value, the percentage of the sum of squares (SS%), and the p value for each factor are presented.
4. Discussion
Biochar, produced under low-temperature (400–700 °C) and low-oxygen conditions, preserves a high C content, typically exceeding 50%, as exemplified by the 56.9% C content in the biochar used in this study. The introduction of these C-rich products into soils has significantly increased SOC levels in diverse soils around the world [25,35,36]. However, the efficacy of biochar in sequestering SOC varies, with studies reporting a more substantial impact in acidic soils than in alkaline soils [25]. This is perhaps because biochar application alleviates soil acidification in acidic soil, which, in turn, stimulates crop growth and thereby biomass-C input [25], coinciding with higher crop yield increases in lower pH [22,24]. In this study, biochar application significantly increased SOC, irrespective of chemical fertilizer application, in a calcaric cambisol (Figure 1A), with the increments ranging from 122% to 195%. The increased SOC can be attributed, in part, to C input contributed by biochar application and biomass-C input. What is more, the efficacy of biochar SOC sequestration was higher under low biochar-C input than high [25]. It is postulated that over the 12 years of low-rate, consecutive biochar application, the efficacy of biochar in sequestering SOC would be relatively high in each year, according to Li et al. [25]; then, a large amount of SOC would accumulate during the long term. On the other hand, biochar application diminished the mineralization of both native and added organic C, which was reported in an 11-year field experiment with a pH value of 8.0 [37]. Therefore, even at the initial soil pH value of 8.5, SOC was significantly increased. For the purpose of C sequestration in soil, biochar is an alternative choice.
While SOC significantly increased following biochar application, the sorghum yield remained unchanged (Figure 1B). This observation suggests that a higher SOC does not necessarily translate to a higher crop yield. This aligns with the findings of Ma et al. [38], who found that crop yields may increase with rising SOC until reaching a threshold value. For wheat, this threshold value for SOC was identified as only 12.7−13.4 g kg−1. Sorghum, known for its exceptional resilience to barren land, might have a low threshold content of SOC to trigger yield improvements. Consequently, although the SOC content increased, the sorghum yield did not exhibit improvement with biochar application.
The soil pH decrease was induced by the 12 years of consecutive biochar application in the calcaric cambisol with a pH value of 8.5, although the biochar pH is 10.06. This coincided with the previous reports [39,40,41,42]. The pH decrease may be attributable to the H+ released from the ion exchange brought about by biochar [43], the increase in acidic functional groups released from biochar [39], the plant uptake of cations promoted by the high CEC of biochar, resulting in H+ release from roots to balance charges [44], and so on. Over the long term, biochar’s effect on soil nutrients was related to the aging process in the soil. After aging, the pore structure of the biochar surface would be damaged, or the holes would be blocked, slowing down nutrient release [45]. More hydrophilic oxygen-containing functional groups could be exposed, increasing the negative surface to absorb ions [46]. In this respect, the available nutrients would be decreased. But the broken biochar fragmentation with aging could lead to an increase in the contact interface with the soil, promoting nutrient release of materials in biochar [47]. In this study, the contents of soil total N, available P, and available K exhibited substantial improvement after 12 years of biochar application, which might be attributed to the large nutrient supply of N, P, and K provided by fresh biochar addition every year [9,10,48], as corroborated by previous studies [4,49]. But the mechanism of the relationship between long-term biochar application and soil fertility is quite complex and needs more attention. The contents of available N, P, and K in biochar are directly associated with its amounts of total N, P, and K [50]. In this study, the application of biochar led to a substantial increase in soil N, P, and K by 20–49%, 14–64%, and 85–145%, respectively, with the most significant increase observed in available K (Table 2). Because maize straw preserves almost 60% of the K in the plant, higher than N and P, and the loss of biochar K was minimal (in the range of 10%) compared to that produced below the temperature of 600 °C [51], the resulting biochar was K-rich and increased soil available K. Previous studies have shown that biochar increased both soil P availability and crop P uptake [45,52]. However, in this study, although the soil available P increased with biochar application (Table 2), the sorghum P accumulations of both years were not enhanced (Figure 3B), which is consistent with the study report by Cheng et al. [53]. This might be due to P absorption by the increase in the interface contact with the soil or a higher abundance of oxygen-containing and organic functional groups over biochar aging [54]. In addition, the coexistence of other ions, for example, Ca2+, could also decrease crop P uptake in this calcaric cambisol.
Aside from the significant increase in the aboveground K accumulation, there was no increase in plant N or P accumulations with biochar application (Figure 3A–C). Moreover, the N accumulation of the NPKB treatment in 2022 was even lower than that of the NPK treatment (Figure 3C). Plant nutrient uptake is known to be influenced by many factors, such as nutrient ion availability, minimum nutrient ion status, etc. Improved soil nutrients do not necessarily contribute to a higher plant nutrient uptake. For plant uptake, soil N should be mineralized to inorganic N (including NH4+ and NO3−), and soil P should be soluble and close to the roots. In this 12-year study, we found that the diversity and composition of the soil bacteria remained unaffected by biochar application (Figure 2). Specifically, the NO3−-N content in the NPKB plot in 2022 post-sorghum harvest was only 5.03 mg kg−1, which was significantly lower than the 14.39 mg kg−1 observed in the NPK plots (Table 2). This coincided with a reduction in N mineralization during the sorghum growing period in the NPKB treatment relative to the NPK treatment (Figure 3D). These findings suggest that biochar in this calcaric cambisol inhibited the soil N supply capacity, especially when chemical N was applied. Considering that N is the limiting factor for sorghum yield in this region [55], the observed decrease in mineralized N, crucial for crop plants, led to insufficient sorghum growth despite a significant increase in total N. Therefore, the sorghum yield was not improved despite the enhanced soil nutrient levels.
The long-term consecutive biochar application with chemical N fertilizer decreased plant N accumulation, implying that biochar inhibits fertilizer N availability in soil. In the plots without chemical fertilizers, the NO3−-N content after the sorghum harvest in 2022 showed no significant difference in the CK and B treatments. Additionally, the N mineralization amount during the sorghum growing period was almost identical, suggesting that biochar did not improve the soil N supply capacity in the low-fertility calcareous soil. Both the soil K content and plant K accumulation were significantly increased by biochar application. Consequently, the application of biochar offers the potential to reduce K fertilizer usage, mitigating potential negative influences on Ca and Mg uptake due to the antagonism of ions.
5. Conclusions
Over the course of 12 consecutive years, the application of biochar derived from crop straw resulted in a remarkable increase in SOC, ranging from 122% to 195%, in the calcaric cambisol with a pH value of 8.5. This prolonged biochar application also led to improvements in soil total N, available P, and available K, coupled with a slight decrease in soil pH. Specifically, the available K was significantly increased by 85–145%. Interestingly, despite these changes, the diversity and composition of the soil bacteria, as well as sorghum plant N and P accumulation, remained unaffected by the biochar treatment, but it significantly increased the plant K accumulation. The biochar treatment did not increase mineralized N during the sorghum growing period, as the application of biochar in the calcaric cambisol together with mineral fertilization had a remarkable negative effect on N mineralization, despite N being introduced through biochar application. Therefore, the long-term application of biochar did not influence sorghum yield, irrespective of the presence or absence of chemical fertilizer. The findings also suggest the potential for reducing K fertilizer application when biochar is utilized.
Author Contributions
Conceptualization, X.J. and H.-W.H.; methodology, Q.L., J.W. and E.D.; software, A.S. and Q.L.; investigation, J.W., E.D., Q.L., Y.W., X.H. and A.S.; data curation, A.S., J.W., E.D., Y.W., X.H. and Q.L.; writing—original draft preparation, Q.L., H.-W.H. and X.J.; writing—review and editing, Q.L., Y.W., X.H., H.-W.H. and X.J.; funding acquisition, Q.L., X.J. and X.H. All authors have read and agreed to the published version of the manuscript.
Funding
This work was supported by the Research Project of Shanxi Agricultural University, under Grant No.2021BQ97, the International Cooperation and Exchanges of Shanxi Province, under Grant No.202204041101001, and the earmarked fund for the China Agriculture Research System, under Grant No.CARS-06-14.5-A20.
Data Availability Statement
The data presented in this study are available upon request from the corresponding author.
Conflicts of Interest
The authors declare that they have no known competing financial interests or personal relationships that could have appeared to influence the work reported in this paper.
Abbreviations
The following abbreviations are used in this manuscript:
| SOC | soil organic carbon |
| N | nitrogen |
| P | phosphorus |
| K | potassium |
| PCoA | principal coordinates analysis |
References
- Lehmann, J.; Joseph, S. Biochar for Environmental Management Science and Technology; Earthscan: London, UK, 2009. [Google Scholar]
- Schmidt, H.P.; Pandit, B.H.; Martinsen, V.; Cornelissen, G.; Conte, P.; Kammann, C.I. Fourfold increase in pumpkin yield in response to low-dosage root zone application of urine-enhanced biochar to a fertile tropical soil. Agriculture 2015, 5, 723. [Google Scholar] [CrossRef]
- Kammann, C.I.; Schmidt, H.P.; Messerschmidt, N.; Linsel, S.; Steffens, D.; Müller, C.; Koyro, H.W.; Conte, P.; Joseph, S. Plant growth improvement mediated bynitrate capture inco-composted biochar. Sci. Rep. 2015, 5, 11080. [Google Scholar]
- Hossain, M.Z.; Bahar, M.M.; Sarkar, B.; Donne, S.W.; Ok, Y.S.; Palansooriya, K.N.; Kirkham, M.B.; Chowdhury, S.; Bolan, N. Biochar and its importance on nutrient dynamics in soil and plant. Biochar 2020, 4, 379–420. [Google Scholar] [CrossRef]
- Bai, J.Z.; Song, J.J.; Chen, D.Y.; Zhang, Z.Z.; Yu, Q.; Ren, G.X.; Han, X.H.; Wang, X.J.; Ren, C.J.; Yang, G.H.; et al. Biochar combined with N fertilization and straw return in wheat-maize agroecosystem: Key practices to enhance crop yields and minimize carbon and nitrogen footprints. Agric. Ecosyst. Environ. 2023, 347, 108366. [Google Scholar] [CrossRef]
- Shrestha, R.K.; Jacinthe, P.A.; Lal, R.; Lorenz, K.; Singh, M.P.; Demyan, S.M.; Ren, W.; Lindsey, L.E. Biochar as a negative emission technology: A synthesis of field research on greenhouse gas emissions. J. Environ. Qual. 2023, 52, 769–798. [Google Scholar] [CrossRef]
- Xia, L.L.; Cao, L.; Yang, Y.; Ti, C.P.; Liu, Y.Z.; Smith, P.; van Groenigen, K.J.; Lehmann, J.; Lal, R.; Butterbach-Bahl, K.; et al. Integrated biochar solutions can achieve carbon-neutral staple crop production. Nat. Food 2023, 4, 236–246. [Google Scholar] [CrossRef]
- Liao, W.X.; Halim, M.A.; Kayes, I.; Drake, J.A.P.; Thomas, S.C. Biochar benefits green infrastructure: Global Meta-analysis and synthesis. Environ. Sci. Technol. 2023, 57, 15475–15486. [Google Scholar] [CrossRef]
- Mukherjee, A.; Zimmerman, A.R. Organic carbon and nutrient release from a range of laboratory-produced biochars and biochar-soil mixtures. Geoderma 2013, 193, 122–130. [Google Scholar] [CrossRef]
- Zheng, H.; Wang, Z.; Deng, X.; Herbert, S.; Xing, B. Impacts of adding biochar on nitrogen retention and bioavailability in agricultural soil. Geoderma 2013, 206, 32–39. [Google Scholar] [CrossRef]
- Anyanwu, I.N.; Alo, M.N.; Onyekwere, A.M.; Crosse, J.D.; Nworie, O.; Chamba, E.B. Influence of biochar aged in acidic soil on ecosystem engineers and two tropical agricultural plants. Ecotoxicol. Environ. Saf. 2018, 153, 116–126. [Google Scholar] [CrossRef]
- Jin, Z.; Chen, C.; Chen, X.; Jiang, F.; Hopkins, I.; Zhang, X.; Han, Z.; Billy, G.; Benavides, J. Soil acidity, available phosphorus content, and optimal biochar and nitrogen fertilizer application rates: A five-year field trial in upland red soil, China. Field Crop. Res. 2019, 232, 77–87. [Google Scholar] [CrossRef]
- Haefele, S.M.; Konboon, Y.; Wongboon, W.; Amarante, S.; Maarifat, A.A.; Pfeiffer, E.M.; Knoblauch, C. Effects and fate of biochar from rice residues in rice-based systems. Field Crop. Res. 2011, 121, 430–440. [Google Scholar] [CrossRef]
- Dong, X.; Li, G.; Lin, Q.; Zhao, X. Quantity and quality changes of biochar aged for 5 years in soil under field conditions. Catena 2017, 159, 136–143. [Google Scholar] [CrossRef]
- Wang, X.; Su, X.; Wang, L.; Li, S.; Chang, M.; Li, Y.; Guan, Y.; Wu, Q.; Zhang, W. Efect of a six-year biochar amendment on water productivity and nitrogen utilization of maize and comprehensive soil fertility. J. Soil Sci. Plant Nutr. 2024, 24, 5661–5679. [Google Scholar] [CrossRef]
- Joseph, S.; Cowie, A.L.; Zwieten, L.V.; Bolan, N.; Budai, A.; Buss, W.; Cayuela, M.L.; Ganber, E.R.; Ippolito, J.A.; Kuzyakov, Y.; et al. How biochar works, and when it doesn’t not: A review of mechanisms controlling soil and plant responses to biochar. GCB Bioenergy 2021, 13, 1731–1764. [Google Scholar] [CrossRef]
- Haider, G.; Steffens, D.; Moser, G.; Muller, C.; Kammann, C.I. Biochar reduced nitrate leaching and improved soil moisture content without yield improvements in a four-year field study. Agric. Ecosyst. Environ. 2017, 237, 80–94. [Google Scholar] [CrossRef]
- An, N.; Zhang, L.; Liu, Y.X.; Shen, S.; Li, N.; Wu, Z.C.; Yang, J.F.; Han, W.; Han, X.R. Biochar application with reduced chemical fertilizers improves soil pore structure and rice productivity. Chemosphere 2022, 298, 134304. [Google Scholar] [CrossRef]
- Robb, S.; Joseph, S.; Abdul Aziz, A.; Dargusch, P.; Tisdell, C. Biochar’s cost constraints are overcome in small-scale farming on tropical soils in lower-income countries. Land Degrad. Dev. 2020, 31, 1713–1726. [Google Scholar] [CrossRef]
- Nan, Q.; Tang, L.; Chi, W.; Waqas, M.; Wu, W. The implication from six years of feld experiment: The aging process induced lower rice production even with a high amount of biochar application. Biochar 2023, 5, 27. [Google Scholar] [CrossRef]
- Han, M.X.; Zhang, J.S.; Zhang, L.; Wang, Z.G. Effect of biochar addition on crop yield, water and nitrogen use efficiency: A meta-analysis. J. Clean. Prod. 2023, 420, 138425. [Google Scholar] [CrossRef]
- Xu, H.; Cai, A.D.; Wu, D.; Liang, G.P.; Xiao, J.; Xu, M.G.; Colinet, G.; Zhang, W.J. Effects of biochar application on crop productivity, soil carbon sequestration, and global warming potential controlled by biochar C: N ratio and soil pH: A global meta-analysis. Soil Till. Res. 2021, 213, 105125. [Google Scholar] [CrossRef]
- Bo, X.; Zhang, Z.; Wang, J.; Guo, S.; Li, Z.; Lin, H.; Huang, Y.; Han, Z.; Kuzyakov, Y.; Zou, J. Benefits and limitations of biochar for climate-smart agriculture: A review and case study from China. Biochar 2023, 5, 77. [Google Scholar] [CrossRef]
- Xu, Z.; Zhou, R.; Xu, G. Global analysis on potential effects of biochar on crop yields and soil quality. Soil Ecol. Lett. 2025, 7, 240267. [Google Scholar] [CrossRef]
- Li, B.Z.; Guo, Y.D.; Liang, F.; Liu, W.X.; Wang, Y.J.; Cao, W.C.; He, S.; Chen, J.S.; Guo, J.H. Global integrative meta-analysis of the responses in soil organic carbon stock to biochar amendment. J. Environ. Manag. 2024, 351, 119745. [Google Scholar] [CrossRef] [PubMed]
- Singh, H.; Northup, B.K.; Rice, C.W.; Prasad, P.V.V. Biochar applications infuence soil physical and chemical properties, microbial diversity, and crop productivity: A meta-analysis. Biochar 2022, 4, 8. [Google Scholar] [CrossRef]
- Gao, C.; Montoya, L.; Xu, L.; Madera, M.; Hollingsworth, J.; Purdom, E.; Singan, V.; Vogel, J.; Hutmacher, R.B.; Dahlberg, J.A.; et al. Fungal community assembly in drought-stressed sorghum shows stochasticity, selection, and universal ecological dynamics. Nat. Commun. 2020, 11, 34. [Google Scholar] [CrossRef]
- IUSS Working Group WRB. World Reference Base for Soil Resources. In International Soil Classification System for Naming Soils and Creating Legends for Soil Maps, 4th ed.; International Union of Soil Sciences (IUSS): Vienna, Austria, 2022. [Google Scholar]
- Sparks, D.L.; Page, A.; Helmke, P.; Loeppert, R.; Soltanpour, P.; Tabatabai, M.; Johnston, C.; Sumner, M. Methods of soil analysis. Part 3. In Chemical Methods; Soil Science Society of America: Madison, WI, USA, 1996. [Google Scholar]
- Raison, R.J.; Connell, M.J.; Khanna, P.K. Methodology for studying fluxes of soil mineral-N in situ. Soil Biol. Biochem. 1987, 19, 521–530. [Google Scholar] [CrossRef]
- Tian, K.; Chang, F.L.; Mo, J.F.; Lu, M.; Yang, Y.X. Application of in-situ technique at field to study the N dynamics of soil. Plant Nutri. Ferti. Sci. 2004, 10, 143–147, (In Chinese with English Abstract). [Google Scholar]
- Kembel, S.W.; O’Connor, T.K.; Arnold, H.K.; Hubbell, S.P.; Wright, S.J.; Green, J.L. Relationships between phyllosphere bacterial communities and plant functional traits in a neotropical forest. Proc. Natl. Acad. Sci. USA 2014, 111, 13715–13720. [Google Scholar] [CrossRef]
- Caporaso, J.G.; Kuczynski, J.; Stombaugh, J.; Bittinger, K.; Bushman, F.D.; Costello, E.K.; Fierer, N.; Pena, A.G.; Goodrich, J.K.; Gordon, J.I.; et al. QIIME allows analysis of high-throughput community sequencing data. Nat. Methods 2010, 7, 335–336. [Google Scholar] [CrossRef]
- Edgar, R.C. UPARSE: Highly accurate OTU sequences from microbial ampliconreads. Nat. Methods 2013, 10, 996–998. [Google Scholar] [CrossRef]
- Sohi, S.P.; Krull, E.; Lopez-Capel, E.; Bol, R. A review of biochar and its use and function in soil. Adv. Agron. 2010, 105, 47–82. [Google Scholar]
- Ding, X.Y.; Li, G.T.; Zhao, X.R.; Lin, Q.M.; Wang, X. Biochar application significantly increases soil organic carbon under conservation tillage: An 11-year field experiment. Biochar 2023, 5, 28. [Google Scholar] [CrossRef]
- Kalu, S.; Seppänen, A.; Mganga, K.Z.; Sietiö, O.M.; Glaser, B.; Karhu, K. Biochar reduced the mineralization of native and added soil organic carbon: Evidence of negative priming and enhanced microbial carbon use efficiency. Biochar 2024, 6, 7. [Google Scholar] [CrossRef]
- Ma, Y.Q.; Woolf, D.; Fan, M.S.; Qiao, L.; Li, R.; Lehmann, J. Global crop production increase by soil organic carbon. Nat. Geosci. 2023, 16, 1159–1165. [Google Scholar] [CrossRef]
- Liu, X.H.; Zhang, X.C. Effect of biochar on pH of alkaline soils in the loess plateau: Results from incubation experiments. Int. J. Agric. Biol. 2012, 14, 745–750. [Google Scholar]
- Serkalem, W.M. Effect of Prosopis juliflora biochar amendment on Some soil properties: The case of Salic Fluvisols from Melkawerer Research Station, Ethiopia. Master’s Thesis, Addis Ababa University, Addis Ababa, Ethiopia, 2015. [Google Scholar]
- Luo, X.; Liu, G.; Xia, Y.; Chen, L.; Jiang, Z.; Zheng, H.; Wang, Z. Use of biochar-compost to improve properties and productivity of the degraded coastal soil in the Yellow River Delta, China. J. Soils Sediments 2017, 17, 780–789. [Google Scholar] [CrossRef]
- Yuan, Y.; Liu, Q.; Zheng, H.; Li, M.; Liu, Y.; Wang, X.; Peng, Y.; Luo, X.; Li, F.; Li, X.; et al. Biochar as a sustainable tool for improving the health of salt-affected soils. Soil Environ. Health 2023, 1, 100033. [Google Scholar] [CrossRef]
- Wang, S.; Gao, B.; Li, Y.; Mosa, A.; Zimmerman, A.R.; Ma, L.Q.; Harris, W.G.; Migliaccio, K.W. Manganese oxide-modified biochars: Preparation, characterization, and sorption of arsenate and lead. Bioresour. Technol. 2015, 181, 13–17. [Google Scholar] [CrossRef]
- Hinsinger, P.; Plassard, C.; Tang, C.; Jaillard, B. Origins of root-mediated pH changes in the rhizosphere and their responses to environmental constraints: A review. Plant Soil 2003, 248, 43–59. [Google Scholar] [CrossRef]
- Yuan, Q.; Gao, Y.; Ma, G.; Wu, H.; Li, Q.; Zhang, Y.; Liu, S.; Jie, X.; Zhang, D.; Wang, D. The long-term effect of biochar amendment on soil biochemistry and phosphorus availability of calcareous soils. Agriculture 2025, 15, 458. [Google Scholar] [CrossRef]
- Mia, S.; Dijkstra, F.A.; Singh, B. Long-term aging of biochar: A molecular understanding with agricultural and environmental implications. Adv. Agron. 2017, 141, 1–51. [Google Scholar]
- Wang, L.; O’Connor, D.; Rinklebe, J.; Ok, Y.S.; Tsang, D.C.; Shen, Z.; Hou, D. Biochar aging: Mechanisms, physicochemical changes, assessment, and implications for field applications. Environ. Sci. Technol. 2020, 54, 14797–14814. [Google Scholar] [CrossRef] [PubMed]
- Spokas, K.A.; Novak, J.M.; Venterea, R.T. Biochar’s role as an alternative N fertilizer: Ammonia capture. Plant Soil 2012, 350, 35–42. [Google Scholar] [CrossRef]
- Zhang, J.; Zhang, L.J.; Qiu, S.J. Biochar amendment benefits 15N fertilizer retention and rhizosphere N enrichment in a maize-soil system. Geoderma 2022, 412, 115713. [Google Scholar] [CrossRef]
- Ding, Y.; Liu, Y.G.; Liu, S.B.; Li, Z.W.; Tan, X.F.; Huang, X.X.; Zeng, G.G.; Zhou, L.; Zheng, B.H. Biochar to improve soil fertility. A review. Agron. Sustain. Dev. 2016, 36, 36. [Google Scholar] [CrossRef]
- Zhao, H.; Song, Q.; Wu, X.; Yao, Q. Study on the transformation of inherent potassium during the fast-pyrolysis process of rice straw. Energy Fuels 2015, 29, 6404–6411. [Google Scholar] [CrossRef]
- Gao, S.; DeLuca, T.H.; Cleveland, C.C. Biochar additions alter phosphorus and nitrogen availability in agricultural ecosystems: A meta-analysis. Sci. Total. Environ. 2019, 654, 463–472. [Google Scholar] [CrossRef]
- Cheng, Y.; Ma, D.; Zhao, J.; Zhang, Q.; Li, X.; Zhao, Y.; Zheng, W.; Zhang, B.; Liu, Z. Biochar application does not improve crop growth and yield in a semi-humid region in the HuangHuaiHai Plain of China: A 7-year consecutive field experiment. Soil Till. Res. 2025, 247, 106367. [Google Scholar] [CrossRef]
- Ghodszad, L.; Reyhanitabar, A.; Maghsoodi, M.R.; Lajayer, B.A.; Chang, S.X. Biochar affects the fate of phosphorus in soil and water: A critical review. Chemosphere 2021, 283, 131176. [Google Scholar] [CrossRef]
- Wang, J.S.; Jiao, X.Y.; Ding, Y.C.; Dong, E.W.; Bai, W.B.; Wang, L.G.; Wu, A.L. Response of nutrient uptake, yield and quality of grain sorghum to nutrition of nitrogen, phosphorus and potassium. Acta Agron. Sin. 2015, 41, 1269–1278, (In Chinese with English Abstract). [Google Scholar] [CrossRef]

Disclaimer/Publisher’s Note: The statements, opinions and data contained in all publications are solely those of the individual author(s) and contributor(s) and not of MDPI and/or the editor(s). MDPI and/or the editor(s) disclaim responsibility for any injury to people or property resulting from any ideas, methods, instructions or products referred to in the content. |
© 2025 by the authors. Licensee MDPI, Basel, Switzerland. This article is an open access article distributed under the terms and conditions of the Creative Commons Attribution (CC BY) license (https://creativecommons.org/licenses/by/4.0/).