Abstract
The Primula vulgaris, belonging to the genus Primula, is a typical distyly. The distyly is an important morphological feature in nature. However, there is a shortage of research on the causes of distyly formation and the associated genes that control this trait. In this study, we took P. vulgaris as the experimental material, observed the floral morphological features, made paraffin sections, and performed transcriptome analysis of the styles. The results of morphological observations indicated that the L-morph and S-morph showed dimorphism in flower characteristics, the stigma height was 1.35 cm and the anther height was 0.72 cm for the L-morph and 0.71 cm and 1.50 cm for the S-morph. From the paraffin sections, it can be observed that the papillocytes and stylocytes of the L-morph are longer than those of the S-morph. A total of 2822 DEGs were obtained in the analysis of DEGs, among which 2038 genes were up-regulated and 786 genes were down-regulated. The DEGs of the two morphs were mainly enriched in biological processes such as phenylpropanoid biosynthesis and plant hormone signal transduction. BACOVA_02659 was highly expressed in the L-morph and might hydrolyze and activate growth factors, which were present in the phenylpropane biosynthetic pathway. DEGs such as BoGH3B, SAUR21, and SAUR50 may be involved in the development of long and short styles, which in turn leads to the presentation of differences between long and short morphs. These results provide new insights into the molecular mechanism of Primula.
1. Introduction
Primrose are famous wildflower in southwest China and a common ornamental plant in spring. With diverse species and colorful flowers, it is commonly used in early spring flower beds, and is also suitable for planting in courtyards, gardens, and rock gardens, and can also be applied to various types of garden green space [1]. P. vulgaris has colorful flowers, rich varieties, good prospects for garden applications, and is superior to other primroses in terms of both ornamental value and resistance [2].
Heterostyly is characterized by the presence of two (distyly) or three (tristyly) distinct floral morphs within a species, with reciprocal positioning of stigma and anther heights (reciprocal herkogamy). This evolution trait is one of the major contributors to angiosperm diversity [3,4,5]. The more common form in nature is the distyly. Distyly is a flower polymorphism controlled by genes. It is marked by a situation where, within a single population, there is a reversal in the positions of the stigma and anthers in different individuals [6,7]. In distyly, one flower morph features a long style and short stamens, known as the long-styled morph (L-morph). Conversely, the other flower morph has a short style and long stamens, which is called the short-styled morph (S-morph). Despite the growing attention that heterostyly has garnered, the origin and evolution of this polymorphism remain highly controversial topics [8]. Since the appearance of style dimorphism in Primula auricula and Primula farinose in 1583 [9], it has been reported in 30 families and 193 genera of angiosperms [10,11,12]. It is widely found in Primulaceae, Boraginaceae, Rubiaceae, and Linaceae [13,14,15,16]. There is no obvious evolutionary relationship between them. They may have occurred independently or evolved in parallel.
Heterostyly plants are accompanied by a morphological diversity of floral parts in addition to the difference in pistil height in Primula [17,18]. L-morph and S-morph are often accompanied by the diversity of pollen number, anther size, stigma shape, etc. [19]. L-morph generally has more pollen than S-morph, but pollen grains are smaller [20,21,22]. Meanwhile, the L-morph has a larger surface area of stigma and corolla [6,23,24]. The stigma of L-morph is positioned higher for easier access to pollen, and the larger surface area is conducive to increased pollination efficiency, whereas the S-morph is less accessible inside the corolla tube, and the concave center is more conducive to accepting pollen brought in by pollinators [25]. Darwin found by microscopic observation that the stylar cells of the L-morph were longer than those of the S-morph [6,26]. The specialized floral structures of heterostyled plants were adapted to biotic and abiotic environments, but most of all to reproduction, during a long evolutionary process [27,28,29].
The classical theory is that stylar heterosis is controlled by an S-locus, also known as the S supergene. The L-morph is a recessive pure genotype (s/s), the S-morph is a heterozygous genotype (S/s), and a dominant pure gene (S/S) has not yet been identified, and it has been suggested that this may be related to a lethal gene [30,31]. It has been widely recognized that the S-locus consists of a number of genes controlling floral traits, including at least three pairs of closely related genes, G, P, and A, which control style height, pollen size, and anther position, respectively [32,33,34]. However, the S-locus in the S-morph is semi-heterozygous, probably due to segmental duplication and subsequent gene deletion and neofunctionalization [35].
The current molecular mechanism for dimorphic flowers in the genus Primula is thought to be the influence of the S hemizygous locus, which consists of five genes, CCMT, GLOT, CYPT, PUMT, and KFBT [35]. Two genes on the S-locus, CYP (CYP734A50) and GLO, may control style length and anther position, respectively [35,36,37]. Burrow obtained BAC fragments from two primroses and confirmed that CYP734A50 and GLO2 are specific for short styles and are adjacent in the locus. Also, the study concluded that the dominant S allele is hemizygous [36]. Comparative transcriptional analysis of flowers with long and short styles identified a gene that is highly expressed only in short styles, similar to GLOBOSA, and named it GLO2 [38], which is considered a candidate gene for the A locus controlling anther position in the supergene model. In addition to this, through gene silencing and genotyping, the GLO2 gene was shown to control anther height by controlling the elongation of the corolla tube and stamen filament cells below the anther binding site [39]. CYP734A50 is expressed in the short-styled type, a gene unique to the Primulaceae that encodes a cytochrome synthase that inactivates BRs [40,41]. This gene was later shown to encode an oleuropein steroid-degrading enzyme, located in the G locus of the S motif, which leads to the degradation of oleuropein steroids, limiting cell expansion and style elongation and resulting in short styles. Long styles of primrose were obtained by virus-induced gene silencing of CYP734A50 [37]. After a comparative analysis of the transcriptome data of pistils and stamens at different developmental stages of Primula, it was found that CYP734A50 is a key S-focused gene whose product degrades brassinosteroids. This gene was co-expressed with many genes in the module and was significantly negatively correlated with the style length [16]. Subsequently, researchers simulated the inactivation of CYP734A50 by exogenous BR treatment and transformed the short styles into long styles of primrose, which verified the role of CYP734A50 in controlling the style morphology of Primula [42]. Through a comparative analysis of the first transcriptome profile of Primula with other dimorphic plants, the following conclusions were drawn. The S-focused gene CYPT acquires a role in controlling stylar elongation through variations in the expression profile. Differential gene expression analysis of L- and S-morph flowers confirmed that, in primrose, the differences in style elongation between the two flower types were caused by differences in stylocellular expansion [43]. In addition to S-focused genes, several studies have investigated DEGs between floral haplotypes [12,44]. However, the regulatory and metabolic pathways affected by S-focused genes remain largely unknown and require further investigation.
The phenomenon of stylar dimorphism is an androgynous phenomenon in angiosperms, and the different morphologies of the styles of P. vulgaris, as a dimorphic stylopetalous plant, is an ideal model for the study of plant morphology and development. In order to explore the reasons for the production of dimorphic styles in primrose, it is necessary to study the expression of genes regulating the phenomenon of style dimorphism in different morphologies. In this study, we conducted morphological observations of P. vulgaris and transcriptome sequencing of the styles of the two morphs. Morphological observations allowed us to accurately understand the differences in structure and size between the two morphologies. Transcriptome sequencing can reveal the expression of genes in the two morphologies and identify the DEGs that may be involved in stylar morphology, which will help us to explore the regulatory mechanism of stylar development and provide a theoretical basis for the molecular mechanism of dimorphic stylar formation. The results of this study may provide valuable information on the formation of dimorphic styles from new perspectives. These findings will provide a theoretical basis for the subsequent improvement of plant varieties through gene technology, which is expected to play an important role in the fields of agriculture and horticulture.
2. Materials and Methods
2.1. Materials
The plant material was the Danova series of P. vulgaris, which was planted in the intelligent greenhouse of Hebei Agricultural University. The environmental conditions of the greenhouse were as follows: 12 h/d light time and 22–25 °C. The cultivation substrate was a 3:1 (V:V) mixture of 0–5 mm peat soil and perlite, which was finely maintained [45].
2.2. Determination of Floral Characteristics
Thirty plants in full bloom were selected for L- and S-morph, and one flower of each plant was randomly selected. The corolla diameter, corolla tube height, middle diameter of the floral tube, stigma height (distance from the base of the ovary to the top of the stigma), anther height (distance from the base of the ovary to the top of the anther), ovary height, and anther length of the flowers were measured separately with vernier calipers. The measured data were recorded separately in detail. One-way analysis of variance was performed on the data using SPSS 27, and the letter-marking method was employed for significance analysis.
2.3. Paraffin Sections
The flowers that bloomed on the same day were selected and removed the pistils with tweezers. The style and stigma were placed in FAA solution (formaldehyde: glacial acetic acid: 70% ethanol = 1:1:18 v/v). After rinsing, the samples were dehydrated in a gradient ethanol series (70%, 85%, 95%, and 100% alcohol for 1 h each). Fast green and the counterstain safranin were employed to stain the sections. Finally, the sections were observed on an automatic digital slide scanner. Formaldehyde, glacial acetic acid, and absolute ethanol were all purchased from the Hushi brand, with an analytical-pure grade. Safranin and Fast Green were 5-g powders purchased from the Solarbio brand.
2.4. Total RNA Extraction, cDNA Library Construction and Transcriptome Sequencing
Fresh styles from the first-flowering stage of L- and S-morph were selected and for each morphology, thirty pistils were selected as a biological replicate, and three biological replicates of each type were collected [16], and frozen in liquid nitrogen. Total RNA was extracted using an all-purpose plant RNA extraction kit. The concentration, purity, and integrity of RNA samples were tested. mRNA was enriched and interrupted into short fragments, which were used as templates for random reverse transcription of cDNA. The second strand was synthesized by PCR amplification according to this template. The transcriptome library was constructed according to the NEBNext® Ultra™ RNA Library Prep Kit for Illumina® (NEB, Ipswich, MA, USA). Finally, the raw sequences were filtered by Trinity [46] to obtain clean reads, and then spliced to obtain the reference sequences for subsequent analysis [46]. Sequencing was performed using the Illumina Nova-Seq 6000 sequencing platform.
2.5. Gene Expression Analysis, Functional Annotation, and DEGs Analysis
The results of the assembled comparisons were counted by using RNA-Seq by Expectation-Maximization (RSEM) software, version RSEM 1.3.3 [47] and Fragments Per Kilobase of exon model per Million mapped fragments (FPKM) [48] calculations were performed for each sample. Gene function annotation was performed using databases such as Non-Redundant Protein Sequence Database (Nr) [49], Protein families (Pfam) [50], eukaryotic ortholog groups (KOG) [51], Swiss-Prot Protein Sequence Database (Swiss-prot) [52], Kyoto Encyclopedia of Genes and Genomes (KEGG) [53] and Gene Ontology (GO) [54]. Differential expression analysis was performed using read counts with the DESeq R package (1.10.1) [55], and the Read count of genes grouped in L- and S-morphs were normalized separately to calculate the differential expression ploidy of genes, and finally the significance of the number of Reads was analyzed according to the negative binomial distribution test (NB) to calculate the differential significance: p-value. The screening conditions for differentially expressed genes were p-value < 0.05 and |log2 (Fold Changes)| > 1.
2.6. Quantitative Real-Time PCR of Different Morphs
The transcript levels of 9 genes in L-morph and S-morph were examined by qRT-PCR. Total RNA was extracted using the RNA extraction kit (Omini-Plant RNA). Structural and regulatory genes related to the pathway affecting style length were screened out from significantly different genes. The gene-specific primers were designed by Primer 5.0 and listed in the primer sequence (Table S1). PfEIF5A was used as an internal reference gene. The reaction system was composed as follows: 5 µL of 2 × SYBR Green Master Mix, 0.5 µL each of positive and negative primers, 1 µL of template cDNA, 0.2 µL of 10 × ROX, and 2.8 µL of ddH2O. The reaction program consists of 2 min of pre-denaturation at 95 °C, 5 s of denaturation at 95 °C, and 30 s of annealing at 60 °C, for a total of 40 cycles. Finally, step for melting curve analysis (95 °C for 15 s, 60 °C for 60 s, 95 °C for 15 s). Three biological repetitions were performed for each sample. The expression levels of unigenes were calculated using the 2−ΔΔCT method [56].
3. Results
3.1. Floral Characteristics
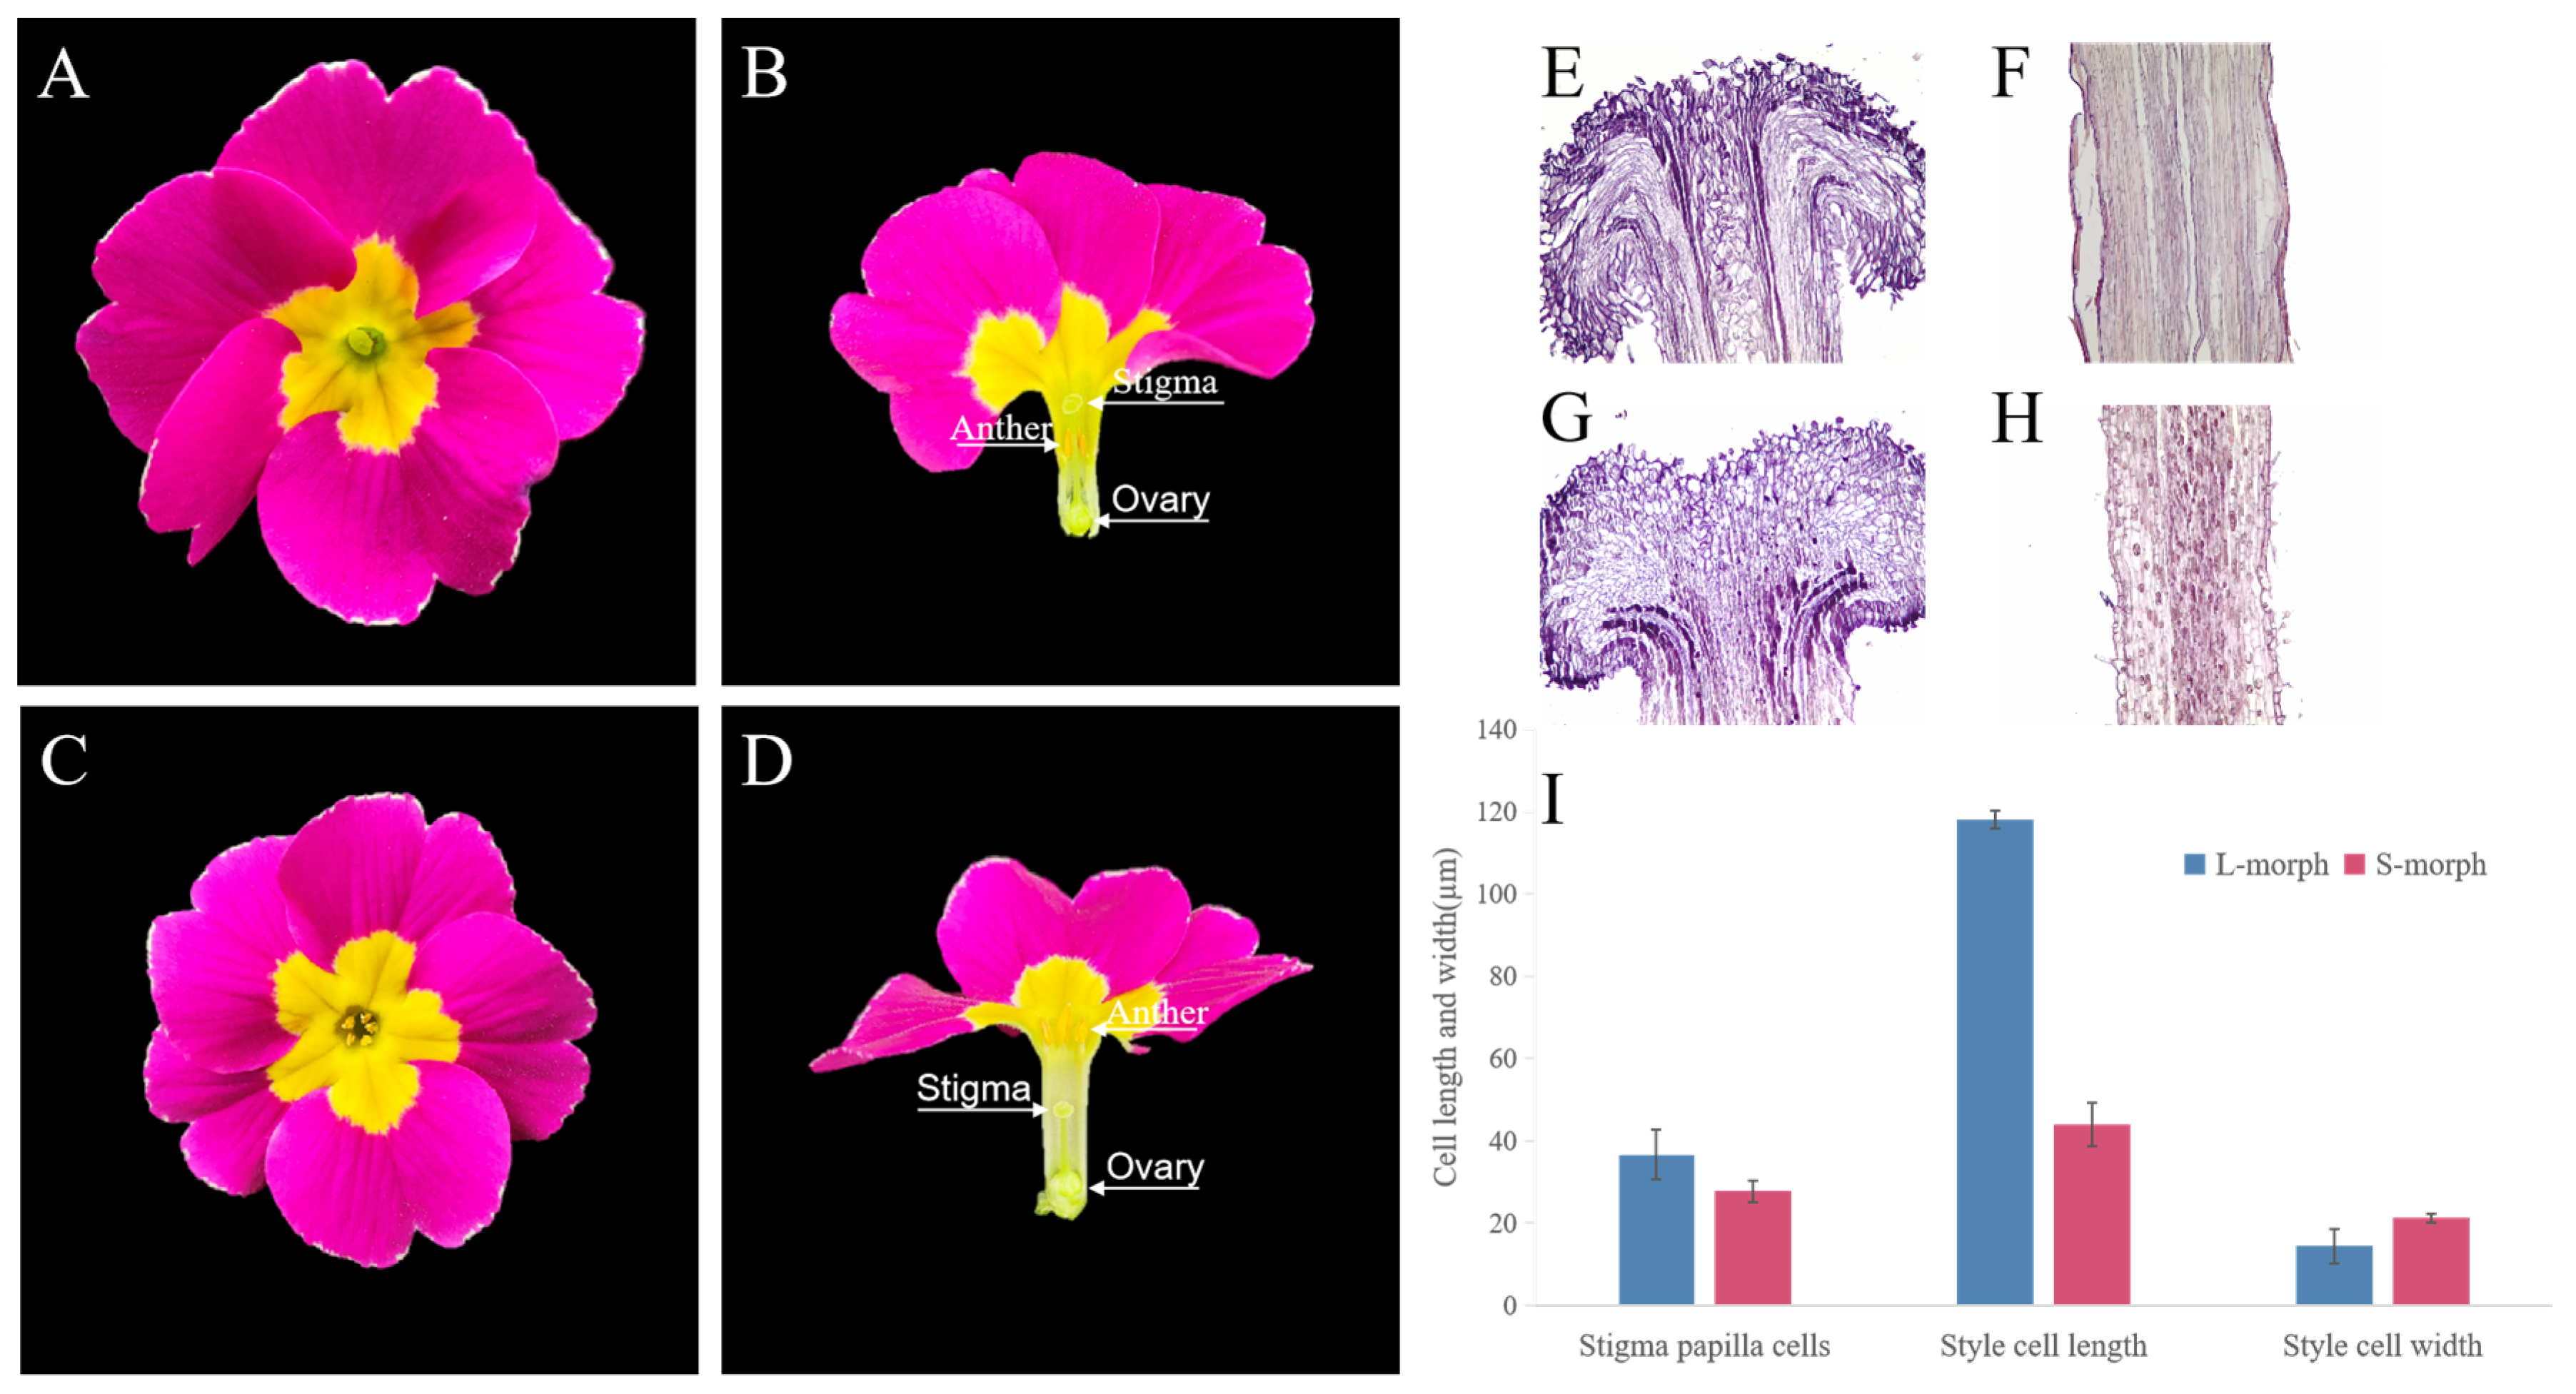
It could be seen from the flower structure that P. vulgaris was a typical distyly plant. The position of stigma and anther of L- and S-morph was complementary. The stigma was 0.63 cm higher than the anthers and visible at the corolla opening in L-morph (Figure 1A,B). The anthers were about 0.79 cm higher than the stigma, and the stamens were visible at the corolla opening in S-morph (Figure 1C,D). The L-stigma was 0.64 cm higher than the S-morph, while the anthers of the S-morph were 0.78 cm higher than those of the L-morph. Stigma height and anther height were significantly different between the two morphs (p < 0.05). The anther height of the L-morph was almost equal to the stigma height of the S-morph. The corolla diameter, middle diameter of the floral tube, and ovary height of the L-morph were 0.21 cm, 0.02 cm, and 0.01 cm higher than those of the S-morph, respectively. The length of the corolla tube and anther length were equal to the S-morph. However, these morphological indicators were not significantly different between the two morphologies (p > 0.05) (Table 1).
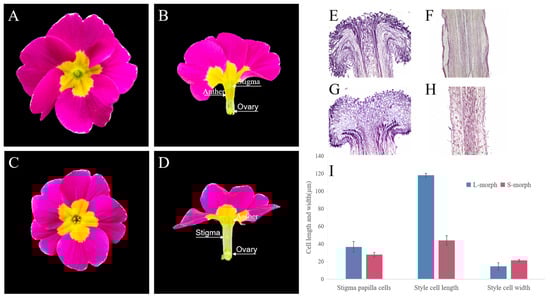
Figure 1.
Flower structure of L-morph and S-morph. (A) Flower morphology of L-morph. (B) Dissected diagram of L-morph. (C) Flower morphology of S-morph. (D) Dissected diagram of S-morph. (E) Paraffin section of stigma L-morph. (F) Paraffin section of style L-morph. (G) Paraffin section of stigma S-morph. (H) Paraffin section of style S-morph. (I) Statistics of style length and cell shapes of L-morph and S-morph.

Table 1.
Morphological characteristics of the floral of L-morph and S-morph.
3.2. Paraffin Sections of L- and S-Morph
The stigma papilla cells of the L- and S-morph were closely arranged and nearly oblong in shape (Figure 1E–H). There was a cavity on the cross-section of the stigma, and the pollen tube could pass through the papillae into the style. The length of the papillae of the L-morph was 36.67 µm and that of the S-morph was 27.15 µm, which was a significant difference at p < 0.05 level. The L-morph papillae easily fixed the larger pollen produced by the S-morph. In contrast, the papillae of the S-morph were shorter and this form was more likely to accommodate the pollen of L-morph. The length of the style cells of the L-morph was greater than that of the S-morph by 73.84 µm, and there was a significant difference between the two morphs at p < 0.05 level. The formation of the L-morph might be related to the change in cell length. The difference in the cell width in both morphs was not significant, but the number of cells of the L-morph was less than S-morph. It was speculated that the formation of the S-morph may be related to cell proliferation (Figure 1I).
3.3. Transcriptome Profiling and DEGs Analysis
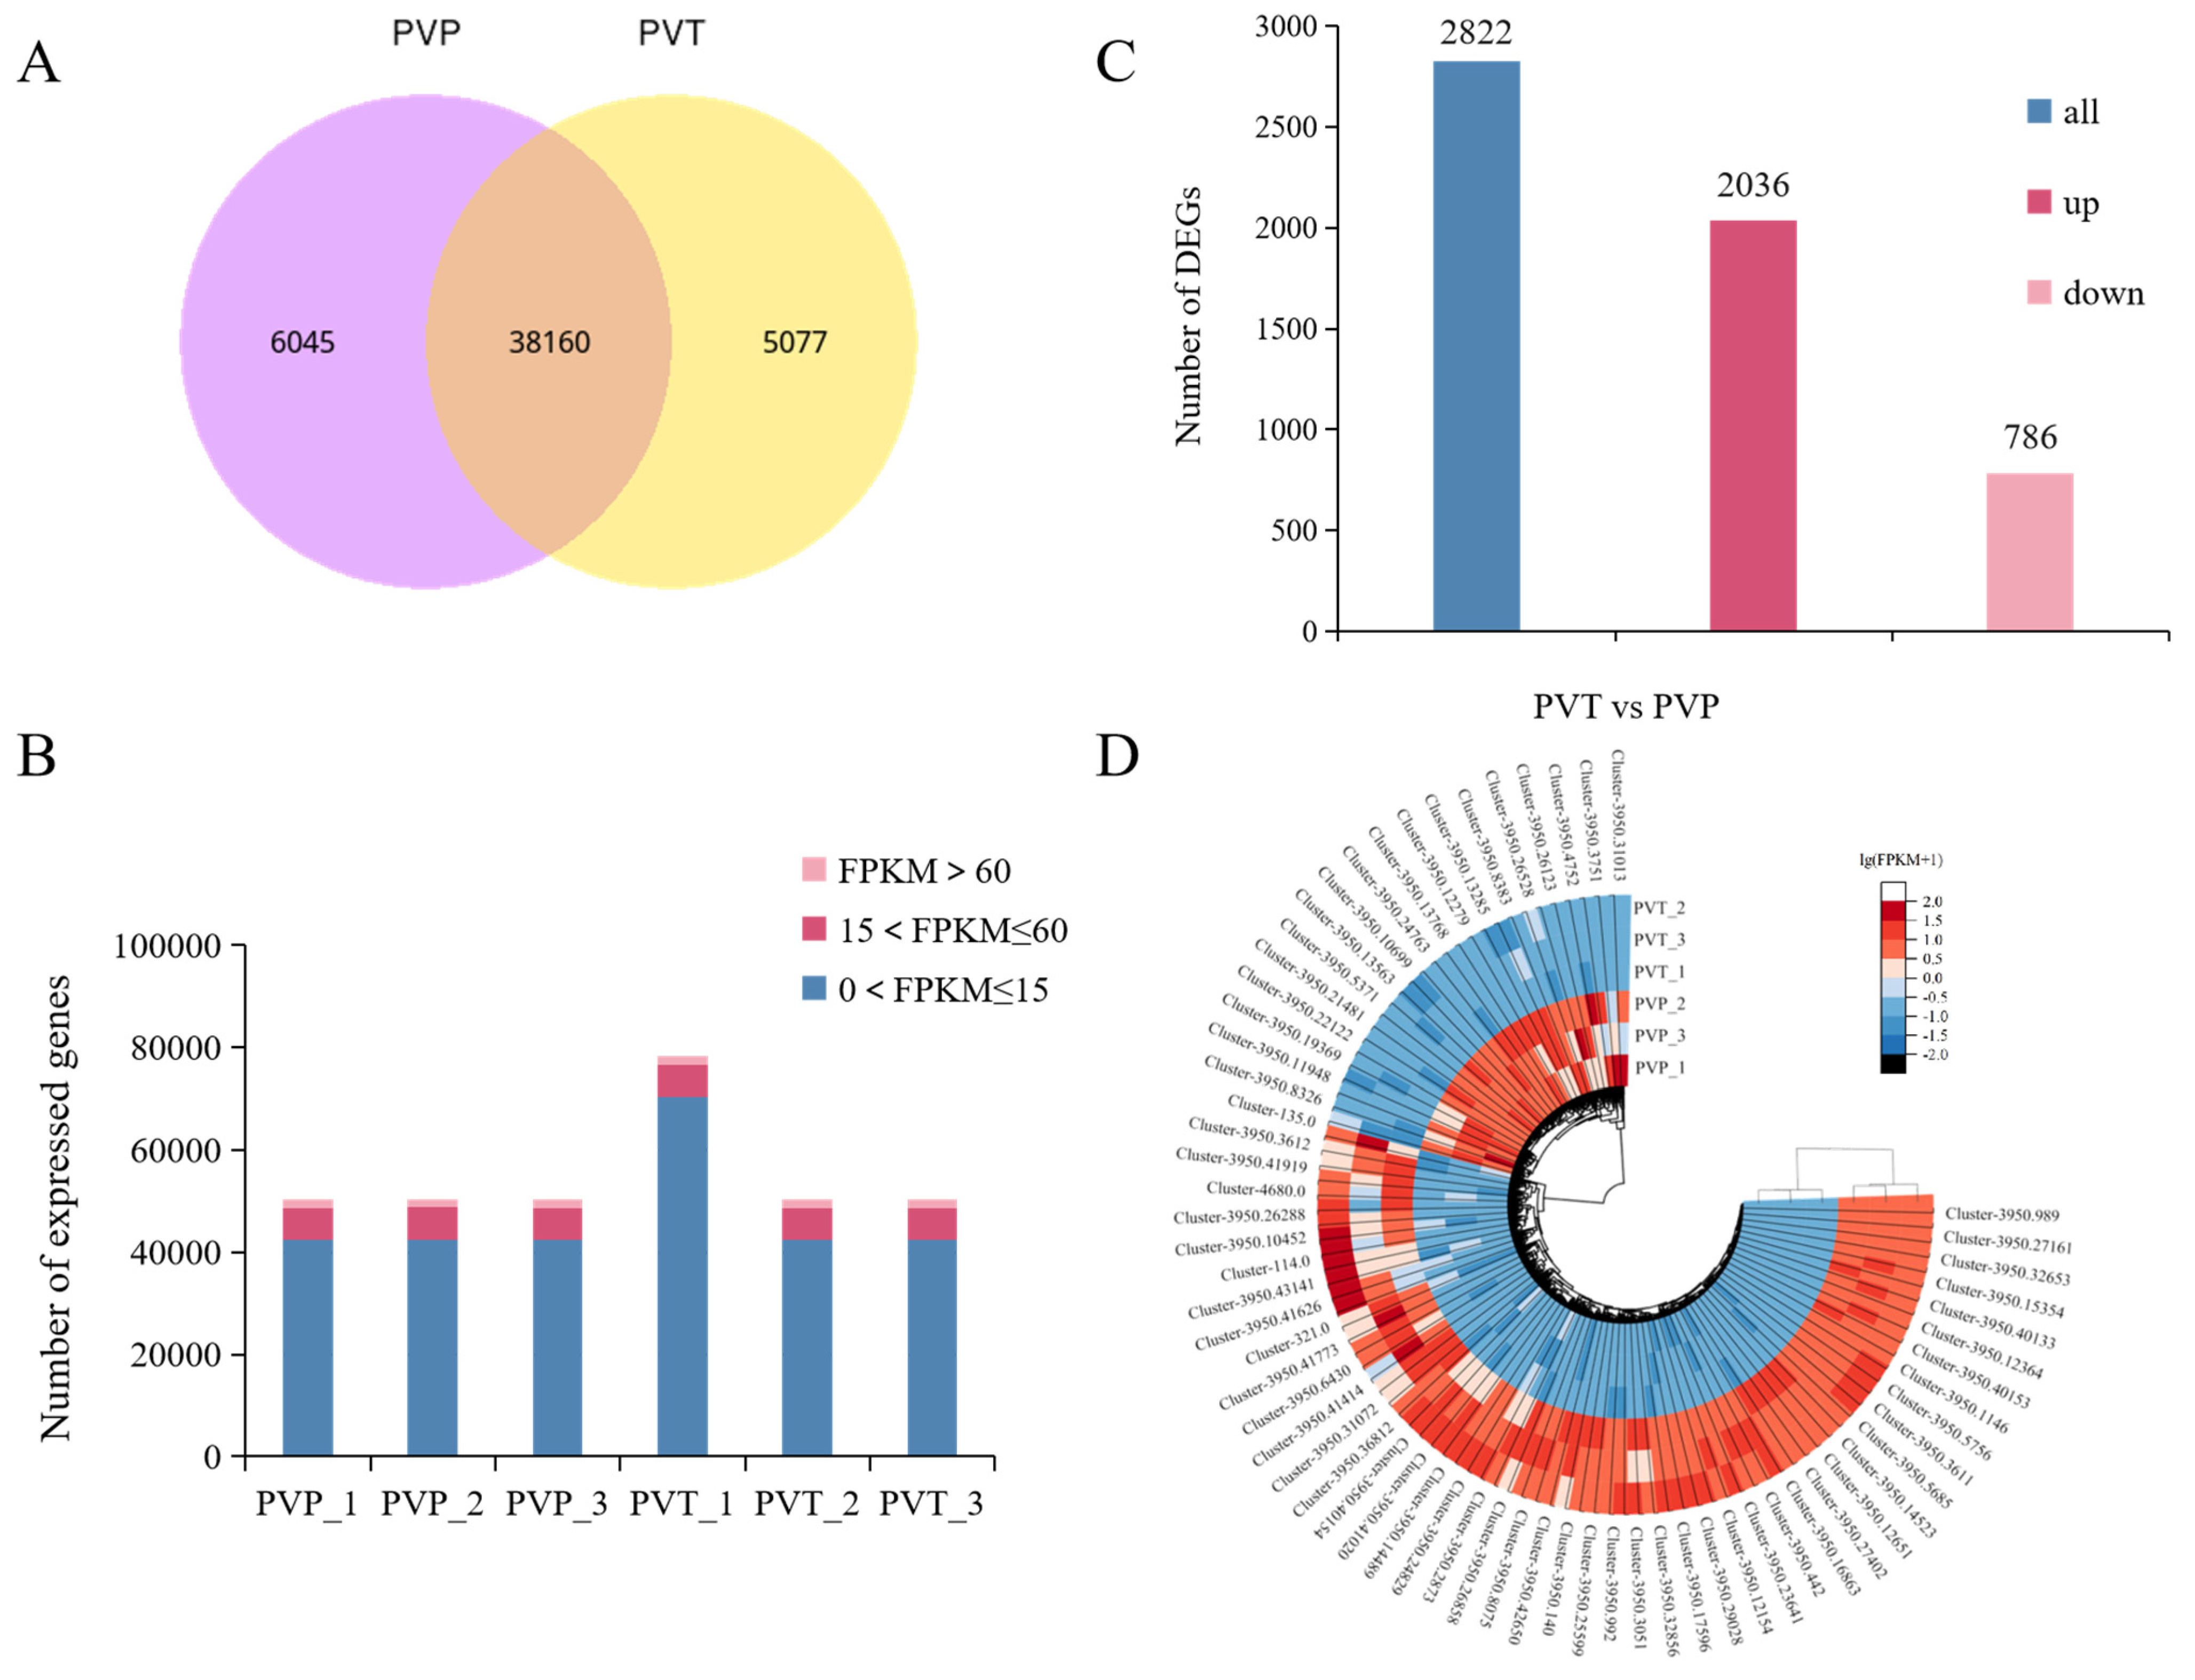
The Illumina sequencing platform was used to sequence the L- and S-morph of P. vulgaris and 40.4 Gb of raw data (raw bases) were obtained. After sequencing, the valid data (Clean bases) of 39.3 Gb were obtained by removing the connectors and filtering the low-quality sequences and wrong sequences (Table S2). We identified 50,300 unigenes by assembling all the samples together and filtering for abundance. The unigene length distribution is shown in Figure S1. Among them, there were 38,160 genes shared by the L- and S-morphs (Figure 2A). Seven databases were used to annotate all unigenes. At least one database provided annotations for a total of 27,311 unigenes, and these annotated unigenes accounted for 54.29% of the total (Figure S2). In addition, to analyze unigene expression, normalized read counts (FPKM) for each gene were calculated. Gene expression FPKM was mostly distributed between 0 and 15, accounting for 84.45% and 84.30% in the L-morph and S-morph databases, respectively. The gene expression FPKM > 60 was rarely found, only about 3.3%. The gene expression level was basically normally distributed (Figure 2B, Table S3).
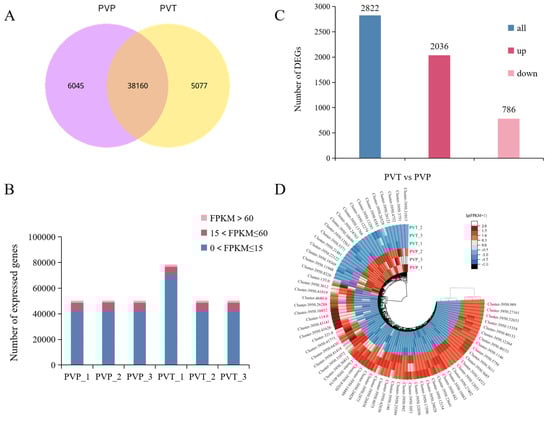
Figure 2.
Global gene expression profiling of L- and S-morph in P. vulgaris. (A) Venn diagrams showing the numbers of differentially co-expressed genes in L- and S-morph. (B) Numbers of genes expressed at different levels (based on FPKM). (C) The number of up-regulated and down-regulated DEGs in L- and S-morphs (p-value ≤ 0.05, |log2 FoldChange| > 1). (D) Differential gene clustering heatmap. PVP indicates L-morph, while PVT represents S-morph.
A total of 2822 significant DEGs were obtained from the comparison of the L- and S-morphs, of which 2036 genes were up-regulated and 786 genes were down-regulated (Figure 2C). A complete summary of all DEGs, both up- and down-regulated is shown in Table S4. Hierarchical cluster analysis of the obtained DEGs was conducted. The higher number of DEGs were expressed differentially during S-morph and their distinct expression patterns during L- and S-morphs were revealed by the heatmap. Many related genes were identified in specific gene clusters of different morphs, including genes involved in plant hormone signaling, phenylpropane synthesis, biological regulation, and protein-containing (Figure 2D).
3.4. Enriched GO Terms and KEGG Pathways of DEGs
The DEGs between the L-morph and S-morph were mainly enriched in the related items of oxidoreductase activity. For biological processes, the enrichment specifically acts on the hydrolase activity for glycosyl bonds. For molecular functions, the carbohydrate metabolic process was specifically enriched in DEGs. Similarly, for cellular components, terms related to the cell wall were also enriched. The results showed that the function of the different genes was enriched. It was further found that the expression of specific genes up-regulated by the L-morph was significantly enriched in transport, oxidoreductase activity, and cellular protein modification process. However, the up-regulated expression of specific genes in S-morph flowers was significantly enriched to hydrolase activity-related items. In terms of number and function, the number of genes significantly enriched in the S-morph was higher than that in the L-morph (Figure S3).
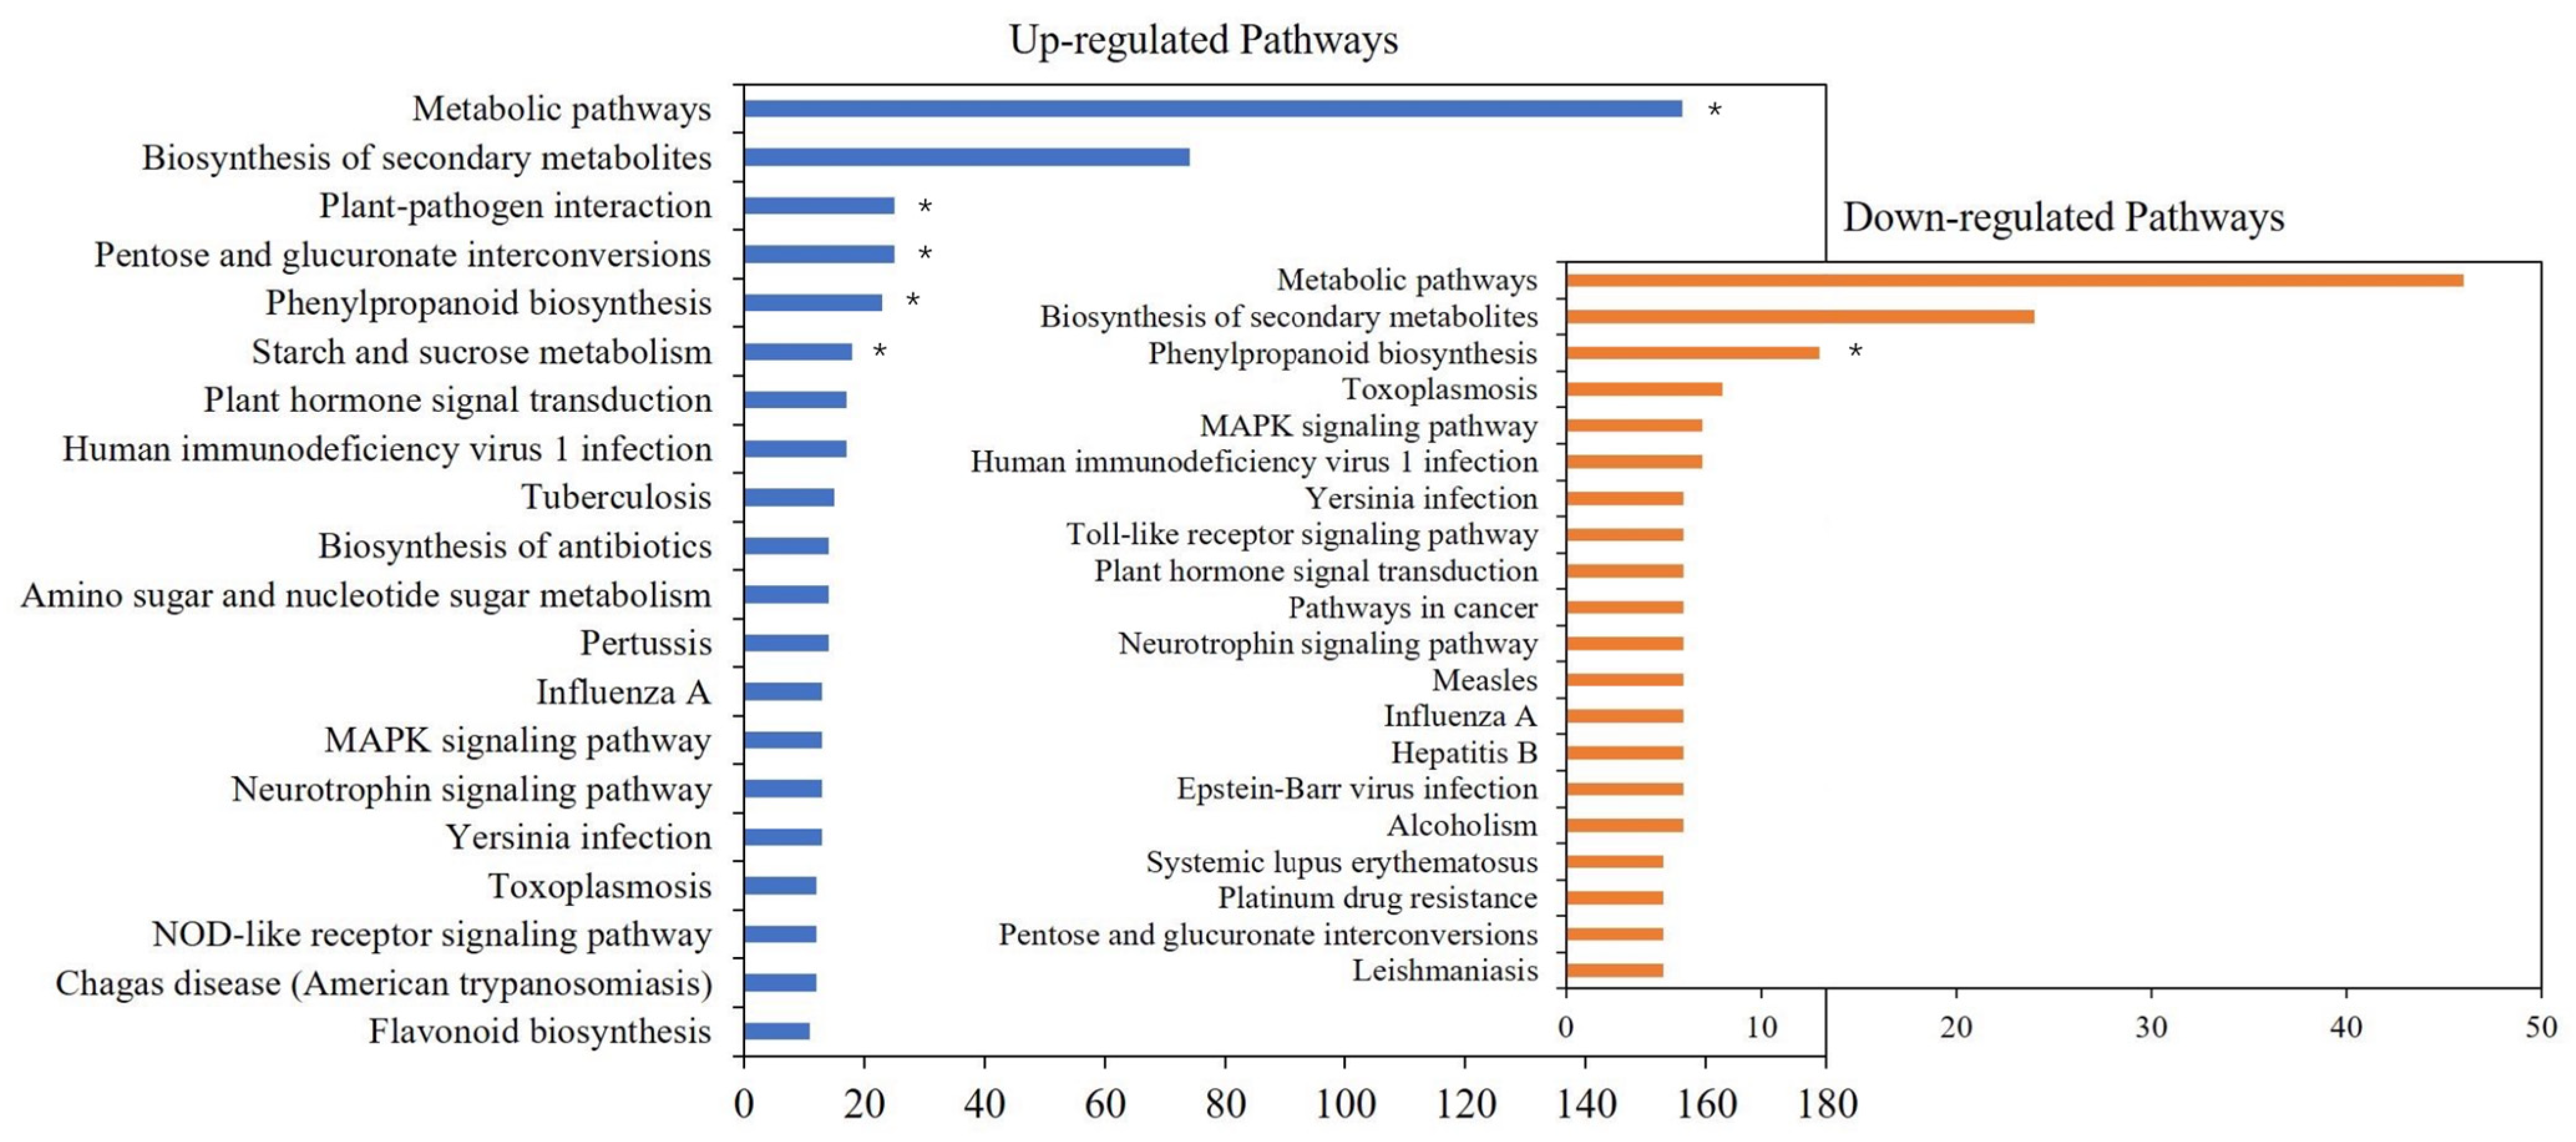
A comparison of all the DEGs in the two groups indicated that 421 DEGs were annotated to 275 metabolic pathways. Among them, 202 DEGs were annotated to Metabolic pathways, which were the most differentially annotated pathways. The genes up-regulated in the L-morph are mainly enriched in metabolic pathways, plant-pathogen interaction, and pentose. And S-morph up-regulated genes were mainly expressed in phenylpropanoid biosynthesis (Figure 3). However, more genes were up-regulated in the L-morph than in the S-morph. In terms of the number and function, the number of L-morph samples was significantly higher than that of S-morph samples.
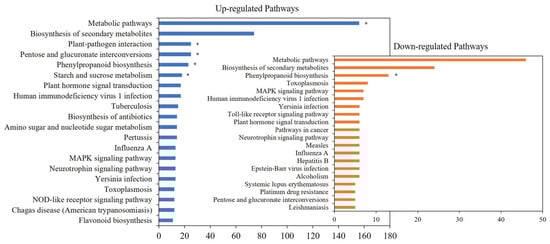
Figure 3.
Enriched KEGG pathways of the DEGs. Note: Top 20 of enriched KEGG pathways of the DEGs (p < 0.05). * represents a pathway that significantly enriches (p < 0.01).
3.5. Transcription Factors (TFs) Analysis
Previous studies have demonstrated the important roles of TFs in distyly in plants. The differences in the expression patterns of transcription factors can reflect the difference of two morphs. The family and proportion of TFs are shown in Figure 4A. The 6 most abundant TFs were AP2/ERF, bZIP, C2H2, MYB, LIM, and C3H with varied levels of regulation of DEGs. The transcription factor clustering diagram is shown in Figure 4B. All of these TFs were likely to be responsible for the difference in the presentation of L-morph and S-morph. The list of TFs and the families they belong to are in Table S5.
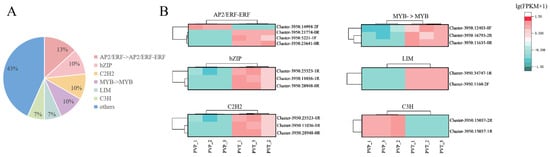
Figure 4.
Differential expression analysis of transcription factors. (A) The family of transcription factors contained in the transcriptome data and the proportion of them. (B) Cluster plot of transcription factors of 6 most abundant TFs.
3.6. Mining of Genes Related to Style Distyly
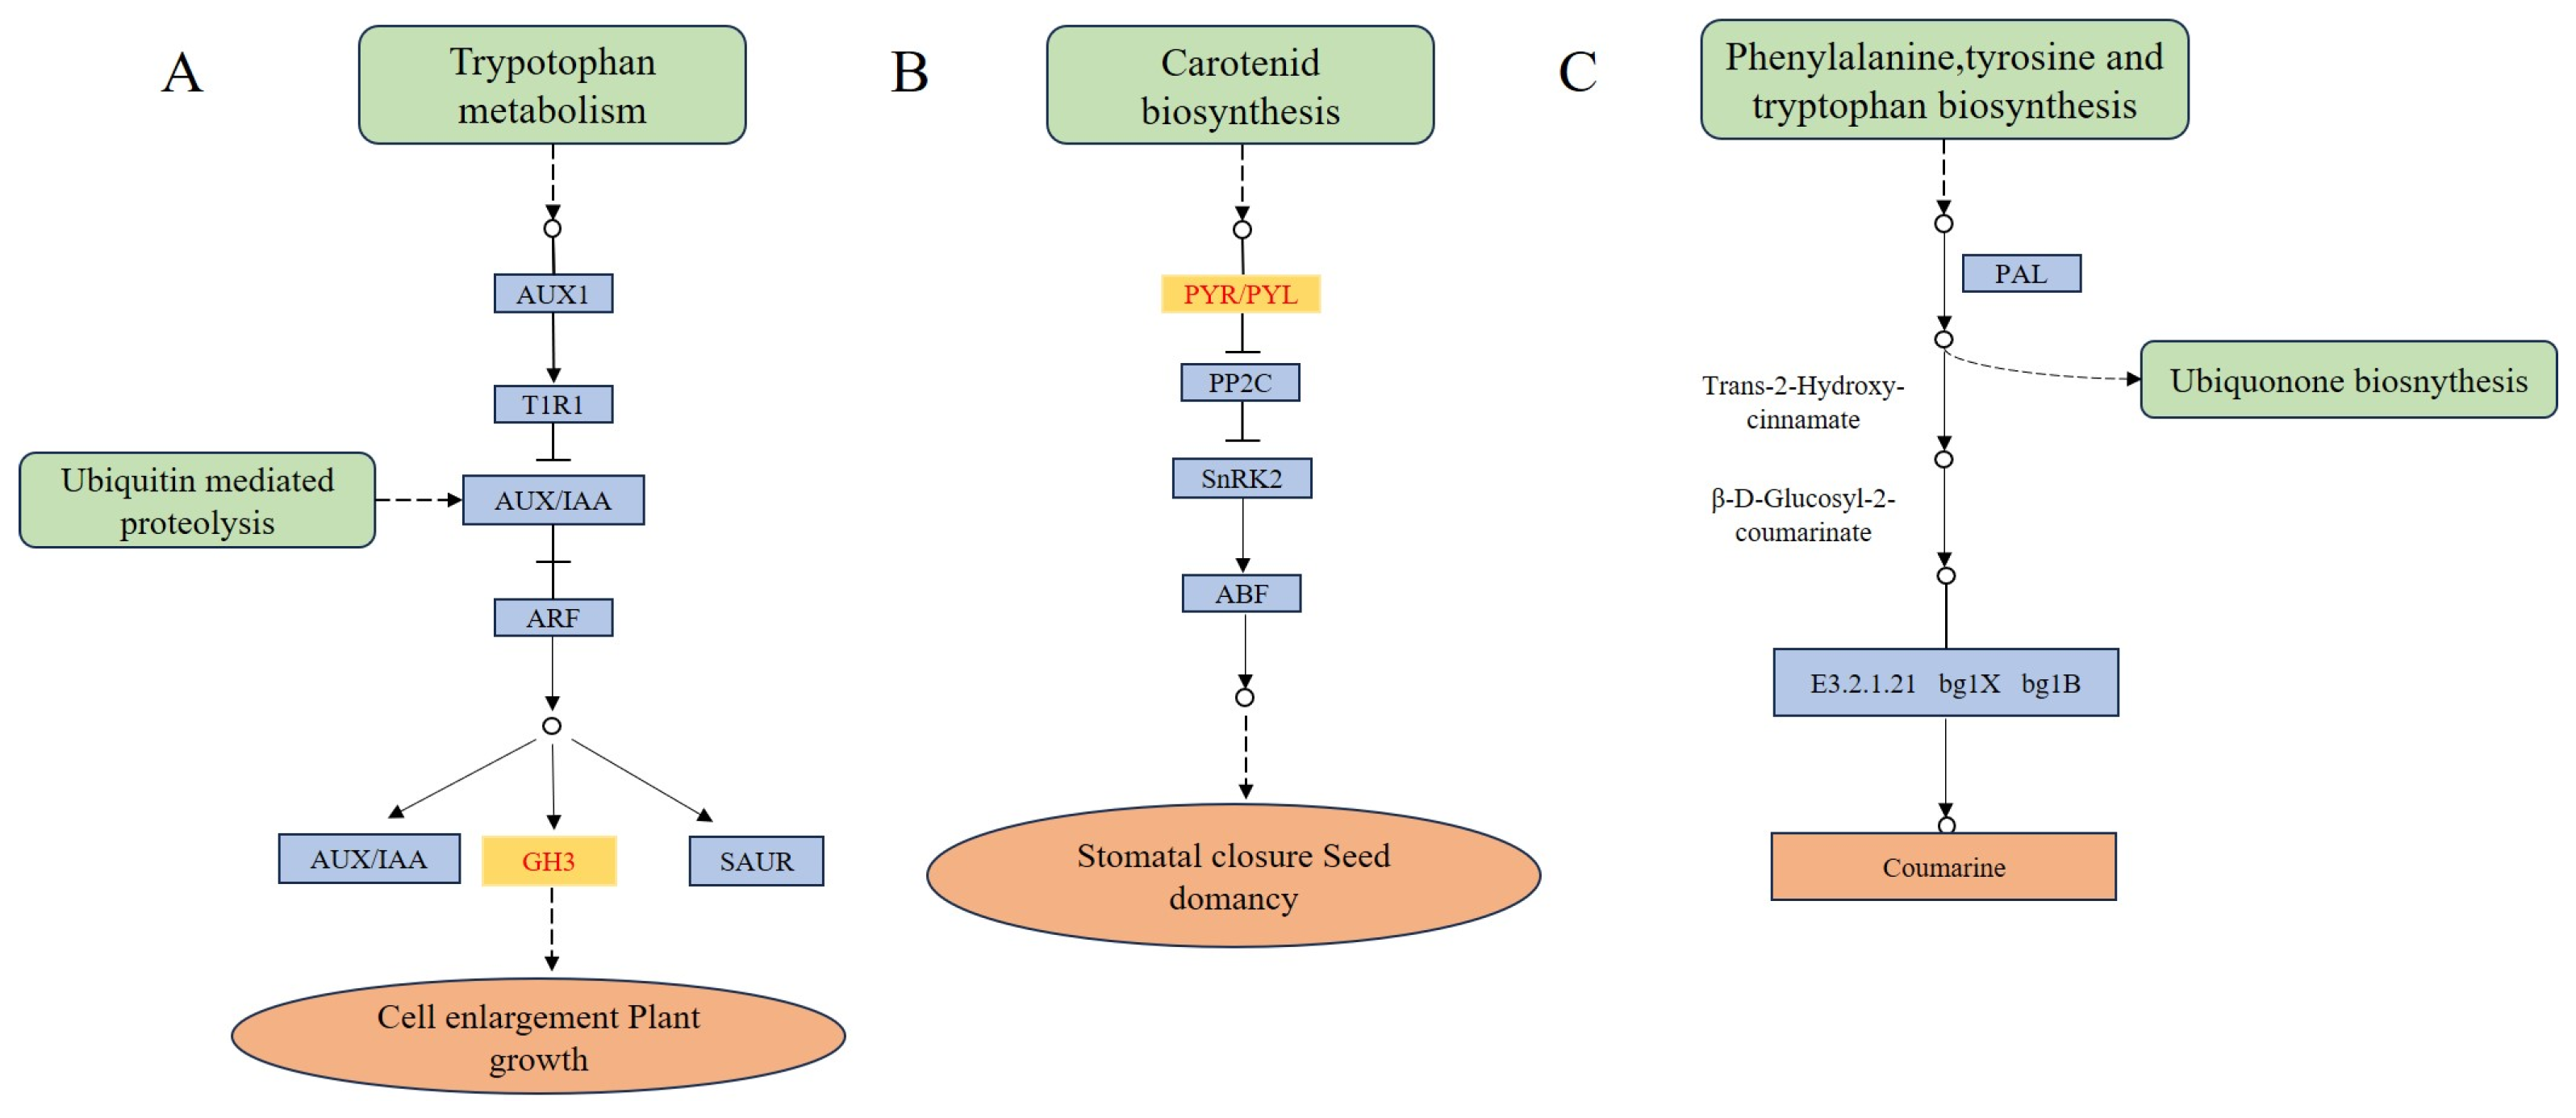
The β-glucosidase (EC3.2.1.21) in the phenylpropane biosynthetic pathway may be associated with the differential formation of L-morph and S-morph (Figure 5). The phenyl propane biosynthetic pathway contains 37 DEGs. Four genes (BoGH3B, BGlu12, ABCA7, GH3BG6) of β-glucosidase were up-regulated and one gene (BoGH3B-like) was down-regulated. Further comparison revealed that BoGH3B was highly expressed in the L-morph with the largest differential ploidy (Table S6).
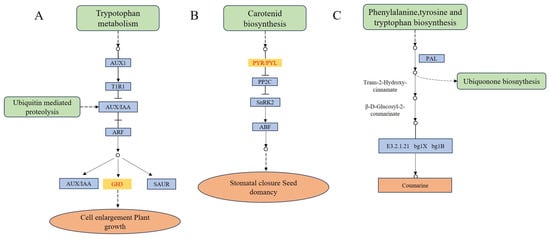
Figure 5.
Schematic diagram of plant hormone signal transduction and phenylpropane biosynthetic pathway involved with differentially expressed genes in the current study. (A,B) plant hormone signal transduction. (C) phenylpropane biosynthetic pathway. Note: Key enzymes expressed in our study have colored rectangles.
Plants regulated growth and development through the complex coordination of multiple plant hormone signaling pathways (Figure 5). The plant hormone signaling pathway contains 23 DEGs, including 9 DEGs associated with growth hormone (AUX/IAA), 3 DEGs associated with cytokinin (CTK), 3 DEGs associated with salicylic acid (SA), 3 DEGs associated with oleuropein lactone (BR), 2 DEGs associated with abscisic acid (ABA). Cluster-3950.40416 had the largest difference multiplicity and was expressed in high amounts in the S-morph, it belongs to the SAUR family. Among the DEGs, gene of abscisic acid receptor PYL protein family was highly expressed in the S-morph and not expressed in the L-morph (Table S6). It could be seen that plant hormones play an important role in the development of the flower column of distyly, especially in the formation of short styles.
3.7. Protein-Protein Interaction (PPI) Network Analysis
According to the results of the PPI network diagram (Figure 6), we screened out 10 key genes according to the degree of protein interaction relationship nodes. These genes had a close interaction relationship with other genes, and the interaction node degree was high, which may be closely related to the formation of distyly. The ID numbers and symbols of these genes were shown in Table S7. CesA4 and PSY2 had the highest nodality among these genes, and it might played an important role in the development of distyly.
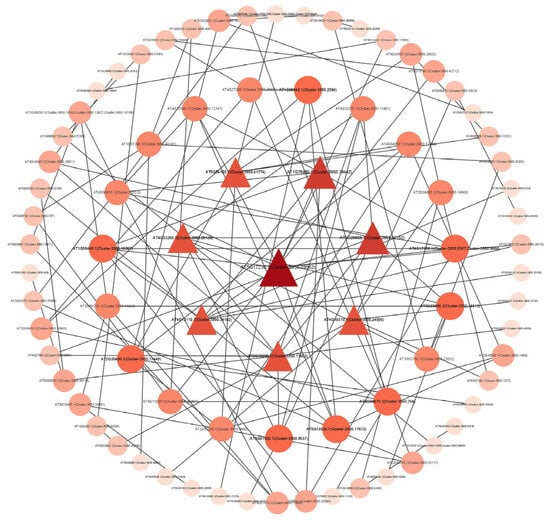
Figure 6.
Protein-protein interaction network diagram. The nodes in the figure represent proteins, and the lines connecting the nodes indicate the interactions between two proteins. The size of a node is proportional to its degree, that is, the more lines connected to a node, the greater its degree and the larger the node. The color of a node is related to its clustering coefficient. The color gradient from light to dark corresponds to the value of the clustering coefficient from low to high. A higher clustering coefficient value indicates better connectivity among the adjacent nodes of this node.
3.8. Validation of Gene Expression Levels in L-Morph and S-Morph
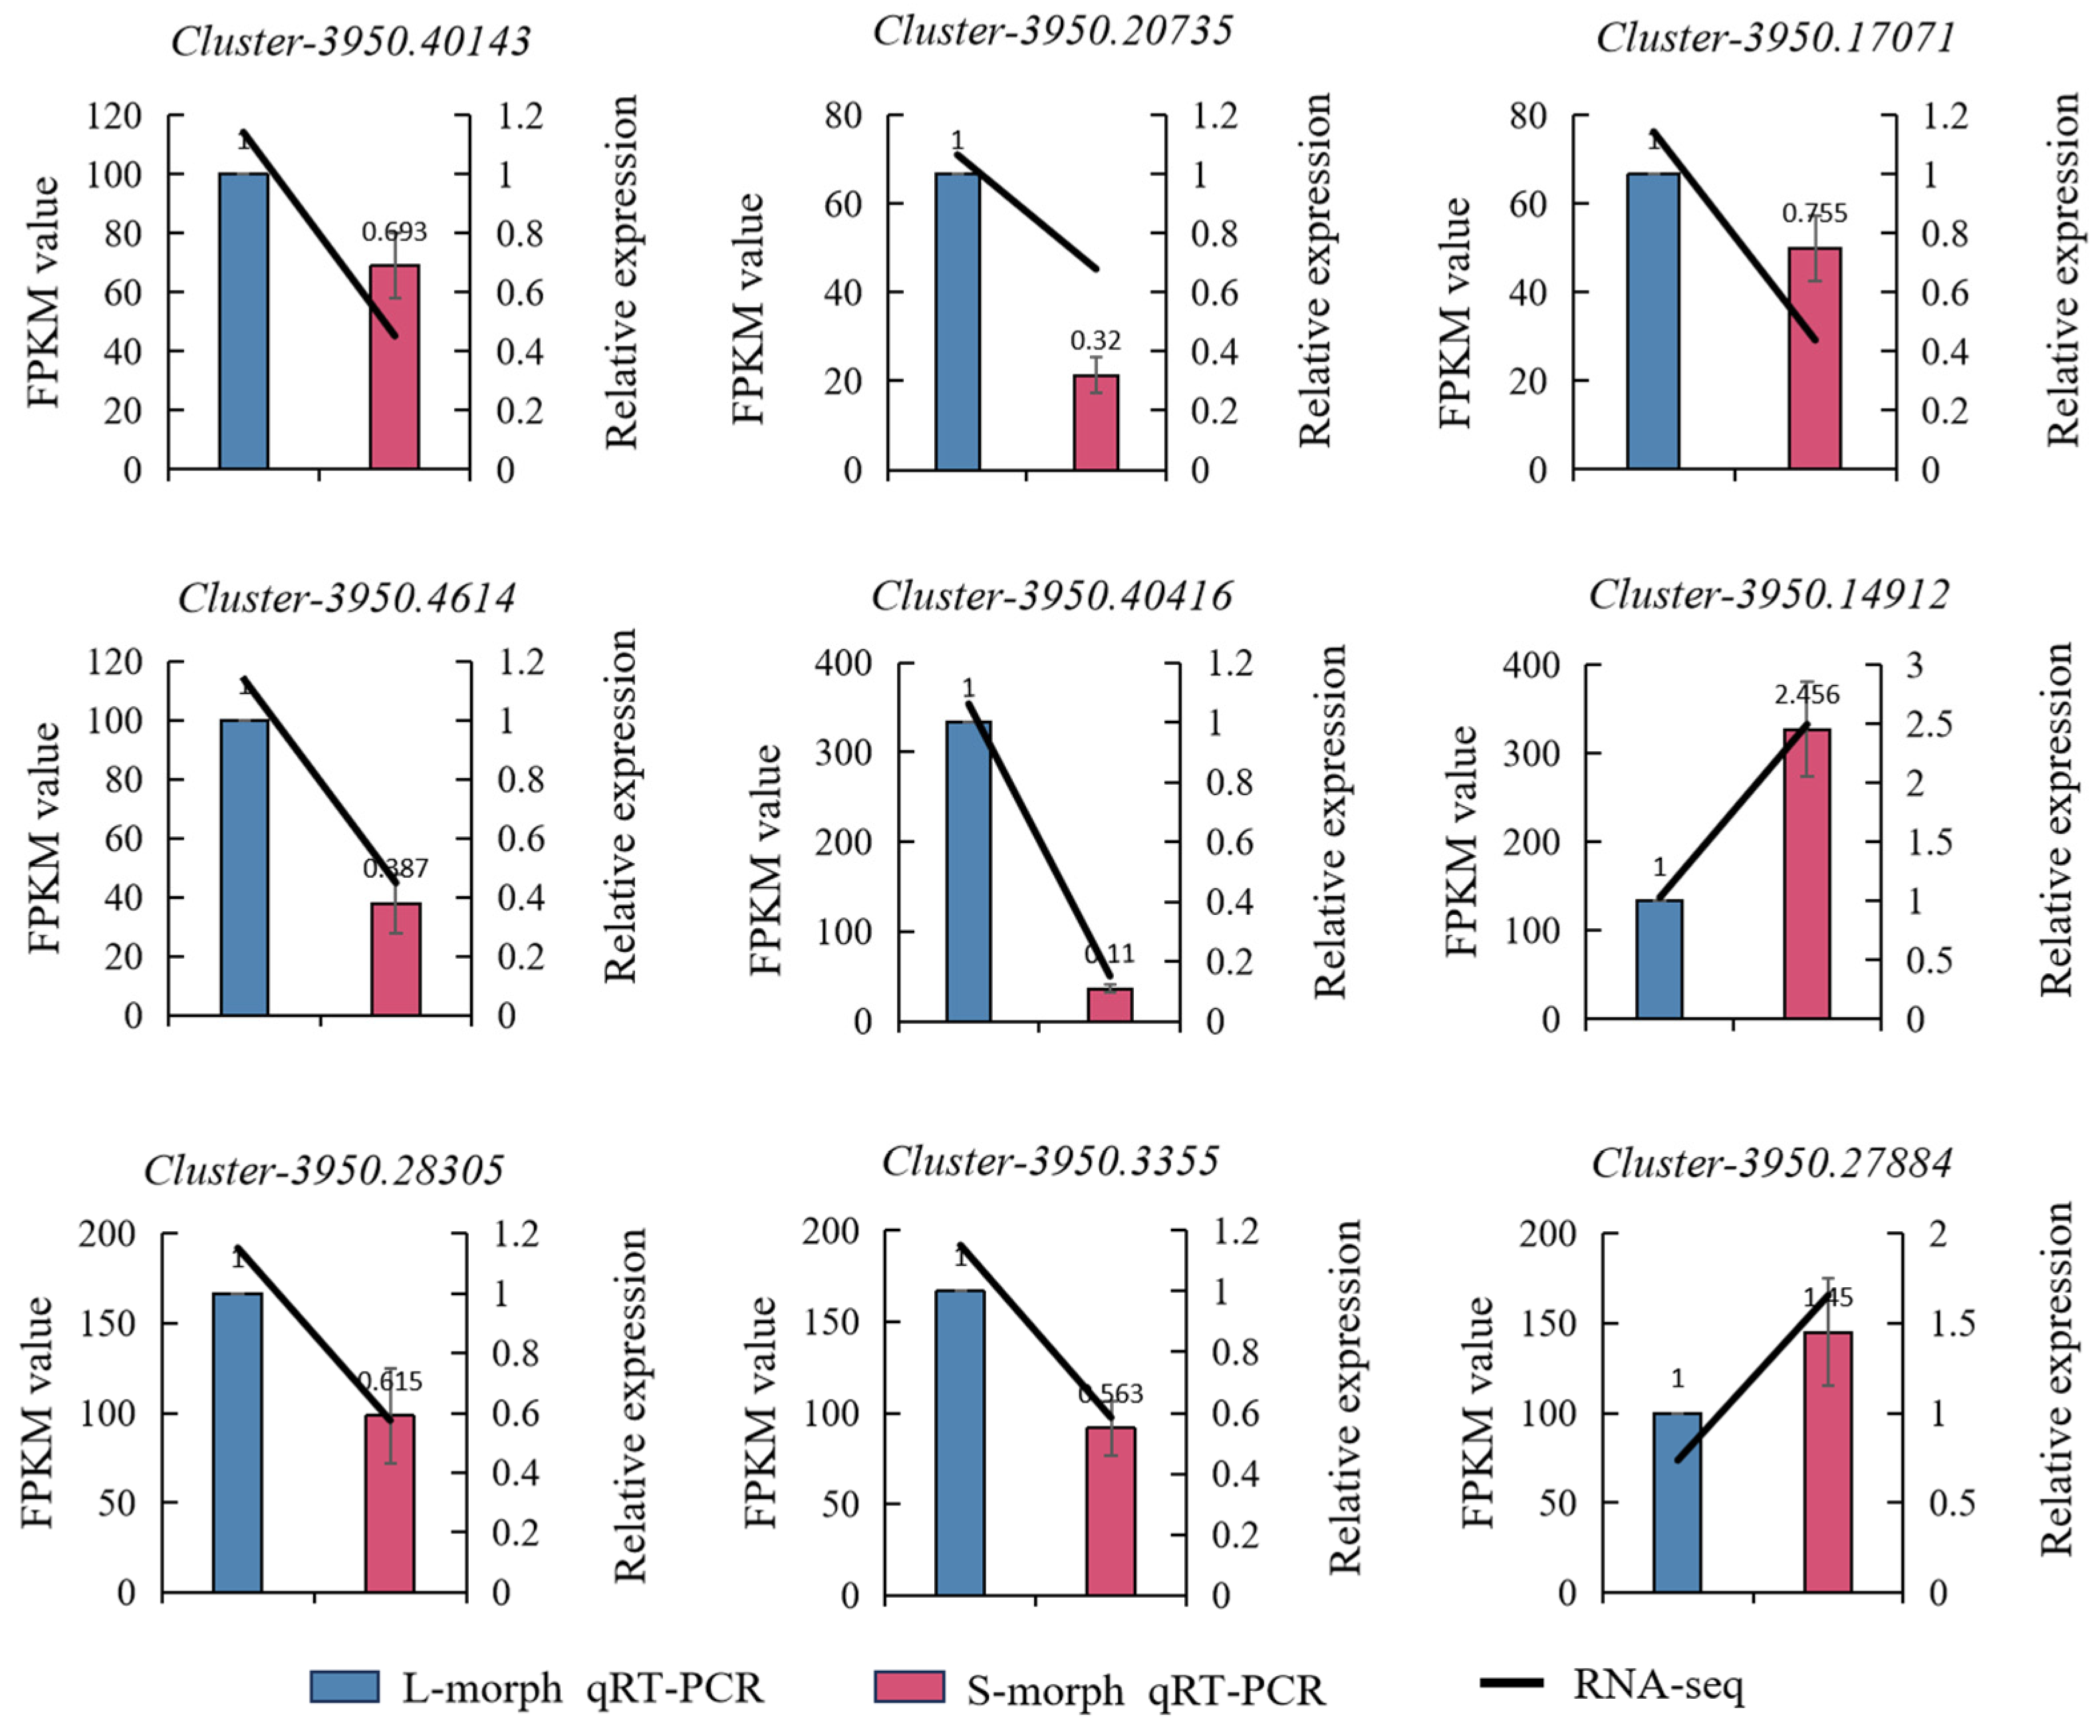
We subjected 9 regulatory genes involved in the biosynthetic pathways of anthocyanin to qRT-PCR analysis. The results showed that 7 of these genes were highly expressed in L-morph but only the 2 genes were highly expressed in S-morph. The outcomes of this analysis indicated that the transcriptome data were highly consistent with the expression profiles of genes associated with the differentially expressed genes in the L-morph and S-morph. This consistency implies that the transcriptome data can effectively represent the gene expression status related to these two morphs. The expression levels of Cluster-3950.40143, Cluster-3950.20735, Cluster-3950.17071, Cluster-3950.4614, Cluster-3950.40416, Cluster-3950.28305, and Cluster-3950.3355 in the L-morph were 1.443, 2.584, 1.325, 2.584, 9.091, 1.626, and 1.773 times, respectively, those in the S-morph, which may play a role in the development of the L-morph. In contrast, the expression levels of Cluster-3950.14912 and Cluster-3950.27884 in the L-morph were 0.407 and 0.69 times, respectively, those in the S-morph, which might played a role in the development of the S-morph (Figure 7).
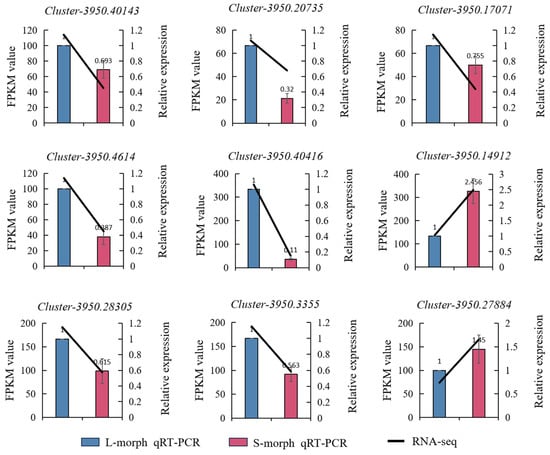
Figure 7.
Real-time PCR validation. The bar graph represents the relative expression levels of qRT-PCR (right y-axis). Blue represents the long morph, and pink represents the short morph. The line graph represents the expression levels of RNA-Seq (left y-axis).
4. Discussion
Distyly is a genetically controlled floral polymorphism that has two distinct flower types. Variance between different styles and anthers of P. vulgaris was for the expression of different functions. The distyly promotes inter-pollination through pollen separation on pollinators, while reducing self-pollination and intra-pollination [5,57]. In the process of stigma recognition, the papillae are first contacted by the papillae cells, which in most cases show dimorphism in dimorphic-style plants [58,59,60]. In this study, we also found that papillae cells of L-morph and S-morph of P. vulgaris showed significant differences. The style cells of L-morph showed significant differences from those of S-morph. The formation of L-morph and S-morph was closely related to the differentiation of cell numbers. The style cells of L-morph were significantly longer than those of S-morph, indicating that the formation of L-morph and S-morph was also related to the differentiation of cell sizes. This is consistent with the findings of Webster and Gilmartin [18]. The results of these studies will provide a direction for subsequent research, while molecular pathways related to cell number or cell size differentiation can be effectively selected to investigate the molecular mechanisms of L-morph and S-morph formation according to different species [61,62,63].
It was shown that when comparing the different stages of L-morph and S-morph development, although more genes were differentially expressed in the middle and late stages, more differentially expressed transcripts were found in the mature stage of development than in the early stage of development [64]. However, most of the genes in the later stages of development were not related to the control of style length. Therefore, columns at the first-flowering stage were used as samples. In this experiment, transcriptome sequencing and differential gene analysis were performed in both L- and S-morphs using RNA-seq technology. By differential gene expression analysis, 2822 DEGs were identified in both L-morph and S-morph.
Transcription factors are important factors that regulate gene expression, and in plants, transcription factors are involved in and play important roles in almost all biological processes [65]. Recent studies have shown that AP2/ERF TFs are involved in pistil development, and that loss of function of the ERF subfamily transcription factor DRNL affects pistil development in Arabidopsis thaliana, resulting in altered pistil morphology and failure of the majority of fertilized eggs to develop into fruits [66]. The bZIP gene is involved in the regulation of flower growth and development in plants. The maize DLF1 gene is a homolog of the Arabidopsis FD gene and encodes a protein of the bZIP family, and loss of DLF1 gene function results in delayed flowering in maize [67]. C3H proteins play an important role in plant growth and development, and over-expression of Arabidopsis AtTZF1 (AtC3H23) delays flowering and plant development [68]. TFs such as C2H2, MYB, and LIM are also involved in plant growth and development [69,70,71]. In this study, the six most highly expressed TFs were AP2/ERF, bZIP, C2H2, MYB, LIM, and C3H, suggesting that these transcription factors may be related to the phenomenon of stylar dimorphism.
β-Glucosidases regulate cell differentiation and are involved in plant growth and development by releasing hormones [72,73]. In relevant in vitro assays, β-glucosidases could hydrolyze the glycosides of growth hormone and cytokinin, and could also activate these hormones [74,75]. It has been found that β-glucosidases can be classified into eight families, including GH1, GH3, GH5, GH7, GH9, GH12, GH35, and GH116, based on their amino acid sequences. Members of the GH1 gene family in rice hydrolyze ABA-glucosyl esters and increase ABA levels, which in turn affect rice growth and development [76]; The OSGH3 gene in rice regulates the crosstalk between the IAA, JA, and SA signaling pathways [51]. Phytohormone-related elements are present in the promoter sequence of the GH3 gene family, which has indole-3-acetic acid amidase activity and is capable of being induced by growth hormone expression [77,78]. These studies have shown that β-glucosidases are involved in the hormone metabolism of plants, providing a reference for L-morph and S-morph differentiation. In the present study, it was shown that β-glucosidase is highly expressed in long styles and may indirectly regulate the growth of L-morph.
Phytohormones have an effect on the development of floral organs, and according to existing reports, IAA is thought to promote mainly pistil development [79,80], and the hormone SA promotes floral organ development and differentiation [81]. ARF6 and ARF8, which are expressed in the stigma, can affect the development of floral organs by altering the content of jasmonic acid (JA) [82]. In the present study, GH3 and SAUR were up-regulated in the phytohormone signaling pathway, and it was speculated that they might be related to L-morph and S-morph formation. In rice studies, it was found that increased expression of GH3s resulted in decreased IAA content and increased leaf pinning, suggesting that GH3 can affect plant growth substance content and alter plant growth and morphology by altering its expression. Researchers also discovered that the OsSAUR54 gene in the stigma of rice can promote the growth and development of floral organs and cell elongation, and in cotton, GhSAUR33 also had a similar function [82], which was similar to the results of the present study. The number of up-regulated genes in SAUR genes in this experiment was more than the number of down-regulated genes, and Cluster-3950.40416 had the largest differential multiplicity, which might regulate the formation of the long-styled type.
Further analysis revealed that there are many other genes related to plant growth and development that may be involved in the formation of long and short styles, such as WRKY, genes of the bHLH, C2H2, and NAC families. Members of the WRKY family are involved in regulating various physiological processes specific to plants and it has been found that the formation of distyiy is associated with Ca2+. Ca2+ binding is also dependent on some proteins of the WRKY family. This suggests that members of the WRKY family are indirectly involved in the development of L-morph and S-morph. It has been shown that bHLH is involved in the regulation of cell proliferation and cell differentiation. C2H2 has an important role in plant growth and development [83,84]. NAC is involved in several aspects of cell growth and development, such as cell differentiation of the apical meristem and cell differentiation and proliferation of stamens [85,86].
In the transcriptome data of P. vulgaris, we searched for genes that may be associated with style atypia, including Glo, Pfc63623, S-Rnase, SRK, SCR, SLG, ARCI, Exo70A1, MLPK, HT-B, TSS1, Chitinase. Genes associated with the S-locus include CYP734A50, GLO2, GLO1, SLL1, and SLL2. There were 7 homologous genes of Exo70A1, MLPK, CYP734A50, GLO2, GLO1, SLL1 and SLL2, but no differential expression (Table S8). The difference in results may be related to the variety of primrose and the sampling period. Further verification is needed to determine whether these differential genes found in the paper regulate the formation of distyly.
The DEGs discovered so far only outline a preliminary picture of revealing the formation mechanism of distyly, and there is still a long way to go before constructing a complete and solid theoretical system. For subsequent verification, gene-editing techniques such as the CRISPR/Cas9 system can be considered. Specifically, precisely knock out or edit the target differentially expressed genes, and observe whether, under the condition of gene function loss or alteration, the plant’s style morphology changes from distyly to other types, or whether the distyly characteristics weaken or disappear. Gene over-expression techniques can also be used to over-express specific differentially expressed genes in plants. If this induces non-distylous plants to develop distyly-like characteristics, or significantly enhances the relevant characteristics of distylous plants, it indicates that the gene is related to the formation of distyly. In addition, by constructing a gene co-expression network and analyzing the interaction relationships between differentially expressed genes and other known genes, it is possible to assist in determining the coordinated regulatory pathways of these genes in the formation of distyly. Only through rigorous and diverse experimental verifications to clarify the specific regulatory functions of these differentially expressed genes in the formation of distyly can we provide new and well-founded theoretical bases for the formation of distyly, promote a qualitative leap in research in this field, and lay a solid foundation for a deeper understanding of the evolutionary mechanisms of plant reproductive strategies.
5. Conclusions
The distyly could be distinguished by observing the height of the anthers and the height of the stigma. There were differences in corolla tube height, stigma height, anther height, central floral tube diameter, stigma depth, and ovary height, stigma papillae cells, style cell length, and style cell width between L-morph and S-morph. Based on the transcriptome data, 2822 DEGs were screened, including 2038 up-regulated genes and 786 down-regulated genes. Enrichment analysis showed that genes differentially expressed in L-morph and S-morph were associated with GO and KEGG pathways, and a large number of genes were involved in multiple metabolic pathways, including oxidoreductase activity, phenyl propane biosynthesis, phytohormone signaling, and plant-pathogen interactions pathways. On this basis, the DEGs that may control L-morph and S-morph were investigated. TFs of the DEGs were predicted, and the six TFs with the highest expression levels were presented. These six TFs may all be related to the development of long-styled and short-styled flowers in Primula vulgaris. Genes related to β-glucosidase and phytohormone signaling pathways were highly expressed in long styles, which may be involved in L-morph development, which in turn may lead to the differential presentation of L-morph and S-morph. This study has identified the DEGs between long- and short-styled flowers. Future research can build on this foundation to verify the functions of these genes through gene-editing techniques and over-expression techniques, thereby clarifying the specific regulatory functions of these DEGs in the formation process of distyly.
Supplementary Materials
The following supporting information can be downloaded at: https://www.mdpi.com/article/10.3390/agronomy15040997/s1, Figure S1: The number and length distribution of assembled unigenes; Figure S2: Unigene annotation using seven databases; Figure S3: Number of differential genes significantly enriched in GO terms; Table S1: Reference gene and qRT-PCR gene primer synthesis; Table S2: Statistical results of sequencing data; Table S3: All gene expression levels; Table S4: List of differentially expressed genes (DEGs); Table S5: List of transcription factors and their family names; Table S6: Genes with large fold differences between phenyl propane synthesis pathway and plant hormone signaling pathway; Table S7: The ID and symbol of the key node gene; Table S8: Homologous genes comparison results.
Author Contributions
Conceptualization, X.Z. and P.L.; Methodology, H.S.; Validation, Y.W., J.L. and L.L.; Formal analysis, F.C., J.M. and J.L.; Investigation, H.S., F.C. and Y.W.; Resources, J.M.; Data curation, Y.X. and L.L.; Writing—original draft preparation, X.W.; Writing—review, and editing, X.Z. and P.L.; Visualization, X.W. and Y.X.; Funding acquisition, X.Z. All authors have read and agreed to the published version of the manuscript.
Funding
The research was funded by the Natural Science Foundation of Hebei Province under grant No. C2024204169 and C2021204113; Shijiazhuang Basic Research Project of Universities Located in Hebei Province under grant No. 241790957A; National Natural Science Foundation of China, grant No. 32301641, Basic Scientific Research Projects of Provincial Universities in Hebei Province, grant No. KY2023052, grant No. KY2050205.
Data Availability Statement
The datasets presented in this study can be found in online repositories. The data information is publicly accessible at the NCBI under BioProject PRJNA916843.
Conflicts of Interest
The authors declare no conflicts of interest.
References
- Li, J.; Li, P.; Li, J.; Zhang, L.; Zhang, X. Morphological Characteristics and Molecular Markers of Distyly in Primula obconica. Euphytica 2023, 219, 72. [Google Scholar] [CrossRef]
- Li, L.; Ye, J.; Li, H.; Shi, Q. Characterization of Metabolites and Transcripts Involved in Flower Pigmentation in Primula vulgaris. Front. Plant Sci. 2020, 11, 572517. [Google Scholar] [CrossRef] [PubMed]
- Ganders, F.R. The biology of heterostyly. N. Z. J. Bot. 1979, 17, 607–635. [Google Scholar] [CrossRef]
- Lloyd, D.; Webb, C. The evolution of heterostyly. In Evolution and Function of Heterostyly; Springer: Berlin/Heidelberg, Gernmany, 1992; pp. 151–178. [Google Scholar]
- Franklin-Tong, V.E.; Barrett, S.C.H.; Shore, J.S. New insights on heterostyly: Comparative biology, ecology and genetics. In Self-Incompatibility in Flowering Plants; Springer: Berlin/Heidelberg, Germany, 2008; pp. 3–32. [Google Scholar]
- Darwin, C. The Different Forms of Flowers on Plants of the Same Species; D. Appleton: Boston, MA, USA, 1897. [Google Scholar]
- Barrett, S.C. The evolution and adaptive significance of heterostyly. Trends Ecol. Evol. 1990, 5, 144–148. [Google Scholar] [CrossRef]
- Wu, X.; Li, P.; Deng, X.; Zhang, D. Distyly and cryptic heteromorphic self-incompatibility in Mussaenda macrophylla (Rubiaceae). J. Syst. Evol. 2015, 53, 166–178. [Google Scholar] [CrossRef]
- Allen, M.; Alderson, P. Scotland’s purple primrose Primula scotica. Plantsman 1991, 13, 141–142. [Google Scholar]
- Chen, M.; Zhao, X.; Zuo, X.; Wang, S.; Qu, H.; Ping, Y.; Ma, X.; Liu, L. Comparative effects of pollen limitation, floral traits and pollinators on reproductive success of Hedysarum scoparium Fisch. et Mey. in different habitats. BMC Plant Biol. 2021, 21, 426. [Google Scholar] [CrossRef]
- Dulberger, R. Floral Polymorphisms and Their Functional Significance in the Heterostylous Syndrome. In Evolution and Function of Heterostyly; Barrett, S.C.H., Ed.; Springer: Berlin/Heidelberg, Germany, 1992; pp. 41–84. [Google Scholar]
- Barrett, S.C. The evolution of plant sexual diversity. Nat. Rev. Genet. 2002, 3, 274–284. [Google Scholar] [CrossRef]
- Webster, M.A.; Gilmartin, P.M. A comparison of early floral ontogeny in wild-type and floral homeotic mutant phenotypes of Primula. Planta 2003, 216, 903–917. [Google Scholar] [CrossRef]
- Zhou, W.; Barrett, S.C.; Li, H.; Wu, Z.; Wang, X.; Wang, H.; Li, D. Phylogeographic insights on the evolutionary breakdown of heterostyly. New Phytol. 2017, 214, 1368–1380. [Google Scholar] [CrossRef]
- Yang, X.; Huang, Y.; Li, Z.; Chen, J. Complete plastid genome of Primula calliantha Franch. (Primulaceae): An alpine ornamental plant endemic to Hengduan Mountain, China. Mitochondrial DNA B 2021, 6, 2643–2645. [Google Scholar] [CrossRef] [PubMed]
- Zhao, Z.; Luo, Z.; Yuan, S.; Mei, L.; Zhang, D. Global transcriptome and gene co-expression network analyses on the development of distyly in Primula oreodoxa. Heredity 2019, 123, 784–794. [Google Scholar] [CrossRef] [PubMed]
- Barrett, S.C. ‘A most complex marriage arrangement’: Recent advances on heterostyly and unresolved questions. New Phytol. 2019, 224, 1051–1067. [Google Scholar] [CrossRef]
- Webster, M.A.; Gilmartin, P.M. Analysis of late stage flower development in Primula vulgaris reveals novel differences in cell morphology and temporal aspects of floral heteromorphy. New Phytol. 2006, 171, 591–603. [Google Scholar] [CrossRef]
- Zhang, L.; Li, P.; Zhang, X.; Li, J. Two floral forms in the same species-distyly. Planta 2023, 258, 72. [Google Scholar] [CrossRef] [PubMed]
- Brys, R.; Jacquemyn, H.; Hermy, M.; Beeckman, T. Pollen deposition rates and the functioning of distyly in the perennial Pulmonaria officinalis (Boraginaceae). Plant Syst. Evol. 2008, 273, 1–12. [Google Scholar] [CrossRef]
- Şafak Odabaşi, N. Pollen morphology of Linum L. section Syllinum griseb. (Linaceae) of Turkey. Grana 2022, 61, 256–283. [Google Scholar] [CrossRef]
- Williams, J.H.; Reese, J.B. Evolution of development of pollen performance. Curr. Top. Dev. Biol. 2019, 131, 299–336. [Google Scholar] [CrossRef]
- Barrett, S.C. Darwin’s legacy: The forms, function and sexual diversity of flowers. Philos. Trans. R. Soc. Lond. B Biol. Sci. 2010, 365, 351–368. [Google Scholar] [CrossRef]
- McCubbin, A. Heteromorphic Self-Incompatibility in Primula: Twenty-First Century Tools Promise to Unravel a Classic Nineteenth Century Model System. In Self-Incompatibility in Flowering Plants: Evolution, Diversity, and Mechanisms; Franklin-Tong, V.E., Ed.; Springer: Berlin/Heidelberg, Germany, 2008; pp. 289–308. [Google Scholar]
- Lu, W.; Bian, X.; Yang, W.; Cheng, T.; Wang, J.; Zhang, Q.; Pan, H. Transcriptomics investigation into the mechanisms of self-incompatibility between pin and thrum morphs of Primula maximowiczii. Int. J. Mol. Sci. 2018, 19, 1840. [Google Scholar] [CrossRef]
- Tendal, K.; Ørgaard, M.; Larsen, B.D.; Pedersen, C. Recurrent hybridisation events between Primula vulgaris, P. veris and P. elatior (Primulaceae, Ericales) challenge the species boundaries: Using molecular markers to re-evaluate morphological identifications. Nord. J. Bot. 2018, 36, e01778. [Google Scholar] [CrossRef]
- de Vos, J.M.; Hughes, C.E.; Schneeweiss, G.M.; Moore, B.R.; Conti, E. Heterostyly accelerates diversification via reduced extinction in Primroses. Proc. R. Soc. B Biol. Sci. 2014, 281, 20140075. [Google Scholar] [CrossRef]
- Pandey, K.K.; Troughton, J.H. Scanning electron microscopic obser vations of pollen grains and stigma in the self-incompatible heteromorphic species Primula malacoides Franch. and Forsythia x intermedia Zab., and genetics of sporopollenin deposition. Euphytica 1974, 23, 337–344. [Google Scholar] [CrossRef]
- Kálmán, K.; Medvegy, A.; Mihalik, E. Pattern of the floral variation in the hybrid zone of two distylous Primula species. Flora-Morphol. Distrib. Funct. Ecol. Plants 2004, 199, 218–227. [Google Scholar] [CrossRef]
- Bateson, W.H.; Gregory, R.P. On the Inheritance of Heterostylism in Primula. Proc. R. Soc. Lond. Ser. B Contain. Pap. A Biol. Character 1905, 76, 581–586. [Google Scholar]
- Haldane, J.B.S. Heterostylism in natural populations of the Primrose, Primula acaulis. Biometrika 1938, 30, 196–198. [Google Scholar]
- Ernst, A. Heterostylie-Forschung: Versuche zur genetischen Analyse eines Organisations-und „Anpassungs “merkmales. Z. Für Indukt. Abstamm.Und Vererbungslehre 1936, 71, 156–230. [Google Scholar] [CrossRef]
- Lewis, D.; Jones, D.A. The Genetics of Heterostyly; Springer: Berlin/Heidelberg, Germany, 1992. [Google Scholar]
- Charlesworth, D. The status of supergenes in the 21st century: Recombination suppression in Batesian mimicry and sex chromosomes and other complex adaptations. Evol. Appl. 2016, 9, 74–90. [Google Scholar] [CrossRef]
- Li, J.; Cocker, J.M.; Wright, J.; Webster, M.A.; McMullan, M.; Dyer, S.; Swarbreck, D.; Caccamo, M.; Oosterhout, C.V.; Gilmartin, P.M. Genetic architecture and evolution of the S locus supergene in Primula vulgaris. Nat. Plants 2016, 2, 16188. [Google Scholar] [CrossRef]
- Burrows, B.A.; McCubbin, A.G. Sequencing the genomic regions flanking S-linked PvGLO sequences confirms the presence of two GLO loci, one of which lies adjacent to the style-length determinant gene CYP734A50. Plant Reprod. 2017, 30, 53–67. [Google Scholar] [CrossRef]
- Huu, C.N.; Kappel, C.; Keller, B.; Sicard, A.; Takebayashi, Y.; Breuninger, H.; Nowak, M.D.; Bäurle, I.; Himmelbach, A.; Burkart, M.; et al. Presence versus absence of CYP734A50 underlies the style-length dimorphism in Primroses. Elife 2016, 5, e17956. [Google Scholar] [CrossRef] [PubMed]
- Nowak, M.D.; Russo, G.; Schlapbach, R.; Huu, C.N.; Lenhard, M.; Conti, E. The draft genome of Primula veris yields insights into the molecular basis of heterostyly. Genome Biol. 2015, 16, 12. [Google Scholar] [CrossRef]
- Huu, C.N.; Keller, B.; Conti, E.; Kappel, C.; Lenhard, M. Supergene evolution via stepwise duplications and neofunctionalization of a floral-organ identity gene. Proc. Natl. Acad. Sci. USA 2020, 117, 23148–23157. [Google Scholar] [CrossRef]
- Ohnishi, T.; Nomura, T.; Watanabe, B.; Ohta, D.; Yokota, T.; Miyagawa, H.; Sakata, K.; Mizutani, M. Tomato cytochrome P450 CYP734A7 functions in brassinosteroid catabolism. Phytochemistry 2006, 67, 1895–1906. [Google Scholar] [CrossRef] [PubMed]
- Thornton, L.E.; Peng, H.; Neff, M.M. Rice CYP734A cytochrome P450s inactivate brassinosteroids in Arabidopsis. Planta 2011, 234, 1151–1162. [Google Scholar] [CrossRef]
- Huu, C.N.; Plaschil, S.; Himmelbach, A.; Kappel, C.; Lenhard, M. Female self-incompatibility type in heterostylous Primula is determined by the brassinosteroid-inactivating cytochrome P450 CYP734A50. Curr. Biol. 2021, 32, 671–676.e5. [Google Scholar] [CrossRef]
- Potente, G.; Stubbs, R.L.; Yousefi, N.; Pirovano, W.; Szövényi, P.; Conti, E. Comparative transcriptomics reveals commonalities and differences in the genetic underpinnings of a floral dimorphism. Sci. Rep. 2022, 12, 20771. [Google Scholar] [CrossRef] [PubMed]
- Charlesworth, B. Evolutionary rates in partially self-fertilizing species. Am. Nat. 1992, 140, 126–148. [Google Scholar] [CrossRef]
- Liu, Y.; Si, W.; Fu, S.; Wang, J.; Cheng, T.; Zhang, Q.; Pan, H. PfPIN5 promotes style elongation by regulating cell length in Primula forbesii Franch. Ann. Bot. 2024, 133, 473–482. [Google Scholar] [CrossRef]
- Grabherr, M.G.; Haas, B.J.; Yassour, M.; Levin, J.Z.; Thompson, D.A.; Amit, I.; Adiconis, X.; Fan, L.; Raychowdhury, R.; Zeng, Q.; et al. Trinity: Reconstructing a full-length transcriptome without a genome from RNA-Seq data. Nat. Biotechnol. 2011, 29, 644–652. [Google Scholar] [CrossRef]
- Li, B.; Dewey, C.N. RSEM: Accurate transcript quantification from RNA-Seq data with or without a reference genome. BMC Bioinform. 2011, 12, 323. [Google Scholar] [CrossRef] [PubMed]
- Trapnell, C.; Williams, B.A.; Pertea, G.; Mortazavi, A.; Kwan, G.; van Baren, M.J.; Salzberg, S.L.; Wold, B.J.; Pachter, L. Transcript assembly and quantification by RNA-Seq reveals unannotated transcripts and isoform switching during cell differentiation. Nat. Biotechnol. 2010, 28, 511–515. [Google Scholar] [CrossRef]
- Deng, Y.; Jianqi, L.I.; Songfeng, W.U.; Zhu, Y.; Chen, Y.; Fuchu, H.E. Integrated Nr Database in Protein Annotation System and Its Localization. Comput. Eng. 2006, 32, 71–72. [Google Scholar]
- El-Gebali, S.; Mistry, J.; Bateman, A.; Eddy, S.R.; Luciani, A.; Potter, S.C.; Qureshi, M.; Richardson, L.J.; Salazar, G.A.; Smart, A.; et al. The Pfam protein families database in 2019. Nucleic Acids Res. 2019, 47, D427–D432. [Google Scholar] [CrossRef]
- Koonin, E.V.; Fedorova, N.D.; Jackson, J.D.; Jacobs, A.R.; Krylov, D.M.; Makarova, K.S.; Mazumder, R.; Mekhedov, S.L.; Nikolskaya, A.N.; Rao, B.S.; et al. A comprehensive evolutionary classification of proteins encoded in complete eukaryotic genomes. Genome Biol. 2004, 5, R7. [Google Scholar] [CrossRef] [PubMed]
- Rolf, A.; Amos, B.; Wu, C.H.; Barker, W.C.; Brigitte, B.; Serenella, F.; Elisabeth, G.; Huang, H.; Rodrigo, L.; Michele, M. UniProt: The Universal Protein knowledgebase. Nucleic Acids Res. 2004, 32, D115–D119. [Google Scholar]
- Kanehisa, M.; Goto, S.; Kawashima, S.; Okuno, Y.; Hattori, M. The KEGG resource for deciphering the genome. Nucleic Acids Res. 2004, 32, D277–D280. [Google Scholar] [CrossRef]
- Dimmer, E.C.; Huntley, R.P.; Alam-Faruque, Y.; Sawford, T.; O’Donovan, C.; Martin, M.J.; Bely, B.; Browne, P.; Mun Chan, W.; Eberhardt, R.; et al. The UniProt-GO annotation database in 2011. Nucleic Acids Res. 2012, 40, D565–D570. [Google Scholar] [CrossRef]
- Love, M.I.; Huber, W.; Anders, S. Moderated estimation of fold change and dispersion for RNA-seq data with DESeq2. Genome Biol. 2014, 15, 550. [Google Scholar] [CrossRef]
- Livak, K.J.; Schmittgen, T.D. Analysis of relative gene expression data using real-time quantitative PCR and the 2(-Delta Delta C(T)) Method. Methods 2001, 25, 402–408. [Google Scholar] [CrossRef]
- Ashman, T.L.; Arceo-Gómez, G.; Bennett, J.M.; Knight, T.M. Is heterospecific pollen receipt the missing link in understanding pollen limitation of plant reproduction? Am. J. Bot. 2020, 107, 845–847. [Google Scholar] [CrossRef] [PubMed]
- Barranco, D.; Arroyo, J.; Santos-Gally, R. Avoiding sexual interference: Herkogamy and dichogamy in style dimorphic flowers of Narcissus broussonetii (Amaryllidaceae). AoB Plants 2019, 11, plz038. [Google Scholar] [CrossRef]
- Breygina, M.; Klimenko, E.; Schekaleva, O. Pollen Germination and Pollen Tube Growth in Gymnosperms. Plants 2021, 10, 1301. [Google Scholar] [CrossRef] [PubMed]
- Broz, A.K.; Bedinger, P.A. Pollen-Pistil Interactions as Reproductive Barriers. Annu. Rev. Plant Biol. 2021, 72, 615–639. [Google Scholar] [CrossRef]
- Larson, B.M.; Barrett, S.C. Reproductive biology of island and mainland populations of Primula mistassinica (Primulaceae) on Lake Huron shorelines. Can. J. Bot. 1998, 76, 1819–1827. [Google Scholar]
- Eckert, C.G.; Allen, M. Cryptic self-incompatibility in tristylous Decodon verticillatus (Lythraceae). Am. J. Bot. 1997, 84, 1391–1397. [Google Scholar] [CrossRef]
- Broyles, S.B.; Wyatt, R. The consequences of self-pollination in Asclepias exaltata, a self-incompatible milkweed. Am. J. Bot. 1993, 80, 41–44. [Google Scholar]
- Burrows, B.; McCubbin, A. Examination of S-Locus Regulated Differential Expression in Primula vulgaris Floral Development. Plants 2018, 7, 38. [Google Scholar] [CrossRef]
- Jakoby, M.; Weisshaar, B.; Dröge-Laser, W.; Vicente-Carbajosa, J.; Tiedemann, J.; Kroj, T.; Parcy, F. bZIP transcription factors in Arabidopsis. Trends Plant Sci. 2002, 7, 106–111. [Google Scholar] [CrossRef]
- Durán-Medina, Y.; Serwatowska, J.; Reyes-Olalde, J.I.; de Folter, S.; Marsch-Martínez, N. The AP2/ERF Transcription Factor DRNL Modulates Gynoecium Development and Affects Its Response to Cytokinin. Front. Plant Sci. 2017, 8, 1841. [Google Scholar] [CrossRef]
- Muszynski, M.G.; Dam, T.; Li, B.; Shirbroun, D.M.; Hou, Z.; Bruggemann, E.; Archibald, R.; Ananiev, E.V.; Danilevskaya, O.N. Delayed flowering1 Encodes a basic leucine zipper protein that mediates floral inductive signals at the shoot apex in Maize. Plant Physiol. 2006, 142, 1523–1536. [Google Scholar] [CrossRef] [PubMed]
- Lin, P.C.; Pomeranz, M.C.; Jikumaru, Y.; Kang, S.G.; Hah, C.; Fujioka, S.; Kamiya, Y.; Jang, J.C. The Arabidopsis tandem zinc finger protein AtTZF1 affects ABA- and GA-mediated growth, stress and gene expression responses. Plant J. 2011, 65, 253–268. [Google Scholar] [CrossRef] [PubMed]
- Li, L.; Li, Y.; Wang, N.N.; Li, Y.; Lu, R.; Li, X.B. Cotton LIM domain-containing protein GhPLIM1 is specifically expressed in anthers and participates in modulating F-actin. Plant Biol. 2015, 17, 528–534. [Google Scholar] [CrossRef]
- Xue, C.; Yao, J.; Xue, Y.; Su, G.; Wang, L.; Lin, L.; Allan, A.C.; Zhang, S.; Wu, J. PbrMYB169 positively regulates lignification of stone cells in pear fruit. J. Exp. Bot. 2019, 70, 1801–1814. [Google Scholar] [CrossRef]
- Liu, Y.; Khan, A.R.; Gan, Y. C2H2 Zinc Finger Proteins Response to Abiotic Stress in Plants. Int. J. Mol. Sci. 2022, 23, 2730. [Google Scholar] [CrossRef] [PubMed]
- Brzobohaty, B.; Moore, I.; Kristoffersen, P.; Bako, L.; Campos, N.; Schell, J.; Palme, K. Release of active cytokinin by a beta-glucosidase localized to the maize root meristem. Science 1993, 262, 1051–1054. [Google Scholar] [CrossRef]
- Dharmawardhana, D. A beta-glucosidase from Lodgepole pine xylem specific for the lignin precursor coniferin. Plant Physiol. 1995, 107, 331–339. [Google Scholar] [CrossRef]
- Falk, A.; Rask, L. Expression of a zeatin-o-glucoside-degrading beta-glucosidase in Brassica napus. Plant Physiol. 1995, 108, 1369–1377. [Google Scholar] [CrossRef]
- Schliemann, W. Hydrolysis of Conjugated Gibberellins by β-Glucosidases from Dwarf Rice (Oryza sativa L. cv. Tan-ginbozu). J. Plant Physiol. 1984, 116, 123–132. [Google Scholar] [CrossRef]
- Wang, C.; Chen, S.; Dong, Y.; Ren, R.; Chen, D.; Chen, X. Chloroplastic Os3BGlu6 contributes significantly to cellular ABA pools and impacts drought tolerance and photosynthesis in rice. New Phytol. 2020, 226, 1042–1054. [Google Scholar] [CrossRef]
- Zhang, C.; Zhang, L.; Wang, D.; Ma, H.; Liu, B.; Shi, Z.; Ma, X.; Chen, Y.; Chen, Q. Evolutionary history of the glycoside hydrolase 3 (gh3) family based on the sequenced genomes of 48 plants and identification of jasmonic acid-related gh3 proteins in Solanum tuberosum. Int. J. Mol. Sci. 2018, 19, 1850. [Google Scholar] [CrossRef] [PubMed]
- Ahmad, G.S.; Ranjan, P.D.; Kumar, M.T.; Niranjan, B. Genome-wide analysis of DUF221 domain-containing gene family in Oryza species and identification of its salinity stress-responsive members in rice. PLoS ONE 2017, 12, e0182469. [Google Scholar]
- Diggle, P.K.; Di Stilio, V.S.; Gschwend, A.R.; Golenberg, E.M.; Moore, R.C.; Russell, J.R.; Sinclair, J.P. Multiple developmental processes underlie sex differentiation in Angiosperms. Trends Genet. 2011, 27, 368–376. [Google Scholar] [CrossRef] [PubMed]
- Wang, Z.; Jiao, Z.; Xu, P.; Chen, L.; Ai, J.; Liu, X.; Yang, Y. Bisexual flower ontogeny after chemical induction and berry characteristics evaluation in male Vitis amurensis Rupr. Sci. Hortic. 2013, 162, 11–19. [Google Scholar] [CrossRef]
- Lunde, C.; Kimberlin, A.; Leiboff, S.; Koo, A.J.; Hake, S. Tasselseed5 overexpresses a wound-inducible enzyme, ZmCYP94B1, that affects jasmonate catabolism, sex determination, and plant architecture in Maize. Commun. Biol. 2019, 2, 114. [Google Scholar] [CrossRef]
- Zhang, S.; Wang, S.; Xu, Y.; Yu, C.; Shen, C.; Qian, Q.; Geisler, M.; Jiang, D.A.; Qi, Y. The auxin response factor, OsARF19, controls rice leaf angles through positively regulating OsGH3-5 and OsBRI1. Plant Cell Environ. 2015, 38, 638–654. [Google Scholar] [CrossRef]
- Chrispeels, H.E.; Oettinger, H.; Janvier, N.; Tague, B.W. AtZFP1, encoding Arabidopsis thaliana C2H2 zinc-finger protein 1, is expressed downstream of photomorphogenic activation. Plant Mol. Biol. 2000, 42, 279–290. [Google Scholar] [CrossRef]
- Han, G.; Lu, C.; Guo, J.; Qiao, Z.; Sui, N.; Qiu, N.; Wang, B. C2H2 Zinc Finger Proteins: Master Regulators of Abiotic Stress Responses in Plants. Front. Plant Sci. 2020, 11, 115. [Google Scholar] [CrossRef]
- Fang, Y.; You, J.; Xie, K.; Xie, W.; Xiong, L. Systematic sequence analysis and identification of tissue-specific or stress-responsive genes of NAC transcription factor family in rice. Mol. Genet. Genom. 2008, 280, 547–563. [Google Scholar] [CrossRef]
- Wang, J.; Wang, H.; Yang, H.; Hu, R.; Wei, D.; Tang, Q.; Wang, Z. The role of NAC transcription factors in flower development in plants. Chin. J. Biotechnol. 2022, 38, 2687–2699. [Google Scholar] [CrossRef]


Disclaimer/Publisher’s Note: The statements, opinions and data contained in all publications are solely those of the individual author(s) and contributor(s) and not of MDPI and/or the editor(s). MDPI and/or the editor(s) disclaim responsibility for any injury to people or property resulting from any ideas, methods, instructions or products referred to in the content. |
© 2025 by the authors. Licensee MDPI, Basel, Switzerland. This article is an open access article distributed under the terms and conditions of the Creative Commons Attribution (CC BY) license (https://creativecommons.org/licenses/by/4.0/).