Abstract
Turfgrass growth, performance and quality are affected by abiotic stress factors and are of primary concern for persons managing turfgrass areas under seasonal tropical climates. Under these conditions, common Savannahgrass (SG) may have a performance advantage over imported hybrid turfgrasses. A greenhouse study was conducted to comparatively evaluate the performance of tropical turfgrasses exposed to water and compaction related stresses across a range of soils, with or without the addition of a surface sand layer. Turfgrass productivity and quality was monitored over a four-month growth period. Clipping yield (CY) was lower at the higher compaction effort for all turfgrasses, but across all stresses, drought (D) and waterlogging (WL) resulted in lower CY. Values were significantly lower under D. SG had the highest clipping yield across all soils. The chlorophyll index (CI) was lower for all turfgrasses under water-induced stress compared to compaction stresses. SG had a significantly higher CI across all stress treatments. Correlation analysis showed a positive (r² = 0.420) and significant (p < 0.05) relationship between CY and CI. Similar to CI, stress type influenced turfgrass visual quality (VQ), with D stress, resulting in the lowest VQ rating among turfgrasses. Bermudagrass (BG) had the lowest VQ across all stress treatments, whilst, comparatively, Zoysiagrass (ZG) had significantly higher VQ under high compaction (HC), low compaction (LC) and WL stress. Overall, SG showed a higher level of tolerance to applied stresses and warrants greater attention as a potential turfgrass under tropical conditions.
1. Introduction
Increased use of turfgrasses for lawn, recreational and sporting areas across the Caribbean has created greater management needs, warranting a better scientific understanding of the effects of abiotic stresses on turfgrass growth and quality. Turfgrass areas are routinely exposed to various stress factors, including compaction, drought (D) and waterlogging (WL) and vary widely in their responses. Canaway and Baker [1] stated that the quality of a sports field surface is determined by turfgrass species and rootzone medium. If turf cover is reduced, foot traction and friction is lost, resulting in possible falls and injuries to the user. The reduction in turf cover increases surface hardness [1], which makes it difficult for the grass to re-grow in the exposed areas, which reduces visual quality (VQ).
Intense traffic on turfgrass areas signifies more frequent contact with the surface, resulting in increased compaction and surface hardness [2]. Dest et al. [3] noted that compaction alters the physical properties of soil by increasing its bulk density, thus affecting water and air movement and root penetration. Jiang and Wang [4] indicated that variation in moisture content in turfgrass rootzones can affect turfgrass growth and quality. In the Caribbean, turfgrass areas are routinely used for recreational and sporting events during periods of excess and or low rainfall, consistent with the tropical bimodal wet and dry climate. Cashman et al. [5] defined the dry season from December to April and the wet season coinciding with the hurricane season from June to November, with peak rainfall occurring at the start and end of this season. Water stress conditions affect normal plant functions and responses [6]. The extent to which compaction and water related stresses affect grass performance and quality has been investigated to a limited extent for Bermudagrass (BG) and Zoysiagrass (ZG); however, very little information is available on Common Savannahgrass (SG). Huang et al. [7] compared seven warm-season turf grasses for drought resistance and reported partial recovery of shoot dry matter production for Common BG and Emerald ZG, but full recovery for the Seashore Paspalums. The authors noted that although the latter grass is potentially versatile, very little is known about its response to drought stress. Common SG is dominant in turf areas, especially lawns and recreational areas throughout the Caribbean, but its response to drought and other stresses remain unclear.
The addition of sand on the soil surface as a rooting layer or through top-dressing has traditionally been used to alleviate traffic-related compaction and WL [8], whilst increasing rootzone aeration and improving drainage. Kowalewski et al. [9] stated that sand topdressing can be used to modify the soil texture, dilute soil organic matter and smooth the surface of a turfgrass system. Miller [10] found that sand top-dressing to a 0.6-cm depth increased surface hardness, stand density and rooting of BG maintained at a 2.5-cm height and subjected to intense traffic. Whilst sand improves rootzone physical conditions, Waddington et al. [11] noted that sand additions decrease cation exchange capacity and available nutrient levels in modified soils and are conducive to deficiencies of both macro- and micro-nutrients. This may negatively affect turfgrass growth and quality, depending on the root architecture and distribution and the turfgrass management. Where native soils represent subsoil material, the interactive influence of sand layering on grass performance and quality is not well researched. This condition is of particular relevance to the Caribbean, as the majority of soils are categorized in the clay textural class [12]. Turfgrass managers aim to maintain a green surface during stress periods for aesthetics, playability and safety [13]. The use of sand in turfgrass systems with Common SG is unevaluated and may potentially increase tolerance to abiotic stresses. The recuperative potential of turfgrasses is reduced under stress, and for turfgrasses exposed to traffic, this combination results in deterioration in grass cover [14,15]. Turfgrass recovery from stress situations is measured by shoot re-growth, density and the visual appearance of the turf [13,15]. This paper presents an analysis of the combinatory effects of different stresses on turfgrass performance, with the inclusion of chlorophyll index (CI) as a quantitative quality indicator. Bell et al. [16] found that reflectance from turfgrass was closely related to turfgrass quality or components of quality, such as color. Abiotic stresses affect turf quality, and we hypothesized that a measure of reflectance would differentiate stress effects. The objectives of the study were: (1) to compare the performance of SG to BG and ZG exposed to water and compactive stresses to assess the former’s potential as an alternate turfgrass species; and (2) to compare temporal changes in reflectance and VQ ratings during stress.
2. Materials and Methods
The study was established as a pot trial at the Soil Science Greenhouse of the University of the West Indies, St. Augustine Campus, Trinidad and Tobago, in 2010. Four soils of contrasting properties (Table 1) were used in the trial. The particle size distribution was determined by the hydrometer method [17] and organic matter content by the Walkley-Black method described by Nelson and Sommers [18]. Soil pH was measured using a digital pH meter at a soil:water ratio of 1:2.5 [19]. Soils were prepared by air drying, crushing and sieving (0.6-cm mesh). BG (Cynodon dactylon (L.) Pers.) (cv. La Prima), established by seed, and SG (Axonopus compressus) and ZG (Zoysia tenuifolia), established by plugs, were planted to pots (height: 15 cm; internal diameter: 18 cm) filled either with soil only or amended with a surface sand layer 1:2 v/v. The experiment consisted of the following preconditioning stress treatments: (i) LC, low compaction; (ii) HC, high compaction; (iii) D, drought; and (iv) WL, waterlogging. The experimental design was a fractional factorial consisting of 96 unreplicated treatments (4 soils × 4 stresses × 3 grasses × 2 sand treatments). This design was selected based on the number of factors and the factor levels and the assumption that most of the important and practical effects would be the main effects and simple interactions [20]. Although higher order interaction may not be trivial, their explanation and usefulness was of less importance than screening the effects of the four factors. Pots were arranged in a completely randomized fashion.

Table 1.
Selected properties of study soils.
| Series | USDA Soil Taxonomy | Organic Matter | Clay | Sand | Silt | pH | Dry Bulk Density † |
|---|---|---|---|---|---|---|---|
 % %  | mg/m3 | ||||||
| Talparo | Aquentic Chromuderts | 1.8 | 67.0 | 5.0 | 28.0 | 4.2 | 1.09 (1.25) |
| Princes Town | Aquentic Chromuderts | 2.7 | 68.3 | 5.0 | 26.7 | 6.8 | 1.06 (1.21) |
| River Estate | Fluventic Eutropepts | 1.5 | 17.6 | 16.9 | 65.5 | 5.7 | 1.16 (1.31) |
| Piarco | Aquoxic Tropudults | 1.2 | 8.0 | 51.0 | 41.0 | 3.8 | 1.28 (1.38) |
† Values in parentheses are for treatments with the sand layer.
Plants were grown for six weeks, allowing canopy establishment and coverage of the entire surface of the pot. Compaction was done using a proctor hammer (4.5 kg) to administer blows to a steel plate cut to fit the internal diameter of the container (0.5 cm-thick). Compaction efforts of 90 kJ/m3 (LC) and 270 kJ/m3 (HC) were administered to simulate light and heavy traffic. These values represent one quarter and one half of the compactive effort of the standard Procter test [21] and simulate vertical stress due to player traffic [22]. Waterlogged conditions were imposed by maintaining a 6.4-mm depth of ponded water in the pots throughout the trial. Drought stress consisted of exposing the grasses to four dry down periods of 1, 2, 3 and 4 weeks in duration. Alternating with successive incremental dry down periods, turfgrasses were allowed to recover for 1, 2 and 3 weeks, during which water was administered to near water holding capacity, every other day, to prevent moisture stress. Exposure to drought occurred on Weeks 1, 3 and 4, 7–10 and 13–16 with recovery intervals at Weeks 2, 5 and 6 and 10–12.
All pots were fertigated fortnightly at 45 kg N/ha using a compound fertilizer (13-13-21, Fersan, Santo Domingo, Dominican Republic). Water was applied to the LC and HC treatments to maintain root zone moisture content close to the water holding capacity by irrigation every other day. The grasses were clipped weekly to a height of 2.5 cm using a pair of stainless steel scissors. Clippings were oven dried at 70 °C for 48 h to determine dry mass. Turfgrass quality was visually rated on a weekly basis using a scale from 1 to 9, with 1 being poor, 6 minimally acceptable and 9 excellent. A Field Scout chlorophyll meter (CM 1000, Spectrum Technologies, Inc. Plainfield, IL, USA) was used to take weekly reflectance readings.
2.1. Statistical Analysis
GenStat Discovery Edition 4 statistical software (VSN International Ltd., Hemel Hempstead, UK) was used to perform a repeated measure analysis of variance (ANOVA) to determine significant factors and factor combinations. The variance for the third and fourth order interaction effects were incorporated into the error term and used to test lower order interactions and main effects for each variable [20]. Means for significant factors and their interactions were separated by Fisher’s protected least significant difference (LSD) at α = 0.05. Pearson’s correlation analysis was used to determine linear interdependencies between performance and quality variables.
3. Results and Discussion
Data analysis determined the importance of grass, soil, stress, sand layering and time and their interactions (Table 2) on clipping yield (CY), CI and VQ. For all three variables, most of the factors and their combinations showed some level of significance. Grass, stress and time were dominant, as evidenced by the greater variance ratios and consequentially higher level of significance. Greater attention was directed at these factors throughout the results and discussion. Correlations among the variables measured were highly significant. The highest r2 value was between the CI and VQ rating (0.745), indicating great similarity between an apparently subjective indicator and an objective measurement. However, both indices provide a measure of quality dependent on chlorophyll. Since both measurements are instantaneous, the CI can be seen as an objective substitute for the older VQ rating system. Hoffman et al. [23] used reflectance as a quantitative measurement of injury as an alternative to qualitative (visual) ratings. The number of significant factors and combinations, as well as the level of significance was greater for VQ, indicative of greater variation for this subjective measurement.
Table 2.
Variance ratios for turfgrass performance variables affected by treatments and their interactions.
| Source of Variation | Clipping Yield | Chlorophyll Index | Visual Quality |
|---|---|---|---|
| Soil | 25.83 *** | 1.76 | 7.73 ** |
| Grass | 88.06 *** | 323.26 *** | 476.54 *** |
| Sand | 14.31 ** | 1.71 | 32.11 *** |
| Stress | 275.54 *** | 259.58 *** | 1,753.22 *** |
| Soil × Grass | 2.87 * | 0.69 | 4.46 ** |
| Soil × Sand | 10.80 *** | 1.76 | 5.45 ** |
| Grass × Sand | 1.76 | 2.26 | 58.81 *** |
| Soil × Stress | 2.96 * | 4.05 ** | 15.29 *** |
| Grass × Stress | 7.03 *** | 17.20 *** | 151.30 *** |
| Sand × Stress | 1.29 | 6.96 ** | 2.83 |
| Soil × Grass × Sand | 2.24 | 1.11 | 3.54 * |
| Soil × Grass × Stress | 2.06 | 2.32 * | 2.44 * |
| Soil × Sand × Stress | 0.77 | 1.81 | 2.24 * |
| Grass × Sand × Stress | 1.17 | 5.62 ** | 5.91 ** |
| Time | 51.63 *** | 229.50 *** | 615.34 *** |
| Time × Soil | 3.09 *** | 1.30 | 2.76 ** |
| Time × Grass | 20.14 *** | 68.24 *** | 48.46 *** |
| Time × Sand | 2.24 * | 1.94 | 3.37 ** |
| Time × Stress | 26.29 *** | 15.86 *** | 37.55 *** |
| Time × Soil × Grass | 2.35 *** | 0.98 | 2.39 *** |
| Time × Soil × Sand | 1.32 | 0.73 | 0.61 |
| Time × Soil × Stress | 1.35 | 1.14 | 1.38 |
| Time × Grass × Sand | 2.14 * | 1.64 | 4.51 *** |
| Time × Grass × Stress | 6.03 *** | 5.39 *** | 5.74 *** |
| Time × Sand × Stress | 0.99 | 2.83 ** | 2.02 * |
Values followed by *, ** and *** represent significance at p < 0.05, 0.01 and 0.001, respectively.
3.1. Clipping Yield
Inclusion of a sand layer increased CY for all soils except Piarco; however, the increase was significant (p < 0.001) only for the two clay soils (Princes Town and Talparo) (Table 3). The opposite effect was observed for Piarco, where CY was significantly lower. Engelsford and Singh [24] reported the positive effects of sand-based root zones on turf vegetative growth. In most instances, sand layers are superimposed on gravel beds [25] facilitating drainage; however, in this study, the sand layer was placed directly above the soil. Topdressing with sand is a common local practice on soil-established turf fields and has been reported by Baker and Canaway [26] to produce better turfgrass playing quality for perennial ryegrass relative to the soil-only control. Increased vegetative growth was stimulated by a better rooting environment provided by the sand layer. The effect was absent for Piarco, as this soil is coarse textured (Table 1). The significant decrease in CY may be attributed to lower water and nutrient availability associated with increased macroporosity. The relative difference in yield for the clay soils with the sand layer was also important, as these values were similar when compared to Piarco. Sand layering was capable of improving rootzone properties, resulting in greater shoot growth.
Table 3.
Sand layering influence on turfgrass clipping yield (CY) across four soils.
| Soil | Sand | ||
|---|---|---|---|
| mg/pot | |||
| Piarco | 1,225.3 a ‡ | 1,089.2 b | 1,157.2 a |
| Princes Town | 822.2 d | 1,001.7 bc | 911.9 b |
| River Estate | 863.6 cd | 959.3 c | 911.4 b |
| Talparo | 765.1 d | 1,006.2 bc | 885.7 b |
| Sand means § | 919 b | 1,014. a | |
† Main effect of soil type on CY; ‡ values followed by similar letters within the interaction are not significantly different at p = 0.05; § main effect of sand treatment on CY.
Turfgrasses varied significantly (p < 0.05) in their yield responses to stress conditions. All grasses performed better under waterlogged conditions compared to drought, with SG showing similar yields under the former stress, as it did for the compactive stresses (Table 4). The superior response of SG under WL is related to physiological and morphological adaptations [27]. This grass produced a comparatively high number of stolons, which increased clipping yield. The redox potentials (Eh) were −64, −25 and 13 mV for ZG, BG and SG, respectively, indicating that SG was capable of maintaining better aeration in the rootzone, probably via aerenchyma. The data implies that SG has tremendous potential for use in high rainfall areas, especially when established on soils with poor internal drainage. Fry [28] reported higher shoot survival after submergence for BG compared to ZG. In our study, CY did not differ between these grasses, under WL conditions.
Table 4.
Turfgrass CY affected by applied stress.
| Grass | Stress | ||||
|---|---|---|---|---|---|
| mg/pot | |||||
| Bermuda | 483.7f ‡ | 876.4 e | 1,205.2 c | 1,300.0 bc | 966.3 b |
| Savannah | 467 f | 1,374.7 ab | 1,349.3 b | 1,492.7 a | 1,170.9 a |
| Zoysia | 116.9 g | 904.3 de | 1,005.5 de | 1,023.2 d | 762.5 c |
| Stress means § | 355.8 d | 1,051.8 c | 1,186.6 b | 1,272 a | |
† Main effect of grass type on CY; ‡ values followed by similar letters within the interaction are not significantly different at p = 0.05; § main effect of applied stress on CY.
Contrastingly, CY for all turfgrasses was lowest for D stress, with the effect being particularly pronounced for ZG (Table 4). D stress is known to affect turfgrass physiological and biochemical processes [29], and ZG has been reported to exhibit low D tolerance/resistance [7], which is partially associated with its slow growth rate [30]. Soil compaction has been reported to affect shoot growth [14]. This was evident from the lower CY across grasses for the HC compared to LC treatments (Table 4). Comparatively, the compaction treatments did not affect turfgrass shoot growth as much as the water-related stresses. SG showed the greatest CY under the compactive treatments. It was evident that the compaction treatment did not affect the rootzone bulk condition, as the bulk density across treatments was below 1.6 g/cm3.
The D treatment comprising periodic D and recovery phases showed the greatest variability in CY across grasses and stresses for the 16-week trial period (Figure 1). BG showed the best tolerance to D, recording clippings up to week seven, spanning two drought periods. The other grasses succumbed to the initial one-week drought period and, by week three, showed no vegetative growth. Longer recovery periods were associated with greater CY, the magnitude of recovery being greater for BG and SG.
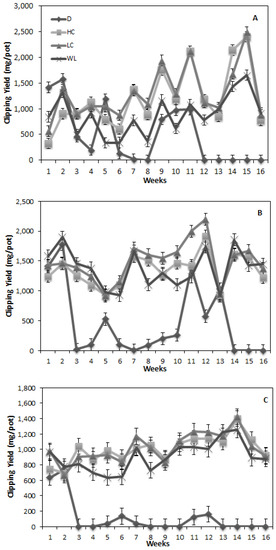
Figure 1.
The effects of the applied stresses, drought (D), high compaction (HC), low compaction (LC) and waterlogging (WL), on clipping yield (CY) for Bermudagrass (A), Savannahgrass (B) and Zoysiagrass (C) over a 16-week growth period. Recovery from drought occurred at weeks 2, 5 and 6 and 10–12.
Figure 1.
The effects of the applied stresses, drought (D), high compaction (HC), low compaction (LC) and waterlogging (WL), on clipping yield (CY) for Bermudagrass (A), Savannahgrass (B) and Zoysiagrass (C) over a 16-week growth period. Recovery from drought occurred at weeks 2, 5 and 6 and 10–12.
ZG showed little tolerance to the D treatment, with CY remaining below 200 mg/pot after the second week. Huang et al. [7] in evaluating D resistance ranked BG and ZG similarly, which conflicts with the findings in this study, noting that the cultivars differed between the two studies. Qian and Fry [31] also noted that Meyer ZG possessed a high level of osmotic adjustment that may aid its recovery after drought, although its susceptibility to drought is high, due to a relatively shallow root system. This study showed that BG and SG had superior recovery from D compared to ZG, which may be related to the nature of the drought regime used in this study, where grasses were exposed to prolonged periods of water deficit. All other treatments showed fluctuating trends, probably associated with fertilization and watering. Notably, SG showed higher, though statistically similar, CY under WL conditions for the first five weeks compared to other grass × stress treatments. This effect was explained previously.
3.2. Chlorophyll Index
Comparatively, SG showed a significantly (p < 0.001) higher CI among stress treatments, except under D (Table 5). Across turfgrasses, D conditions resulted in significantly lower CI compared to the other stress treatments. Dry conditions affect physiological and biochemical processes in turfgrasses [6], including nutrient uptake, partitioning and assimilation [32]. In reviewing drought stress on plant nutrition, Silva et al. [33] indicated that nutrient transport from the roots to the shoots is limited by a drought-induced decrease in the transpiration rate, as well as an imbalance in active transport and membrane permeability. This would affect plant physiological and metabolic processes, including chlorophyll formation. CI within grass type was also significantly (p < 0.01) lower under WL compared to the compaction stresses. Malik et al. [34] in their study reported that WL decreased chlorophyll in wheat. Higher reflectance for SG (250.04) may be linked to the greater CY (Table 5) and ability to tolerate applied stresses.
Table 5.
Turfgrass chlorophyll index (CI) affected by applied stress.
| Grass | Stress | ||||
|---|---|---|---|---|---|
| Reading | |||||
| Bermuda | 139.46 f ‡ | 176.18 e | 195.75 c | 194.86 cd | 176.56 b |
| Savannah | 153.33 f | 261.66 b | 286.87 a | 298.28 a | 250.04 a |
| Zoysia | 105.91 g | 180.37 de | 198.74 c | 199.79 c | 171.21 b |
| Stress means § | 132.90 c | 206.07 b | 227.12 a | 230.98 a | |
† Main effect of grass type on CI; ‡ values followed by similar letters within the interaction are not significantly different at p = 0.05; § main effect of applied stress on CI.
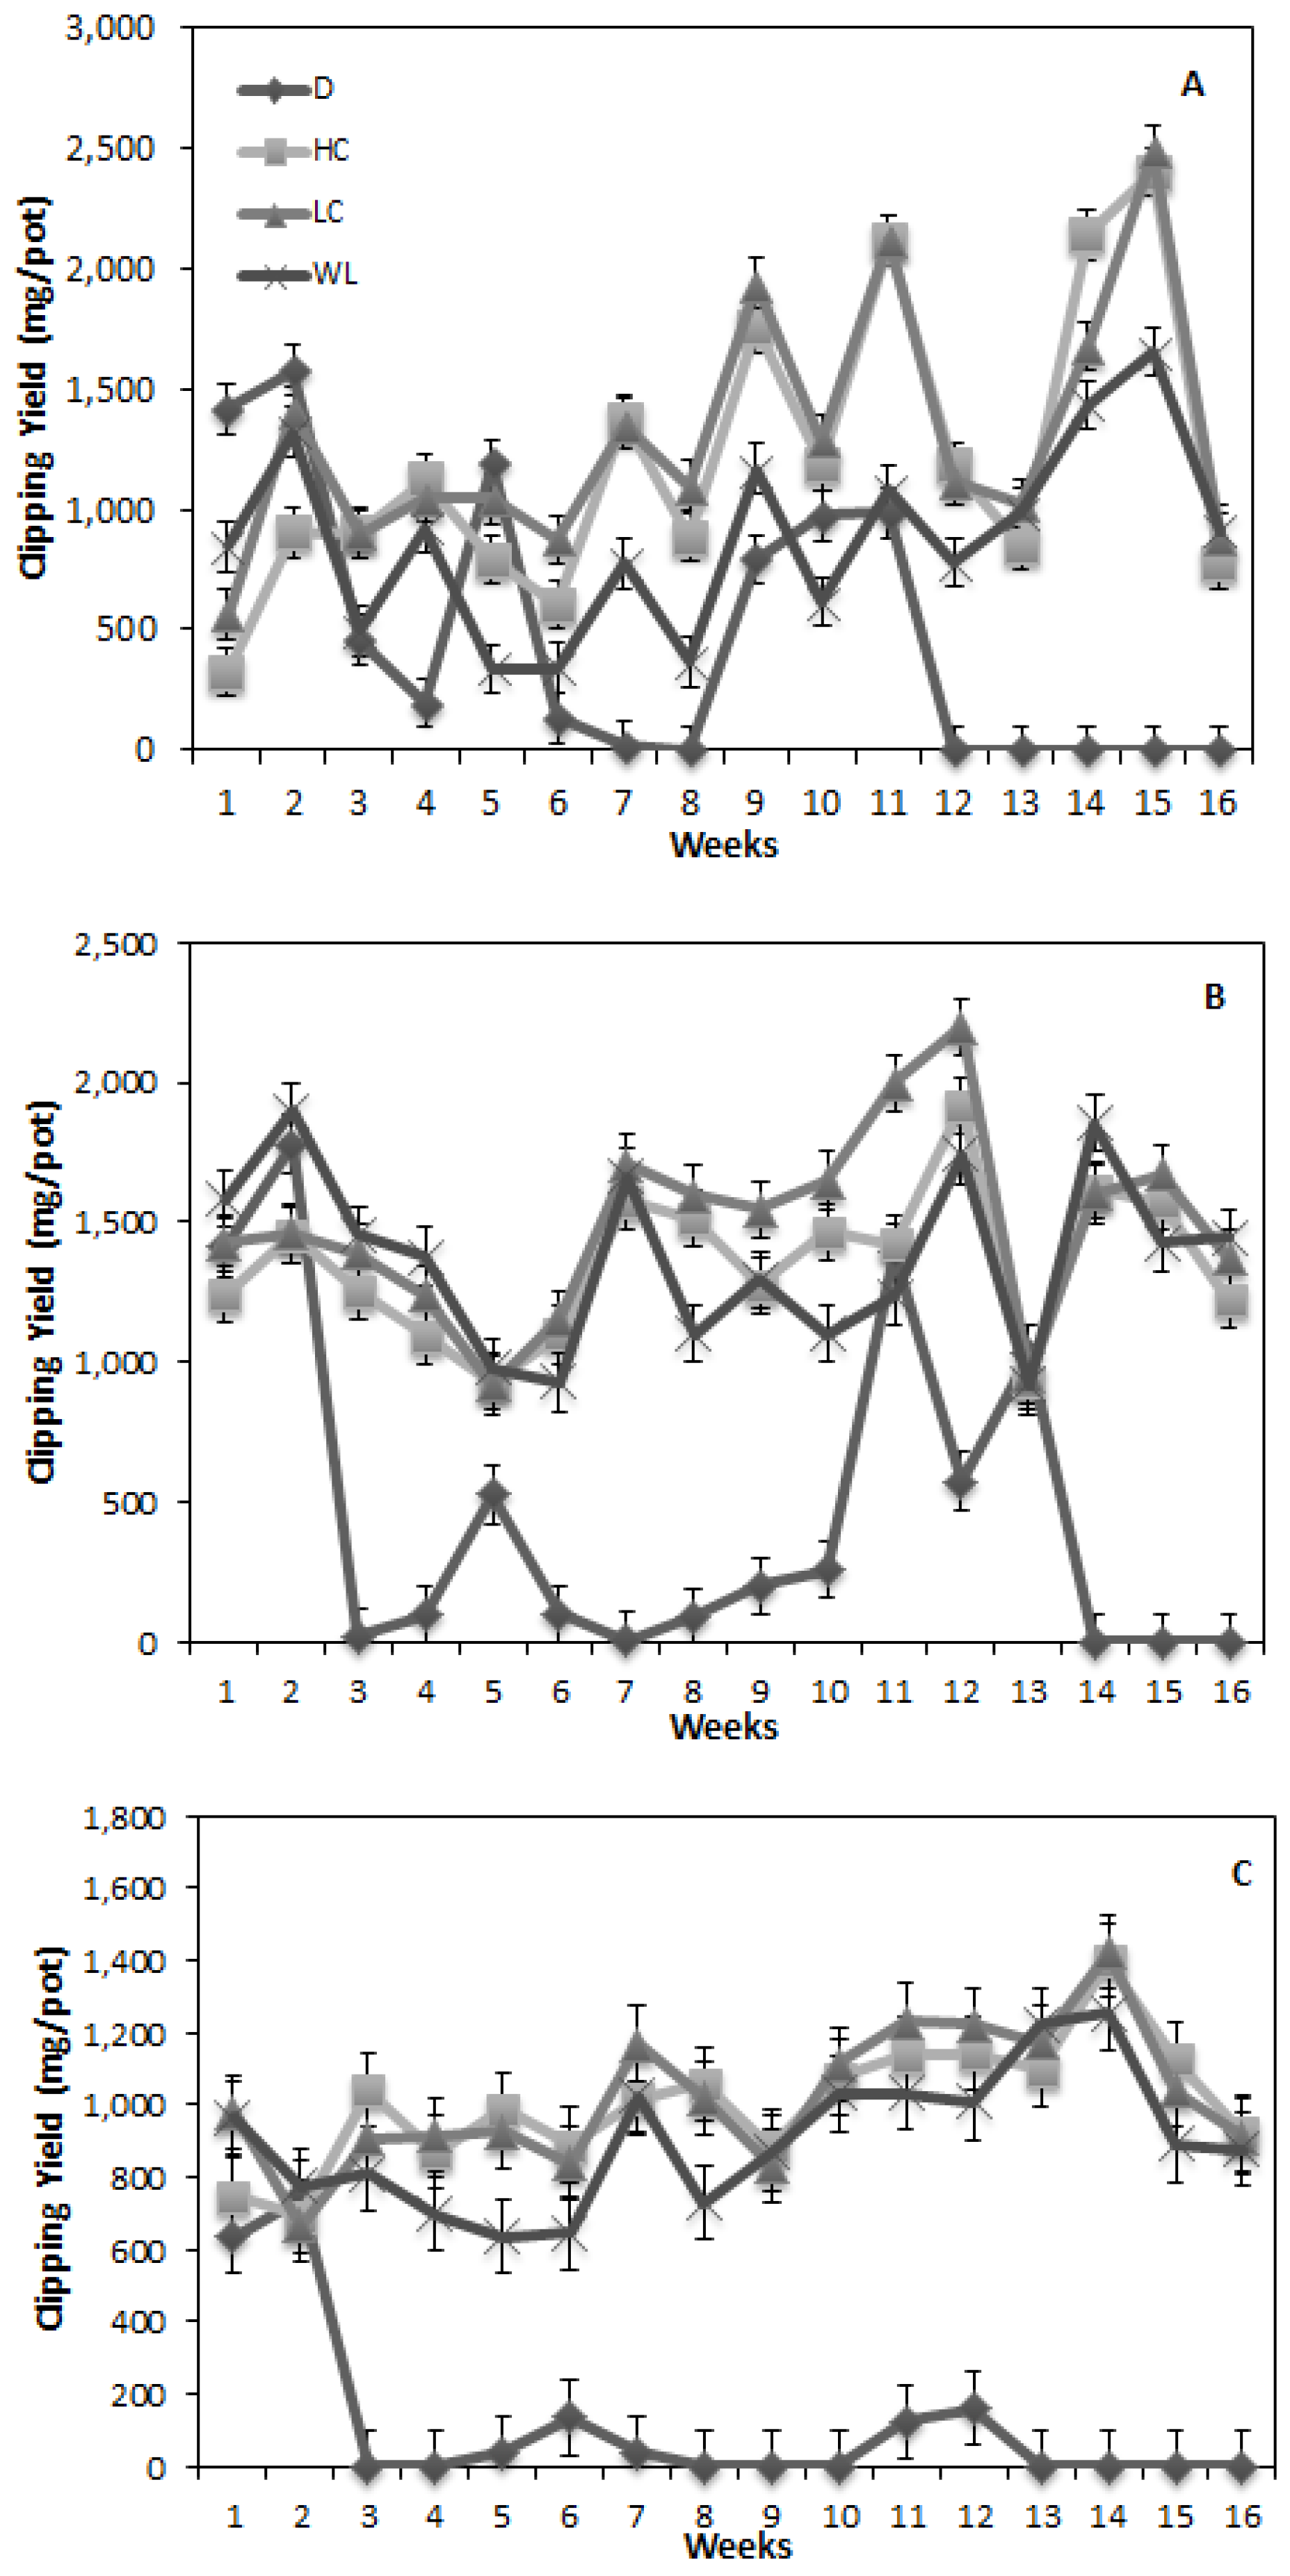
The single compaction event resulted in minimal effects on vegetative quality. The nominal effects were reflected in the small variation in CI over time for the compactive treatments across all grasses (Figure 2). Springer et al. [35] reported minimal changes in rootzone bulk density after compaction for these treatments. Bulk density remained within the optimal range. A steady decline in CI was observed for the compactive treatments together with WL for all grasses, except ZG. There was a sharp decline under these treatments after the eighth week attributed to pest and disease incidences, which explains why the decrease was observed across all grass × stress treatments. The decline was not as pronounced in ZG. The fluctuating trend under D is reflective of the D regime with higher CI values during recovery weeks. CI for BG was least affected by the D treatment. Comparatively, this treatment only showed significant differences after the fifth week. After three weeks of drought, BG was able to recover with CI values not significantly different from the other stress treatments for the following two weeks. That was not observed for the other two grasses. Beard [36] ranked warm season turfgrasses for D resistance according to the following series: BG > ZG > SG. Our data showed that SG also had greater tolerance than ZG, with less variation in CI between D and recovery periods.
Figure 2.
The effects of the applied stresses, drought (D), high compaction (HC), low compaction (LC) and waterlogging (WL), on the chlorophyll index (CI) for Bermudagrass (A), Savannahgrass (B) and Zoysiagrass (C) over a 16-week growth period. Recovery from drought occurred at weeks 2, 5 and 6 and 10–12.
3.3. Visual Quality
VQ was significantly lower for BG compared to the other grasses irrespective of sand treatment (Figure 3). However, the inclusion of a sand layer resulted in a significantly lower VQ rating for BG. Contrastingly, the sand layer improved the VQ for ZG and had a non-significant influence on SG. Both SG and ZG had greater root densities [35] than BG under sand treatment, which may have influenced nutrient uptake. A greater volume of roots may have penetrated the underlying soil layer for theses grasses. This result is interesting in that the common practice is to use BG on a sand layer, which has generally resulted in poor root growth and VQ under tropical conditions and present management. It would seem that consideration for the use of other species is warranted or at least the revision of the management protocol for BG.
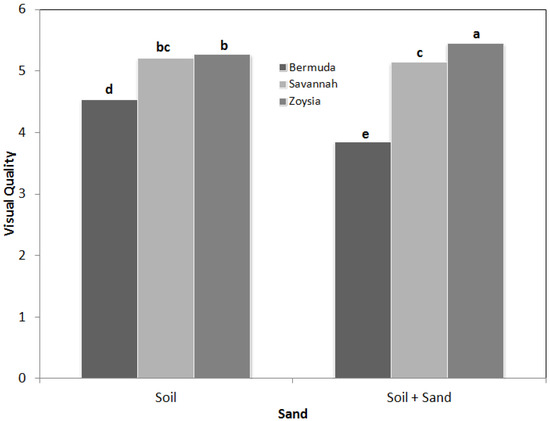
Figure 3.
Sand layering effect on visual quality (VQ) for three grasses. Columns with similar lower case letters are not significantly different.
Figure 3.
Sand layering effect on visual quality (VQ) for three grasses. Columns with similar lower case letters are not significantly different.
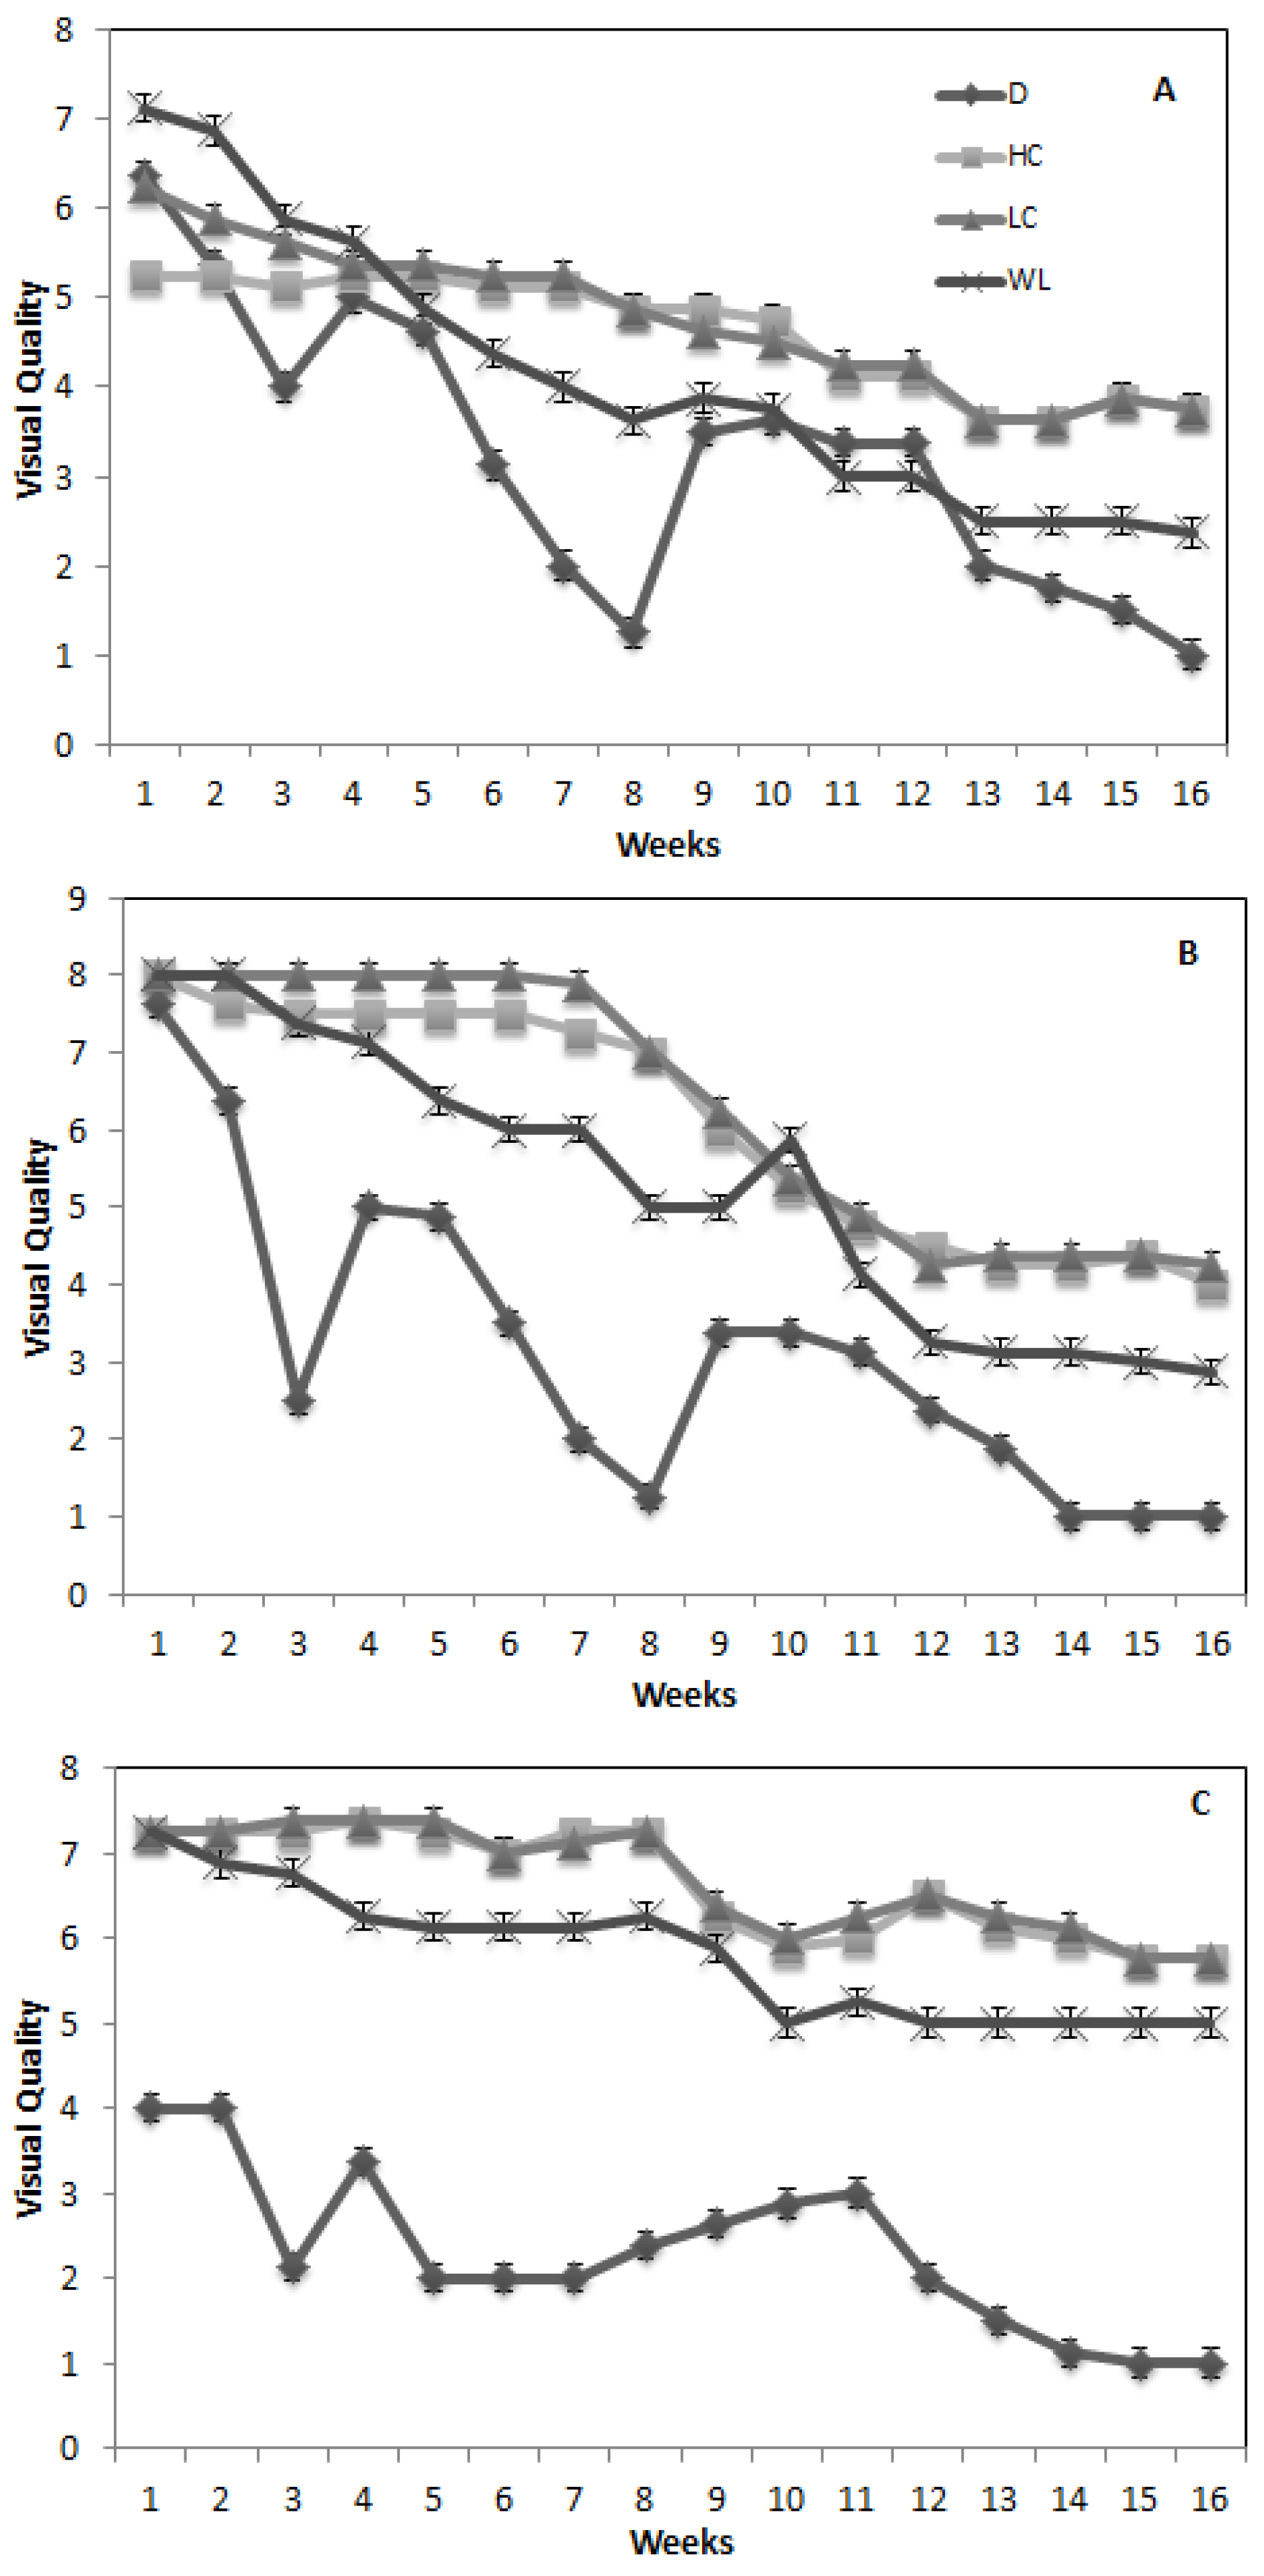
Visual quality responded similarly to CI for the interaction between grass type and stress (Table 6). ZG under D showed the lowest VQ, significantly different from the other grasses. The low VQ is associated with low chlorophyll content reflective of the grass × stress treatment with the lowest CI. The inhibition of photosynthetic activities is one of the major detrimental effects of drought [37,38]. Greater variation between grasses was present across the other stresses, with the best quality shown by ZG. This contrasted the CI results, where ZG showed significantly (p < 0.05) lower values than SG. This may demonstrate the limitations of both quality measurements with a better assessment possible by combination. Additionally, other qualities are intrinsically included during visual quality assessment, such as density, texture, uniformity, color and growth habit [39]. There was a clear effect of grass type on the method of quality measurement. Both indices showed similar comparative values for BG, but differed in their response to SG and ZG. It is notable that only SG and ZG under LC and HC produced acceptable VQ ratings > 6. The significantly higher VQ rating for ZG under these stresses may be attributed to the stiffness of its leaves, due to the high silica content [7], which could reduce the effect of compaction. Results reported by Springer et al. [35] showed significantly lower rootzone bulk densities for ZG under compactive treatments compared to SG and BG. Waterlogging produced varied responses among the grasses, but all ratings were lower than acceptable. Liao and Lin [40] noted that waterlogging has been shown to significantly inhibit photosynthetic capacity in intolerant plants.
Table 6.
Turfgrass VQ affected by applied stress.
| Grass | Stress | ||||
|---|---|---|---|---|---|
| Reading | |||||
| Bermuda | 139.46 f ‡ | 176.18 e | 195.75 c | 194.86 cd | 4.188 c |
| Savannah | 153.33 f | 261.66 b | 286.87 a | 298.28 a | 5.174 b |
| Zoysia | 105.91 g | 180.37 de | 198.74 c | 199.79 c | 5.359 a |
| Stress means § | 2.898 d | 5.029 c | 5.779 b | 5.922 a | |
† Main effect of grass type on VQ; ‡ values followed by similar letters within the interaction are not significantly different at p = 0.05; § main effect of applied stress on VQ.
Visual quality decreased gradually for all grasses across all stresses, except drought (Figure 4). The pattern mimics that of CY and CI in that the growth and performance of all grasses decreased with time under all stresses. Prolonged stress of any nature decreases turfgrass VQ. The lesser effect of the compactive stresses resides in the single application of these stresses at the start of the experiment. The fluctuating response for the drought treatment has been previously explained. The ability to recover from drought was related to the extent of drought stress; the longer the drought period, the longer the recovery period. Jiang and Haung [29] stated that, initially, drought reduced the relative water content, but prolonged drought was associated with chlorophyll loss and cell death. ZG retained minimal quality standards under the compactive stresses. Contrastingly, BG under these stresses showed low VQ from the start of the trial. This further supports the earlier inference that the stress tolerance or resistance differs between these grasses.
Figure 4.
The effects of the applied stresses, drought (D), high compaction (HC), low compaction (LC), and waterlogging (WL), on the visual quality (VQ) for Bermudagrass (A), Savannahgrass (B) and Zoysiagrass (C) over a 16-week growth period. Recovery from drought occurred at weeks 2, 5 and 6 and 10–12.
4. Conclusions
Turfgrasses differed in their responses to stresses over the trial period. CY for all turfgrasses was affected by the D and WL conditions. Increasing compaction effort resulted in decreased CY, but had little effect on CI and VQ. For the soils used, there was a minimal effect of sand addition, which only affected CY. For the applied stresses, D and WL had a greater negative influence on turfgrass performance. Over 16 weeks, all turfgrasses showed reductions in quality parameters, the responses being greatest under D. SG showed moderate tolerance to the stress conditions imposed, which warrants further investigation into its use as a turfgrass.
Acknowledgments
The authors would like to thank the School of Graduate Studies and Research in addition to the Department of Food Production, University of the West Indies, St. Augustine Campus, for monetary contributions towards the purchase of key instruments used during this research.
Author Contributions
Raymond Springer (primary author and graduate student) made the most substantial contributions to this manuscript which included, assisting in designing the experiment, conducting the research and preparing the draft manuscript. Gaius Eudoxie (main supervisor) assisted with experimental design, setting up the experiment, providing guidance in statistical analysis and edited the manuscript throughout the submission process. Gregory Gouveia (co-supervisor) assisted with the experimental design and data analysis, and provided guidance and suggestions in drafting and editing the manuscript.
Conflict of Interest
The authors declare no conflict of interest.
References
- Canaway, P.M.; Baker, S.W. Soil and turf properties governing play. Int. Turfgrass Soc. Res. J. 1993, 7, 192–200. [Google Scholar]
- Brosnan, J.T.; McNitt, A.S.; Serensits, T.J. Effects of varying surface characteristics on the hardness and traction of baseball field playing surfaces. Int. Turfgrass Soc. Res. J. 2009, 11, 1–13. [Google Scholar]
- Dest, W.M.; Ebdon, J.S.; Guillard, K. Differentiating between the influence of wear and soil compaction and their interaction of turfgrass stress. Int. Turfgrass Soc. Res. J. 2009, 11, 1067–1083. [Google Scholar]
- Jiang, Y.; Wang, K. Growth, physiological, and anatomical responses of creeping bentgrass cultivars to different depths of waterlogging. Crop Sci. 2006, 46, 2420–2426. [Google Scholar] [CrossRef]
- Cashman, A.; Nurse, L.; John, C. Climate change in the Caribbean: The water management implications. J. Environ. Dev. 2010, 19, 42–67. [Google Scholar] [CrossRef]
- Bray, E.A. Plant responses to water-deficit. Trends Plant Sci. 1997, 2, 48–54. [Google Scholar] [CrossRef]
- Huang, B.; Duncan, R.R.; Carrow, R.N. Drought-resistance mechanisms of seven warm-season turfgrasses under surface soil drying: I. Shoot response. Crop Sci. 1997, 37, 1858–1863. [Google Scholar] [CrossRef]
- Zhang, J.; Baker, S.W. Sand characteristics and their influence on the physical properties of rootzone mixes used for sports. J. Turfgrass Sci. 1999, 75, 66–73. [Google Scholar]
- Kowalewski, A.R.; Roger, J.N., III; Crum, J.R.; Dunne, J.C. Sand topdressing applications improve shear strength and turfgrass densit on trafficked athletic fields. Horttechnology 2010, 20, 867–872. [Google Scholar]
- Miller, G.L. An evaluation of crumb rubber and clacined clay for topdressing sports fields. Acta Hort. 2008, 783, 381–390. [Google Scholar]
- Waddington, D.V.; Gover, A.E.; Beegle, D.B. Nutrient concentrations of turfgrass and soil test levels as affected by soil media and fertilizer rate and placement. Commun. Soil Sci. Plant Anal. 1994, 25, 1957–1990. [Google Scholar] [CrossRef]
- Ahmad, N. Soils of the Caribbean; Ian Randle Publishers: Kingston, Jamaica, 2011. [Google Scholar]
- Richardson, D.M.; Karcher, E.D.; Highnight, K.; Rush, D. Drought tolerance and rooting capacity of Kentucky bluegrass cultivars. Crop Sci. 2008, 48, 2429–2436. [Google Scholar] [CrossRef]
- Sills, M.J.; Carrow, R.N. Soil compaction effects on nitrogen use in tall fescue. J. Am. Soc. Hortic. Sci. 1983, 107, 934–946. [Google Scholar]
- Samaranayake, H.; Lawson, T.J.; Murphy, J.A. Traffic stress effects on bentgrass putting greens and fairway turf. Crop Sci. 2008, 48, 1193–1202. [Google Scholar] [CrossRef]
- Bell, G.E.; Martin, D.L.; Wiese, S.G.; Dobson, D.D.; Smith, M.W.; Stone, M.L.; Solie, J.B. Vehicle-mounted optical sensing: An objective means for evaluating turf quality. Crop Sci. 2002, 42, 197–201. [Google Scholar] [CrossRef]
- Gee, G.W.; Or, D. Particle-size analysis. In Methods of Soil Analysis Part (4) Physical Methods; Dane, J.H., Topp, G.C., Eds.; SSSA: Madison, WI, USA, 2002; pp. 255–294. [Google Scholar]
- Nelson, D.W.; Sommers, L.E. Total carbon, organic carbon, and organic matter. In Methods of Soil Analysis Part (3) Chemical Methods; Sparks, D.L., Ed.; SSSA: Madison, WI, USA, 1996; pp. 961–1010. [Google Scholar]
- Thomas, G.W. Soil pH and soil acidity. In Methods of soil analysis Part (3) Chemical Methods; Sparks, D.L., Ed.; SSSA: Madison, WI, USA, 1996; pp. 475–490. [Google Scholar]
- Quinn, G.P.; Keough, M.J. Experimental Design and Data Analysis for Biologists; Cambridge University Press: Cambridge, UK, 2002. [Google Scholar]
- Diaz-Zorita, M.; Grove, J.H.; Perfect, E. Laboratory compaction of soils using a small mold procedure. Soil Sci. Soc. Am. J. 2001, 65, 1593–1598. [Google Scholar] [CrossRef]
- Li, D.; Hunt, W.F. Soccer-wear simulation on sport turf mixtures. Trans. CSAE 1997, 13, 164–168. [Google Scholar]
- Hoffman, L.; Ebdon, J.S.; Dest, W.M.; DaCosta, M. Effects of nitrogen and potassium on wear mechanisms in perennial Ryegrass: I. Wear tolerance and recovery. Crop Sci. 2010, 50, 357–366. [Google Scholar] [CrossRef]
- Englesjord, M.; Singh, B.R. Effects of slow-release fertilizers on growth and on uptake and leaching of nutrients in Kentucty bluegrass turfs established on sand-based root zones. Can. J. Plant Sci. 1997, 77, 433–444. [Google Scholar] [CrossRef]
- Li, D.; Joo, Y.K.; Chirstians, N.E.; Minner, D.D. Inorganic soil amendment effects on sand-based sports turf media. Crop Sci. 2000, 40, 1121–1125. [Google Scholar] [CrossRef]
- Baker, S.W.; Canaway, P.M. The effects of sand topdressing on the performance of winter games pitches of different construction types. II. Playing quality. J. Sports Turf Inst. 1992, 68, 62–72. [Google Scholar]
- Bush, E.W.; Shepard, D.P.; Wilson, P.W.; McCrimmon, J.N. Carpetgrass and centipedegrass tissue iron and manganese accumulation in response to soil waterlogging. J. Plant Nutri. 1999, 22, 435–444. [Google Scholar] [CrossRef]
- Fry, J.D. Submersion tolerance of warm-season turfgrasses. HortScience 1991, 26, 927. [Google Scholar]
- Jiang, Y.; Huang, B. Osmotic adjustment and root growth associated with drought preconditioning-enhanced heat tolerance in Kentucky bluegrass. Crop Sci. 2001, 41, 1168–1173. [Google Scholar] [CrossRef]
- Christians, N. Fundamentals of Turfgrass Management; John Wiley: Hoboken, NJ, USA, 2004. [Google Scholar]
- Qian, Y.; Fry, J.D. Water relations and drought tolerance of four turfgrasses. J. Am. Soc. Hort. Sci. 1997, 122, 129–133. [Google Scholar]
- Nahar, K.; Gretzmacher, R. Effect of water stress on nutrient uptake, yield and quality of tomato (Lycopersicon esculentum Mill.) under subtropical conditions. Die Bodenkultur 2002, 53, 45–51. [Google Scholar]
- Silva, E.C.; Nogueira, R.J.M.C.; Silva, M.A.; Bandeira, M. Drought stress and plant nutrition. Plant Stress 2011, 5, 32–41. [Google Scholar]
- Malik, A.I.; Colmer, T.D.; Lambers, H.; Schortemeyer, M. Changes in physiological and morphological traits of roots and shoots of wheat in response to different depths of waterlogging. Aust. J. Plant Physiol. 2001, 28, 1121–1131. [Google Scholar]
- Springer, R.; Eudoxie, G.; Gouveia, G. Comparative evaluation of common Savannahgrass on a range of soils subjected to different stresses II: Rootzone physical condition. Agronomy 2014, 4, 124–143. [Google Scholar] [CrossRef]
- Beard, J.B. Turfgrass water stress: Drought resistance components, physiological mechanisms and species-genotype diversity. Proc. Int. Turfgrass Res. Conf. Japan 1989, 6, 23–28. [Google Scholar]
- Lawlor, D.W.; Cornic, G. Photosynthetic carbon assimilation and associated metabolism in relation to water deficits in higher plants. Plant Cell Environ. 2002, 25, 275–294. [Google Scholar] [CrossRef]
- Flexas, J.; Medrano, H. Drought-inhibition of photosynthesis in C3 plants: Stomatal and non-stomatal limitations revised. Ann. Bot. 2002, 89, 183–189. [Google Scholar] [CrossRef]
- Beard, J.B.; Beard, H.J. Beard’s Turfgrass Encyclopedia for Golf Courses, Grounds, Lawns, and Sports Fields; Michigan State University Press: East Lansing, MI, USA, 2005. [Google Scholar]
- Liao, C.; Lin, C. Physiological adaptation of crop plants to flooding stress. Proc. Natl. Sci. Counc. Repub. China 2001, 25, 148–157. [Google Scholar]
© 2014 by the authors; licensee MDPI, Basel, Switzerland. This article is an open access article distributed under the terms and conditions of the Creative Commons Attribution license (http://creativecommons.org/licenses/by/3.0/).