Article

The Complete Mitochondrial Genome of Stromateus stellatus (Scombriformes: Stromateidae): Organization, Gene Arrangement, and Phylogenetic Position Within the Suborder Stromateoidei

by
Fernanda E. Angulo
,
Rodrigo Pedrero-Pacheco
and
José J. Nuñez
*
Instituto de Ciencias Marinas y Limnológicas, Facultad de Ciencias, Universidad Austral de Chile, Valdivia 5090000, Chile
*
Author to whom correspondence should be addressed.
Genes 2025, 16(11), 1256; https://doi.org/10.3390/genes16111256 (registering DOI)
Submission received: 11 September 2025 / Revised: 15 October 2025 / Accepted: 23 October 2025 / Published: 24 October 2025
(This article belongs to the Special Issue Genetic Status and Perspectives of Fisheries Resources)

Abstract

Background/Objectives: The butterfish Stromateus stellatus is undervalued and usually discarded as bycatch, leading to an inefficient and unsustainable use of marine biomass. Overall, although Stromateus is the type genus of the family Stromateidae, its species are less studied than more economically important fishes. Methods: In this study, we determined and analyzed the complete mitochondrial genome sequence of S. stellatus. Furthermore, we performed maximum likelihood and Bayesian inference analyses to infer the phylogenetic relationships among 21 species of the order Scombriformes. Results: Using next-generation sequencing (NGS) and de novo assembly, a circular mitochondrial genome of 16,509 bp was obtained, exhibiting the typical vertebrate mitochondrial structure comprising 13 protein-coding genes, two ribosomal RNA genes, and 22 transfer RNA genes. Three intergenic regions were identified, including the control region and the origin of light-strand replication, along with several gene overlaps. The heavy strand nucleotide composition was determined to be 28.79% A, 27.84% C, 16.32% G, and 27.05% T, with a GC content of 44.16%. The three Peprilus and five Pampus species formed a clade together with S. stellatus, supported by high bootstrap and posterior probability values, confirming the monophyly of Stromateidae. Conclusions: The gene order and content are consistent with those reported for other Stromateidae species and correspond to the typical arrangement observed in most bony fishes. This mitochondrial genome represents the first one reported for the genus Stromateus, providing valuable insights into the genetic makeup of S. stellatus, contributing to a better understanding of marine biodiversity. Additionally, these data will support future research on pelagic fish evolution and assist in sustainable fisheries management.

1. Introduction

The family Stromateidae Rafinesque 1810 (order Scombriformes), or butterfish, contains 18 fish species divided into three genera: Pampus, Peprilus, and Stromateus [1]. Butterfishes live in coastal waters off North America, South America, West Africa, and the Indo-Pacific region [2], characterized by their small mouth, a forked tail, and a single dorsal fin. Like the related rudderfishes (Centrolophidae) and man-of-war fishes (Nomeidae), stromateids also have peculiar, toothed outpocketings in the esophagus [3].
The genus Stromateus comprises three valid species: S. brasiliensis (Southwest Atlantic butterfish), S. fiatola (blue butterfish), and S. stellatus (starry butterfish). Other names historically proposed, such as S. albus, S. simillimus, S. capensis, and S. microchirus, are now considered synonyms or have been reassigned to different genera, such as Pampus, Peprilus, or Parastromateus (a Carangiformes genus). Molecular studies identify Stromateus as a sister genus to Pampus, with both groups likely originating from the ancient Tethys Seaway [4].
S. stellatus Cuvier, 1829, is the only stromateid species in the Southeastern Pacific found off the coasts of Perú and Chile [5]. This species forms coastal shoals, often constituting part of the concurrent fauna in the catches of resources such as Peruvian anchoveta (Engraulis ringens) and Araucanian herring (Strangomera bentincki). Its body is tall, laterally compressed, and grayish, with dark spots above the lateral line, and its head presents a rounded profile. Larval development is well-documented; its size ranges from about 2.7 to 10 mm, and flexion occurs between 5.6 and 7.7 mm, with elongated bodies in early stages. Noteworthy features include three main dorsal dendritic melanophores and specific patterns of ventral and internal pigmentation [6]. In juveniles, pelvic fins are found beneath the thorax, but these fins are absent in adults, which also lack a pelvic spine.
The species is considered inedible due to the presence of diacylglyceryl ether (DAGE) as a major lipid component in its muscle, which can cause intestinal bleeding or diarrhea upon ingestion [7,8]. As a result, S. stellatus is undervalued as bycatch and is usually discarded, leading to an inefficient and unsustainable use of marine biomass. Overall, although Stromateus is the type genus of the family Stromateidae, its species are less studied than more economically important fishes.
This disparity is primarily due to research and fisheries management efforts prioritizing species that hold high commercial value or are staple food resources in their native regions. For example, Pampus species (pomfrets) from the same family are intensely studied and managed due to their high demand in international markets and consistent roles in local fisheries [9,10]. In contrast, Stromateus species are less targeted and thus comparatively underrepresented in both the economic and ecological literature. Consequently, the biological, ecological, and taxonomic knowledge of Stromateus species lags behind that of its more commercially valuable relatives and other major fishery species, reflecting a global pattern in fisheries research allocation and reporting [11].
The vertebrate mitochondrial genome (mitogenome) is a circular molecule measuring approximately 15–20 kilobases in Animalia [12]. Its predominantly maternal inheritance has a conserved genomic structure, high copy number, lack of introns, and higher mutation rate compared to nuclear DNA [13,14,15]. Moreover, recent advances in DNA sequencing technologies have enabled the rapid and accurate acquisition of complete mitogenome sequences. Consequently, this genetic marker is widely used to resolve taxonomic relationships, reconstruct evolutionary histories, understand genetic diversity and changes in population size dynamics, as well as to identify cryptic species and stock variability [16,17,18]. In marine environments, mitogenomes can provide information on the population structure of commercially valuable species [19], as well as help to develop science-based strategies to manage fisheries more sustainably [20,21].
This study details the genome structure, codon usage, nucleotide composition, and gene order of the mitogenome of S. stellatus. To place these findings in context, these features were compared with those of other complete mitogenomes from the family and the suborder Stromateoidei to assess phylogenetic relationships among taxa. This also represents the first mitogenome reported for this genus. As a result, our molecular characterization can serve as a reference for species determination, providing genetic resources for taxonomic, systematic, and genetic research within Stromateidae.

2. Materials and Methods

2.1. Sample Collection and mtDNA Extraction

An S. stellatus specimen was obtained as part of a catch of the artisanal purse-seine fishery of E. ringens and S. bentincki on 13 May 2024, in the La Barra area, La Araucanía region (39°14′44′′ S; 73°16′53′′ W), Chile. The specimen was lifeless at the time of acquisition, so it was stored directly at 4 °C and subsequently transferred to the facilities of the Austral University of Chile. Liver tissue was homogenized with a Dounce homogenizer under cold conditions using an isotonic Manitol–Sucrose buffer to maintain organelle integrity, as described in Clayton and Shadel’s study [22]. This was followed by low-speed centrifugation to enrich for mitochondrial fractions while eliminating most nuclear DNA. mtDNA was directly isolated from this fraction under standard Phenol/Chloroform DNA extraction protocols and recovered by ethanol precipitation [23]. This enrichment procedure enables cost-effective and in-depth mtDNA sequencing, with sufficient sensitivity to facilitate precise assembly and annotation [24]. Additionally, DNA quality and concentration were determined by 1.5% agarose gel electrophoresis and by fluorometry using a Qubit 4.0 Fluorometer with the Qubit dsDNA HS Assay Kit (Invitrogen, Carlsbad, CA, USA).

2.2. Mitochondrial Genome Sequencing, Assembly, and Annotation

The mitogenome sequencing library was prepared following the MGIEasy FS DNA Library Prep Set protocol (MGI Tech, Shenzhen, Guangdong, China) using 200 ng of the isolated DNA. Sequencing of short fragments was performed on the DNBSeq platform (MGI Tech), producing paired-end reads of 150 nucleotides (PE150) on a DNBSeq G400 sequencer.
The quality of the initial sequencing reads was assessed using FastQC v0.12.1 [25]. After quality control, the reads underwent de novo assembly via NOVOPlasty v4.3.5 [26], with assembly parameters set as follows: “Genome Range = 15,000–20,000,” “K-mer = 33,” “Read Length = 151,” and “Insert size = 300.” The COI sequence of S. stellatus (GenBank accession number AB205450) served as the seed for assembly. To confirm the identity of the assembled sequences as mitochondrial genomes of ray-finned fishes, the resulting FASTA file was searched against the NCBI database using BLASTN+ 2.17.0 [27,28].
The assembled mitogenome sequence was annotated using the MITOS v2.1.7 tool [29] implemented on the Proksee server v1.1.3 (https://proksee.ca/; accessed on 25 March 2025) [30], employing the genetic code “2—Vertebrate Mitochondrial”. A circular mitogenome map was also generated using the Proksee server v1.1.3. The tRNAs’ secondary structures were predicted using the MITOS v2.1.7 tool and further visualized in the Forna web server (force-directed RNA) (http://rna.tbi.univie.ac.at/forna; accessed on 30 March 2025) [31]. The base composition and relative synonymous codon usage (RSCU) of the 13 protein-coding genes (PCGs) were estimated using MEGA 12 [32]. To calculate the nucleotide composition of skew of all 13 PCGs we used AT-skew = (A − T)/(A + T) and GC-skew = (G − C)/(G + C) [33] with the formulae implemented in Excel. The stem-loop secondary structure of the non-coding regions was folded using the UNAfold Server (https://www.unafold.org/mfold/applications/dna-folding-form.php, accessed on 30 March 2025) [34] under the RNA folding option with default parameters.
The S. stellatus genome sequence was deposited in the NCBI database under accession number PX223046.

2.3. Phylogenetic Analysis

To analyze the phylogenetic position of S. stellatus, we downloaded the complete mitogenome sequences of twenty-one scombriform species based on our GenBank BLAST+ 2.17.0 results and the phylogeny proposed by Near and Thacker [35]. The species and their GenBank accession number are shown in Table 1.
For each species, we extracted and concatenated the 13 PCGs into a single matrix. Alignment was performed using MAFFT version 7 [42] with the global pairwise iterative refinement method (G-INS-i). Tree topology was inferred using the maximum likelihood method in IQ-TREE [43,44] and Bayesian inference in MrBayes 3.2.7a [45]. The best-fit substitution models for partitioned data (13 partitions) were selected using ModelFinder 3.0 [46] based on the Bayesian information criterion (BIC). Node support values were assessed by Ultrafast Bootstrap Approximation support (UFBoot%) and posterior probabilities, and the resulting trees were visualized in FigTree v.1.4.5_pre (http://tree.bio.ed.ac.uk/software/figtree/, accessed on 30 March 2025). B. japonica (KT908039) and P. aesticola (AP012499), both belonging to the family Bramidae, were used as the outgroups. For pairwise genetic distance analyses, we used the same dataset as for the phylogenetic analyses.

3. Results

3.1. Features and Gene Content of the Mitochondrial Genome of S. stellatus

A total sequencing output of 10,431,628 paired-end raw reads was obtained, of which more than 85% showed, on average, a minimum sequencing quality score of Q30. The mitogenome assembly was built with all reads and had an average coverage depth of 95,781X, which was expected due to the method used, and the high amount of mtDNA obtained.
The complete mitogenome of S. stellatus is 16,509 bp in length (Figure 1), comprising the typical structure of 13 protein-coding genes (PCGs), two ribosomal RNA genes, 22 transfer RNA genes, and two non-coding regions (replication origins of the H and L-strands and the control region).
Among the 13 PCGs, only ND6 is encoded on the L strand, together with eight tRNA genes (Gln, Ala, Asn, Cys, Tyr, Ser2, Glu, and Pro). The remaining 12 PCGs, 14 tRNA genes, and both ribosomal RNA genes (12S and 16S) are encoded on the H strand (Figure 1; Table S1). The combined length of all PCGs is 11,431 bp, representing 68.86% of the mitogenome.
The heavy strand nucleotide composition is 28.79% for A, 27.84% for C, 16.32% for G, and 27.05% for T, with a GC content of 44.16% (Table S2). Within the 13 PCGs, the nucleotide proportions are 26.47% A (3026 bp), 28.45% C (3252 bp), 15.61% G (1784 bp), and 29.47% T (3369 bp). The overall GC content of the PCGs (44.06%) closely approximates that of the mitochondrial genome (44.16%); however, the percentage of thymine (T) is higher in the PCGs (29.47% compared to 27.05%). Among the PCGs, ND5 is the longest gene (1839 bp), while ATP8 is the shortest gene (168 bp).
Further analysis revealed that most S. stellatus PCGs start with the standard initiation codon ATG, except for the COI gene, which begins with GTG. Nine PCGs terminate with the TAA stop codon, while the COII and ND4 genes end with an AAT stop codon and ND6 and Cyt b genes end with a TAG stop codon. Additionally, the nucleotide composition bias predominantly exhibits negative GC and AT skew values (Table S2).

3.2. Codon Usage and Comparative RSCU Among Stromateid Species

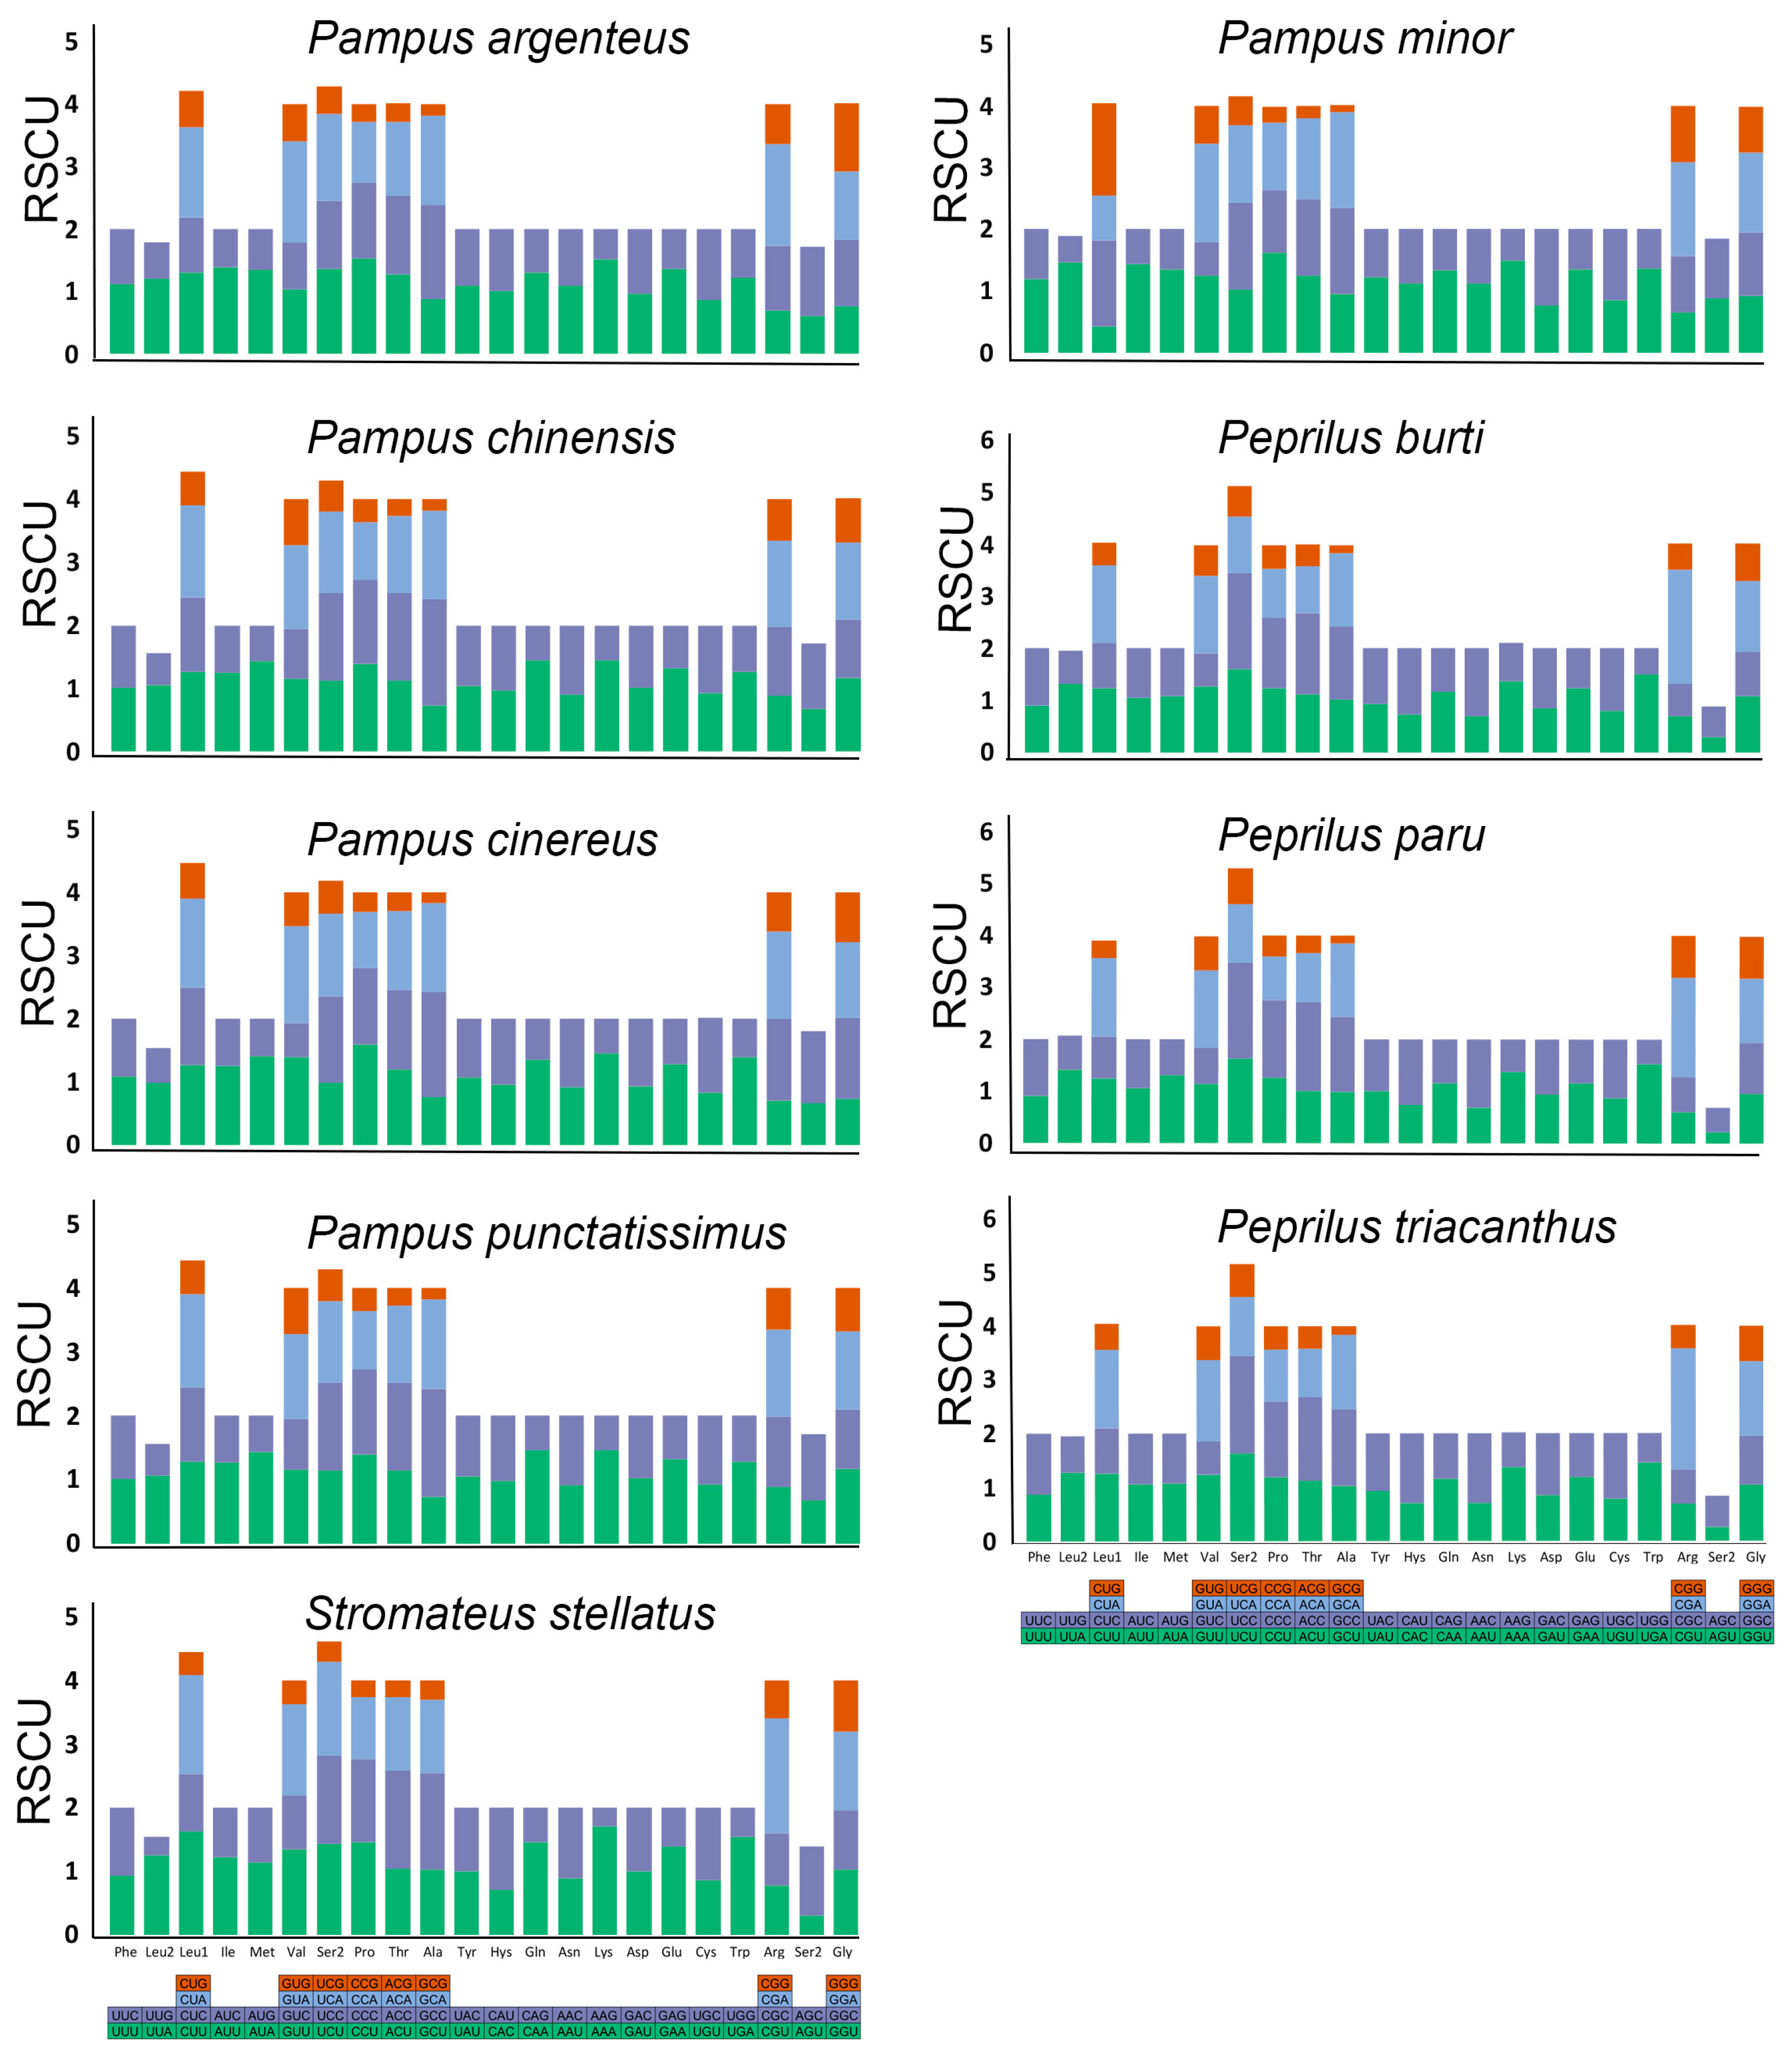
The overall codon usage and RSCU for all 13 PCGs in the S. stellatus mitogenome, three species of Peprilus, and five species of Pampus are presented in Figure 2. The total number of codons ranges from 3808 (P. chinensis, P. punctatissimus) to 3811 (P. paru), including the translation termination codons TAA and TAG, and the alternative stop codons AGA and AGG (Table S3). Comparative RSCU analysis among stromateids indicated that among all 13 PCGs, the codon usage was found to be conserved, with CUU (Leu1), CGA (Arg), and AAA (Lys) representing the most frequently used codons.

3.3. rRNA and tRNA Genes of S. stellatus

The mitochondrial genome of S. stellatus comprises the small subunit rRNA gene (12S rRNA) and the large subunit rRNA gene (16S rRNA), which were 950 bp and 1667 bp in size, respectively. These two rRNA genes are separated by tRNA-Val (Figure 1). In addition, 22 tRNA genes were detected, interspersed among the rRNA and protein-coding genes, with lengths ranging from 67 to 74 base pairs (bp) (Table S1). All tRNA genes exhibit the conventional cloverleaf-shaped secondary structure typical of other fish lineages (Figure S1). The most common non-Watson–Crick base pairs found in the tRNA secondary structures are adenine and cytosine (A–C) pairs, which appear in tRNA-Val, tRNA-Trp, tRNA-Lys, and twice in tRNA-Ser1. Thymine and cytosine (T–C) pairs are the next most frequent, found in tRNA-Ile, tRNA-His, tRNA-Leu1, and tRNA-Thr. Most of these mismatches are in the acceptor and anticodon stems, as shown in Figure S1.

3.4. Non-Coding, Overlapping, and Intergenic Regions

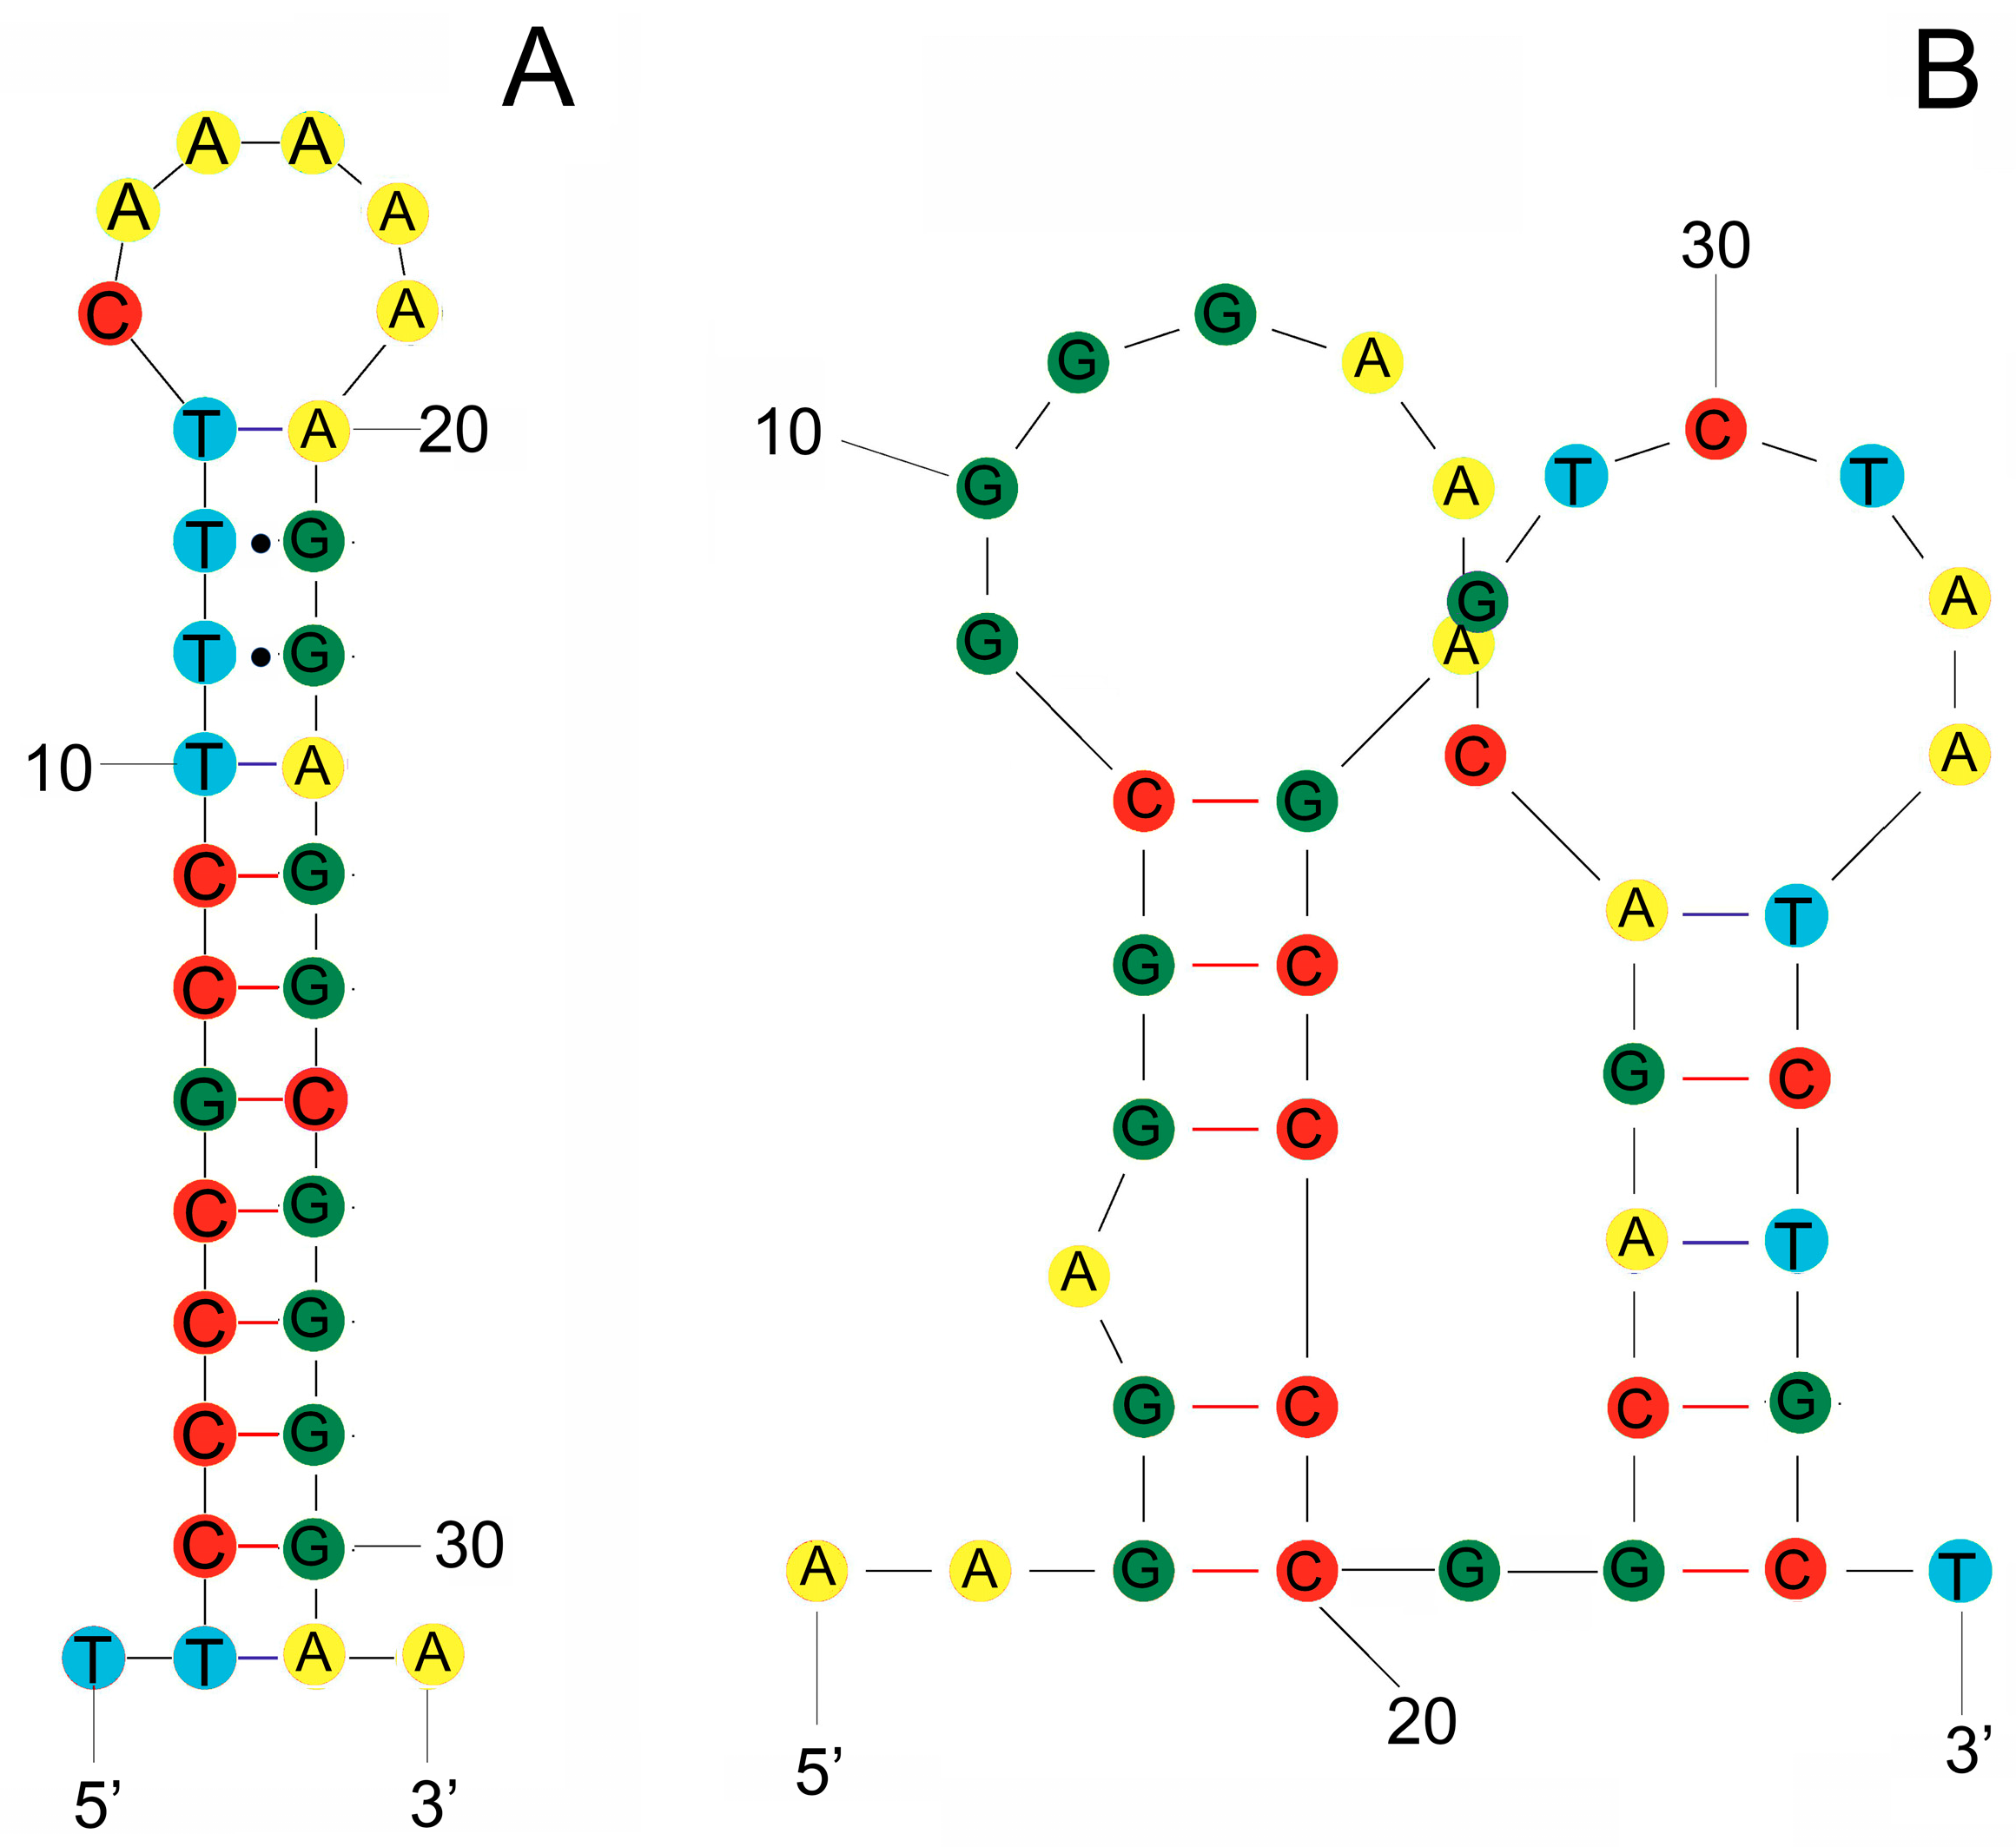
The S. stellatus mitogenome contains two non-coding regions. The largest non-coding region, the Control Region (CR), is 589 bp long and situated between tRNA-Pro and tRNA-Phe (positions 15,887 to 16,454; Figure 1; Table S1). The base composition of this region is 28.69% A, 24.62% C, 16.98% G, and 29.71% T, with a GC content of 41.60%. The CR shows a negative AT-skew of 0.02 and a GC-skew of 0.18 (Table S2). The other non-coding region includes the origin of L-strand replication (OL) and a second H-strand replication origin (OH1), both located between tRNA-Asn and tRNA-Cys within the WANCY region (Figure 1). The OL region (32 bp) has a G+C content of 53.13% and forms a stem-loop secondary structure (Figure 3A), while the OH1 region (39 bp) has a G+C content of 61.54% and contains two stem-loop secondary structures (Figure 3B).
Several overlapping and intergenic regions were also observed in the mitogenome. The length of overlapped sequences ranges from 1 bp to 25 bp (Table S1), with the largest overlapping region was located between the OL and OH1 regions. A 10 bp overlap containing the motif “ATGACACTAA” is found between ATP8 and ATP6. In addition, a 7 bp overlap with the motif “ATGCTAA” is detected between NAD4L and NAD4. The largest intergenic region (205 bp) lies between tRNA-Pro and the Control Region (positions 15,660 to 15,866; Table S1). This is followed by a 55 bp intergenic region between the Control Region (position 16,454) and tRNA-Phe (position 1), and a third notable intergenic region of 27 bp is located between positions 1090 (tRNA-Val) and 1117 (16S rRNA).

3.5. Mitochondrial Gene Rearrangement in Stromateidae

The comparative mitochondrial gene arrangement of S. stellatus relative to other stromateids is presented in Figure 4. The positions and orientations of protein-coding genes, tRNA genes, and rRNA genes, as well as intergenic and overlapping regions, are highly conserved across the family Stromateidae. The only notable exception is the size of the Control Region and the origin of L-strand replication, which, in Pampus cinereus, is situated on the L-strand [47].

3.6. Phylogenetic Relationships

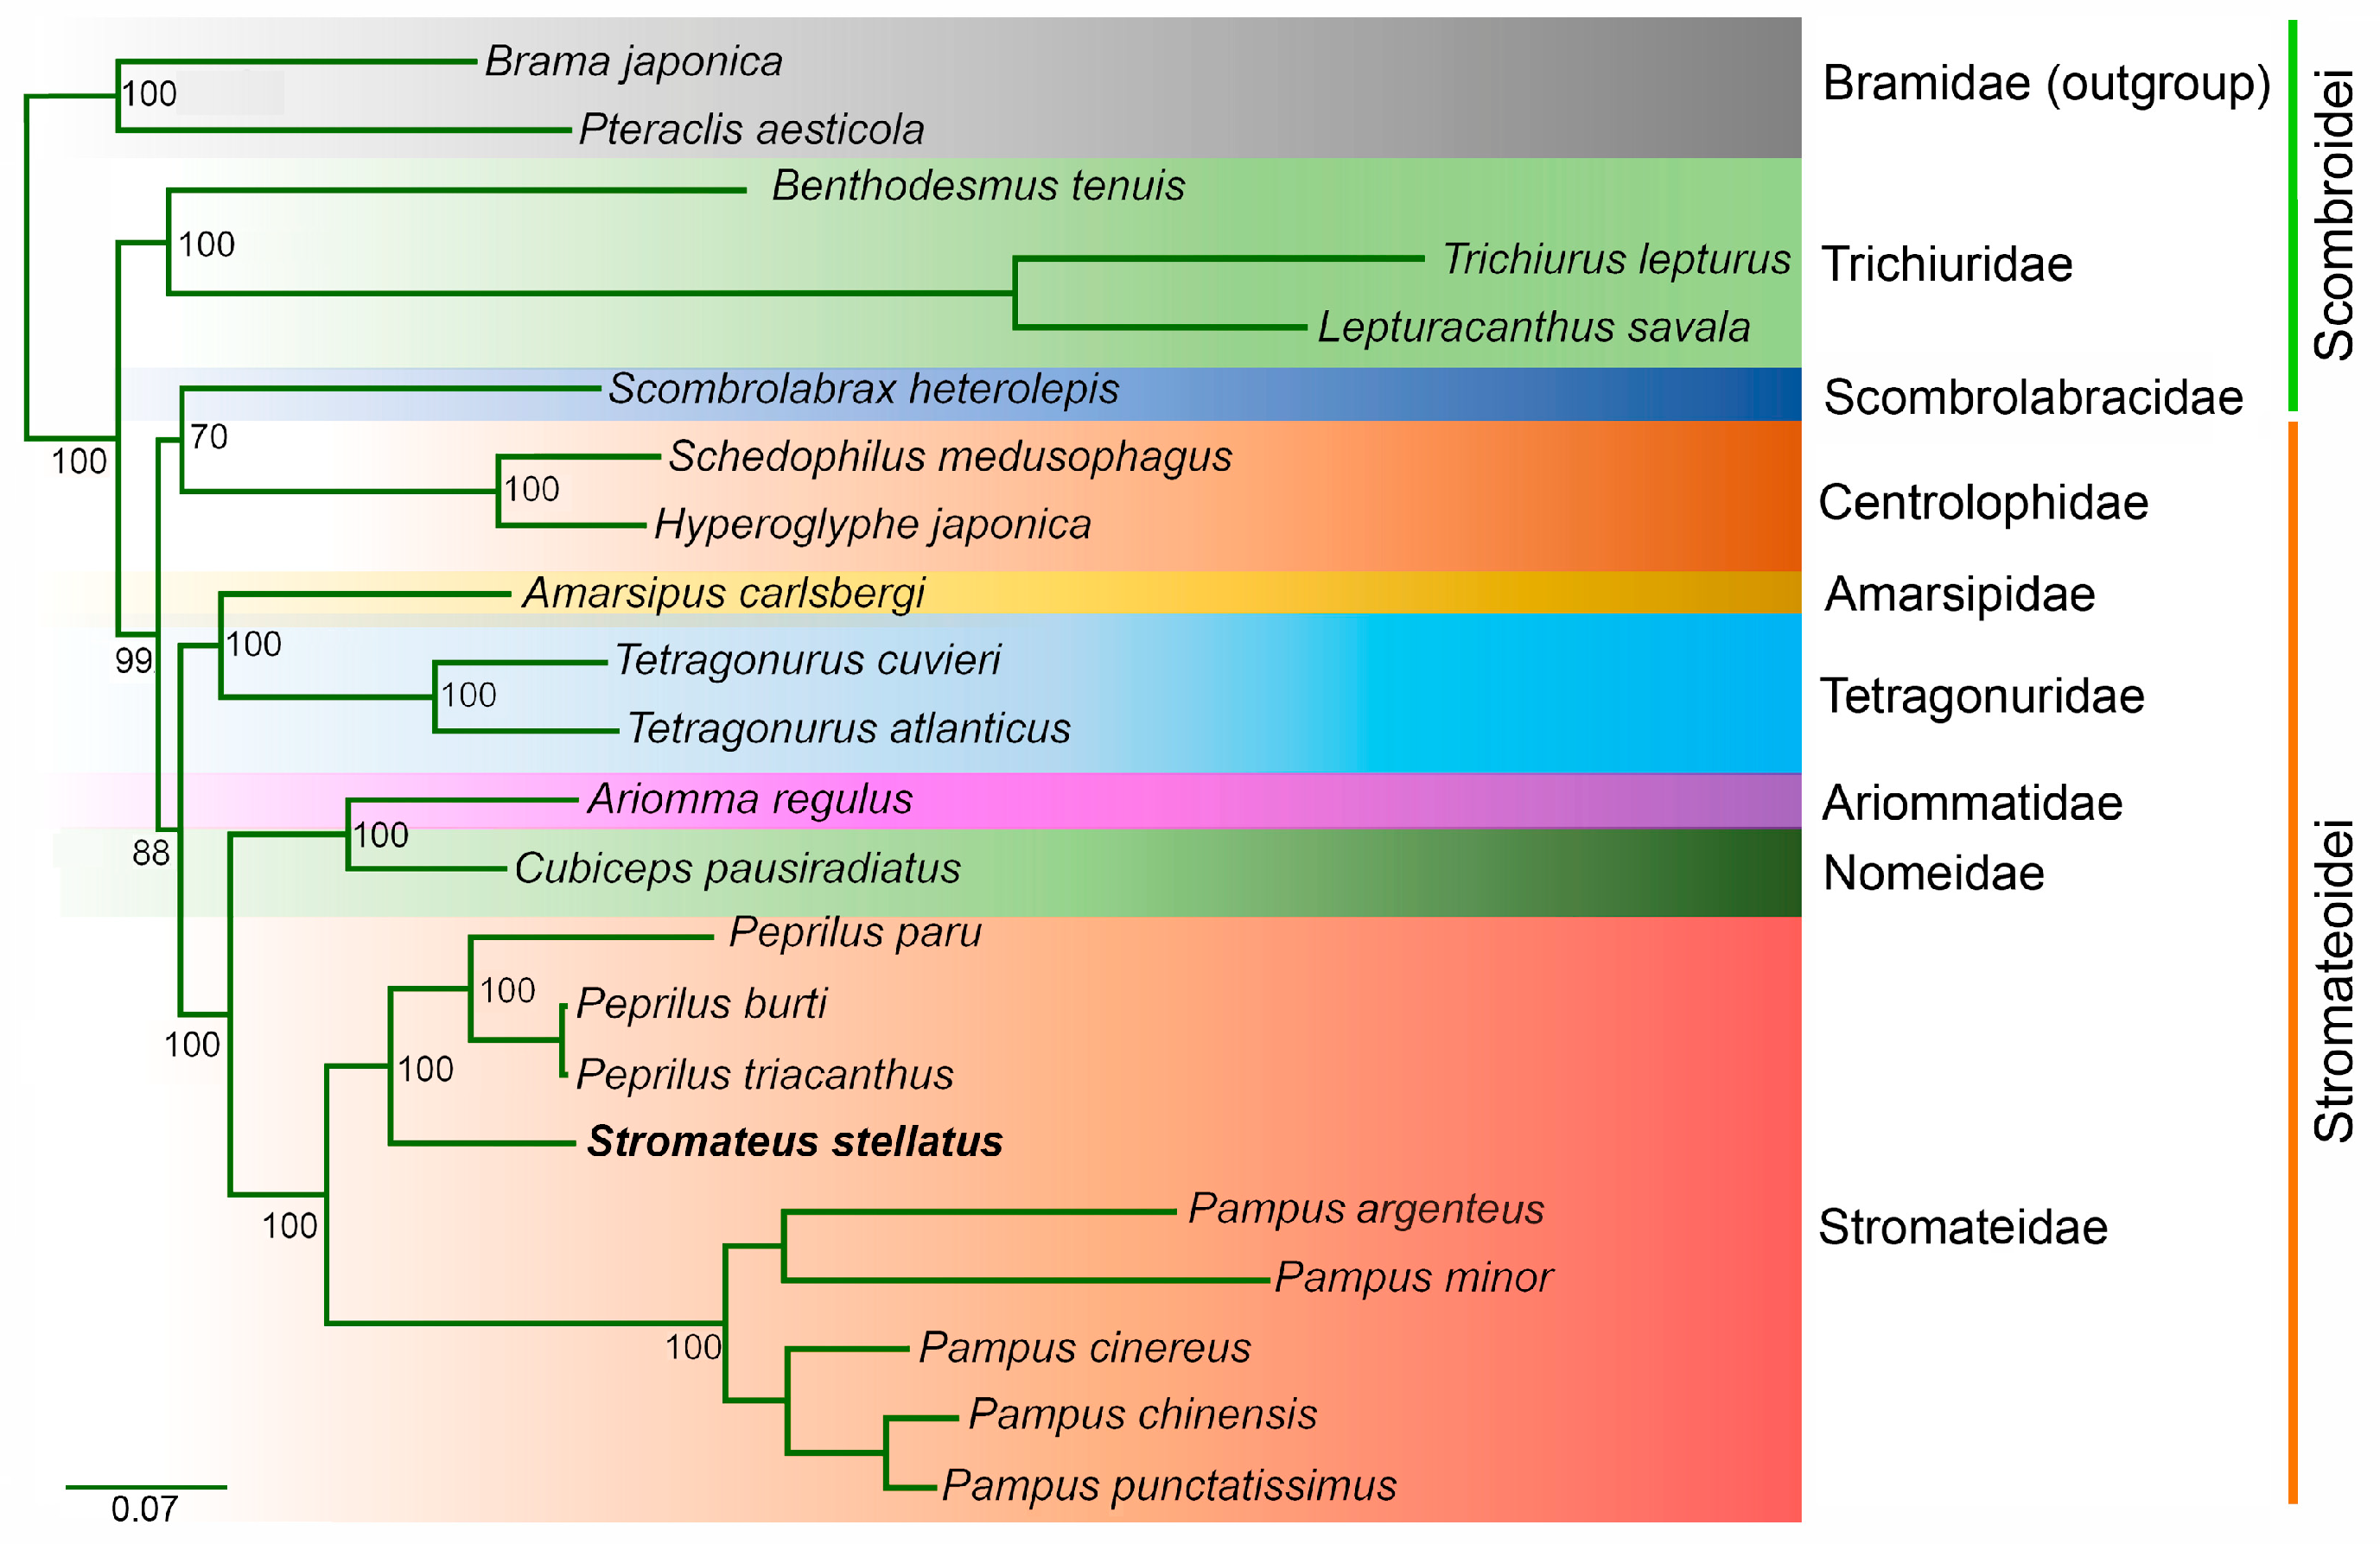
Phylogenetic analyses were conducted on a concatenated dataset of 13 PCG sites. This dataset contained 11,547 nucleotide-aligned sites, of which 5198 were parsimony-informative, 1016 were singletons, and 5333 constant sites. Both analyses, maximum likelihood (Figure 5) and Bayesian Inference (Figure S2), strongly support S. stellatus as the sister taxon to species of the genus Peprilus. Along with Pampus, these taxa form a well-supported clade, confirming the monophyly of the family Stromateidae. The families Ariommatidae and Nomeidae are identified as close relatives within the Stromateidae clade. Additionally, the families Amarsipidae, Tetragonuridae, Ariommatidae, Nomeidae, and Stromateidae together form a relatively well-supported clade, endorsing the monophyly of the suborder Stromateoidei. Notably, the family Scombrolabracidae, currently classified within suborder Scombroidei, was placed with relatively good support in a clade alongside Centrolophidae within suborder Stromateoidei.

4. Discussion

In the present study, the main features of the complete mitochondrial genome of the butterfish S. stellatus are described and compared with previously published butterfish mitochondrial genomes. This is also the first full and well-characterized mitogenome presented for the genus Stromateus, which helps clarify the systematics of Stromateidae members and facilitates molecular identification.
The S. stellatus mitogenome consists of 37 genes, including 13 protein-coding genes, 22 tRNA genes, two rRNA genes, and the Control Region. The gene structure and layout in this mitogenome, particularly the organization of protein-coding, tRNA, and rRNA gene blocks, are identical to those in other stromateids, such as Peprilus and Pampus [10,37,39,40], and stromateoids, including Ariomma, Cubiceps, and Tetragonurus [37,38]. In all cases, the genes are arranged in the same order and orientation, with no signs of gene rearrangements (Figure 4). Consistent with the typical tRNA set found in actinopterygian mitogenomes, 22 tRNA genes were predicted, including two types each of tRNA-Leu and tRNA-Ser (Table S1). All predicted tRNAs have the classic clover-leaf secondary structure, including tRNA-Ser1 (AGY), which, among fish mitogenomes, often fails to form a stable structure due to the absence of the DHU arm [48,49,50]. In S. stellatus, such as in nearly all vertebrate mitogenomes, the origin of light-strand replication (OL) is located within the “WANCY” region, which contains five tRNA genes: tRNA-Trp, tRNA-Ala, tRNA-Asn, OL, tRNA-Cys, and tRNA-Tyr (WAN-OL-CY) [51,52].
The S. stellatus mitogenome also contains three extensive intergenic regions and several long gene overlaps. Specifically, the largest intergenic region measures 205 base pairs, followed by regions of 55 and 27 base pairs, the latter located between the tRNA-Val and 16S rRNA. Similar intergenic regions are also present in the mitogenomes of Pampus and Peprilus species, suggesting a conserved pattern across related taxa. These sequence motifs are also conserved among vertebrates [53,54]. The findings indicate that the mtDNA of S. stellatus, as well as other members within Stromateidae and the order Scombriformes, exhibits a higher degree of gene structure conservation; consequently, they are of great significance for further exploration of species boundaries and divergence times.
The comparison of the RSCUs of the S. stellatus mitogenome with other stromateid mitogenomes is shown in Figure 2. The Leu1, Val, Ser2, Pro, Thr, Ala, Arg, and Gly amino acids utilize four different codons in all species, while two codons encode all other amino acids, consistent with other fish lineages [55]. An RSCU value below 1.0 indicates a negative codon bias, meaning the codon is used less frequently than expected. On the contrary, an RSCU value greater than 1 indicates that the codon is used more frequently than expected, suggesting a positive codon usage bias toward that codon. Although the mitochondrial genetic code in animals is conserved, significant variations in synonymous codon usage have been observed among and within species [56]. Codon usage bias can influence gene expression, protein folding, tRNA abundance, and genome evolution. For example, genes showing strong codon bias often have characteristic RSCU profiles with codons favored for translational efficiency [57]. Furthermore, the structure, function, and expression of proteins may be impacted by the choice of codons used [58]. This choice is crucial for translational efficiency, accuracy, and protein synthesis, as different organisms opt for codons that can be quickly processed to minimize the duration and energy required for translation.
In all PCGs (except NAD6), the leading coding strand displays negative GC-skew, meaning it is richer in cytosine than guanine. Negative GC-skew in a mitochondrial genome implies that in a specific strand of the mitochondrial DNA, the amount of cytosine (C) nucleotides is higher than the amount of guanine (G) nucleotides. This asymmetry arises due to differences in DNA replication and mutational or selective pressures on the leading and lagging strands. In other words, it is related to the replication mechanism, where one strand is synthesized continuously (the leading strand) and the other discontinuously (the lagging strand), resulting in compositional biases between the strands.
The phylogenetic reconstruction in this study was based on the sequences of 13 protein-coding genes from 22 mitochondrial genomes, including nine from Stromateidae. The topology of the resulting phylogenetic trees was supported by high bootstrap and posterior probability values (Figure 5), with the three Peprilus and five Pampus species forming a monophyletic group together with S. stellatus. Although [59] regarded Stromateus as sister species of Pampus, the phylogenetic inference presented here indicates that Peprilus is more closely related to Stromateus than to Pampus. Similar results were obtained by Doiuchi et al. [59] and Pastana et al. [3] based on morphological characters. However, due to the limited number of species included in these analyses, systematic conclusions within the suborder Stromateoidei should be interpreted with caution.
The increasing availability of published mitochondrial genomes, the conserved structure of these genomes in vertebrates, and advances in assembly methods have enhanced the value of mitochondrial genomes in taxonomic and evolutionary research. In fact, many marine organisms, such as cnidarians, crustaceans, and fish, are considered sentinels of environmental health and ecosystem stability. Thus, in the case of fish, establishing reference databases of mitochondrial genomes can significantly enhance monitoring through environmental DNA (eDNA). Furthermore, as point out in previous studies [56,60], this trend aids in the development of evidence-based conservation strategies, especially for taxa previously neglected due to their low market value.
S. stellatus is the sole stromateid in the coastal waters of Perú and Chile, yet its economic undervaluation due to its inedibility has led to it being classified as a bycatch species, resulting in considerable waste and unsustainable marine biomass use. Although due to sample availability, we did not perform population analyses to determine the genetic diversity of this species, our contribution of the first Stromateus mitogenome supplies a valuable genetic resource for further taxonomy, phylogeny, and conservation research within Stromateidae. Moreover, though population structure assessment awaits broader sampling, the recognition of research bias toward commercial species reiterates the need for more inclusive scientific approaches and management policies, promoting the sustainable use of marine resources by integrating neglected species into research and monitoring.

5. Conclusions

In this work, the complete sequence of the mitochondrial genome of the butterfish S. stellatus is presented for the first time. Its basic characteristics show a typical genome organization and gene order found in other Scombriformes and Actinopterigii mitochondrial genomes. Phylogenetic analysis, based on the 13 PCGs, supports the monophyly of Stromateidae and indicates a close phylogenetic relationship between Stromateus and Peprilus. Overall, the mitochondrial genome of S. stellatus constitutes a data resource that advances the systematics of Stromateidae, establishing a basis for future molecular and ecological studies.

Supplementary Materials

The following supporting information can be downloaded at: https://www.mdpi.com/article/10.3390/genes16111256/s1, Table S1. Compositional organization in the mitochondrial genome of S. stellatus; Table S2. Length, base composition percent (account in parenthesis), GC percent, and AT and GC skew in different regions of the mitochondrial genome of S. stellatus; Table S3. Relative synonymous codon usage (RSCU) in the mitochondrial genome of S. stellatus; Figure S1. Secondary structure of tRNAs in the mitogenome of S. stellatus; Figure S2. Bayesian inference tree of S. stellatus and 21 species of Scombriformes.

Author Contributions

Conceptualization, writing—review and editing, J.J.N., F.E.A., and R.P.-P.; methodology, formal analysis, J.J.N., and F.E.A.; sample acquisition, R.P.-P.; funding acquisition, J.J.N., and R.P.-P. All authors have read and agreed to the published version of the manuscript.

Funding

This research was partially funded by ANID Chile (Fondecyt Project 1251835 to J.J.N.).

Institutional Review Board Statement

Experiments were performed following the bioethical regulations of the Universidad Austral de Chile. This study’s sample did not involve an endangered or protected animal. Furthermore, a scientific collection permit was not required for this study because the specimen was taken from a discard catch and was received lifeless by our laboratory.

Informed Consent Statement

This study did not involve humans.

Data Availability Statement

The mitochondrial genome sequence data are openly available from the NCBI GenBank database under accession number PX223046.

Acknowledgments

We want to thank LM GOJUMAR I for donating the S. stellatus specimen.

Conflicts of Interest

The authors declare no conflicts of interest.

References

  1. Board, W.E. World Register of Marine Species. Available online: https://www.marinespecies.org/aphia.php?p=taxdetails&id=125567 (accessed on 30 August 2025).
  2. Pequeño, G. Lista sistemática revisada y comentada: Addendum. Rev. Biol. Mar. Oceanogr. 1997, 32, 77–94. Available online: https://rbmo.uv.cl/escaneados/322-77.pdf (accessed on 13 August 2025).
  3. Pastana, M.N.L.; Johnson, G.D.; Datovo, A. Comprehensive phenotypic phylogenetic analysis supports the monophyly of stromateiform fishes (Teleostei: Percomorphacea). Zool. J. Linn. Soc. 2021, 195, 841–963. [Google Scholar] [CrossRef]
  4. Arcila, D.; Hughes, L.C.; Meléndez-Vazquez, B.; Baldwin, C.C.; White, W.T.; Carpenter, K.E.; Williams, J.T.; Santos, M.D.; Pogonoski, J.J.; Miya, M. Testing the utility of alternative metrics of branch support to address the ancient evolutionary radiation of tunas, stromateoids, and allies (Teleostei: Pelagiaria). Syst. Biol. 2021, 70, 1123–1144. [Google Scholar] [CrossRef]
  5. Chirichigno, N.; Cornejo, R. Catálogo Comentado de Los Peces Marinos del Perú (Publicación Especial). Instituto del Mar del Perú: el Callao, Perú, 2001. [Google Scholar]
  6. Herrera, G.A.; Zavala-Muñoz, F.; Landaeta, M.F. Observations on the ontogeny of butterfish Stromateus stellatus larvae (Pisces: Stromateidae) off central Chile. Rev. Biol. Mar. y Oceanogr. 2018, 53 (Suppl. S1), 89–98. [Google Scholar] [CrossRef]
  7. Sato, T.; Seo HwanSook, S.H.; Endo, Y.; Fujimoto, K. Diacyl glyceryl ether as the major muscle lipid in Stromateus stellatus and its hydrolyzability by lipase and oral acute toxicity on mice. Nippon Suisan Gakkaishi 2002, 68, 569–575. [Google Scholar] [CrossRef]
  8. Ramilo-Fernández, G.; Sotelo, C.G. Characterization and potential strategies for the valorisation of the Southwest Atlantic butterfish (Stromateus brasiliensis). J. Food Sci. Technol. 2020, 57, 2994–3003. [Google Scholar] [CrossRef]
  9. Sun, P.; Yu, J.; Tang, B.; Liu, Z. Gene variation and population structure of Pampus chinensis in the China coast revealed by mitochondrial control region sequences. Mitochondrial DNA Part B 2021, 6, 2240–2245. [Google Scholar] [CrossRef]
  10. Zhang, C.; Liu, H.; Huang, X.; Yuan, Z.; Zhang, S.; Xu, S.; Liu, J.; Wang, Y.; Wang, D.; Hu, J. Comparative Analysis of the Systematics and Evolution of the Pampus Genus of Fish (Perciformes: Stromateidae) Based on Osteology, Population Genetics and Complete Mitogenomes. Animals 2024, 14, 814. [Google Scholar] [CrossRef]
  11. Basurto, X.; Gutierrez, N.L.; Franz, N.; Mancha-Cisneros, M.d.M.; Gorelli, G.; Aguión, A.; Funge-Smith, S.; Harper, S.; Mills, D.J.; Nico, G.; et al. Illuminating the multidimensional contributions of small-scale fisheries. Nature 2025, 637, 875–884. [Google Scholar] [CrossRef]
  12. Desalle, R.; Schierwater, B.; Hadrys, H. MtDNA: The small workhorse of evolutionary studies. Front. Biosci. (Landmark Ed.) 2017, 22, 873–887. [Google Scholar] [CrossRef]
  13. Fourdrilis, S.; de Frias Martins, A.M.; Backeljau, T. Relation between mitochondrial DNA hyperdiversity, mutation rate and mitochondrial genome evolution in Melarhaphe neritoides (Gastropoda: Littorinidae) and other Caenogastropoda. Sci. Rep. 2018, 8, 17964. [Google Scholar] [CrossRef]
  14. Shtolz, N.; Mishmar, D. The metazoan landscape of mitochondrial DNA gene order and content is shaped by selection and affects mitochondrial transcription. Commun. Biol. 2023, 6, 93. [Google Scholar] [CrossRef]
  15. Ferreira, T.; Rodriguez, S. Mitochondrial DNA: Inherent Complexities Relevant to Genetic Analyses. Genes 2024, 15, 617. [Google Scholar] [CrossRef]
  16. Formenti, G.; Rhie, A.; Balacco, J.; Haase, B.; Mountcastle, J.; Fedrigo, O.; Brown, S.; Capodiferro, M.R.; Al-Ajli, F.O.; Ambrosini, R.; et al. Complete vertebrate mitogenomes reveal widespread repeats and gene duplications. Genome Biol. 2021, 22, 120. [Google Scholar] [CrossRef]
  17. Bar-Yaacov, D.; Hadjivasiliou, Z.; Levin, L.; Barshad, G.; Zarivach, R.; Bouskila, A.; Mishmar, D. Mitochondrial Involvement in Vertebrate Speciation? The Case of Mito-nuclear Genetic Divergence in Chameleons. Genome Biol. Evol. 2015, 7, 3322–3336. [Google Scholar] [CrossRef]
  18. Mthethwa, S.; Bester-van der Merwe, A.E.; Roodt-Wilding, R. Addressing the complex phylogenetic relationship of the Gempylidae fishes using mitogenome data. Ecol. Evol. 2023, 13, e10217. [Google Scholar] [CrossRef] [PubMed]
  19. Tang, H.; Wang, Y.; Mao, S.; Guo, J.; Bao, S.; Xu, X.; Li, J.; Shen, Y. The complete mitogenome reveals genetic diversity and differentiation among wild and farmed black carp (Mylopharyngodon piceus) populations. Aquac. Fish. 2025, 10, 953–960. [Google Scholar] [CrossRef]
  20. Vieira, A.R.; de Sousa, F.; Bilro, J.; Viegas, M.B.; Svanbäck, R.; Gordo, L.S.; Paulo, O.S. Mitochondrial genomes of the European sardine (Sardina pilchardus) reveal Pliocene diversification, extensive gene flow and pervasive purifying selection. Sci. Rep. 2024, 14, 30977. [Google Scholar] [CrossRef]
  21. Roy, S.; Parida, P.K.; Ramya, V.L.; Kumar, V.; Bhakta, D.; Behera, B.K.; Das, B.K. Whole mitochondrial genome sequencing and phylogenetic analysis of Gangetic mystus (Mystus cavasius). Mitochondrial DNA Part B 2024, 9, 1539–1543. [Google Scholar] [CrossRef]
  22. Clayton, D.A.; Shadel, G.S. Isolation of Mitochondria from Animal Tissue. Cold Spring Harb. Protoc. 2014, 2014, pdb.prot080010. [Google Scholar] [CrossRef]
  23. Sambrook, J.F.R.; David, W. Molecular Cloning: A Laboratory Manual (3-Volume Set); Cold Springs Harbour Press: New York, NY, USA, 2001; Volume 1. [Google Scholar]
  24. Gould, M.P.; Bosworth, C.M.; McMahon, S.; Grandhi, S.; Grimerg, B.T.; LaFramboise, T. PCR-Free Enrichment of Mitochondrial DNA from Human Blood and Cell Lines for High Quality Next-Generation DNA Sequencing. PLoS ONE 2015, 10, e0139253. [Google Scholar] [CrossRef] [PubMed]
  25. Wingett, S.; Andrews, S. FastQ Screen: A tool for multi-genome mapping and quality control [version 2; peer review: 4 approved]. F1000Research 2018, 7, 1338. [Google Scholar] [CrossRef]
  26. Dierckxsens, N.; Mardulyn, P.; Smits, G. NOVOPlasty: De novo assembly of organelle genomes from whole genome data. Nucleic Acids Res. 2016, 45, e18. [Google Scholar] [CrossRef]
  27. Zhang, Z.; Schwartz, S.; Wagner, L.; Miller, W. A Greedy Algorithm for Aligning DNA Sequences. J. Comput. Biol. 2000, 7, 203–214. [Google Scholar] [CrossRef]
  28. Camacho, C.; Coulouris, G.; Avagyan, V.; Ma, N.; Papadopoulos, J.; Bealer, K.; Madden, T.L. BLAST+: Architecture and applications. BMC Bioinform. 2009, 10, 421. [Google Scholar] [CrossRef]
  29. Donath, A.; Jühling, F.; Al-Arab, M.; Bernhart, S.H.; Reinhardt, F.; Stadler, P.F.; Middendorf, M.; Bernt, M. Improved annotation of protein-coding genes boundaries in metazoan mitochondrial genomes. Nucleic Acids Res. 2019, 47, 10543–10552. [Google Scholar] [CrossRef]
  30. Grant, J.R.; Enns, E.; Marinier, E.; Mandal, A.; Herman, E.K.; Chen, C.-y.; Graham, M.; Van Domselaar, G.; Stothard, P. Proksee: In-depth characterization and visualization of bacterial genomes. Nucleic Acids Res. 2023, 51, W484–W492. [Google Scholar] [CrossRef]
  31. Kerpedjiev, P.; Hammer, S.; Hofacker, I.L. Forna (force-directed RNA): Simple and effective online RNA secondary structure diagrams. Bioinformatics 2015, 31, 3377–3379. [Google Scholar] [CrossRef]
  32. Kumar, S.; Stecher, G.; Suleski, M.; Sanderford, M.; Sharma, S.; Tamura, K. MEGA12: Molecular Evolutionary Genetic Analysis Version 12 for Adaptive and Green Computing. Mol. Biol. Evol. 2024, 41, msae263. [Google Scholar] [CrossRef] [PubMed]
  33. Perna, N.T.; Kocher, T.D. Patterns of nucleotide composition at fourfold degenerate sites of animal mitochondrial genomes. J. Mol. Evol. 1995, 41, 353–358. [Google Scholar] [CrossRef] [PubMed]
  34. Zuker, M. Mfold web server for nucleic acid folding and hybridization prediction. Nucleic Acids Res. 2003, 31, 3406–3415. [Google Scholar] [CrossRef]
  35. Near, T.J.; Thacker, C.E. Phylogenetic Classification of Living and Fossil Ray-Finned Fishes (Actinopterygii). Bull. Peabody Mus. Nat. Hist. 2024, 65, 3–302. [Google Scholar] [CrossRef]
  36. Campbell, M.A.; Sado, T.; Shinzato, C.; Koyanagi, R.; Okamoto, M.; Miya, M. Multilocus phylogenetic analysis of the first molecular data from the rare and monotypic Amarsipidae places the family within the Pelagia and highlights limitations of existing data sets in resolving pelagian interrelationships. Mol. Phylogenetics Evol. 2018, 124, 172–180. [Google Scholar] [CrossRef]
  37. Miya, M.; Friedman, M.; Satoh, T.P.; Takeshima, H.; Sado, T.; Iwasaki, W.; Yamanoue, Y.; Nakatani, M.; Mabuchi, K.; Inoue, J.G.; et al. Evolutionary Origin of the Scombridae (Tunas and Mackerels): Members of a Paleogene Adaptive Radiation with 14 Other Pelagic Fish Families. PLoS ONE 2013, 8, e73535. [Google Scholar] [CrossRef]
  38. Yagishita, N.; Miya, M.; Yamanoue, Y.; Shirai, S.M.; Nakayama, K.; Suzuki, N.; Satoh, T.P.; Mabuchi, K.; Nishida, M.; Nakabo, T. Mitogenomic evaluation of the unique facial nerve pattern as a phylogenetic marker within the percifom fishes (Teleostei: Percomorpha). Mol. Phylogenetics Evol. 2009, 53, 258–266. [Google Scholar] [CrossRef] [PubMed]
  39. Li, Y.; Song, N.; Lin, L.; Gao, T. The complete mitochondrial genome of Pampus echinogaster (Perciformes: Stromateidae). Mitochondrial DNA Part A 2016, 27, 289–290. [Google Scholar] [CrossRef] [PubMed]
  40. Wang, S.; Zhao, L.; Li, Y.; Zhang, Z.; Wang, Z.; Gao, T. The complete mitochondrial genome of Pampus minor (Liu & Li, 1998) (Perciformes: Stromateidae). Mitochondrial DNA Part B 2019, 4, 205–206. [Google Scholar] [CrossRef]
  41. Sun, D.; Cheng, Q.; Qiao, H.; Zhang, H.; Chen, Y. The complete mitochondrial genome sequence of Pampus chinensis (Perciformes: Stromateidae). Mitochondrial DNA Part A 2016, 27, 510–511. [Google Scholar] [CrossRef] [PubMed]
  42. Katoh, K.; Rozewicki, J.; Yamada, K.D. MAFFT online service: Multiple sequence alignment, interactive sequence choice and visualization. Brief. Bioinform. 2017, 20, 1160–1166. [Google Scholar] [CrossRef]
  43. Nguyen, L.-T.; Schmidt, H.A.; von Haeseler, A.; Minh, B.Q. IQ-TREE: A Fast and Effective Stochastic Algorithm for Estimating Maximum-Likelihood Phylogenies. Mol. Biol. Evol. 2014, 32, 268–274. [Google Scholar] [CrossRef]
  44. Trifinopoulos, J.; Nguyen, L.-T.; von Haeseler, A.; Minh, B.Q. W-IQ-TREE: A fast online phylogenetic tool for maximum likelihood analysis. Nucleic Acids Res. 2016, 44, W232–W235. [Google Scholar] [CrossRef]
  45. Ronquist, F.; Teslenko, M.; van der Mark, P.; Ayres, D.L.; Darling, A.; Höhna, S.; Larget, B.; Liu, L.; Suchard, M.A.; Huelsenbeck, J.P. MrBayes 3.2: Efficient Bayesian Phylogenetic Inference and Model Choice Across a Large Model Space. Syst. Biol. 2012, 61, 539–542. [Google Scholar] [CrossRef]
  46. Kalyaanamoorthy, S.; Minh, B.Q.; Wong, T.K.F.; von Haeseler, A.; Jermiin, L.S. ModelFinder: Fast model selection for accurate phylogenetic estimates. Nat. Methods 2017, 14, 587–589. [Google Scholar] [CrossRef]
  47. Wang, S.; Zhao, L.; Li, Y.; Zhang, Z.; Wang, Z.; Gao, T. Complete mitochondrial DNA genome of grey pomfret Pampus cinereus (Bloch, 1795) (Perciformes: Stromateidae). Mitochondrial DNA Part B 2018, 3, 683–684. [Google Scholar] [CrossRef] [PubMed]
  48. Chen, S.-C.; Wei, D.-D.; Shao, R.; Dou, W.; Wang, J.-J. The Complete Mitochondrial Genome of the Booklouse, Liposcelis decolor: Insights into Gene Arrangement and Genome Organization within the Genus Liposcelis. PLoS ONE 2014, 9, e91902. [Google Scholar] [CrossRef] [PubMed]
  49. Zhong, L.; Wang, M.; Li, D.; Tang, S.; Chen, X. Mitochondrial Genome of Eleutheronema rhadinum with an Additional Non-coding Region and Novel Insights Into the Phylogenetics. Front. Mar. Sci. 2021, 8, 746598. [Google Scholar] [CrossRef]
  50. Yang, J.; Li, A.; Liu, S. Structural Characteristics of Mitochondrial Genomes of Two Species of Mackerel and Phylogenetic Analysis of Scombridae Family. Biomolecules 2025, 15, 555. [Google Scholar] [CrossRef] [PubMed]
  51. Pereira, S.L. Mitochondrial genome organization and vertebrate phylogenetics. Genet. Mol. Biol. 2000, 23, 745–752. [Google Scholar] [CrossRef]
  52. Qian, L.; Wang, H.; Yan, J.; Pan, T.; Jiang, S.; Rao, D.; Zhang, B. Multiple independent structural dynamic events in the evolution of snake mitochondrial genomes. BMC Genom. 2018, 19, 354. [Google Scholar] [CrossRef]
  53. Broughton, R.E.; Milam, J.E.; Roe, B.A. The complete sequence of the zebrafish (Danio rerio) mitochondrial genome and evolutionary patterns in vertebrate mitochondrial DNA. Genome Res. 2001, 11, 1958–1967. [Google Scholar] [CrossRef]
  54. Siddika, M.A.; Ahmed, K.A.; Alam, M.S.; Bushra, J.; Begum, R.A. Complete mitogenome and intra-family comparative mitogenomics showed distinct position of Pama Croaker Otolithoides pama. Sci. Rep. 2024, 14, 13820. [Google Scholar] [CrossRef] [PubMed]
  55. Kim, K.-S.; Kang, D.-W.; Kim, K.-Y.; Heo, J.S.; Song, H.-Y.; Yoon, J.-D. Characterization of the complete mitogenome of the endangered freshwater fish Gobiobotia naktongensis from the Geum River in South Korea: Evidence of stream connection with the Paleo-Huanghe. Genes Genom. 2022, 44, 945–956. [Google Scholar] [CrossRef]
  56. Jia, W.; Higgs, P.G. Codon Usage in Mitochondrial Genomes: Distinguishing Context-Dependent Mutation from Translational Selection. Mol. Biol. Evol. 2008, 25, 339–351. [Google Scholar] [CrossRef]
  57. Zhang, R.-Q.; Bai, Y.-W.; Hu, J.-T.; Wang, P.-Y.; Qi, Y.; Zhang, T.-X.; Jiao, H.-Y.; Lin, X.-L.; Yan, Z.-G. Complete mitochondrial genomes and phylogenetic analysis of native and non-native fishes in a national key wetland of China. Front. Environ. Sci. 2024, 12, 1415150. [Google Scholar] [CrossRef]
  58. DeVore, M.L.; Bazzini, A.A. Codon optimality influences homeostatic gene expression in zebrafish. G3 Genes Genomes Genet. 2024, 14, jkae247. [Google Scholar] [CrossRef]
  59. Doiuchi, R.; Nakabo, T. Molecular phylogeny of the stromateoid fishes (Teleostei: Perciformes) inferred from mitochondrial DNA sequences and compared with morphology-based hypotheses. Mol. Phylogenetics Evol. 2006, 39, 111–123. [Google Scholar] [CrossRef] [PubMed]
  60. Alvarenga, M.; D’Elia, A.K.P.; Rocha, G.; Arantes, C.A.; Henning, F.; de Vasconcelos, A.T.R.; Solé-Cava, A.M. Mitochondrial genome structure and composition in 70 fishes: A key resource for fisheries management in the South Atlantic. BMC Genom. 2024, 25, 215. [Google Scholar] [CrossRef] [PubMed]
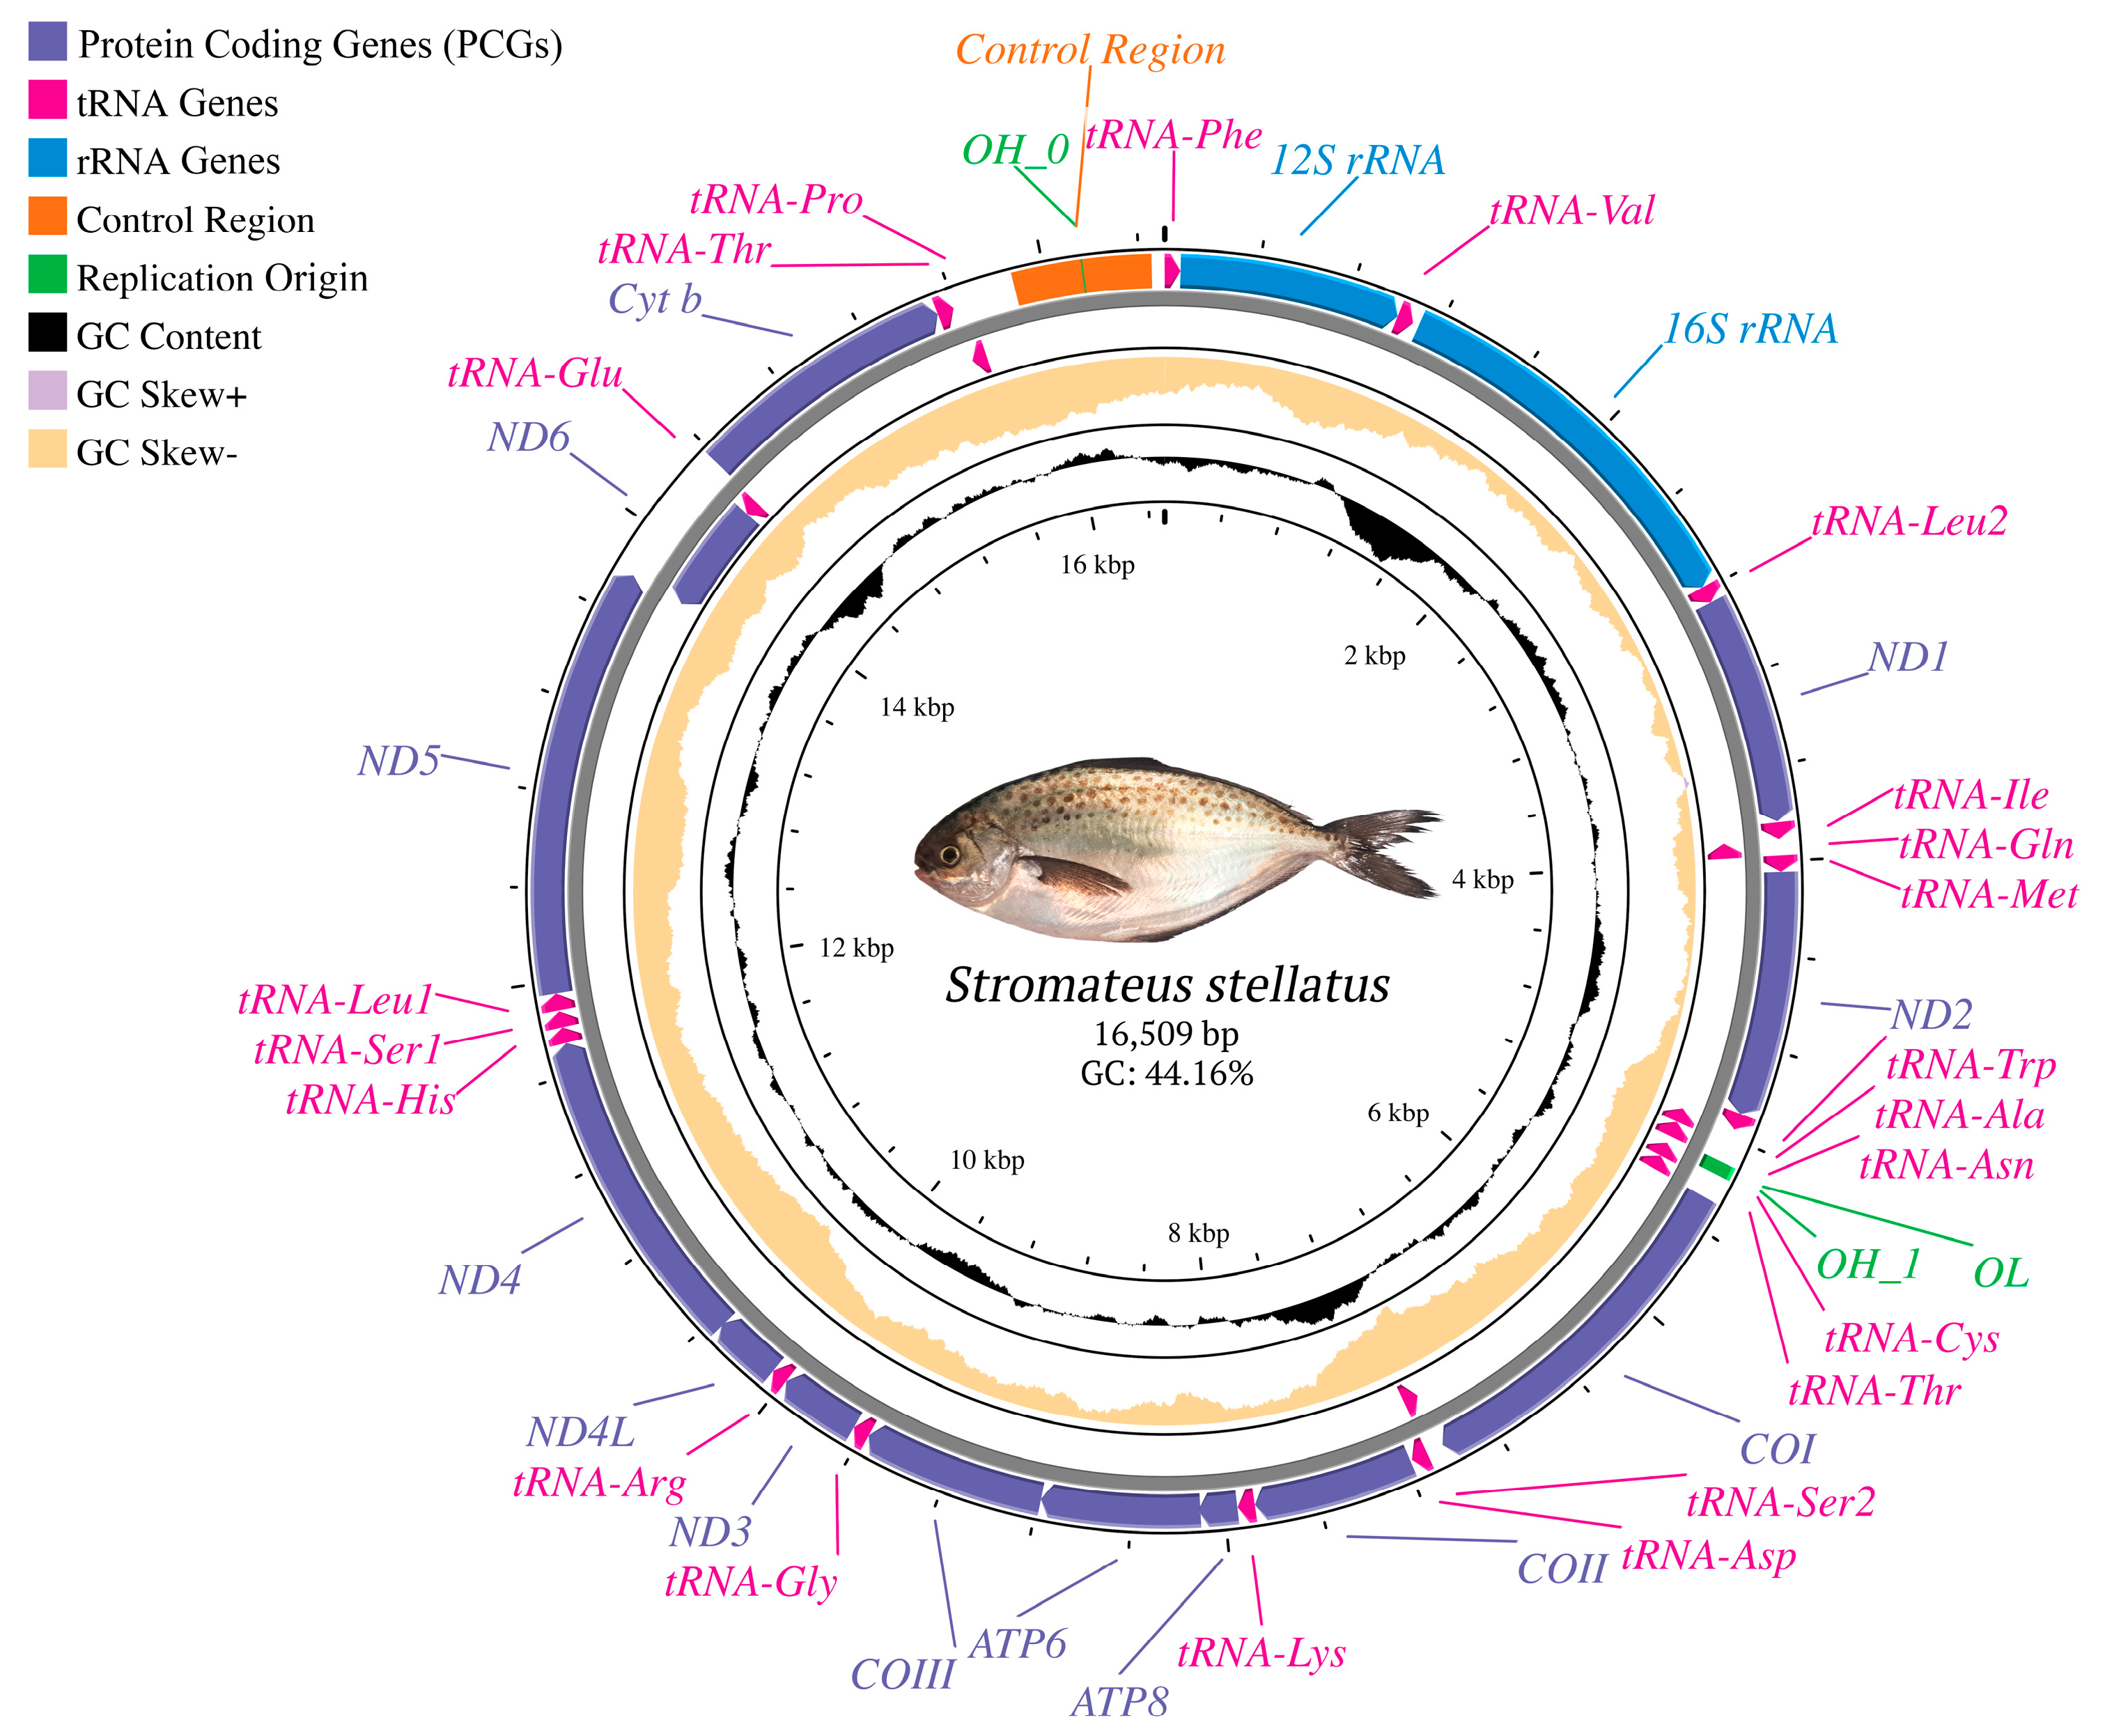
Figure 1. The mitogenome map of S. stellatus. The arrows indicate the gene transcription orientation. The tRNA genes are labeled according to their corresponding amino acid codes. The color codes for different gene types are shown in the legend on the map.
Genes 16 01256 g001
Figure 2. Relative synonymous codon usage (RSCU) in the 13 PGSs of the mitochondrial genome of S. stellatus and eight mitogenomes from the family Stromatidae: P. argenteus (KF373560), P. minor (MH037007), P. cinereus (OR538383), P. chinensis (KJ418377), P. punctatissimus (OR538387), P. paru (OP056882), P. burti (AP012947), P. triacanthus (AP012518).
Genes 16 01256 g002
Figure 3. Stem-loop secondary structures of two non-coding regions in the S. stellatus mitogenome. (A) Stem–loop secondary structure of the OL region (32 bp); (B) Stem–loop secondary structure of the OH1 region (39 bp). Red and black bonds indicated GC and TA pairs, respectively. The dots indicate mismatches between bases.
Genes 16 01256 g003
Figure 4. Comparative mitogenome organization of S. stellatus and eight Stromateidae species. The colors show what is indicated in Figure 1.
Genes 16 01256 g004
Figure 5. The maximum-likelihood (ML) phylogenetic tree of S. stellatus and 21 Scombriformes species. Phylogenetic reconstruction was performed from a concatenated matrix of 13 protein-coding mitochondrial genes and 11,547 aligned sites. The numbers at the nodes indicate UFBoot support values.
Genes 16 01256 g005
Table 1. List of mitogenomic data of Scombriformes species from GenBank used for the maximum likelihood and Bayesian phylogenetic analyses.
FamilySpecies NameGenBank
Accession
Number
References
AmarsipidaeAmarsipus carlsbergiNC_037474[36]
AriommatidaeAriomma regulusPV357913Unpublished
BramidaeBrama japonicaKT908039Unpublished
Pteraclis aesticolaAP012499[37]
CentrolophidaeSchedophilus medusophagusMT410878Unpublished
Hyperoglyphe japonicaAP006037[38]
NomeidaeCubiceps pausiradiatusAP006038[38]
TetragonuridaeTetragonurus cuvieriAP012514[37]
Tetragonurus atlanticusAP012515[37]
TrichiuridaeBenthodesmus tenuisAP012522[37]
Lepturacanthus savalaOP724236Unpublished
Trichiurus lepturusNC_018791Unpublished
ScombrolabracidaeScombrolabrax heterolepisOP035059Unpublished
StromateidaePampus argenteusKF373560[39]
Pampus minorMH037007[40]
Pampus cinereusOR538383[10]
Pampus chinensisKJ418377[41]
Pampus punctatissimusOR538387[10]
Peprilus paruOP056882Unpublished
Peprilus burtiAP012947[37]
Peprilus triacanthusAP012518[37]
Disclaimer/Publisher’s Note: The statements, opinions and data contained in all publications are solely those of the individual author(s) and contributor(s) and not of MDPI and/or the editor(s). MDPI and/or the editor(s) disclaim responsibility for any injury to people or property resulting from any ideas, methods, instructions or products referred to in the content.