Article

Land-Use and Height of Pollen Sampling Affect Pollen Exposure in Munich, Germany

1
Center of Allergy & Environment (ZAUM), Member of the German Center for Lung Research (DZL), Technical University/Helmholtz Center Munich, 80802 Munich, Germany
2
University of Castilla-La Mancha, Institute of Environmental Sciences (Botany), 45071 Toledo, Spain
3
Department of Botany and Plant Physiology, University of Malaga, 29071 Malaga, Spain
4
Klinik und Poliklinik für Dermatologie und Allergologie, Klinikum der Universität München, 80337 Munich, Germany
5
German Pollen Information Service Foundation (PID), 10117 Berlin, Germany
*
Author to whom correspondence should be addressed.
Atmosphere 2020, 11(2), 145; https://doi.org/10.3390/atmos11020145
Submission received: 4 January 2020 / Revised: 23 January 2020 / Accepted: 24 January 2020 / Published: 29 January 2020
(This article belongs to the Special Issue GIS Applications for Airborne Pollen Monitoring and Prediction)

Abstract

:
Airborne pollen concentrations vary depending on the location of the pollen trap with respect to the pollen sources. Two Hirst-type pollen traps were analyzed within the city of Munich (Germany): one trap was located 2 m above ground level (AGL) and the other one at rooftop (35 m AGL), 4.2 km apart. In general, 1.4 ± 0.5 times higher pollen amounts were measured by the trap located at ground level, but this effect was less than expected considering the height difference between the traps. Pollen from woody trees such as Alnus, Betula, Corylus, Fraxinus, Picea, Pinus and Quercus showed a good agreement between the traps in terms of timing and intensity. Similar amounts of pollen were recorded in the two traps when pollen sources were more abundant outside of the city. In contrast, pollen concentrations from Cupressaceae/Taxaceae, Carpinus and Tilia were influenced by nearby pollen sources. The representativeness of both traps for herbaceous pollen depended on the dispersal capacity of the pollen grains, and in the case of Poaceae pollen, nearby pollen sources may influence the pollen content in the air. The timing of the pollen season was similar for both sites; however, the season for some pollen types ended later at ground level probably due to resuspension processes that would favor recirculation of pollen closer to ground level. We believe measurements from the higher station provides a picture of background pollen levels representative of a large area, to which local sources add additional and more variable pollen amounts.

1. Introduction

Pollinosis in urban areas has increased notably in recent decades [1], and numerous studies have examined potential sources of airborne pollen recorded in cities [2,3,4]. For instance, ornamental plants in urban green areas play an important role in allergic sensitization to pollen allergens and episodes of pollen allergy symptoms [5,6,7,8]. In addition, pollutants inside cities increase the severity of allergic symptoms [9,10,11]. Although several nature-based solutions may be implemented to reduce pollen emissions [12,13], avoiding pollen exposure in cities is hardly possible and necessitates prevention and medication [14]. Approximately 30% of the population of Germany is estimated to be sensitized to at least one type of aeroallergen [15]. To enable preventive measures or properly timed medication by pollen-allergic individuals it is useful to maintain an updated alert system [16,17,18].
Pollen information to warn of allergy risks is often provided by pollen stations located in cities, and in most cases only by one pollen station per city [19]. Traditional aerobiological sampling is labor-intensive and requires enormous amounts of human and economic resources [17]. Therefore, data from a single sampling point are extrapolated to a larger surrounding area. This, however, requires a representative (optimal) location for installing the pollen-sampling devices [20].
There are numerous factors that influence the representativeness of pollen data, especially at the location of the point of sampling. Thus, different locations may report significant differences in pollen measurements [21]. These differences are associated with the spatial distribution of pollen sources with respect to the prevailing meteorological conditions [3,22,23,24]. Pollen sampling in close proximity to the emission sources provides unrepresentative measurements, only applicable to very local pollen conditions [25]. Other characteristics such as urbanization levels near the station or the proximity to gardens or parks will influence measured pollen concentrations [26].
Buildings can influence the trajectories of air masses transporting pollen inside cities [27,28]. In addition, height of sampling has an impact on pollen measurements, although this influence is limited [29]. However, the effects of height on sampling may be increased when pollen originates from nearby sources [22].
In this study two pollen traps were compared in the city of Munich (Germany), one of them located at Biedersteiner street at 2 m above ground level (AGL), and the other about 4.2 km away at Thalkirchner street at 35 m AGL on a rooftop. The aims of this comparison were to study the representativeness of each pollen trap with respect to the amount of pollen in the air in Munich and the phenological parameters (timing of the pollen season), to quantify the differences between both pollen traps and to determine which trap is most suited for a pollen alert system.

2. Experiments

Two Hirst-type volumetric spore traps were operated within the city of Munich (Germany). Aerobiological sampling: the preparation and the analysis of the samples followed the requirements proposed by the International Association for Aerobiology [30]. The quality of pollen identification and quantification was controlled as described previously by Smith et al. [31].
The lower station was located at 2 m AGL in the middle of the gardens of the Center of Allergy and Environment (ZAUM) (Biedersteiner Street, DEBIED station). The higher station was located 4.2 km away, on the roof of the Klinik und Poliklinik für Dermatologie und Allergologie, University of Munich at 35 m AGL (Thalkirchner Street, DEMUNC station) (Figure 1).
The abundance and distribution of the pollen sources around both pollen stations were studied using Corine Land Cover information (Coordination of Information on the Environment, 2012 version) provided by the European Environment Agency (https://www.eea.europa.eu). Spatial information for this project was reclassified in 9 main units: urban areas, roads/peri-urban, agricultural fields, ornamental/green zones, broadleaf forests, coniferous forests, pastures, scrubs and riverbanks.
Concentric ring graphs were generated, which represent the relative abundance (% of the total ring surface) of the main land uses and vegetation types surrounding the two pollen monitoring stations DEBIED and DEMUNC (0 to 1, 1 to 2, 2 to 5 and 5 to 10 km from the pollen trap). This spatial representation was used for interpreting the general landscape configuration that characterized the abundance of the main pollen sources for specific pollen types around the stations [3,32].
Pollen season characteristics (start and end dates) were calculated using the 95% method for the period 2006–2016, whereby the start date was defined as being when 2.5% of pollen is recorded and the end date is when 97.5% of the pollen is collected for that year [33], as recommended when a large number of very different pollen types are compared [34].
Further, the relative abundance spectrum of the all pollen types in the air was calculated for the period 2006–2016 using the ‘iplot_abundance’ function from the AeRobiology R package [35]. Only the most abundant pollen types in Munich were studied: Alnus, Betula, Carpinus, Corylus, Cupressaceae/Taxaceae, Fraxinus, Picea, Pinus, Quercus and Tilia as woody taxa; and Poaceae and Urticaceae from herbaceous taxa. Differences were compared using the paired Student´s t-test.
Daily pollen concentrations for the most abundant pollen types were compared only considering days when both pollen traps registered more than 10 pollen grains/m3. Days with concentrations below this threshold were removed as proposed in previous studies [29,36] to reduce potential sources of error due to very low pollen concentrations [37]. Comparison of daily pollen concentrations according to pollen type and studied years were assessed by the slope and the coefficient of determination (R2) of the linear regression. The slope of the regression indicates the relationship between both pollen station (slope < 1 means that lower station DEBIED collected more pollen than the higher station DEMUNC), and the coefficient of determination (R2) indicates the variability of the data. Supplementary Materials can be consulted for extended results.
From the phenological point of view, only the period 2009–2016 was analyzed because of uncommon behavior in 2006–2008. Phenological analysis was done using the ‘iplot_pheno’ function from the AeRobiology R package [35].

3. Results and Discussion

3.1. Pollen Total

Significant differences were observed when the annual pollen integral (API) for the sum of all pollen types were compared between the stations. Figure 2A shows that the lower trap (DEBIED) registered higher APIs in the same period than the trap that was placed higher (DEMUNC). There is a large height difference between the two stations (Δheight = 33 m) and so disparities in the amounts of pollen collected in each trap were expected. However, Rojo et al. [29] recently observed that the effect of height on airborne pollen concentrations was linear in the first meters of height difference but this effect lost relevance from a certain height above ground level. This effect is probably the reason why height differences in pollen amounts were limited for the Munich stations (1.4 ± 0.5 times higher pollen amounts measured by the pollen trap located at ground level).
The seasonal behavior of the pollen curve according to total pollen (sum of all pollen types) were similar for both pollen stations (Figure 2B). The period of maximum pollen concentrations in Munich occurred in April and May and pollen peaks registered by DEBIED and DEMUNC generally coincided in timing and magnitude. Nevertheless, higher amounts of pollen were collected at DEBIED (ground level) with respect to DEMUNC (rooftop) during February and March, although the timing of peaks continued to coincide.

3.2. Abundance of the Pollen Types in the Air

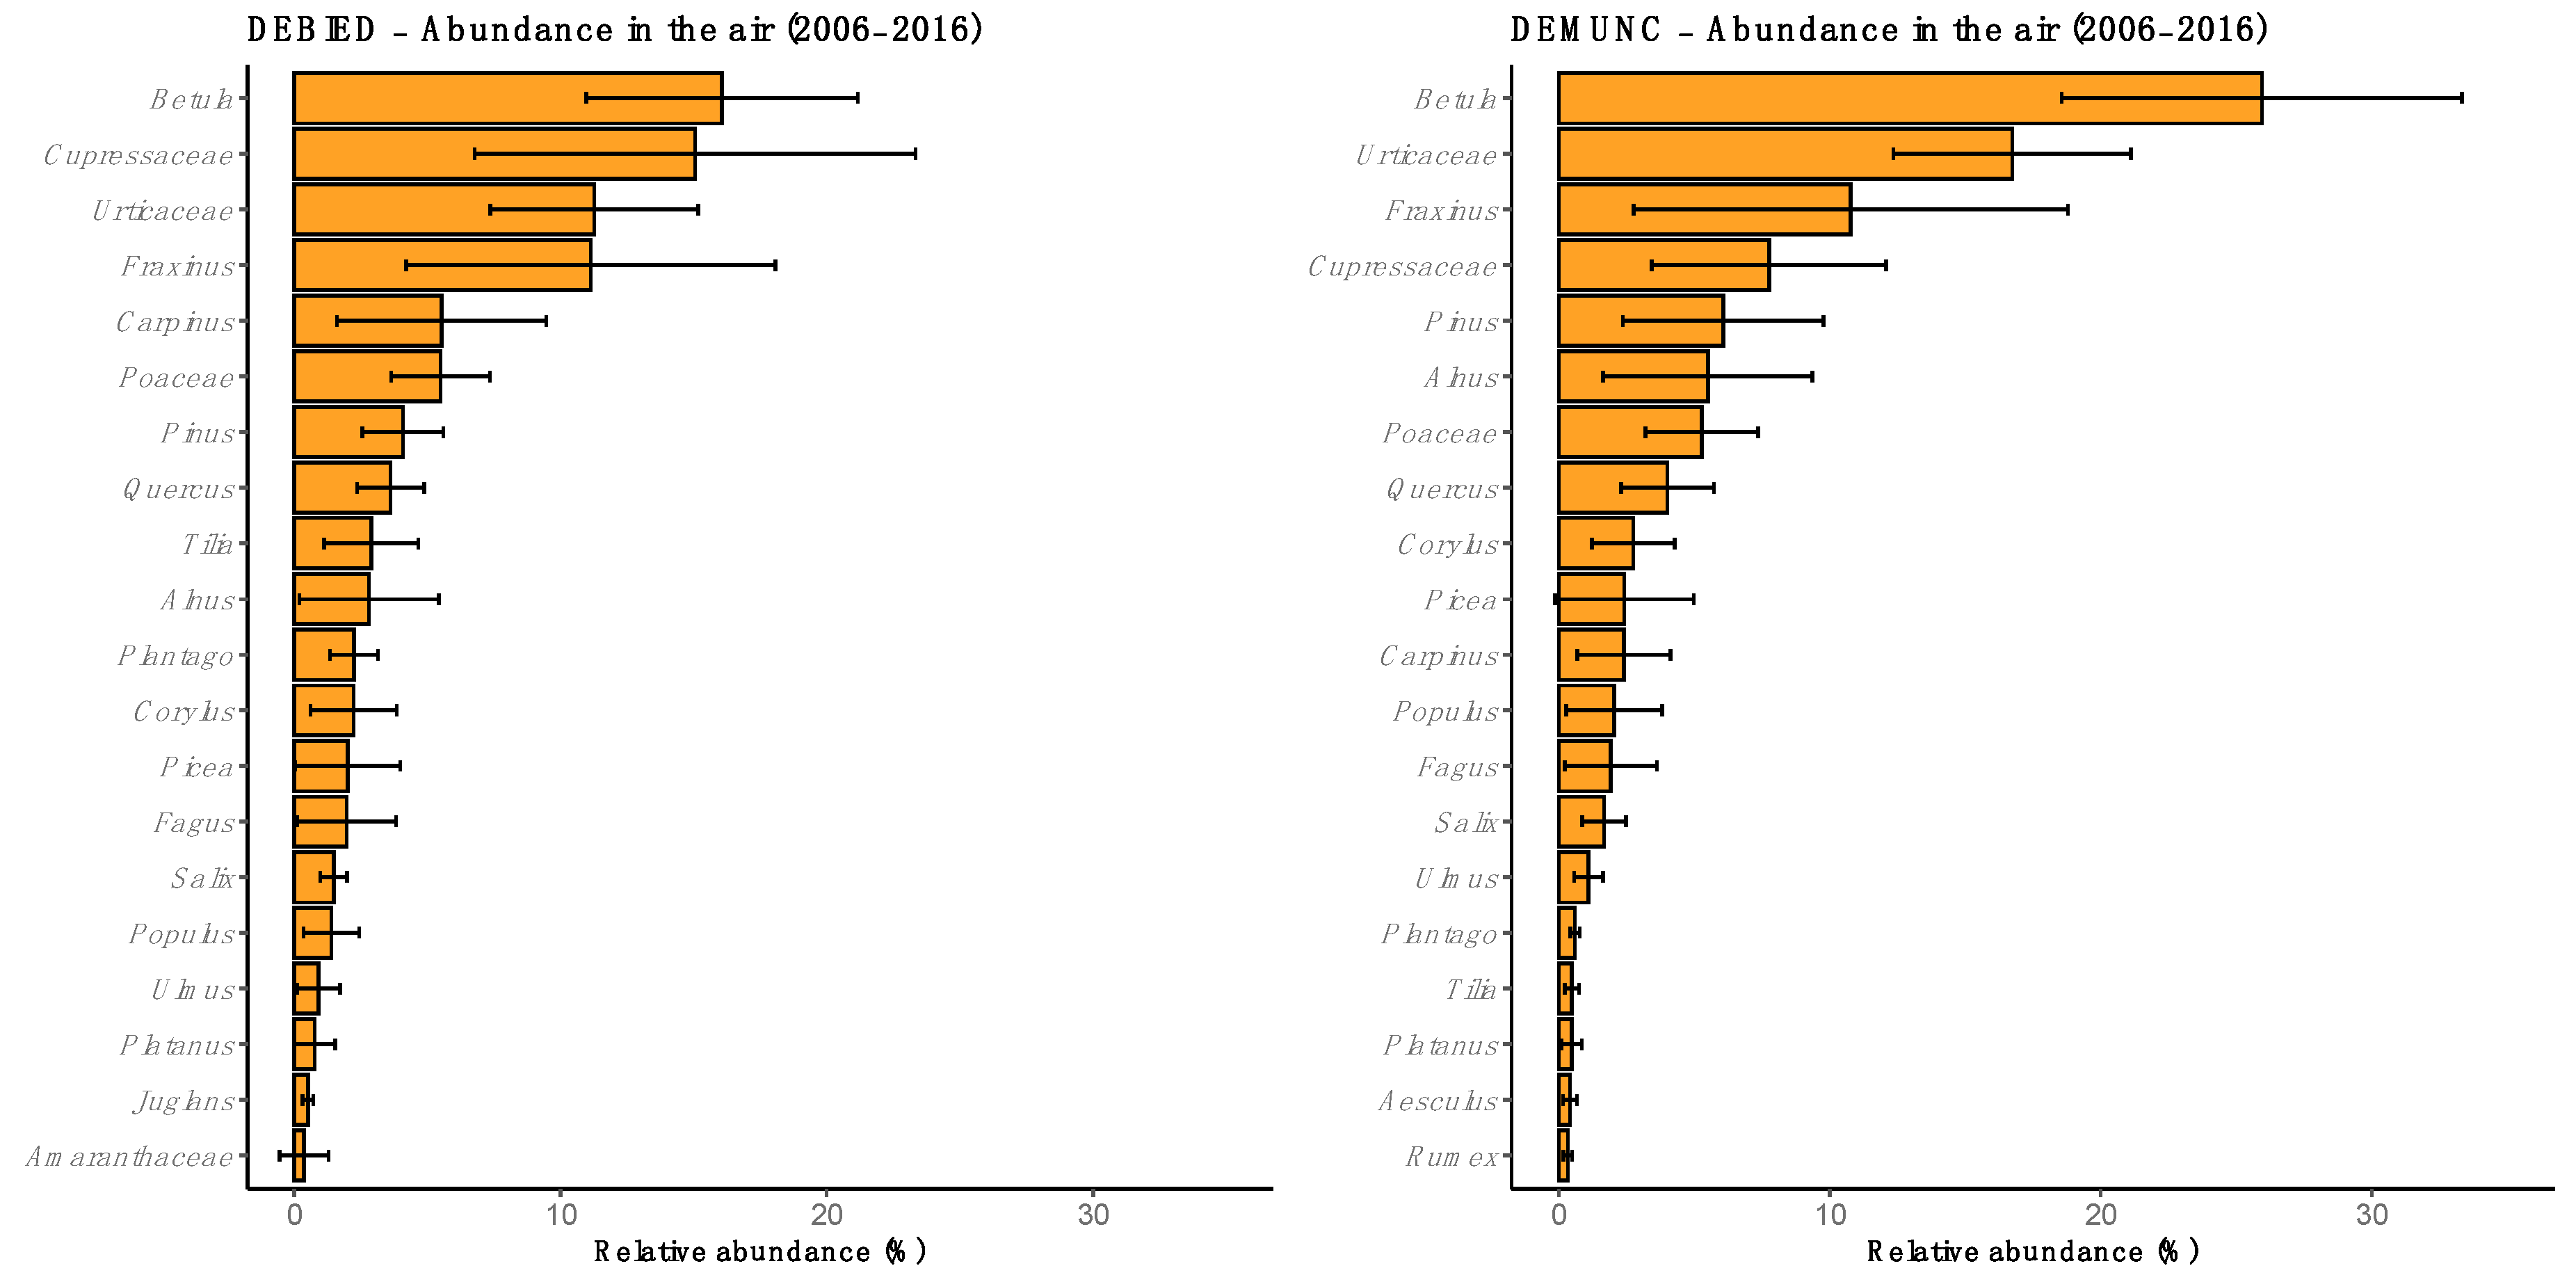
The relative abundance of the pollen types in the air of Munich (percentage of the total annual pollen) is shown in Figure 3. For DEBIED, the five most abundant pollen types (in order, Betula, Cupressaceae/Taxaceae, Urticaceae, Fraxinus and Carpinus) represented about 60% of the total pollen load. In DEMUNC, the four most abundant pollen types (in order, Betula, Urticaceae, Fraxinus and Cupressaceae/Taxaceae) accounted about 60% of the total pollen (Figure 3). The pollen spectra for DEBIED and DEMUNC were similar, but there were important differences. For instance, Betula dominated the pollen spectrum of DEMUNC (26%), while the relative abundance of Betula and Cupressaceae/Taxaceae pollen types were very similar in DEBIED (16% and 15%, respectively). Thus, the pollen spectrum seemed to differ in DEBIED compared to DEMUNC where a lower number of pollen types were prevalent. Moreover, pollen types such as Carpinus and Tilia represented a greater importance in DEBIED compared to DEMUNC (Figure 3).
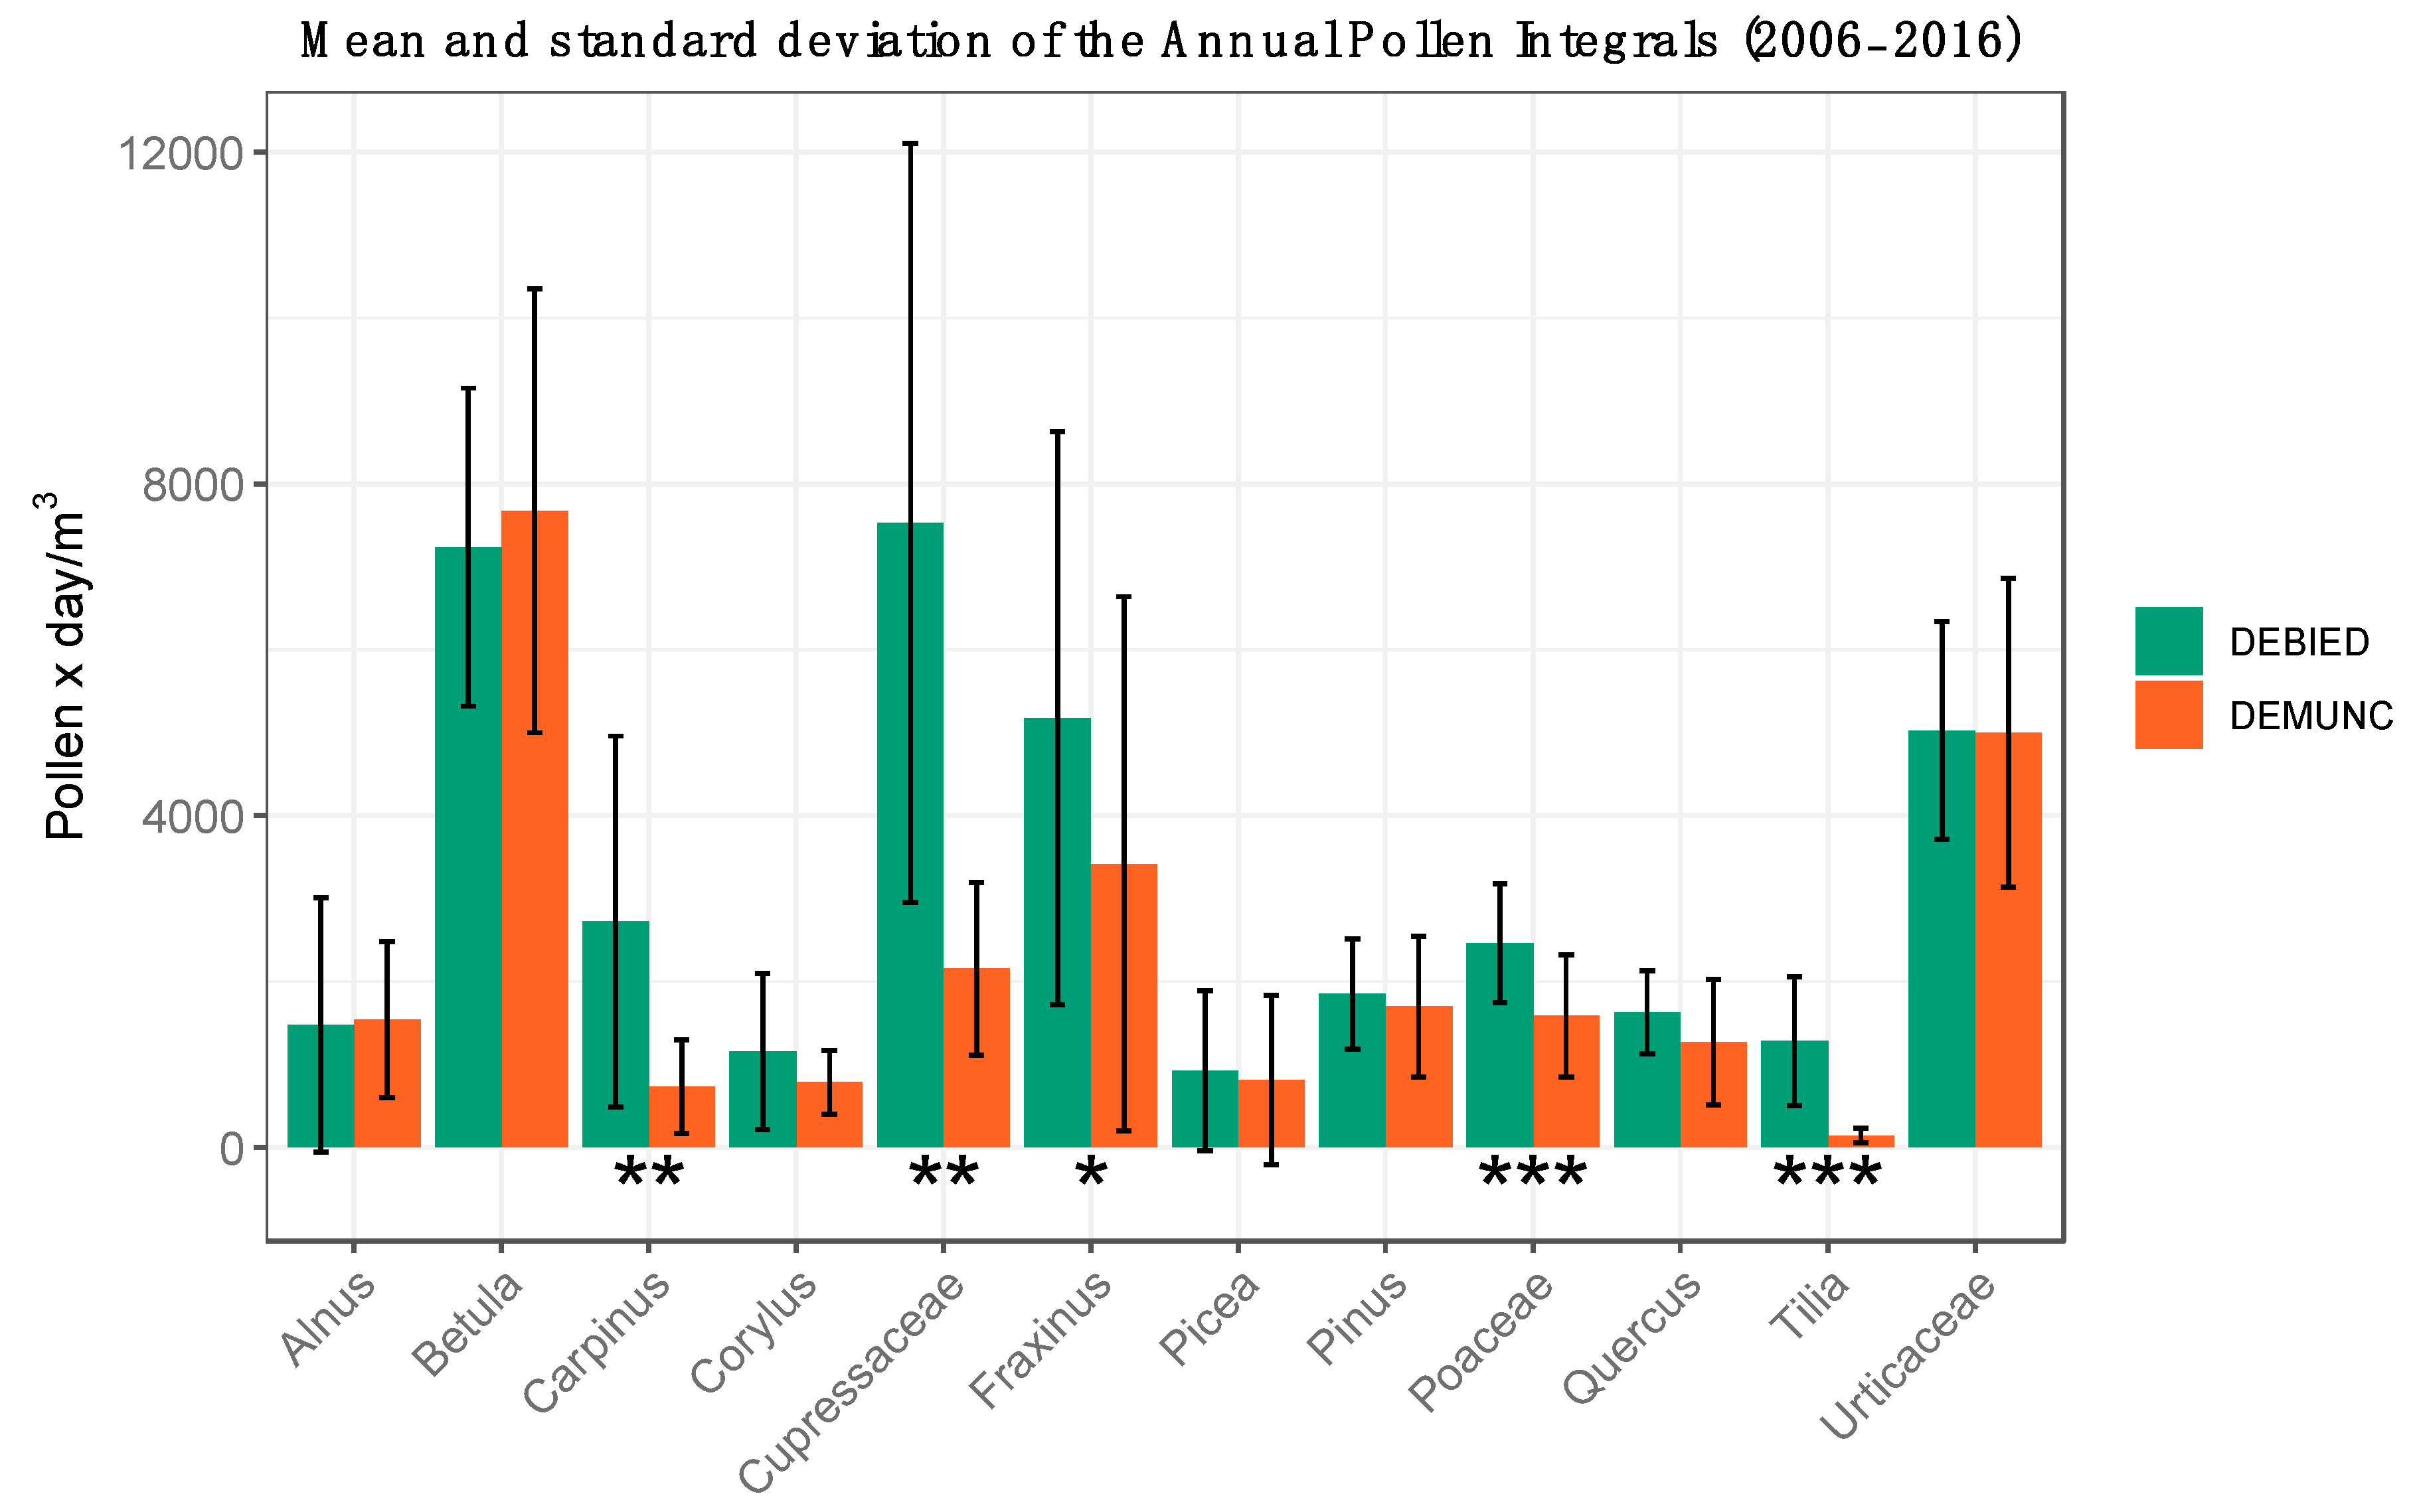
The abundance of the pollen types in the air varies with the height of sampling (Δheight = 33 m), but also on the distance between pollen traps (Δdistance = 4.2 km) and the differences of the distribution of the nearest pollen sources. The annual contribution from each pollen type to the Annual Pollen Integral is given in Figure 4. Again, the highest APIs were recorded at DEBIED (2 m AGL). However, due to the limited effect of height on pollen sampling [29], no large differences were observed and there were only relevant differences for Cupressaceae/Taxaceae, Carpinus and Tilia. This was more likely to be caused by the distribution of the pollen sources rather than differences in height above ground level [38,39,40]. These three pollen types together with Poaceae and Fraxinus showed significant differences between both pollen traps (paired Student t-test; p < 0.05).
The pollen types showing the largest differences represented pollen coming from abundant plants in the local green zones surrounding the pollen traps of Munich [6]. Indeed, species such as Taxus baccata L. (Cupressaceae/Taxaceae type) and Carpinus betulus L. (Carpinus type) were commonly planted in hedges in urban green zones in the surroundings of Biedersteiner Street. Hedges close to the building of the Zentrum Allergie & Umwelt (ZAUM), where the DEBIED trap was located, were dominated by these woody species. In addition, in the gardens of the Zentrum Allergie und Umwelt (ZAUM) in Biedersteiner Street species of the genus Tilia (Tilia cordata Mill., Tilia platyphyllos Scop.) were very common. Gonzalo-Garijo et al. [22] analyzed spatial variations in airborne pollen at different urban locations, and also observed differences in concentrations of pollen from different ornamental species distributed throughout the urban green spaces of the cities.
In our study, Poaceae pollen also showed significant differences between both pollen traps according to the annual pollen integral. These differences could be explained by a combination of the height effect and the configuration of sources, as the DEBIED pollen trap is located at ground level in a garden in close contact with grasses. In an experiment where Ambrosia pollen were collected over an artificially created source, Šikoparija et al. [25] found several orders of magnitude more pollen at ground level. This suggests that the effect of height on pollen concentrations is enhanced when the main pollen sources are located in direct contact to the sampling station [41].
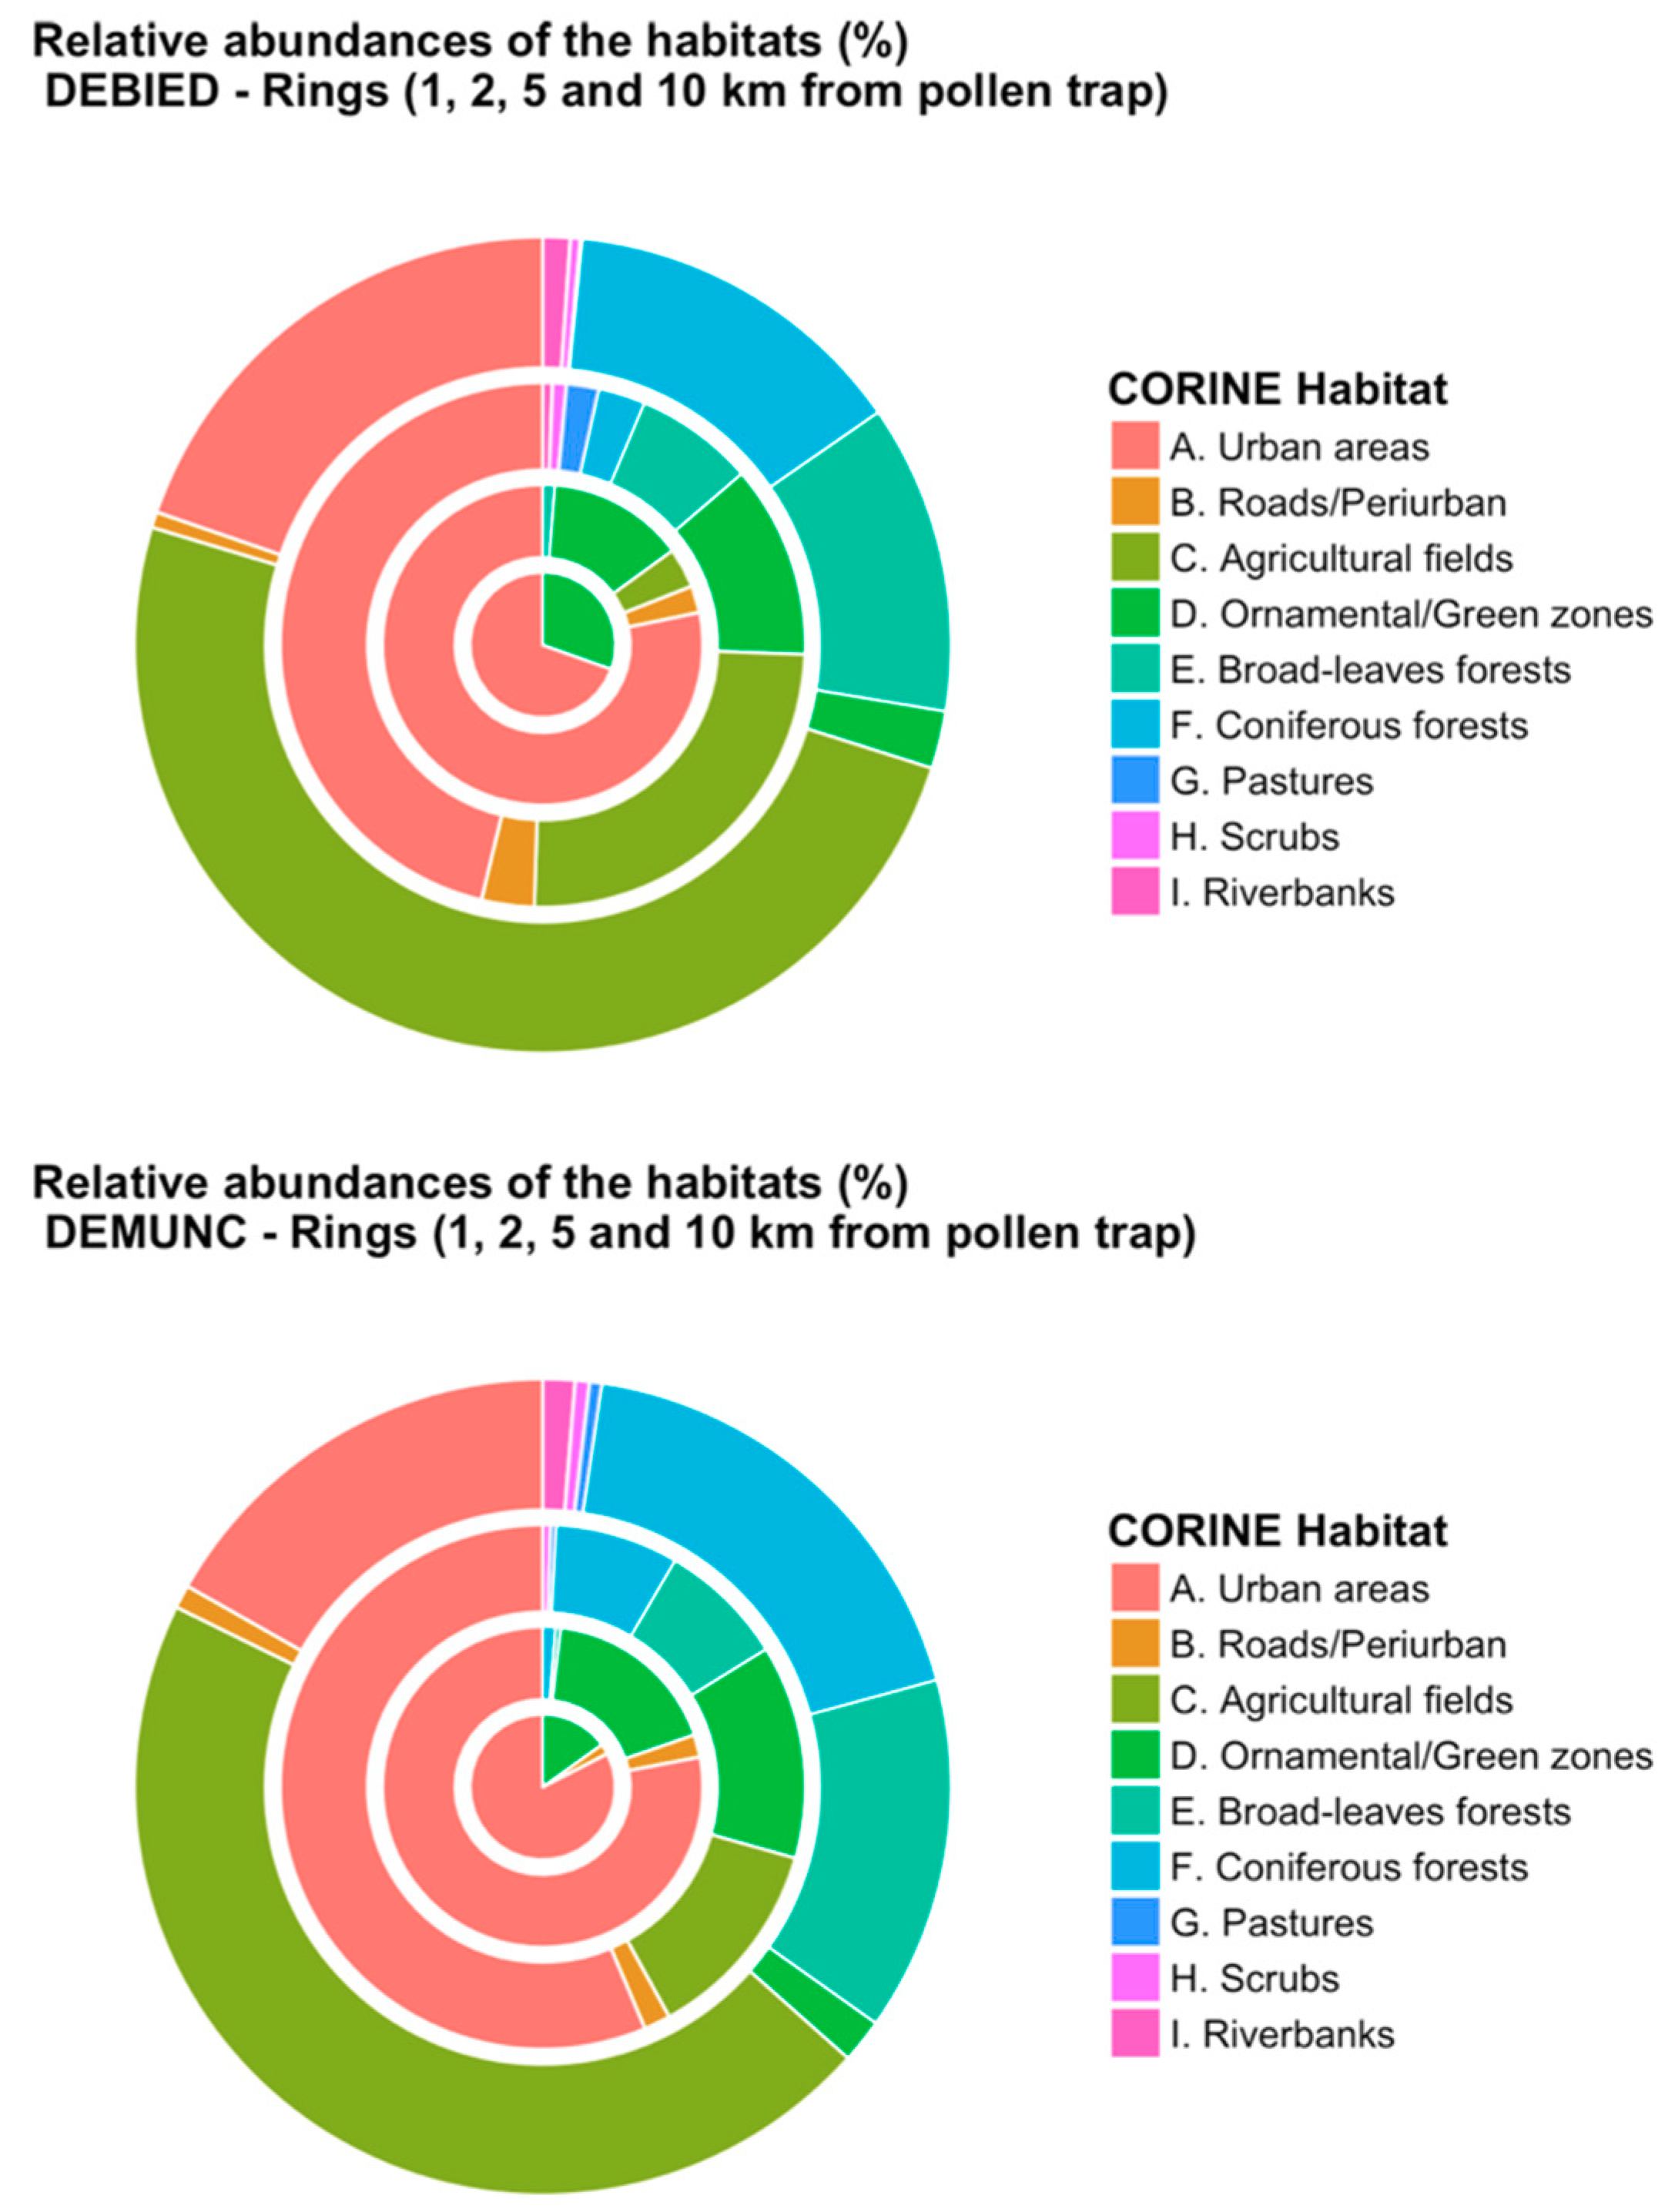
To better understand the effect of local sources on the pollen content in the air, we analyzed the abundance of the potential pollen sources surrounding the pollen traps. Figure 5 represents the relative abundance (% of the total) of the main habitats (artificial land uses and vegetation) surrounding both pollen traps, DEBIED and DEMUNC in Munich.
When considering a 1-km ring around the pollen traps (Figure 5), the surface of urban green zones around the pollen monitoring station DEBIED (30% of the total) was greater than the surface around DEMUNC (15% of the total). Furthermore, the surface of surrounding urbanized areas was greater for the DEMUNC pollen trap, which implies lower amounts of pollen [42]. This could be the explanation for the significant differences for the pollen amounts from woody taxa such as Cupressaceae/Taxaceae and Carpinus. In contrast, other pollen types such as Betula, Alnus, Picea, Quercus and Pinus, whose major pollen amounts came from outside of the city did not show significant differences [22,43]. Species belonging to these genera are frequently planted as ornamental plants in urban green zones. However, these anemophilous trees are also commonly found in forested areas surrounding Central European cities and as such it is likely that the majority of airborne pollen from these species recorded in Munich come from outside of the city [44,45]. It has also been shown that different levels of urbanization lead to differences in airborne pollen levels, with the lowest pollen concentrations generally registered in the most urban sites following an urban–rural gradient [42,46,47]. A better knowledge of this effect could be achieved by studying the local vegetation around the pollen traps in Munich in a more detailed way [12,48].
The effect of local sources, as shown in our study, is enhanced by the location of the DEBIED trap at ground level [25]. This is because pollen traps at roof level sample in more homogeneous conditions and thus deliver more representative measurements of pollen from the surrounding area [29,30]. As a result, the recommended minimum height for placing a pollen sampler is at least 10 m above ground level [29].

3.3. Comparison of the Daily Pollen Concentrations

Daily pollen concentrations of the most abundant pollen types in Munich were compared between the pollen traps DEBIED and DEMUNC, see Table 1. In agreement with the previous results about the annual pollen integrals (Figure 4), the regression slope was generally near to the ideal fit (slope = 1) for Betula, Urticaceae, Quercus and Pinus. However, for Cupressaceae, Carpinus, Corylus or Tilia, the regression slope tended toward the DEBIED trap, i.e. DEBIED registered higher amounts of pollen than the DEMUNC trap for all years (Table 1 and Supplementary Material).
Another important parameter was the dispersion of the data (coefficient of determination) of the regression between both traps (Table 1). Pollen types such as Betula, Fraxinus, Pinus and Quercus had the highest coefficients of determination, which can be related to the same sources emitting the collected pollen [43]. In these cases, background pollen in the city of Munich contributed more than local sources [41]. The amount of pollen collected by both pollen traps was similar (higher R2) when the most abundant pollen sources were located several kilometers away from the traps, i.e. pollen coming from outside of the city [22]. This fact can be observed in surfaces of broad-leaved and coniferous forests, which are similar for the 5-km and 10-km rings from the pollen traps (Figure 5). However, lower R2 were seen for the woody taxa Carpinus, Cupressaceae/Taxaceae, Picea or Tilia.
On the other hand, meteorological conditions influenced daily pollen concentrations during the season, particularly wind patterns (i.e., with respect to the distribution of the pollen sources) and rainfall [4,49]. Pollen types such as Betula, Pinus and Quercus that are, in general, similar between DEBIED and DEMUNC recorded higher pollen concentrations in the higher trap in some years (e.g., 2007, 2012, Supplementary Materials) thereby providing evidence of dispersal and transport processes in the atmosphere [50,51].
In the case of herbaceous pollen types, Urticaceae showed a slope relatively near to 1 (data comparable between traps) (Table 1), although a low R2 (Table 1). Poaceae showed important differences between pollen traps (slope < 1, the highest pollen concentrations were collected by the trap located at lower height), and very variable data (low R2, Table 1). This different behavior according to the pollen type can be related to the dispersal capacity of the pollen grain and the local distribution of the main pollen sources [52,53]. Peel et al. [54] also found different daily patterns for grass pollen in several locations within a city, and even different intradiurnal emission patterns depending on the distribution of the pollen sources [40].

3.4. Comparison of the Phenological Metrics

The results of the timing of the start and end of the pollen season for the main pollen types showed that dates were similar for both pollen stations, see Table 2. With respect to the start date of the pollen season, only Tilia showed significant differences between both pollen traps (Table 2). The Tilia pollen season in the higher station (DEMUNC) began earlier than the lower station (DEBIED). In the same manner, the Tilia pollen season finished later in the lower station (DEBIED) (Figure 6), due to more Tilia trees surrounding DEBIED. It is possible that part of the pollen collected in the higher station came from different sources that flowered earlier. Makra et al. [50] analyzed different patterns in airborne pollen in relation to the sources of the largest amounts of pollen. The origin of the pollen collected by a trap was determined by the distance from the local sources but also the circulation patterns of air masses favoring pollen transport [43,51].
Other pollen types showing significant differences in the end date of the pollen season were Alnus, Cupressaceae/Taxaceae, Pinus and Quercus (Table 2, Figure 6). All these pollen types showed that, in general, the pollen season finished later in the lower station (DEBIED). This fact could also be due to the process of resuspension of particles at the end of the pollen season [55,56]. This process produces recirculation in the atmosphere of previously sedimented pollen grains, and these pollen grains could be too few to reach higher heights in the atmosphere. Thus, the period of pollen emission is possibly shorter than the period including resuspension, but during the resuspension period the pollen intensity is lower [57]. Some peaks, however, could also be due to the pollination of other later-flowering species belonging to the same taxonomic group.
For example, in Figure 7 we observed that several pollen concentrations were collected at ground level (DEBIED trap) during the days near the end of the pollen season. These peaks were not observed (or almost not observed) on the rooftop (DEMUNC trap). This late sampling in DEBIED occurred for Alnus, Cupressaceae/Taxaceae, Pinus, Quercus and Tilia pollen and was significantly different from the end date of the pollen season in DEMUNC (Table 2).

4. Conclusions

In general, higher annual pollen amounts were registered by the pollen station located at a lower height (DEBIED). However, this effect was rather limited (i.e., 1.4 ± 0.5), meaning that this pollen trap measures about 40% more pollen. If a linear relationship between height and airborne pollen concentrations exist, then we would have expected greater amounts of pollen and phenological differences in DEBIED. However, a linear relationship does not exist above a certain height, as documented in recent literature. Also, major differences in pollen concentration would be expected because of the relatively large distance between both pollen stations (4.2 km between traps). However, differences were only reported for pollen types with major pollen sources inside of the city. These differences were enhanced by the location of one pollen trap <10 m AGL (DEBIED), which is less than the recommended minimum height for trap location.
Airborne pollen from woody trees such as Alnus, Betula, Corylus, Fraxinus, Picea, Pinus and Quercus, and the herbaceous pollen type Urticaceae showed good agreement between both traps for timing and intensity. The measurements of these pollen types from both pollen traps can therefore be used for an alert system for allergenic pollen. Most of the measured pollen for these taxa were background levels originating from outside the city of Munich. On the other hand, pollen types which showed the most significant differences regarding phenology and pollen intensity were Cupressaceae/Taxaceae, Carpinus, Tilia and Poaceae. Here, local sources of these pollen types were relevant in Munich, especially when the sampler was located at ground level. Although most allergic individuals are exposed at ground level, the best measurements for allergological purposes come from a station located at rooftop height as the measurement from the lower stations are more strongly influenced by nearby sources. Thus, measurements from higher stations provide background pollen levels representative of large areas, to which local sources add additional and more variable pollen amounts.

Supplementary Materials

The following are available online at https://www.mdpi.com/2073-4433/11/2/145/s1, Figures S1–S12 showing the daily concentrations to compare concentrations between both traps DEBIED vs. DEMUNC, and the Figures S13–S24 showing the phenological amplitude for both traps year-to-year.

Author Contributions

Conceptualization, J.R., J.O., A.P. & J.B.; methodology, J.R.; software, J.R., J.O. & A.P.; validation, J.R.; formal analysis, J.R. & J.O.; investigation, J.R. & J.B.; resources, F.R., B.W., M.W. K.-C.B. & J.B.; data curation, J.R., A.P., F.R., B.W., M.W. & K.-C.B.; writing—original draft preparation, J.R.; writing—review and editing, B.W., M.W. & J.B.; visualization, J.R.; supervision, C.B.S.-W. & J.B.; project administration, K.-C.B., C.B.S.-W. & J.B.; funding acquisition, K.-C.B., C.B.S.-W. & J.B. All authors have read and agreed to the published version of the manuscript.

Funding

This research was funded by the Bavarian State Ministry of Health grant G47-G8180.1-2014/5-5 and the Bavarian State Ministry of the Environment and Consumer Protection. Project TKP01KPB-73815.

Acknowledgments

We thank the ZAUM team of pollen analysts: Elke Bartusel, Katherina Bartusel, Cordula Ebner v. Eschenbach, Christine Weil, Renate Ostner, Norbert Ertl and Gudrun Pusch, and the PID team: Ankica Versec and Sonja Gaßner. For the IT support we thank Stephan Hachinger (Leibnitz Rechenzentrum) and Robert Gebauer (external IT specialist). Antonio Picornell was supported by a predoctoral grant financed by the Ministry of Education, Culture and Sport of Spain, in the Program for the Promotion of Talent and its Employability (FPU15/ 01668).

Conflicts of Interest

The authors declare no conflict of interest.

References

  1. Katelaris, C.H.; Beggs, P.J. Climate change: allergens and allergic diseases. Intern. Med. J. 2018, 48, 129–134. [Google Scholar] [CrossRef] [PubMed] [Green Version]
  2. Werchan, B.; Werchan, M.; Mücke, H.-G.; Bergmann, K.-C. Spatial distribution of pollen-induced symptoms within a large metropolitan area—Berlin, Germany. Aerobiologia 2018, 34, 539–556. [Google Scholar] [CrossRef]
  3. Rojo, J.; Rapp, A.; Lara, B.; Fernández-González, F.; Pérez-Badia, R. Effect of land uses and wind direction on the contribution of local sources to airborne pollen. Sci. Total Environ. 2015, 538, 672–682. [Google Scholar] [CrossRef] [PubMed]
  4. Maya-Manzano, J.M.; Sadyś, M.; Tormo-Molina, R.; Fernández-Rodríguez, S.; Oteros, J.; Silva-Palacios, I.; Gonzalo-Garijo, A. Relationships between airborne pollen grains, wind direction and land cover using GIS and circular statistics. Sci. Total Environ. 2017, 584, 603–613. [Google Scholar] [CrossRef] [PubMed]
  5. Alcázar, P.; Cariñanos, P.; De Castro, C.; Guerra, F.; Moreno, C.; Domínguez-Vilches, E.; Galán, C. Airbone plane-tree (Platanus hispanica) pollen distribution in the city of Cordoba, South-western Spain, and possible implications on pollen allergy. J. Investig. Allergol. Clin. Immunol. 2004, 14, 238–243. [Google Scholar]
  6. Cariñanos, P.; Casares-Porcel, M. Urban green zones and related pollen allergy: A review. Some guidelines for designing spaces with low allergy impact. Landsc. Urban Plan. 2011, 101, 205–214. [Google Scholar] [CrossRef]
  7. Picornell, A.; Oteros, J.; Trigo, M.M.; Gharbi, D.; Docampo Fernández, S.; Melgar Caballero, M.; Toro, F.J.; García-Sánchez, J.; Ruiz-Mata, R.; Cabezudo, B.; et al. Increasing resolution of airborne pollen forecasting at a discrete sampled area in the southwest Mediterranean Basin. Chemosphere 2019, 234, 668–681. [Google Scholar] [CrossRef]
  8. Cariñanos, P.; Adinolfi, C.; Díaz de la Guardia, C.; De Linares, C.; Casares-Porcel, M. Characterization of allergen emission sources in urban areas. J. Environ. Qual. 2016, 45, 244. [Google Scholar] [CrossRef]
  9. Ørby, P.V.; Peel, R.G.; Skjøth, C.; Schlünssen, V.; Bønløkke, J.H.; Ellermann, T.; Brændholt, A.; Sigsgaard, T.; Hertel, O. An assessment of the potential for co-exposure to allergenic pollen and air pollution in Copenhagen, Denmark. Urban Climate 2015, 14, 457–474. [Google Scholar] [CrossRef]
  10. Ribeiro, H.; Costa, C.; Abreu, I.; Esteves da Silva, J.C.G. Effect of O3 and NO2 atmospheric pollutants on Platanus x acerifolia pollen: Immunochemical and spectroscopic analysis. Sci. Total Environ. 2017, 599, 291–297. [Google Scholar] [CrossRef]
  11. Frank, U.; Ernst, D. Effects of NO2 and Ozone on pollen allergenicity. Front. Plant Sci. 2016, 7, 91. [Google Scholar] [CrossRef] [PubMed]
  12. Cariñanos, P.; Casares-Porcel, M.; Díaz de la Guardia, C.; Aira, M.J.; Belmonte, J.; Boi, M.; Elvira-Rendueles, B.; De Linares, C.; Fernández-Rodriguez, S.; Maya-Manzano, J.M.; et al. Assessing allergenicity in urban parks: A nature-based solution to reduce the impact on public health. Environ. Res. 2017, 155, 219–227. [Google Scholar] [CrossRef] [PubMed]
  13. Patella, V.; Florio, G.; Magliacane, D.; Giuliano, A.; Russo, L.F.; D’Amato, V.; De Luca, V.; Iaccarino, G.; Illario, M.; Bousquet, J. Public prevention plans to manage climate change and respiratory allergic diseases. Innovative models used in campania region (Italy): The twinning aria implementation and the allergy safe tree decalogue. Transl. Med. UniSa. 2019, 19, 95–102. [Google Scholar] [PubMed]
  14. Akdis, C.A.; Helling, P.W.; Agache, I. (Eds.) Global Atlas of Allergic Rhinitis and Chronic Rhinosinusitis; European Academy of Allergy and Clinical Immunology: Zurich, Switzerland, 2015. [Google Scholar]
  15. Haftenberger, M.; Laußmann, D.; Ellert, U.; Kalcklösch, M.; Langen, U.; Schlaud, M.; Schmitz, R.; Thamm, M. Prevalence of sensitisation to aeroallergens and food allergens: Results of the German Health Interview and Examination Survey for Adults (DEGS1). Bundesgesundheitsbl 2013, 56, 687–697. [Google Scholar] [CrossRef] [Green Version]
  16. Picornell, A.; Buters, J.; Rojo, J.; Traidl-Hoffmann, C.; Menzel, A.; Bergmann, K.C.; Werchan, M.; Schmidt-Weber, C.; Oteros, J. Predicting the start, peak and end of the Betula pollen season in Bavaria, Germany. Sci. Total Environ. 2019, 690, 1299–1309. [Google Scholar] [CrossRef]
  17. Geller-Bernstein, C.; Portnoy, J.M. The clinical utility of pollen counts. Clinic. Rev. Allerg. Immunol. 2019, 57, 340–349. [Google Scholar] [CrossRef]
  18. Kmenta, M.; Bastl, K.; Jäger, S.; Berger, U. Development of personal pollen information—the next generation of pollen information and a step forward for hay fever sufferers. Int. J. Biometeorol. 2014, 58, 1721–1726. [Google Scholar] [CrossRef]
  19. Buters, J.T.M.; Antunes, C.; Galveias, A.; Bergmann, K.C.; Thibaudon, M.; Galán, C.; Schmidt-Weber, C.; Oteros, J. Pollen and spore monitoring in the world. Clinic. Transl. Allergy 2018, 8, 9. [Google Scholar] [CrossRef]
  20. Oteros, J.; Sofiev, M.; Smith, M.; Clot, B.; Damialis, A.; Prank, M.; Werchan, M.; Wachter, R.; Weber, A.; Kutzora, S.; et al. Building an automatic pollen monitoring network (ePIN): Selection of optimal sites by clustering pollen stations. Sci. Total Environ. 2019, 688, 1263–1274. [Google Scholar] [CrossRef]
  21. Werchan, B.; Werchan, M.; Mücke, H.-G.; Gauger, U.; Simoleit, A.; Zuberbier, T.; Bergmann, K.-C. Spatial distribution of allergenic pollen through a large metropolitan area. Environ. Monitor. Assess. 2017, 189, 169. [Google Scholar] [CrossRef]
  22. Gonzalo-Garijo, M.A.; Tormo-Molina, R.; Muñoz-Rodríguez, A.F.; Silva-Palacios, I. Differences in the spatial distribution of airborne pollen concentrations at different urban locations within a city. J. Investig. Allerg. Clin. Immunol. 2006, 16, 37. [Google Scholar]
  23. Oteros, J.; Valencia, R.M.; Del Río, S.; Vega, A.M.; García-Mozo, H.; Galán, C.; Gutiérrez, P.; Mandrioli, P.; Fernández-González, D. Concentric Ring Method for generating pollen maps. Quercus as case study. Sci. Total Environ. 2017, 576, 637–645. [Google Scholar] [CrossRef] [PubMed]
  24. Velasco-Jiménez, M.J.; Alcázar, P.; Domínguez-Vilches, E.; Galán, C. Comparative study of airborne pollen counts located in different areas of the city of Córdoba (south-western Spain). Aerobiologia 2013, 29, 113–120. [Google Scholar] [CrossRef]
  25. Šikoparija, B.; Mimić, G.; Panić, M.; Marko, O.; Radišić, P.; Pejak-Šikoparija, T.; Pauling, A. High temporal resolution of airborne Ambrosia pollen measurements above the source reveals emission characteristics. Atmos. Environ. 2018, 193, 13–23. [Google Scholar] [CrossRef]
  26. Fernández-Rodríguez, S.; Cortés-Pérez, J.P.; Muriel, P.P.; Tormo-Molina, R.; Maya-Manzano, J.M. Environmental impact assessment of Pinaceae airborne pollen and green infrastructure using BIM. Autom. Constr. 2018, 96, 494–507. [Google Scholar] [CrossRef]
  27. Salmond, J.A.; Williams, D.E.; Laing, G.; Kingham, S.; Dirks, K.; Longley, I.; Henshaw, G.S. The influence of vegetation on the horizontal and vertical distribution of pollutants in a street canyon. Sci. Total Environ. 2013, 443, 287–298. [Google Scholar] [CrossRef]
  28. Peel, R.G.; Kennedy, R.; Smith, M.; Hertel, O. Do urban canyons influence street level grass pollen concentrations? Int. J. Biometeorol. 2014, 58, 1317–1325. [Google Scholar] [CrossRef]
  29. Rojo, J.; Oteros, J.; Pérez-Badia, R.; Cervigón, P.; Ferencova, Z.; Gutiérrez-Bustillo, A.M.; Bergmann, K.-C.; Oliver, G.; Thibaudon, M.; Albertini, R.; et al. Near-ground effect of height on pollen exposure. Environ. Res. 2019, 174, 160–169. [Google Scholar] [CrossRef]
  30. Galán, C.; Smith, M.; Thibaudon, M.; Frenguelli, G.; Oteros, J.; Gehrig, R.; Berger, U.; Clot, B.; Brandao, R. EAS QC Working Group Pollen monitoring: minimum requirements and reproducibility of analysis. Aerobiologia 2014, 30, 385–395. [Google Scholar] [CrossRef]
  31. Smith, M.; Oteros, J.; Schmidt-Weber, C.; Buters, J.T.M. An abbreviated method for the quality control of pollen counters. Grana 2019, 58, 185–190. [Google Scholar] [CrossRef]
  32. Devadas, R.; Huete, A.R.; Vicendese, D.; Erbas, B.; Beggs, P.J.; Medek, D.; Haberle, S.G.; Newnham, R.M.; Johnston, F.H.; Jaggard, A.K.; et al. Dynamic ecological observations from satellites inform aerobiology of allergenic grass pollen. Sci. Total Environ. 2018, 633, 441–451. [Google Scholar] [CrossRef]
  33. Andersen, T.B. A model to predict the beginning of the pollen season. Grana 1991, 30, 269–275. [Google Scholar] [CrossRef] [Green Version]
  34. Pérez-Badia, R.; Rapp, A.; Morales, C.; Sardinero, S.; Galán, C.; García-Mozo, H. Pollen spectrum and risk of pollen allergy in central Spain. Ann. Agric. Environ. Med. 2010, 17, 139–151. [Google Scholar]
  35. Rojo, J.; Picornell, A.; Oteros, J. AeRobiology: The computational tool for biological data in the air. Methods. Ecol. Evol. 2019, 10, 1371–1376. [Google Scholar] [CrossRef] [Green Version]
  36. Buters, J.; Prank, M.; Sofiev, M.; Pusch, G.; Albertini, R.; Annesi-Maesano, I.; Antunes, C.; Behrendt, H.; Berger, U.; Brandao, R.; et al. Variation of the group 5 grass pollen allergen content of airborne pollen in relation to geographic location and time in season. J. Allergy Clin. Immunol. 2015, 136, 87–95. [Google Scholar] [CrossRef]
  37. Šikoparija, B.; Galán, C.; Smith, M. EAS QC Working Group Pollen-monitoring: between analyst proficiency testing. Aerobiologia 2017, 33, 191–199. [Google Scholar] [CrossRef]
  38. Borycka, K.; Kasprzyk, I. Hourly pattern of allergenic alder and birch pollen concentrations in the air: Spatial differentiation and the effect of meteorological conditions. Atmos. Environ. 2018, 182, 179–192. [Google Scholar] [CrossRef]
  39. Alcázar, P.; Ørby, P.V.; Oteros, J.; Skjøth, C.; Hertel, O.; Galán, C. Cluster analysis of variations in the diurnal pattern of grass pollen concentrations in Northern Europe (Copenhagen) and Southern Europe (Cordoba). Aerobiologia 2019, 35, 269–281. [Google Scholar] [CrossRef]
  40. Skjøth, C.A.; Ørby, P.V.; Becker, T.; Geels, C.; Schlünssen, V.; Sigsgaard, T.; Bønløkke, J.H.; Sommer, J.; Søgaard, P.; Hertel, O. Identifying urban sources as cause of elevated grass pollen concentrations using GIS and remote sensing. Biogeosciences 2013, 10, 541–554. [Google Scholar] [CrossRef] [Green Version]
  41. Peel, R.G.; Hertel, O.; Smith, M.; Kennedy, R. Personal exposure to grass pollen: relating inhaled dose to background concentration. Ann. Allergy Asthma Immunol. 2013, 111, 548–554. [Google Scholar] [CrossRef]
  42. Hugg, T.T.; Hjort, J.; Antikainen, H.; Rusanen, J.; Tuokila, M.; Korkonen, S.; Weckström, J.; Jaakkola, M.S.; Jaakkola, J.J.K. Urbanity as a determinant of exposure to grass pollen in Helsinki Metropolitan area, Finland. PLOS ONE 2017, 12, e0186348. [Google Scholar] [CrossRef] [PubMed]
  43. Skjøth, C.A.; Baker, P.; Sadyś, M.; Adams-Groom, B. Pollen from alder (Alnus sp.), birch (Betula sp.) and oak (Quercus sp.) in the UK originate from small woodlands. Urban Climate 2015, 14, 414–428. [Google Scholar] [CrossRef]
  44. Adams-Groom, B.; Skjøth, C.A.; Baker, M.; Welch, T.E. Modelled and observed surface soil pollen deposition distance curves for isolated trees of Carpinus betulus, Cedrus atlantica, Juglans nigra and Platanus acerifolia. Aerobiologia 2017, 33, 407–416. [Google Scholar] [CrossRef]
  45. Bricchi, E.; Frenguelli, G.; Mincigrucci, G. Experimental results about Platanus pollen deposition. Aerobiologia 2000, 16, 347–352. [Google Scholar] [CrossRef]
  46. Bosch-Cano, F.; Bernard, N.; Sudre, B.; Gillet, F.; Thibaudon, M.; Richard, H.; Badot, P.-M.; Ruffaldi, P. Human exposure to allergenic pollens: A comparison between urban and rural areas. Environ. Res. 2011, 111, 619–625. [Google Scholar] [CrossRef] [PubMed] [Green Version]
  47. Kruczek, A.; Puc, M.; Wolski, T. Airborne pollen from allergenic herbaceous plants in urban and rural areas of Western Pomerania, NW Poland. Grana 2016, 56, 71–80. [Google Scholar] [CrossRef]
  48. Maya-Manzano, J.M.; Tormo Molina, R.; Fernández Rodríguez, S.; Silva Palacios, I.; Gonzalo Garijo, Á. Distribution of ornamental urban trees and their influence on airborne pollen in the SW of Iberian Peninsula. Landsc. Urban Plan. 2017, 157, 434–446. [Google Scholar] [CrossRef]
  49. Pérez, C.F.; Gassmann, M.I.; Covi, M. An evaluation of the airborne pollen–precipitation relationship with the superposed epoch method. Aerobiologia 2009, 25, 313–320. [Google Scholar] [CrossRef]
  50. Makra, L.; Santa, T.; Matyasovszky, I.; Damialis, A.; Karatzas, K.; Bergmann, K.-C.; Vokou, D. Airborne pollen in three European cities: Detection of atmospheric circulation pathways by applying three-dimensional clustering of backward trajectories. J. Geophys. Res.-Atmos. 2010, 115, D24220. [Google Scholar] [CrossRef] [Green Version]
  51. Bogawski, P.; Borycka, K.; Grewling, Ł.; Kasprzyk, I. Detecting distant sources of airborne pollen for Poland: Integrating back-trajectory and dispersion modelling with a satellite-based phenology. Sci. Total Environ. 2019, 689, 109–125. [Google Scholar] [CrossRef]
  52. Di-Giovanni, F.; Kevan, P.G. Factors affecting pollen dynamics and its importance to pollen contamination: A review. Can. J. For. Res. 1991, 21, 1155–1170. [Google Scholar] [CrossRef]
  53. Romero-Morte, J.; Rojo, J.; Rivero, R.; Fernández-González, F.; Pérez-Badia, R. Standardised index for measuring atmospheric grass-pollen emission. Sci. Total Environ. 2018, 612, 180–191. [Google Scholar] [CrossRef] [PubMed]
  54. Peel, R.G.; Ørby, P.V.; Skjøth, C.A.; Kennedy, R.; Schlünssen, V.; Smith, M.; Sommer, J.; Hertel, O. Seasonal variation in diurnal atmospheric grass pollen concentration profiles. Biogeosciences 2014, 11, 821–832. [Google Scholar] [CrossRef] [Green Version]
  55. Sehmel, G.A. Particle resuspension: A review. Environ. Int. 1980, 4, 107–127. [Google Scholar] [CrossRef]
  56. Cai, T.; Zhang, Y.; Ren, X.; Bielory, L.; Mi, Z.; Nolte, C.G.; Gao, Y.; Leung, L.R.; Georgopoulos, P.G. Development of a semi-mechanistic allergenic pollen emission model. Sci. Total Environ. 2019, 653, 947–957. [Google Scholar] [CrossRef] [PubMed]
  57. Helbig, N.; Vogel, B.; Vogel, H.; Fiedler, F. Numerical modelling of pollen dispersion on the regional scale. Aerobiologia 2004, 20, 3–19. [Google Scholar] [CrossRef]
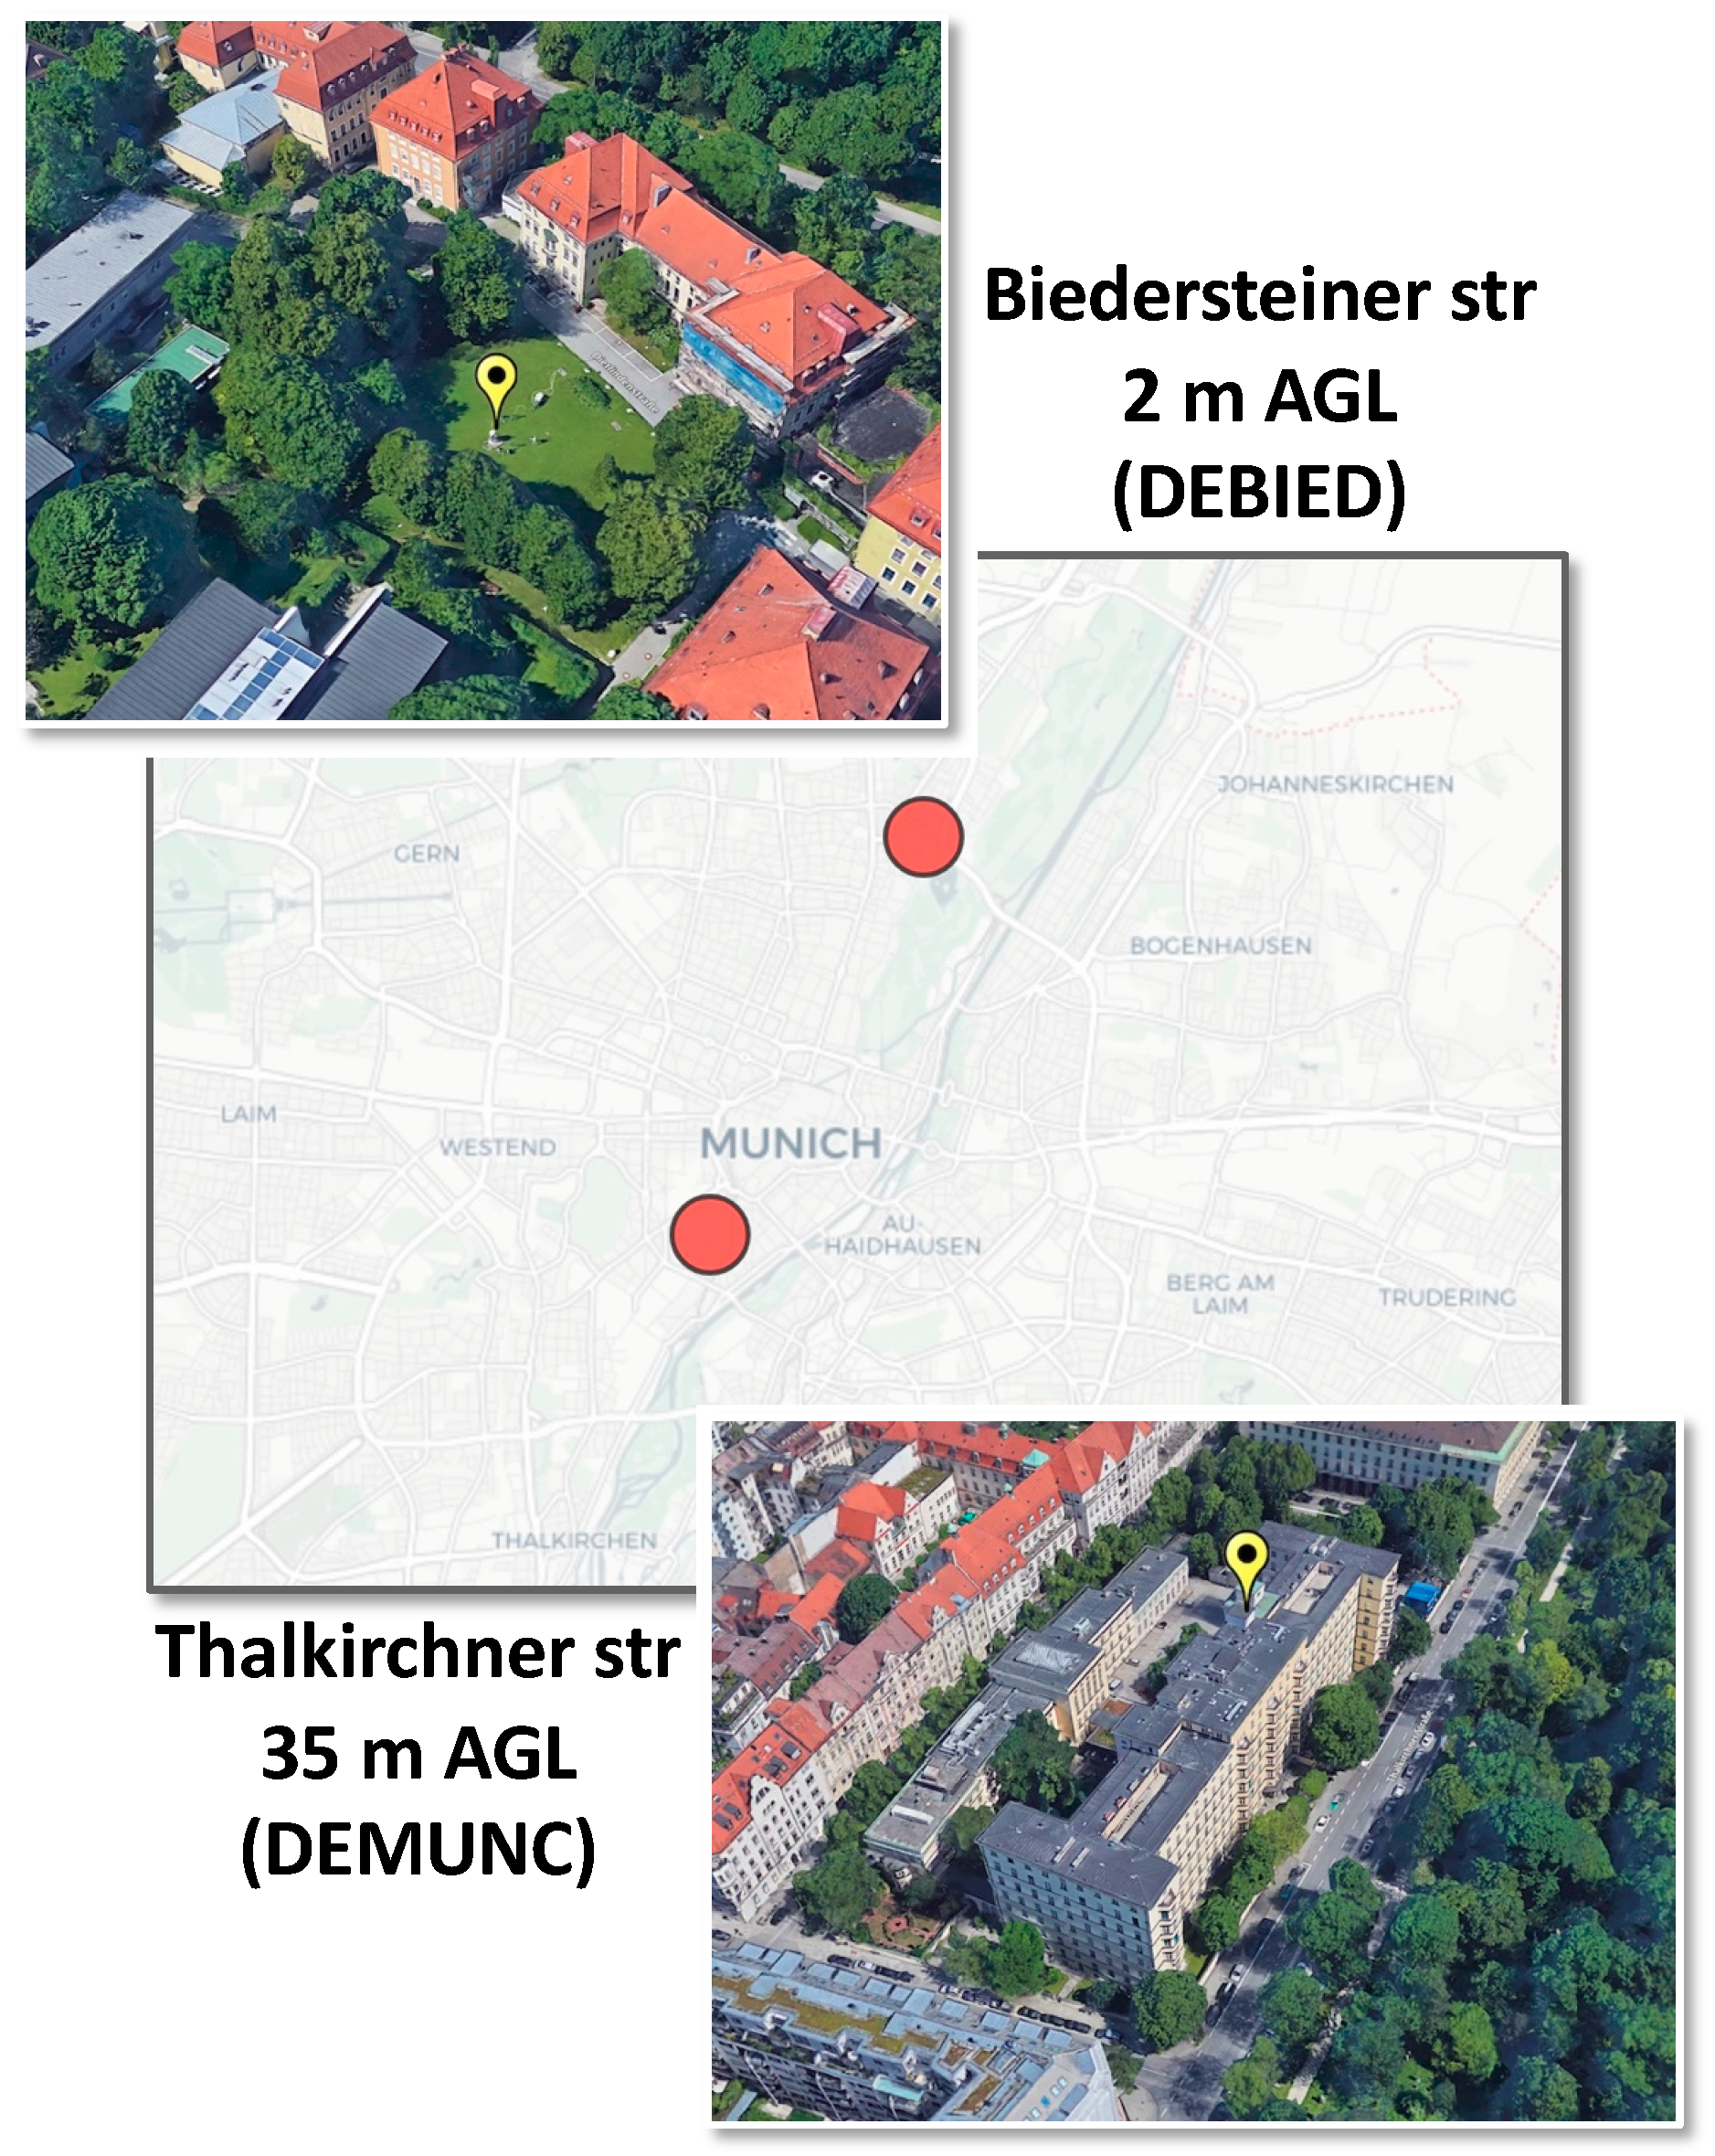
Figure 1. Geographical location of both pollen traps in the city of Munich, Germany (550 m above sea level (ASL)). Source: Google Earth, October 2019.
Atmosphere 11 00145 g001
Figure 2. Comparison of the annual total pollen integral with paired Student´s t-test statistic (A), and comparison of seasonal behavior of the total pollen (B), between both traps (DEBIED Biedersteiner street vs. DEMUNC Thalkirchner street in Munich, Germany) for 2006–2016.
Atmosphere 11 00145 g002
Figure 3. Relative abundance of pollen types in the air for the period 2006–2016.
Atmosphere 11 00145 g003
Figure 4. Annual pollen integral for each pollen type for the period 2006–2016 (mean and standard deviation). Comparison between both traps DEBIED vs. DEMUNC (2 m AGL and 35 m AGL, respectively). Significance level from the t-test: * p < 0.05; ** p < 0.01; *** p < 0.001.
Atmosphere 11 00145 g004
Figure 5. Relative abundance (%) of the pollen sources according to the CORINE land cover habitats, considering several rings at different distances around the pollen traps (1, 2, 5 and 10 km). Concentric ring graphs represented the abundance of the main land uses surrounding the stations.
Atmosphere 11 00145 g005
Figure 6. Phenological parameters (start and end date of the pollen season) for the main pollen types (period 2009–2016).
Atmosphere 11 00145 g006
Figure 7. Detailed comparison of the daily pollen concentrations of different woody types which showed significant differences in the pollen season between the traps. A larger number of pollen grains can be observed in the lower station (DEBIED) at the end of the pollen season, for example during the years 2011–2014.
Atmosphere 11 00145 g007
Table 1. Coefficients of determination (R2) and slopes (s) for the comparison of DEBIED vs. DEMUNC (regression with x = DEBIED and y = DEMUNC, i.e. when slope < 1 means that the lower station DEBIED collected more pollen than the higher station DEMUNC).
YearAlnu
(R2/s)
Betu
(R2/s)
Carp
(R2/s)
Cory
(R2/s)
Cupr
(R2/s)
Frax
(R2/s)
Pice
(R2/s)
Pinu
(R2/s)
Poac
(R2/s)
Quer
(R2/s)
Tili
(R2/s)
Urti
(R2/s)
2006-0.6/0.90.0/0.00.9/0.60.5/0.30.8/0.90.7/0.80.4/1.00.1/0.20.5/0.7-/0.30.3/1.0
2007-0.9/1.70.1/0.1-0.9/2.20.8/1.3-/1.40.3/0.60.6/0.70.7/1.3-/0.00.3/1.0
2008-0.9/1.4----0.0/0.00.2/0.50.1/0.20.3/0.3-0.2/0.5
20090.1/0.40.7/2.30.8/0.50.9/0.50.7/0.40.5/1.70.5/1.00.5/0.70.0/0.20.5/0.8-0.4/0.6
20100.2/0.30.9/0.9-/0.80.5/0.40.4/0.40.8/0.4-0.9/1.00.0/0.00.9/0.7-0.3/0.5
20110.7/0.50.7/0.60.0/0.00.5/0.40.5/0.20.8/0.5-/0.40.7/0.70.6/0.20.6/0.4-0.2/0.2
20120.4/0.20.6/1.00.6/-0.10.1/0.10.8/0.20.3/0.2-0.9/1.30.5/0.60.8/1.2-0.5/0.9
20130.6/0.50.9/1.30.3/0.20.8/0.30.5/0.20.9/0.80.6/0.70.7/0.90.4/0.50.9/1.2-/0.20.8/1.3
20140.7/1.30.8/1.00.0/0.10.4/0.70.6/0.10.5/0.80.2/0.60.7/0.80.6/0.80.2/0.30.2/0.00.3/0.8
20150.8/0.80.9/0.80.5/0.1-/1.20.3/0.20.9/0.61.0/0.90.6/0.51.0/0.50.8/1.40.1/0.00.6/0.8
20160.6/0.30.9/0.70.5/0.30.9/0.5-/0.10.7/0.6-/1.00.9/0.60.3/0.40.9/0.5-/0.00.5/0.9
Mean0.5/0.50.8/1.10.3/0.20.6/0.50.6/0.40.7/0.70.5/0.80.6/0.70.3/0.40.7/0.80.2/0.10.4/0.8
Pollen types: Alnu Alnus, Betu Betula, Carp Carpinus, Cory Corylus, Cupr Cupressaceae/Taxaceae, Frax Fraxinus, Pice Picea, Pinu Pinus, Poac Poaceae, Quer Quercus, Tili Tilia, Urti Urticaceae.
Table 2. Paired t-test for differences between both pollen traps (DEBIED vs. DEMUNC). Paired samples were compared year-to-year. Average start date and end date of years 2006–2016 ± SD and significance level from the t-test are given.
Pollen TypeStart Date
(DEBIED/DEMUNC)
End Date
(DEBIED/DEMUNC)
Alnus55.8 ± 13.6/47.1 ± 13.6 (n.s.)137.5 ± 34.1/88.5 ± 9.1 **
Betula96.5 ± 6.6/97.2 ± 6.3 (n.s.)121.1 ± 4.8/119.1 ± 7.5 (n.s.)
Carpinus95.1 ± 8.8/95.2 ± 8.8 (n.s.)114.0 ± 6.8/115.4 ± 9.2 (n.s.)
Corylus51.4 ± 17.4/43.5 ± 14.0 (n.s.)86.2 ± 6.7/119.9 ± 96.2 (n.s.)
Cupressaceae/Tax67.2 ± 15.9/68.4 ± 12.8 (n.s.)110.1 ± 6.0/104.1 ± 8.3 *
Fraxinus91.0 ± 8.6/92.1 ± 8.4 (n.s.)111.1 ± 6.9/114.6 ± 7.5 (n.s.)
Picea106.9 ± 23.0/117.9 ± 12.8 (n.s.)170.6 ± 43.1/186.1 ± 56.4 (n.s.)
Pinus125.6 ± 7.4/124.5 ± 7.4 (n.s.)178.6 ± 20.7/161.5 ± 10.9 *
Poaceae130.5 ± 5.9/126.1 ± 11.4 (n.s.)233.8 ± 10.9/232.8 ± 13.3 (n.s.)
Quercus103.4 ± 9.0/107.5 ± 8.6 (n.s.)140.0 ± 3.8/136.0 ± 5.6 *
Tilia170.6 ± 7.1/164.0 ± 5.6 *205.0 ± 9.0/196.8 ± 11.2 *
Urticaceae161.1 ± 4.0/165.5 ± 11.1 (n.s.)242.0 ± 4.8/241.8 ± 6.1 (n.s.)
Significance level: * p < 0.05; ** p < 0.01; n.s., non-significant.