Abstract
Concentrations of aerosol particles in Poland and their sources are rarely discussed in peer-reviewed journal articles despite serious air quality issues. A source apportionment of carbonaceous aerosol particles was performed during winter at a rural background environment field site in north-eastern Poland. Data were used of light absorption at seven wavelengths and levoglucosan concentrations along existing monitoring of PM2.5, organic carbon and elemental carbon (OC/EC) at the Diabła Góra EMEP monitoring site between January 17 and March 19 during the EMEP intensive winter campaign of 2018. Average PM2.5, OC, EC, equivalent black carbon (eBC) and levoglucosan concentrations and standard deviations amounted to 18.5 ± 9.3, 4.5 ± 2.5, 0.57 ± 0.28, 1.04 ± 0.62 and 0.134 ± 0.084 µg m−3 respectively. Various tools for source apportionment were used to obtain a source contribution to carbonaceous matter (CM) with three components. The wood combustion source component contributed 1.63 µg m−3 (21%), domestic coal combustion 3.3 µg m−3 (41%) and road transport exhaust 2.9 µg m−3 (38%). Similar levels and temporal variability were found for the nearby Lithuanian site of Preila, corroborating the Polish results.
Keywords:
source apportionment; aethalometer; AAE; OC/EC; levoglucosan; wood combustion; coal combustion; domestic; BC; PM2.5 1. Introduction
The annual excess mortality rate in Europe due to ambient air pollution has been estimated to be 790,000 [1]. Anthropogenic activities related to energy, heating and transport result in the release of air pollutants into the atmosphere. Air pollution from combustion sources includes particulate matter (PM), which spans a large range of sizes and physicochemical properties. Particle size is an important parameter for associated health effects, and combustion particles often have a diameter smaller than 2.5 µm (PM2.5), and most often even smaller than 1 µm (PM1). The fine particles penetrate deeper into the respiratory tract, and hence, have more adverse effects than coarse particles (diameter larger than 2.5 µm) [2,3,4,5]. Numerous studies have shown that both short- and long-term elevated concentrations of PM increase the risk of cardiovascular and respiratory diseases or lung cancer, e.g., [6,7,8]. Additionally, outdoor air pollution and its PM2.5 component has been classified as carcinogenic to humans [9]. A fraction of the PM from combustion sources consists of carbonaceous matter (CM), including organic matter (OM) and black carbon (BC). PM, and particularly CM, are detrimental for human health, and it has been discovered that the health effects of BC are more serious than for different PM fractions [10,11,12]. CM can be primary, i.e., emitted directly from a source, or secondary, e.g., through condensation of material formed from volatile organic compounds (VOCs) on the particles during atmospheric ageing. Traffic emissions contain a larger fraction of BC, while wood, or biomass, burning emissions also contain more organic materials such as aromatics, polycyclic aromatic hydrocarbons (PAH), and humic-like substances (HULIS) [13,14,15,16].
Carbonaceous aerosol, carbonaceous matter (CM) or total carbon (TC), is the fraction of the total aerosol mass which contains carbon, i.e., CM constitutes a large variety of molecules and structures. CM is divided into organic matter (OM), which consists of organic carbon (OC), and black carbon (BC) or elemental carbon (EC), depending on if the instrument is providing BC or EC as a measure for soot particles [17]. Simply described, the aerosol EC content is defined based on thermo-chemical properties (less susceptible to degradation than OC), and BC is defined based on optical properties (strong light absorption from ultraviolet to infrared) [18]. In this paper, both types of methodologies have been used, and therefore both EC and BC are presented. Since a mass absorption coefficient (MAC), is used to transform light absorption into an equivalent BC mass, the term equivalent black carbon (eBC) is used hereafter.
Source apportionment is a valuable tool for determining the impact of various aerosol sources at specific locations. By observing selected aerosol properties and connecting these to unique sources, one can apportion the contribution of these sources to air pollution at the measurement site. There are several different source apportionment methods, and in this paper we use the aerosol particles light absorption properties and the trace chemical levoglucosan, respectively, for the source apportionment of the carbonaceous aerosol.
An important parameter for light absorption properties of CM is the absorption Ångström exponent (AAE), which is used to describe the wavelength dependence of the light absorption coefficients. BC from fossil fuels and traffic emissions typically has an AAE close to 1, while higher AAEs are associated with OC containing aerosols from e.g., biomass burning emissions. Due to its strong UV absorption, these high AAE aerosols are often called brown carbon (BrC) [19]. By applying this difference in light absorption, biomass and fossil fuel aerosols can be distinguished. This has been done e.g., in the so called aethalometer model [20]. The appropriate AAE values for different sources have been studied extensively. The values reported differ, depending on source, location, and methods, but are generally in the range 0.7–1.1 for traffic, and 1.8-3.0 for biomass burning, e.g., [19,20,21,22,23]. Additionally, it has recently been shown that there is also a dependence of light absorption on combustion conditions in addition to source specificity [24,25,26]. For example, low values of AAE indicate efficient combustion with high temperatures and mixing ratios of oxygen in the combustion zone. Higher AAE indicates more influence of air starved conditions and lower combustion temperatures forming relatively more polycyclic aromatic hydrocarbon compounds (PAHs). A higher AAE gives a higher total light absorption of the aerosol particles [27].
In Poland, which is the focus of this study, an important emission source is coal combustion. There are few and scattered AAEs reported for coal in the literature. Coal-based thermal power plants in India have been associated with low values of AAE (around 1) [28,29], while in another study emissions from a lignite burning plant, in Germany, the combustion was associated with relatively higher AAEs rangíng from 0.8 to 3.0 [30]. Similarly, for residential combustors, AAE was varying between <1 and 3 [31], partially due to various coal composition and due to varying combustion conditions. In a laboratory study of particle emissions from various coal types, AAE was nearly twice as high for coal briquettes (2.55 ± 0.44) compared to coal chunks (1.30 ± 0.32) [32].
Another method for source apportionment is tracer-based apportionment. In this study, levoglucosan is used as a tracer for biomass burning. The anhydrosugar levoglucosan is almost exclusively formed during cellulose pyrolysis at temperatures above 300 °C [33]. There are issues with levoglucosan as a source tracer due to atmospheric reactivity. However, it is still considered most suitable due to its high abundance and relatively long stability compared to other markers [34] and has been used in many source apportionment applications, e.g., [35,36,37]. In a number of studies the levoglucosan to OC ratio, which is used to quantify contribution to OC or CM from biomass combustion, has been shown to be around 10–20%, depending on fuel type, burning conditions, etc. [38,39]. In an ambient study in Hungary, during periods with dominating wood burning contribution, the LVG/OC was 0.14 [40]. Additionally, the levoglucosan to wood smoke OC has been reported as 0.18 [41], and 0.16 [42], specifically 0.2 for softwood while it was 0.08 for hardwood.
Combustion of fossil fuel and biomass, including residential energy use and power generation, is a primary source of the atmospheric PM2.5 globally [43,44]. Despite recent advances in the knowledge about PM, (its sources, processes and effects on health and climate) there is still not much known about the sources and what this depends on in Poland, which still has a lot of coal burning as energy source. In Poland, approximately 50, 80 and 77% of primary energy, electricity and heat consumption, respectively, is using hard coal and lignite [45]. Poland also has issues with PM levels. In Diabła Góra, where our measurements are performed, 35% of the PM2.5 in 2009 was carbonaceous compounds (OC 29.3%, EC 5.2%) [46]. The anthropogenic influence, as well as the PM2.5 in general, was highest in winter (December–March), with an average PM2.5 concentration of 19.3 µg m−3. Rogula-Kozłowska et al. reported winter concentrations of PM2.5 of 26 µg m−3, out of which 44% was carbonaceous [47]. Reizer and Juda-Rezler studied PM10 trends, and found a clear annual cycle, with higher concentrations during the winter and heating period [45]. High PM10 and PM2.5 events are also associated with meteorological winter conditions such as low wind speeds, temperature inversion and low mixing layer height.
Hence, some knowledge exists about the aerosol pollution in the region of interest in this paper, however, previous studies have focused on, or been limited to, trends in aerosol burden and chemical characterization, or have been focusing on long range transport in the summer season [48,49]. In this paper, we report source contributions of carbonaceous aerosol particles from a winter measurement campaign at a rural background environment in north-eastern Poland, and discuss different source areas as well as similarities in CM levels with another nearby aerosol monitoring station. In order to separate three different CM sources (domestic wood and coal combustion and road traffic exhaust), we utilized a combination of absorption measurements with the aethalometer instrument and filter measurements of levoglucosan as source tracer. It is important to continuously evaluate and develop the use of the aethalometer model to apportion source contribution, since the aethalometer is a common instrument at aerosol monitoring sites. Hence, it will have a widespread use for long-terms studies of the carbonaceous aerosol in the future.
2. Experiments
2.1. Diabła Góra Site Description
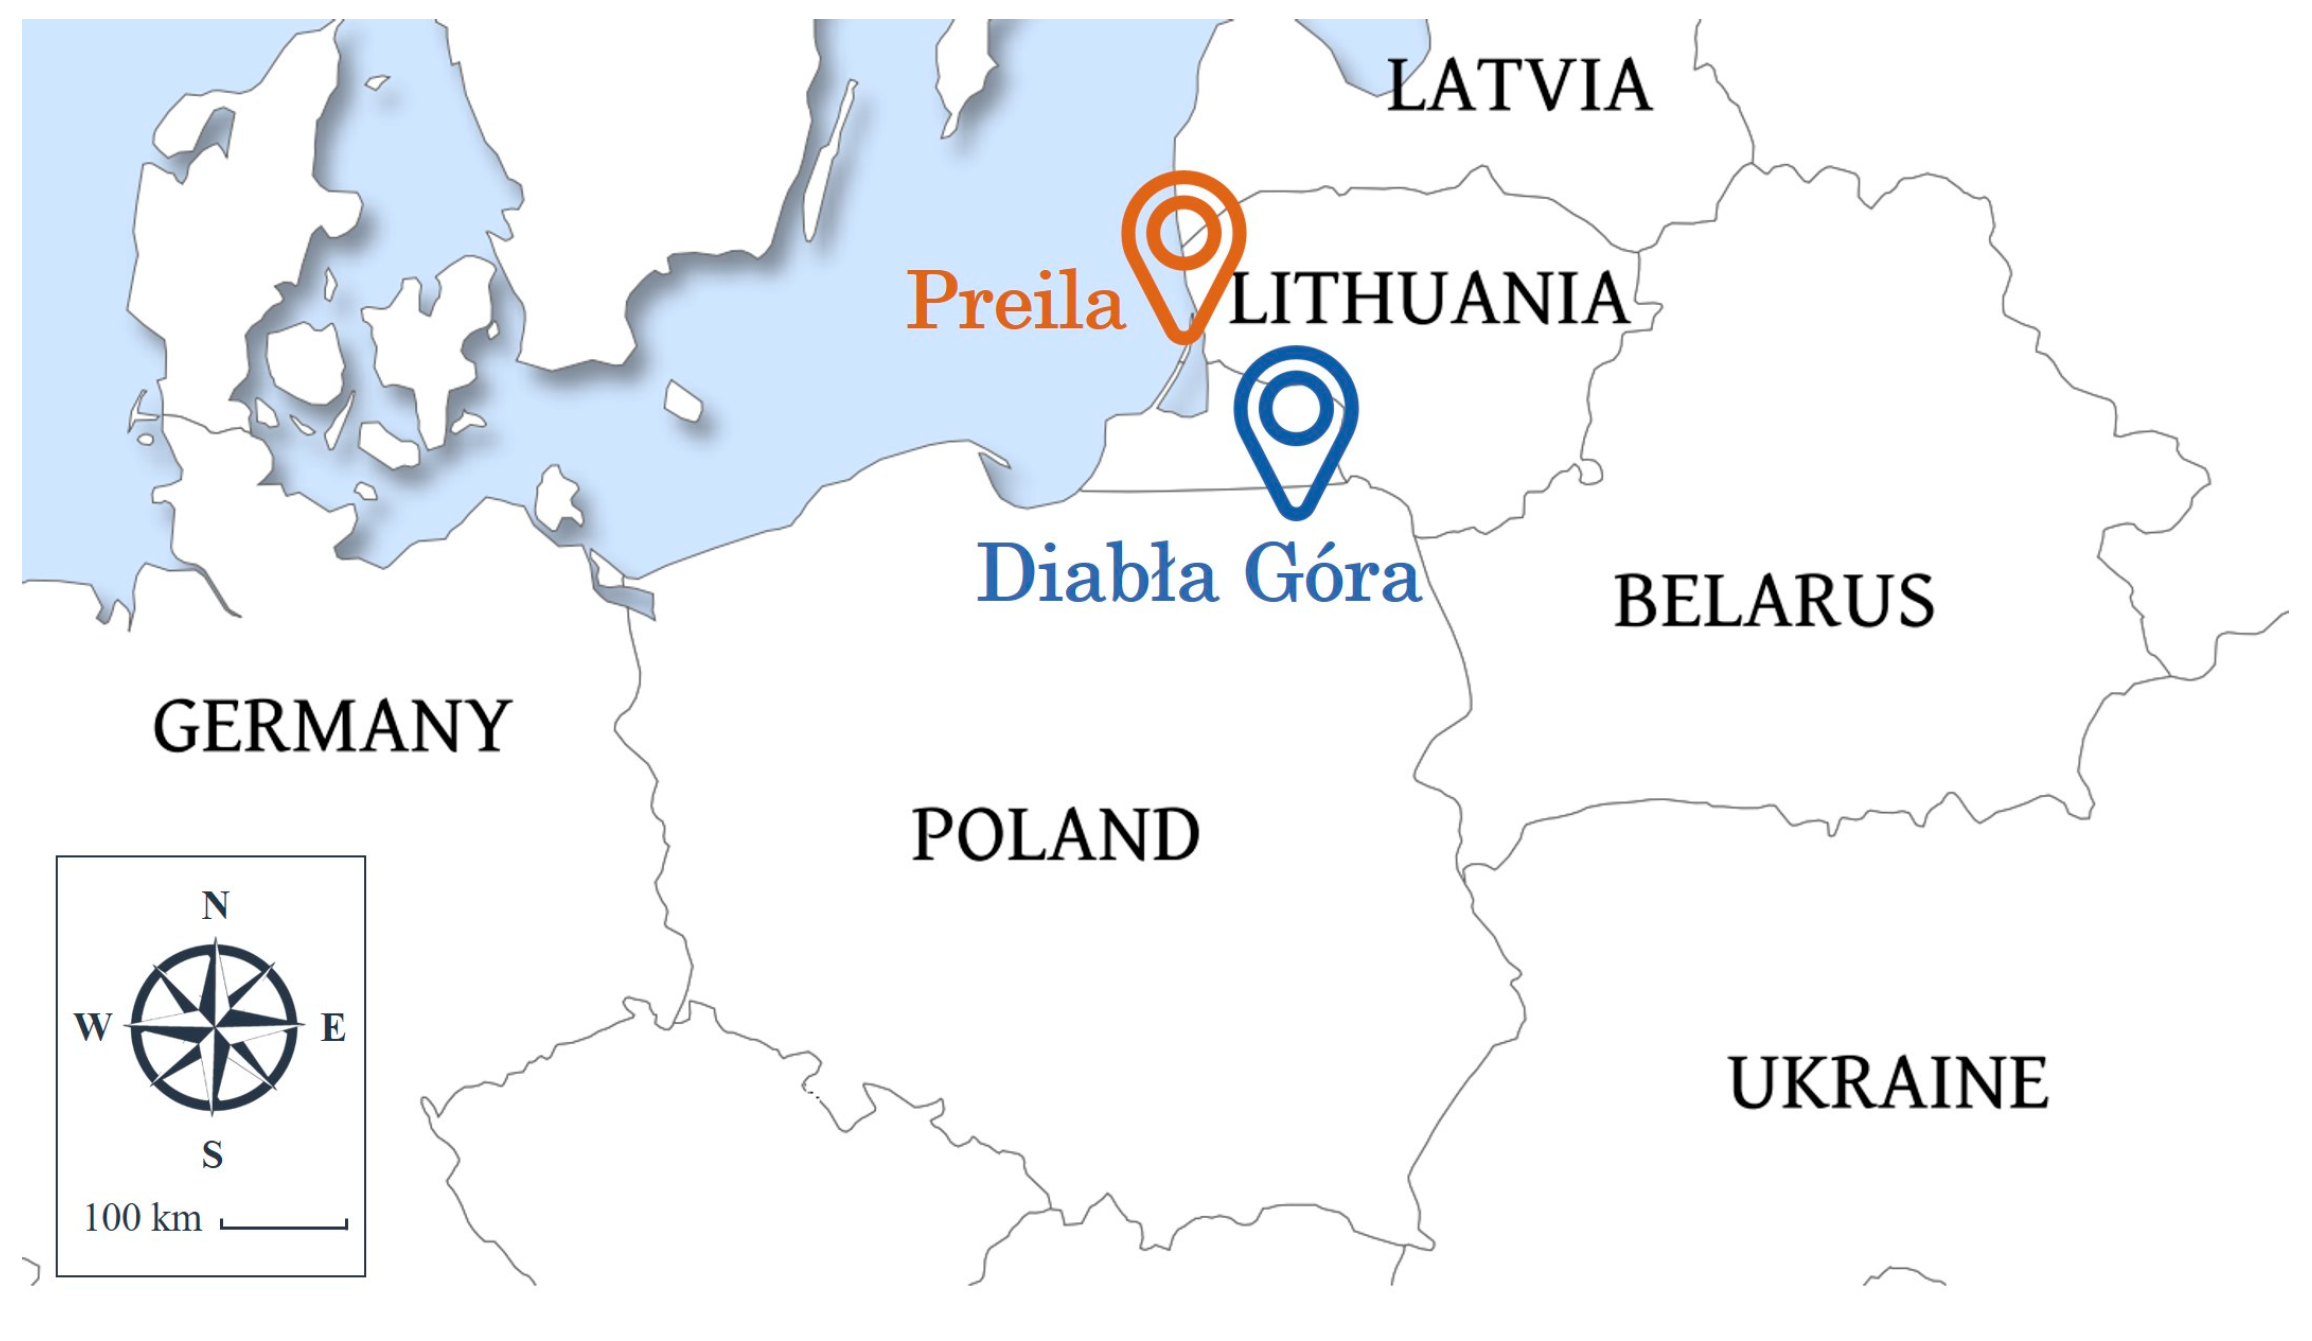
The Diabła Góra rural European Monitoring and Evaluation Programme (EMEP) regional background monitoring station is located in the Warmia-Mazuria region (Figure 1 and Figure 2) in the Puszcza Borecka Forest, surrounded by agriculture and forestry.
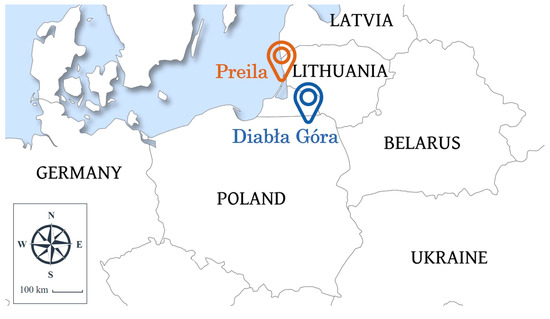
Figure 1.
Map of the region showing the locations of the Diabła Góra measurement site together with the Preila site used for comparison (freeworldmaps.net).
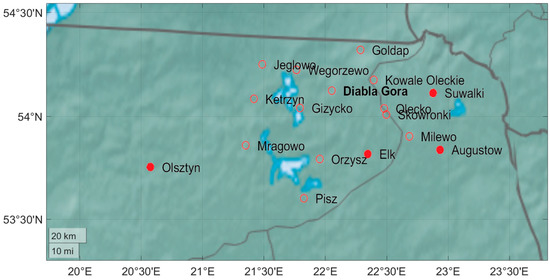
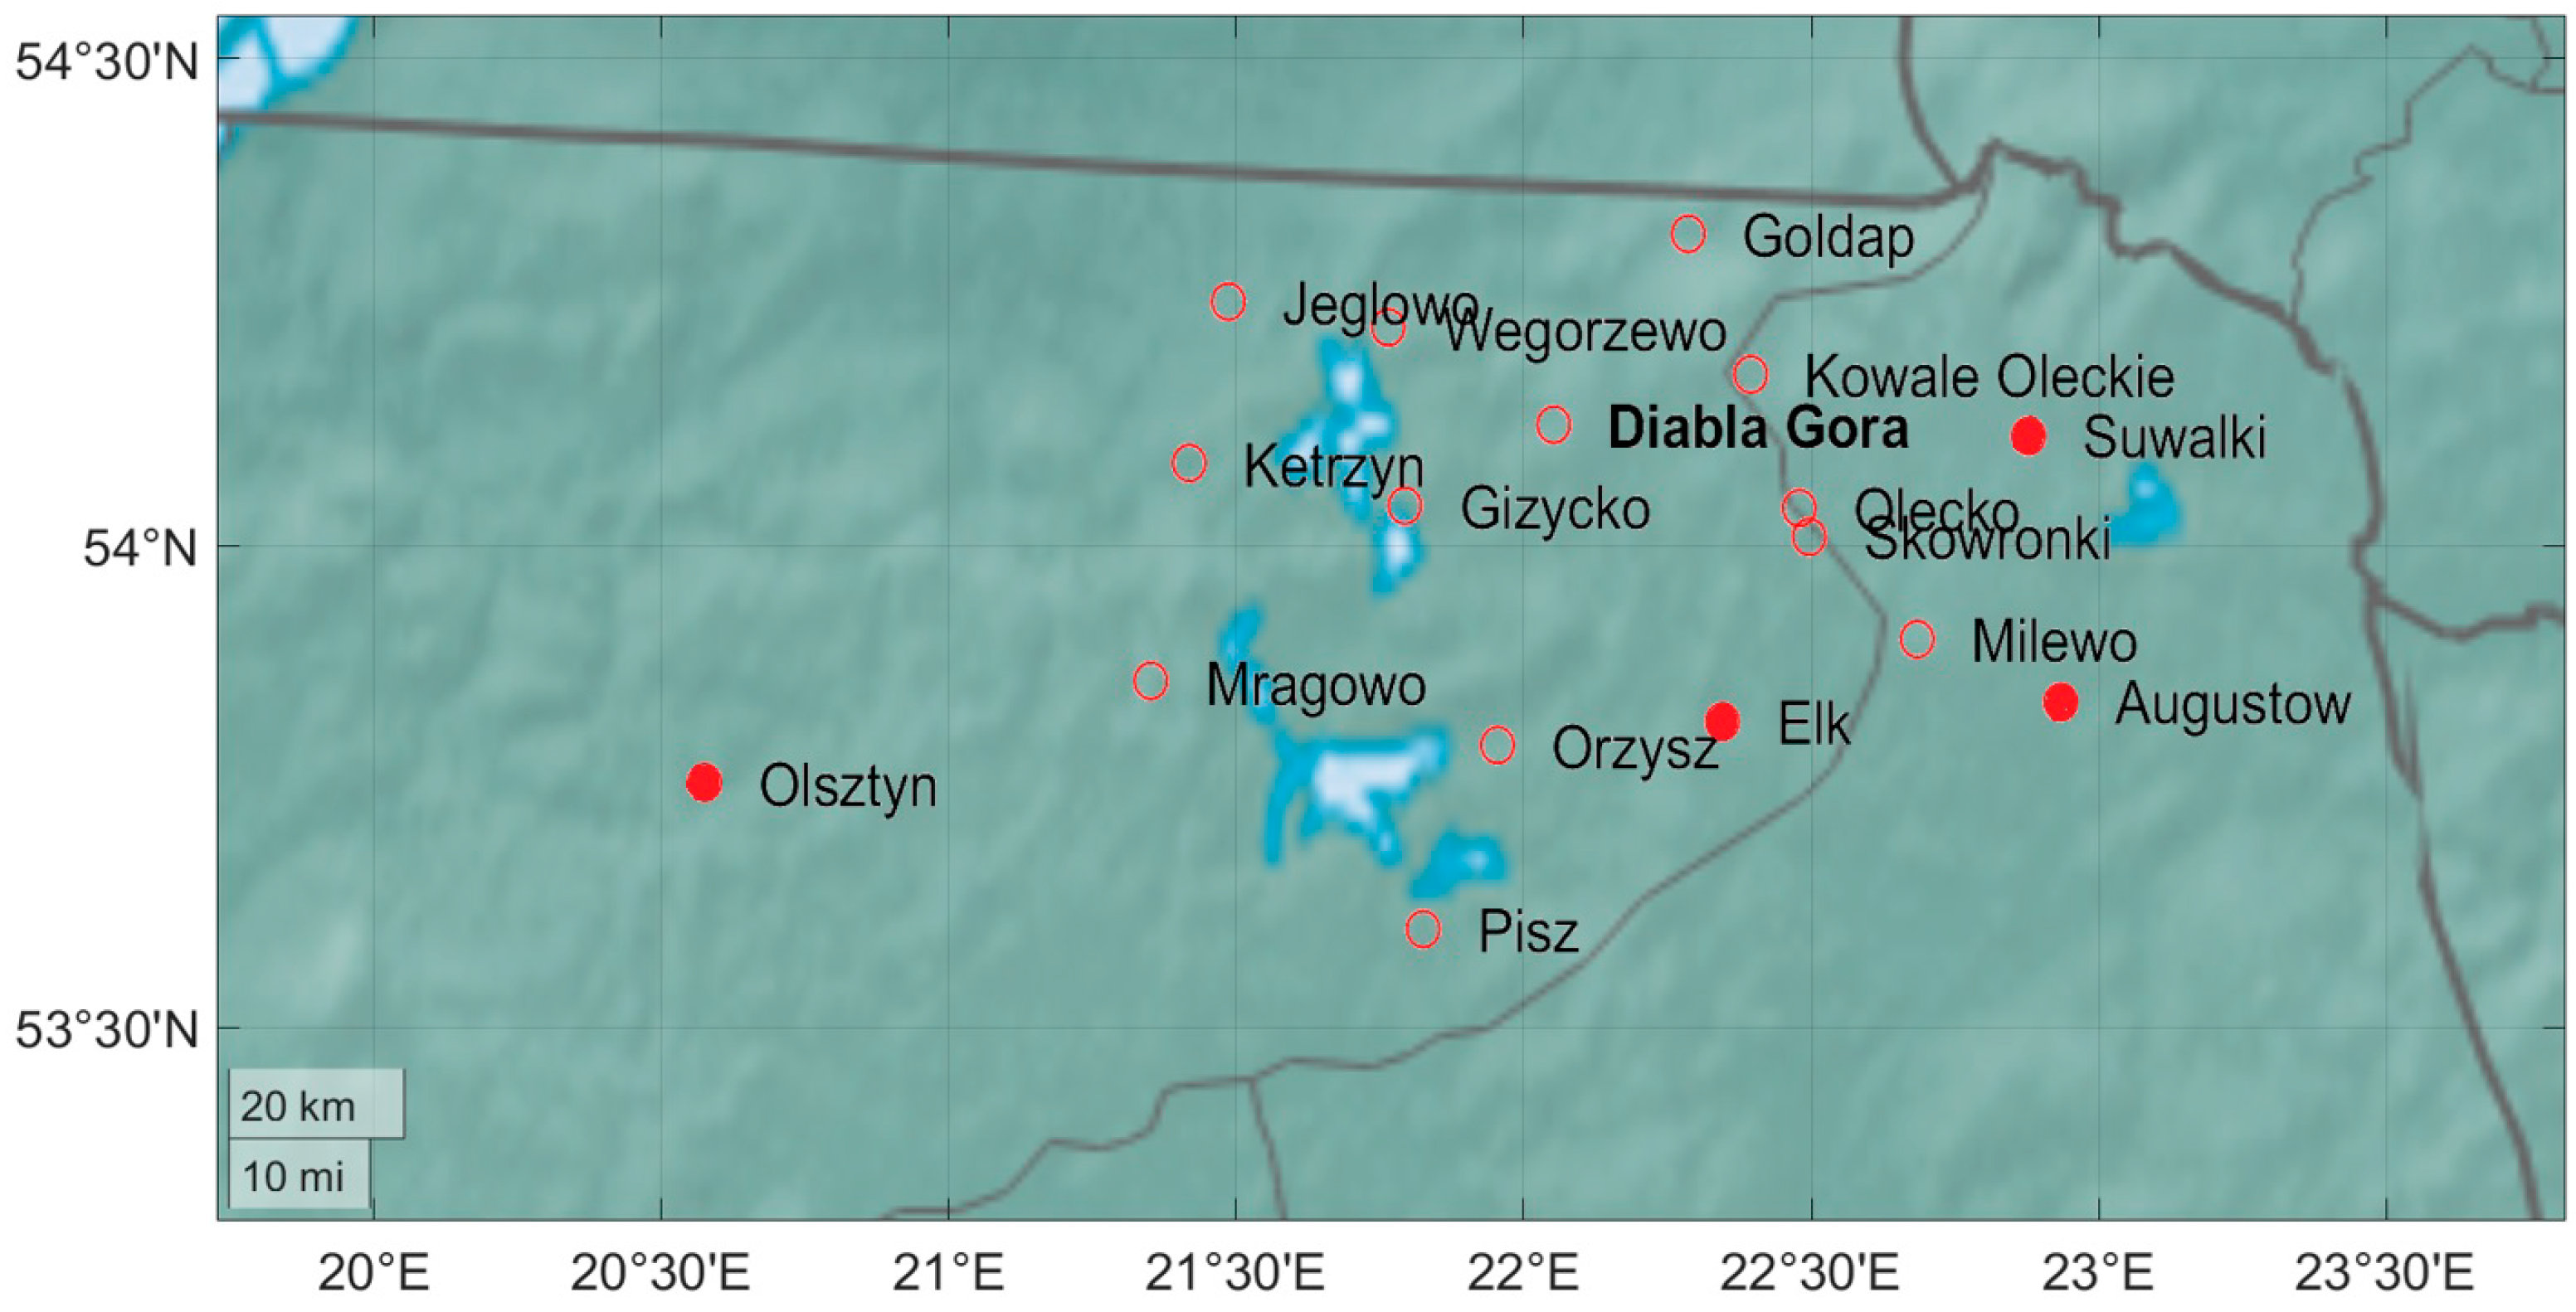
Figure 2.
A zoom-in of north-eastern Poland with Diabła Góra denoted with bold font. Denoted are also other communities and towns in the near-region area within 100 km of Diabła Góra, which have relatively large emissions of SOX, NOX and/or PM10 according to the emission inventory by GIOŚ (2019) [50]. Towns with populations larger than 30,000 people are denoted with filled circles.
There is no local pollution source in the vicinity of the station (no roads, living houses, industry). The nearest object is the forester’s lodge, 350 m southwest of the station. The reason for the choice of Warmia-Mazuria region in this study was the fact that rural Poland in general is more polluted than neighboring western countries in Europe and has a different composition of sources contributing to the pollution with especially domestic coal combustion being a very important pollution source. The nearest populated villages, communities and emission point sources with substantial emissions of SOX, NOX, and/or PM10 are depicted in the map of Figure 2. Ełk, Suwałki, and Augustów are smaller towns with populations between 30,000 and 70,000. Olsztyn is the largest town within 100 km of the station with a population of 608,000. This area will hereafter be referred to as the near-regional area of Diabła Góra. There are also several larger national roads in this near-regional area, which are important sources of NOX, and PM10.
2.2. Auxiliary site Preila description and sampling
The Preila environmental pollution research station (55°55′ N, 21°00′ E, 5 m above sea level, [51]) is located in the Curonian Spit in Lithuania and represents a rural coastal environment (Figure 1). A road along the spit connects summer resorts and fishing villages. The closest city Klaipėda (153,000 inhabitants) is about 40 km north of Preila. Another major city, Kaliningrad (430,000 inhabitants) in Russia is at the distance of 90 km to the south. Due to the proximity to Diabła Góra (ca 150 km), data from the station were included for comparison.
At Preila, non-refractory PM1 was measured by the Aerosol Chemical Speciation Monitor ACSM (Aerodyne Research Inc., Billerica, MA, USA) which operated with a time resolution of ~30 min. The collection efficiency was evaluated following Middlebrook et al., [52] and was equal to 0.5. eBC measurements were performed using an aethalometer (AE31 Aerosol d.o.o., Ljubljana, Slovenia) with 2 min time resolution. Source apportionment was performed using the approach of Zotter et al. (replacing the estimated OM from OC by measured OM from the ACSM) [21], using the Ångstöm exponents found for Diabła Góra (see Section 3.3).
2.3. Sampling and Chemical Analysis at Diabła Góra
PM2.5 and PM1 samples were collected at the station by DHA-80 (Digitel, Volketswil, Switzerland) High Volume Samplers (HVS) with PM2.5 and PM1 inlets, respectively, on Whatman QM-A quartz filters of 150 mm diameter. The air was sampled through the inlet, using the sampling tube, vertically from the top to bottom through the filter placed in the flow chamber. The face velocity of the sampled air through the filter was 0.5 m/s. The transported air quantity was measured by a flow meter behind the filter. After 24 h exposure, the filters were changed automatically at midnight. The sampler had a magazine of 15 filters. The air flow rate was about 750 m3/24 h. Filters were conditioned and weighed prior to sampling and after sampling (weighing room temperature 19–21°C, relative humidity 45–50% RH). The mass of collected PM2.5 and PM1 was determined by a gravimetric method. The concentration of PM was calculated based on mass and air flow during sampling.
In order to determine EC and OC in PM samples collected on filters, a thermal-optical method with FID detection was used, a Model 4L Main Oven Assembly (Sunset Laboratory Inc., Tigard, OR, USA). Quartz filter punches with 1.5 cm2 area (cut out of the filters) were analyzed in a two step procedure. First, during gradual heating in an inert atmosphere, in helium stream, the organic fraction was desorbed. In the next stage, during heating in an oxidizing mixture of helium and oxygen, elemental carbon was released. The heating of the samples was carried out according to the parameters specified in the selected measuring protocol—EUSAAR_2. Compounds separated from the sample during subsequent heating stages in the furnace, under oxidizing conditions and with magnesium oxide, were converted to carbon dioxide. This was then reduced, in the presence of hydrogen and nickel catalyst, to methane and measured by a flame ionization detector (FID). The final stage was the inclusion of a fixed volume loop used to inject the external standard at the end of each analysis. That allowed optimal and stable measurement conditions, increasing the repeatability of the analytical method [53]. Only OC and EC values from the measurements at the PM2.5 inlet were used in this study.
The content of levoglucosan was determined by gas chromatography/ion trap mass spectrometry—GC/IT—MS method. From each ambient aerosol filter two 1.5 cm2 punches were taken and 15 μg of internal standard (IS; methyl β-D-xylopyranoside, Sigma Aldrich, Poznań, Poland) was added. The punches were extracted for 60 min with 15 mL aliquots of methanol using a Multi-Orbital Shaker (PSU-20i, BioSan, Riga, Latvia) at room temperature. High-purity methanol (LC-MS Chromasolv grade, Sigma-Aldrich) was used for the extraction of filters. Obtained extracts were concentrated to 1 mL using a rotary evaporator operated at 30 °C and 150 mbar (Rotavapor® R215, Buchi, Flawil, Switzerland). The extracts were then filtered with a 0.2 μm PTFE syringe directly into 2 mL vials and evaporated to dryness under a gentle stream of nitrogen. The residues were then reconstituted with 150 µL of trimethylsilylating agent (BSTFA-pyridine, 2:1 v/v, Sigma-Aldrich), agitated for 1 min and derivatized in 60 °C for 60 min (Standard Dry Block Heater, TalBoys, Troemner, Thorofare, NJ, USA). The samples were then immediately analyzed using a GC-MS technique. Trace 1300 gas chromatograph coupled to an ITQ700 ion-trap mass detector with an EI ion source (Thermo Scientific, Waltham, MA, USA) was used. The analyses were carried out using a Rxi-5MS Restek column (30 m × 0.25 mm × 0.25 μm). Helium (99.9999%, Air Liquide, Paris, France) at constant flow of 1 mL/min was used as carrier gas. The following chromatographic separation was used: 60 °C for 5 min, then 3 °C/min to 200 °C, then 200 °C for 5 min, then 10 °C/min to 300 °C, and 300 °C for 5 min. The temperature of the transfer line was 280°C. The ion source and the injector were heated to the temperature of 250 °C. The ionization energy was set to 70 eV and the SIM mode for selected ions (m/z 147, 204, 217, 319, 333) was used. Samples were analyzed in the splitless mode. Calculations of levoglucosan concentrations in ambient aerosol samples were performed using an external calibration curve of an authentic standard (levoglucosan, purchased from Sigma Aldrich, in the highest available purity ≥ 99%). Only levoglucosan concentrations measured at the PM2.5 inlet were used in this study.
A flow of 14.0 liters per minute was drawn from outside through a characterized and custom-made PM1 cyclone in the lab house. This flow was split to a 9.0 L/m excess flow and a flow of 5.0 L/m to an aethalometer (AE33 model, Aerosol d.o.o., Ljubljana, Slovenia) [54]. The aethalometer is a filter based optical absorption instrument that measures light absorption coefficients as a function of seven wavelengths. The equivalent black carbon (eBC) concentration [18] was obtained by dividing the absorption coefficient at 880 nm with a mass absorption coefficient (MAC) set to 7.77 m2 g−1, the default value given by the manufacturer. The correction for filter loading effects was accomplished with the dual-spot method. PN 8060 filter tape (Aerosol d.o.o., Ljubljana, Slovenia) was used in the aethalometer with default values for various corrections according to the manufacturer instruction. Flow calibrations and checks and other regular maintenance have been performed for the AE33 since purchase during 2015, except for the inspection and cleaning of the optical chamber. The performance of the current AE33 instrument in source apportionment with the aethalometer model has previously been tested by Martinsson et al. [55].
3. Meteorological and Source Apportionment Analysis
3.1. Meteorological Data and Production of Meteorological Air Mass Back Trajectories
Meteorological parameters, RH, T, wind speed, and wind direction were measured at Diabła Góra with a MAVS301 meteorology station (Vaisala, Vantaa, Finland).
Hourly air mass back trajectories were retrieved using the Hybrid Single-Particle Lagrangian Integrated Trajectory (HYSPLIT4) model [56] with the Global Data Assimilation System (GDAS) meteorological database at the NOAA Air Resources Laboratory’s web server.
Trajectories arriving at a height of 100 m above ground level at Diabła Góra were used. If the trajectory passed over a source area lower than 200 m above ground level within 100 km from Diabła Góra, it was considered that the area could affect Diabła Góra with its emissions. For long range transported trajectories more than 100 km away from Diabła Góra, a height of 500 m above ground level was allowed.
3.2. Source Apportionment of Domestic Wood Combustion
The source apportionment method to apportion carbonaceous matter was based on a combination of two methods: (1) The concentration of levoglucosan was used to apportion the contribution from domestic wood combustion. (2) The Sandradewi et al. [20] aethalometer model was used to separate two further sources, domestic coal combustion and road traffic exhaust emissions.
According to laboratory studies described in Puxbaum et al. [38], the levoglucosan to OC ratio equaled on average about 0.15 for domestic wood combustion for several different combusted wood types. In line with that study, it was assumed that wood combustion contributed 100% to CM when levoglucosan to OC ratio equaled 0.15. At Diabła Góra this ratio varied between 0.012 and 0.056.
Puxbaum et al. [38] also suggested multiplying OC by a factor of 1.7 to convert to OM at background sites affected by wood combustion. Using these recommendations, it was possible to calculate the following:
where CMwb is the domestic wood contribution to CM, and (Levo) is the levoglucosan concentration.
OM = OC · 1.7
CM = OM + EC
CMwb = CM × (Levo)/(0.15 ×·OC),
This yielded a source apportionment of the wood combustion source with a 24-h time resolution, since the measurements of levoglucosan, OC and EC are sampled on a daily basis.
Puxbaum et al. [38] showed that the levoglucosan to OC ratio could be highly variable in background environments and Hedberg et al. also showed that levoglucosan fraction was highly variable in domestic areas with intense wood combustion [57]. Levoglucosan can also react chemically, for example with OH [58]. Although concentrations of OH should have been very low in this study, levoglucosan decomposition could have been a problem and led to underestimation of long range transported CMwb in Equation (3). Due to the uncertainties in CMwb, a levoglucosan to OC ratio between 10 and 20% was used in a sensitivity analysis. This is also a reasonable range of this ratio according to the discussion in the introduction section. This sensitivity analysis also provided a sensitivity range for the domestic coal combustion source, since the wood and combustion source contributions were combined in the aethalometer model as described in the next section.
3.3. Source Apportionment of Domestic Coal Combustion and Traffic Exhaust
To be able to apportion domestic coal combustion and traffic exhaust to CM, several attempts were made with variations of the traditional Sandradewi et al. [20] aethalometer model before the final model choice. First of all, it was recognized that the traditional aethalometer model only allowed to separate two sources, while it was known that at least three sources should be prominent for CM in the Polish background environment; domestic wood combustion, domestic coal combustion, and traffic exhaust. Power plant coal combustion could have been a significant source, as well as some other potential sources.
Nevertheless, an attempt was made with the traditional aethalometer model with two sources to get familiar with the source patterns. We first thought that domestic wood combustion would be the main source that had stronger light absorption at shorter wavelengths than at longer wavelengths, which in the terminology of Sandradewi et al. [20] translates to a high absorption Ångström exponent, AAE around 2. However, as shown later in Section 4.2., high AAE and relatively high CM concentrations were associated with air arriving from the Katowice and Kraków area according to air mass back trajectories, despite that these cities are almost 500 km from the Diabła Góra site. Domestic coal combustion dominates the contribution to PM2.5 during winter time in these cities (for example [55]), hence it was concluded that also domestic coal combustion contributed to high AAE alike wood combustion. This is corroborated by the studies listed in the introduction Section 1, where it was stated that AAE for coal and lignite combustion varied between roughly 1 and 3 depending on the type of coal used as fuel.
With an AAE of around 2 for both sources [20], it was not possible to separate them from each other using only the aethalometer model as our apportionment tool. At least, this should have been the case when the fuel and burning conditions for both fuels gave an AAE of around 2.0. There could have been situations with both lower and higher AAE values for both domestic coal or wood combustion, but this was hard to investigate with the current data. Hence, the aethalometer model provided source contributions from a combined wood and coal combustion source.
Fortunately, with the help of the levoglucosan method to apportion wood combustion, it was possible to separate coal combustion from wood combustion. This could be done by subtracting the wood combustion contribution obtained with the levoglucosan method, from the source contribution calculated for the combined wood combustion and coal combustion source obtained from the aethalometer method.
The contribution from the second source in the aethalometer model, which is traffic according to the Sandradewi et al. [20] method, is usually quantified using an AAE value of around 1.0. An attempt with AAE = 1.0 and AAE = 2.0 for the traffic and combined wood and coal combustion sources respectively yielded satisfactory apportionment results. However, we were looking for more precise AAE values for the sources to achieve an improved agreement for the wavelength dependent absorption coefficients. In addition, we wanted to try modified versions of the aethalometer model to achieve even better agreement. We looked very closely on the hour resolved wavelength dependence of the absorption coefficient using many different functions to fit the absorption coefficients in hope of separating three sources using only the aethalometer instrument as tool. However, two sources were always enough to represent the wavelength dependence.
Nevertheless, we gained new experience owing to the analysis. We discovered that the slope of the decrease of absorption coefficient as function of wavelength only changed for the wavelength region 370 to 520 nm. The slope did not change between 520 and 950 nm. In other words, it was only possible to separate the two sources domestic combustion and traffic from each other using the decrease in absorption coefficients in the 370 to 520 nm wavelength region.
Based on all aethalometer analysis, the traditional aethalometer model with two source components as in Sandradewi et al. [20] was chosen as the final model, and with reference wavelengths 370 and 950 nm.
Before we could use the aethalometer model to calculate the source contributions, we had to choose final values for both AAEs. We fitted AAE values to the absorption coefficients for all of the 1-h aethalometer data. First, we let a minimizing routine fit the AAE values without constraints. However, these AAE values did not make sense physically. Hence, we restricted the AAE values using the following constraints:
- The combined wood and coal combustion source contribution had to be higher than the contribution from only the wood combustion source as estimated from the levoglucosan method at all times. Otherwise, coal combustion contributions would be too small.
- The source contribution from the traffic source should be higher than roughly 10% at all times, which means contribution from the combined domestic wood and coal sources of maximum about 90%. It is reasonable to assume that traffic should contribute at least to a small extent, even during intense domestic heating periods or periods with substantial combustion of agricultural waste in the Kaliningrad area. Please see also the discussion in the second last paragraph in this section about the sensitivity analysis of the traffic source contribution.
When the fitting of AAE values was made with these two constraints, it resulted in AAE values of 1.03 for traffic and 1.93 for the combined wood and coal combustion source, which was in line with previous literature data listed in the introduction section.
Other sources should have contributed to the CM concentrations during the measurement period, for example power plant coal combustion (as evidenced by CAN Europe [59]). However, not knowing what AAE values should belong to the coal power plant source, it was not possible to quantify it. Also, AAE values for the apportioned sources might in reality have been higher due to atmospheric ageing during long range transport. Ageing is known to increase AAE in smog chamber experiments by secondary organic aerosol formation [60]. How this should have affected the AAE values of 1.03 and 1.93 in the current study was unknown.
In summary, the aethalometer model from Sandradewi et al. [20] was run for hourly averaged absorption coefficient values and was used under these conditions and constraints:
- Reference wavelengths were 370 and 950 nm (in Sandradewi et al. [20] these were 470 and 950 nm).
- AAE from domestic wood and coal combustion was 1.93.
- AAE from traffic exhaust was 1.03.
- Source contributions to CM of the combined wood and coal source were allowed to approach maximum 90%, at the same time as they had to be higher than the wood contribution calculated with the levoglucosan method.
A sensitivity analysis for the wood and coal combustion sources has already been described in the previous section. In addition, a sensitivity analysis for the traffic source was performed. Maximum traffic contribution in the sensitivity analysis occurred when the combined domestic wood and coal contribution was allowed to approach values for the wood contribution only. The combined domestic contributions can not be lower, since this would mean negative contribution from coal combustion. A minimum traffic contribution was attainable using the boundary condition that the combined domestic contribution was allowed to approach 100% during the time when agricultural fires took place. During these situations with intense fires and very high concentrations of CM, traffic contribution could possibly have been almost negligible compared to the domestic sources, why this justified this sensitivity analysis.
A caveat here and in similar studies is that other sources likely contributed to CM, however it was not possible to identify them.
Please note that the aethalometer model source apportionment is based on light absorption. Nevertheless, it is still possible to apportion also non-light absorbing CM. Namely, it is sufficient that the total light and non-light absorbing CM is correlating with light absorption coefficients to be able to apportion it to our emission sources in the aethalometer model. This is the traditional approach in the aethalometer model as described by Sandradewi et al. [20].
4. Results and Discussion
4.1. Air quality Situation
Taking into account the large population density of Poland (124 per km2) and the heat demand during winter, CM emissions from car traffic and from domestic wood and coal combustion respectively should have been relatively high in Poland during the Diabła Góra winter campaign. The average CM concentration in Diabła Góra was 8.2 µg m−3, which corresponds to 44% of the total average PM2.5 mass concentration. PM2.5 and CM has been further split into OM, OC, EC fractions for the daily samples and eBC for minute resolution data. Table 1 presents average values of measured and estimated particle parameters within 1 standard deviation and the median, 10th and 90th percentile respectively during the measurement period.

Table 1.
Measured and calculated parameters based on 24-h measurements for all parameters except the 1 min measurements by the AE33 instrument. PM1 and levoglucosan were measured for a shorter period than other parameters (and one 24-h PM1 sample is missing in the period given in the table). CM and OM were calculated according to Equations (1) and (2). CM (carbonaceous matter), OM (organic matter), OC (organic carbon), EC (elemental carbon), and levoglucosan were measured for the PM2.5 fraction, while eBC was measured for the PM1 fraction.
Despite large variation in absolute concentrations, the ratio between CM and PM2.5 was confined in the range 0.32 to 0.64 for all 24-h samples. Hence, the relative contribution from all combined combustion sources to PM2.5 was relatively stable throughout the measurement period. However, the relative contribution to PM2.5 between individual combustion sources was changing between the different days as will be seen in Section 4.2.
The winter PM2.5 concentrations agreed reasonably with previous concentration measurements in Diabła Góra, although average PM2.5 concentrations were slightly lower than in Rogula-Kozłowska et al. [47] and Witkowska et al. [46]. This is likely due to lower temperatures and higher heat demand in those studies. OC and EC were also slightly lower in this paper compared to Witkowska et al. [46]. Witkowska et al. [46] were also able to extract the secondary organic OC contribution, which turned out to be slightly higher than the primary emitted OC contribution.
The average eBC to EC ratio within standard deviation was 1.76 ± 0.40 (n = 62) during the campaign. The high ratio is common for rural environments and is in part attributed to underestimation of the mass absorption coefficient [61,62]. The best agreement with eBC to EC ratio close to 1.2 was obtained during periods with the lowest OC to EC ratios. With OC to EC ratios around 10, eBC to EC ratio was on the order of 2.2. This could possibly mean that eBC was relatively higher during periods with strong lensing effect [63] from organic coatings.
4.2. Source Apportionment
The average and median domestic wood combustion contribution to CM amounted to 1.63 µg m−3 and 1.38 µg m−3 respectively (Table 2) according to the levoglucosan method from Equation (3). Taking into account the uncertainty in levoglucosan to OC ratio for background environments according to the sensitivity analysis in Section 3.2., resulted in a 1.22 to 2.44 µg m−3 contribution to CM from domestic wood combustion. These values represented a 16 to 32% contribution.

Table 2.
Average and median contributions from sources to CM at Diabła Góra and the relative contribution. The range of values for the average contribution as obtained from the sensitivity analysis described in Section 3.2, is also shown.
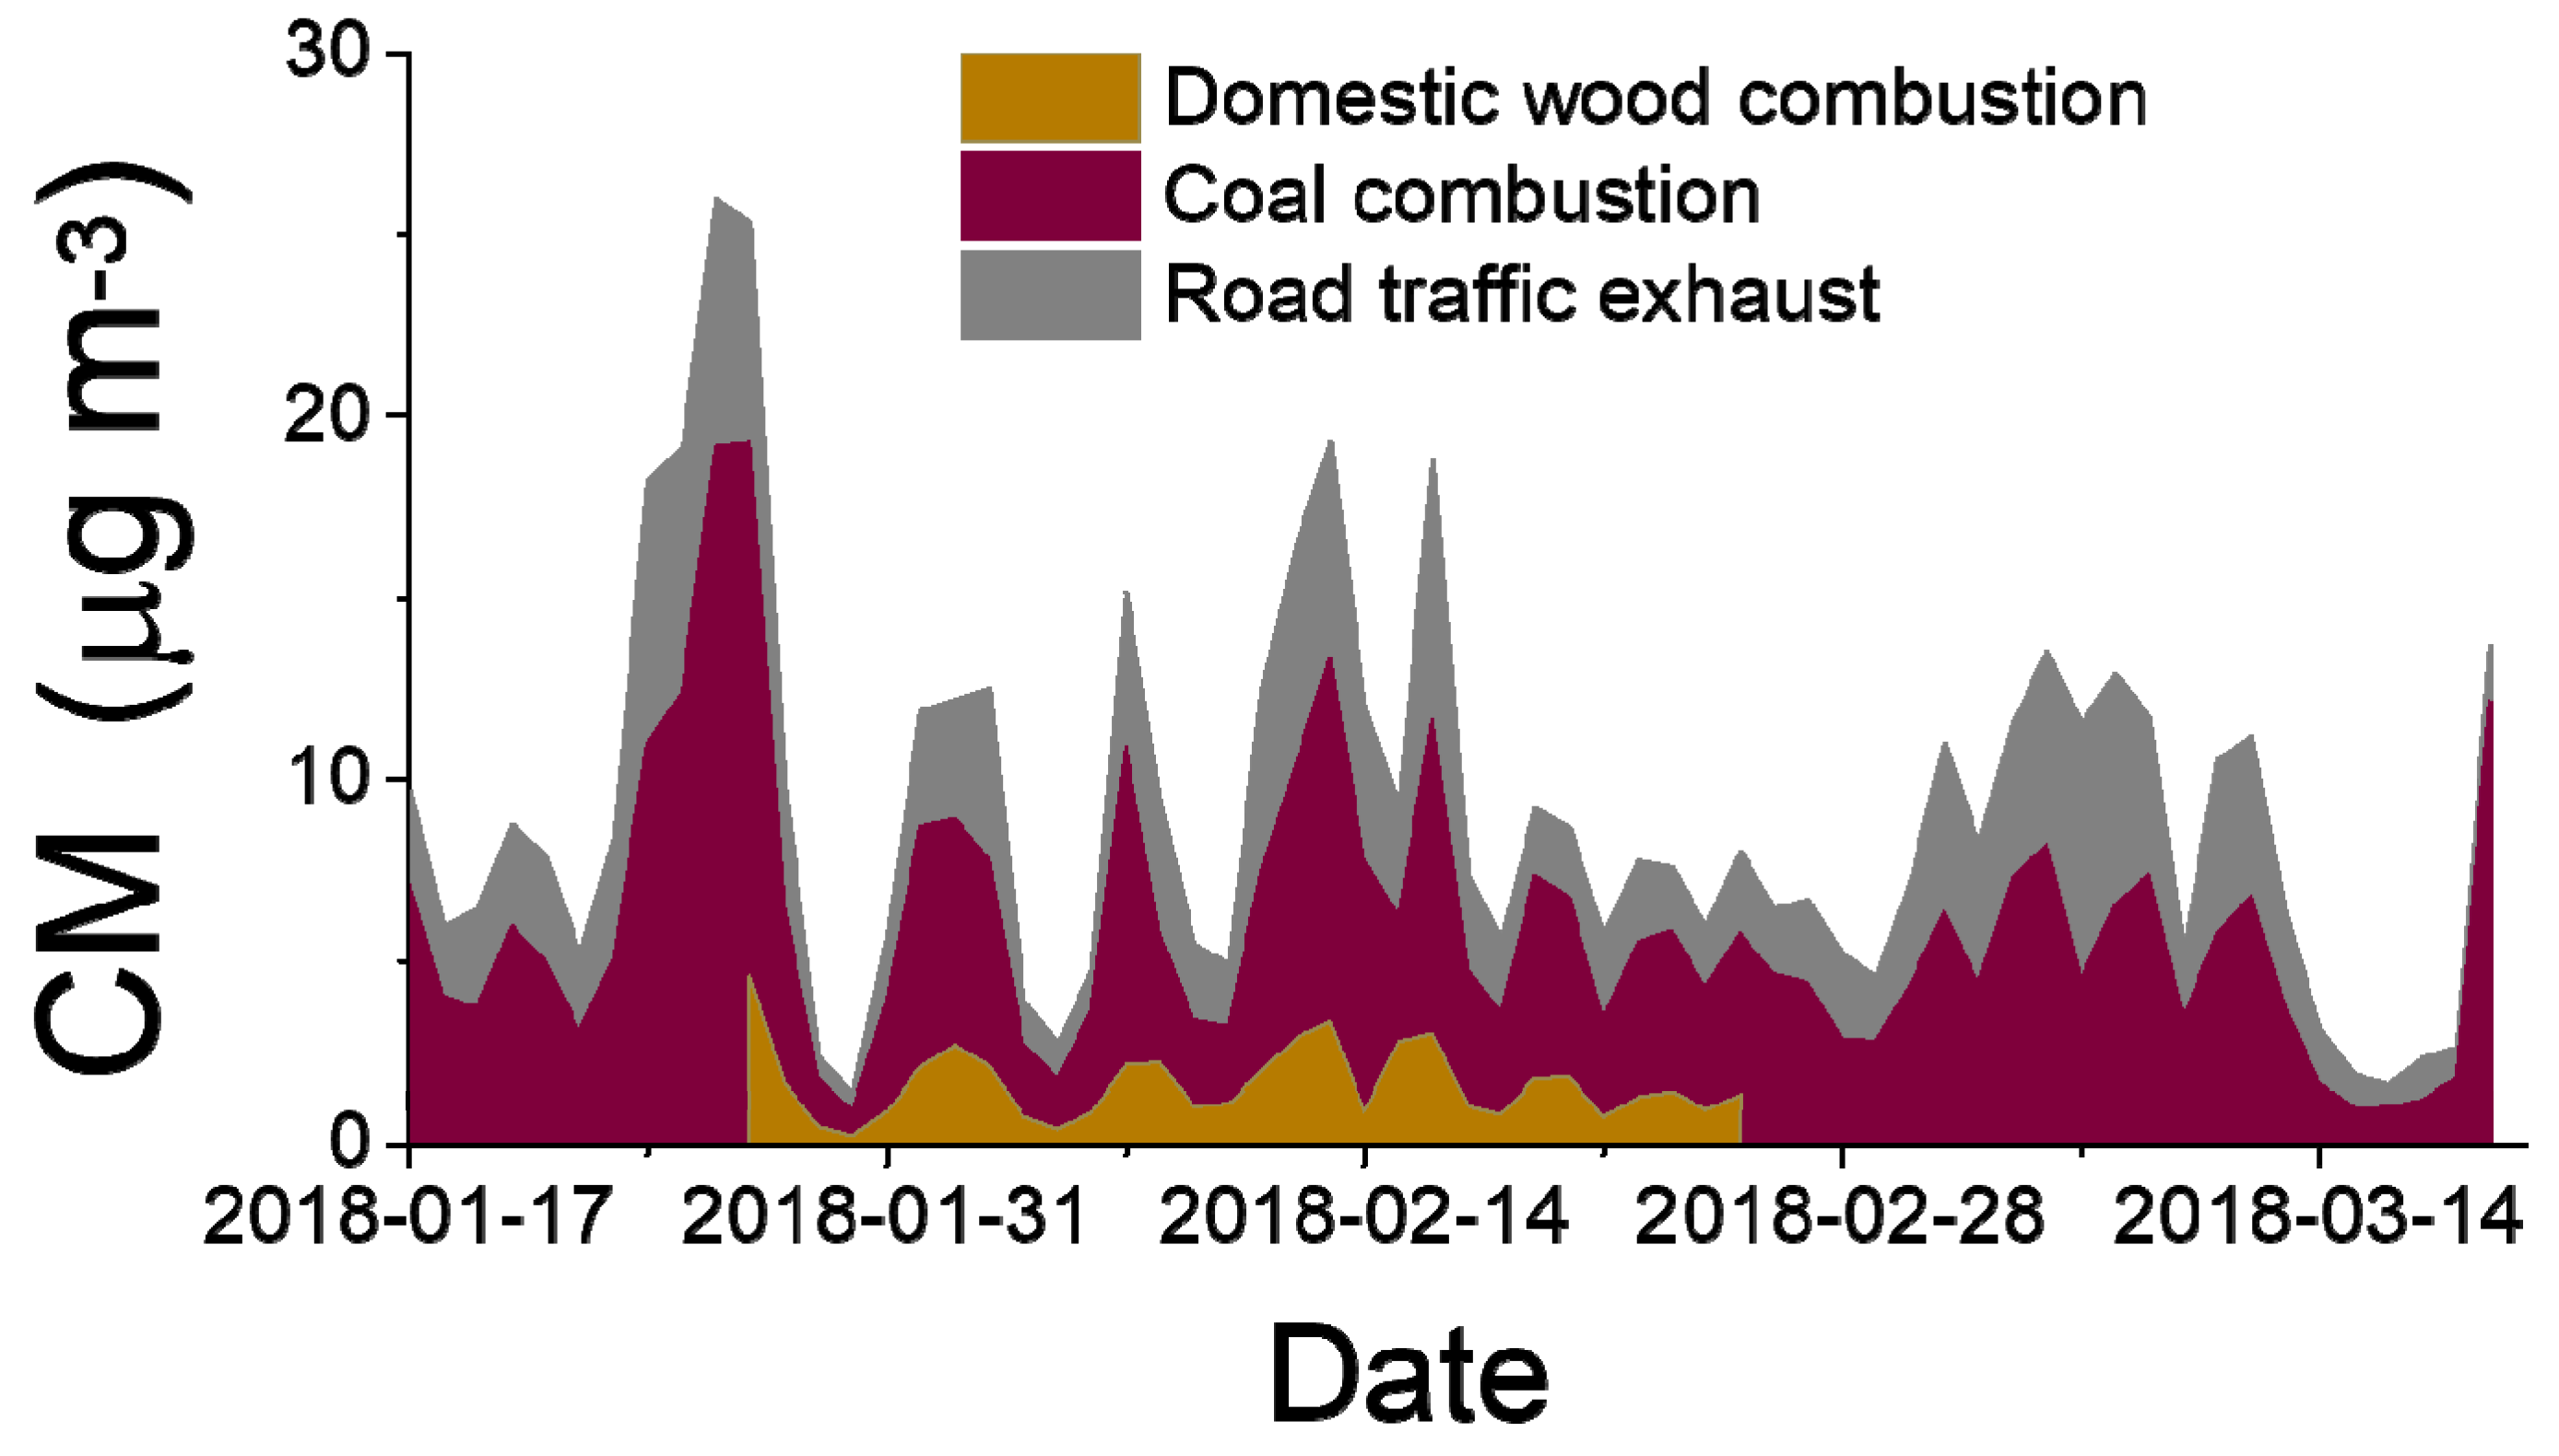
The average (and median) domestic coal combustion and road traffic exhaust contribution to CM could be calculated from the levoglucosan and aethalometer method as described in Section 3.3. These were 3.2 (2.9) µg m−3 and 2.9 (2.3) µg m−3 respectively (Table 2). Using the sensitivity analysis from Section 3.2. resulted in a contribution from the domestic coal combustion in the range 30–46%. As can be seen from Figure 3, There was a relatively large variation between how much all three sources contributed to CM between different days.
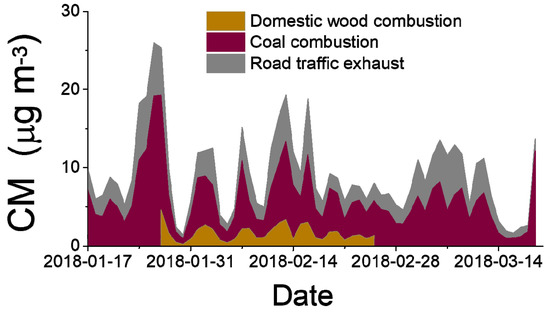
Figure 3.
Estimated contribution from domestic wood and coal combustion and road traffic exhaust to CM concentrations in Diabła Góra during the measurement period. The hour resolved source apportionment as obtained from the aethalometer method has been averaged to 24 h in this graph to be able to compare with 24 h values for the wood combustion contribution. During those days when levoglucosan data were missing, the contribution in brown represented the combined wood and coal combustion contribution.
The combined wood and coal contribution was reaching 70–90% at some instances (for example 17 January, and 19 March according to Figure 3), and the coal combustion was contributing to a smaller extent at some other instances (for example 8–10 February). The sensitivity analysis for the traffic source contribution resulted in a range from 23 to 51% according to Table 2. We allowed for a relatively large range for this source since we were not aware of more strict and preconceived boundaries of the source contribution.
Other sources, like power plant coal combustion should have contributed to substantial concentrations. However, we did not know to which of the three sources it belonged to, or if it could have been separated as an own fourth source. With the current data and the lack of knowledge of the wavelength dependence on light absorption coefficients, this was impossible to estimate in this study.
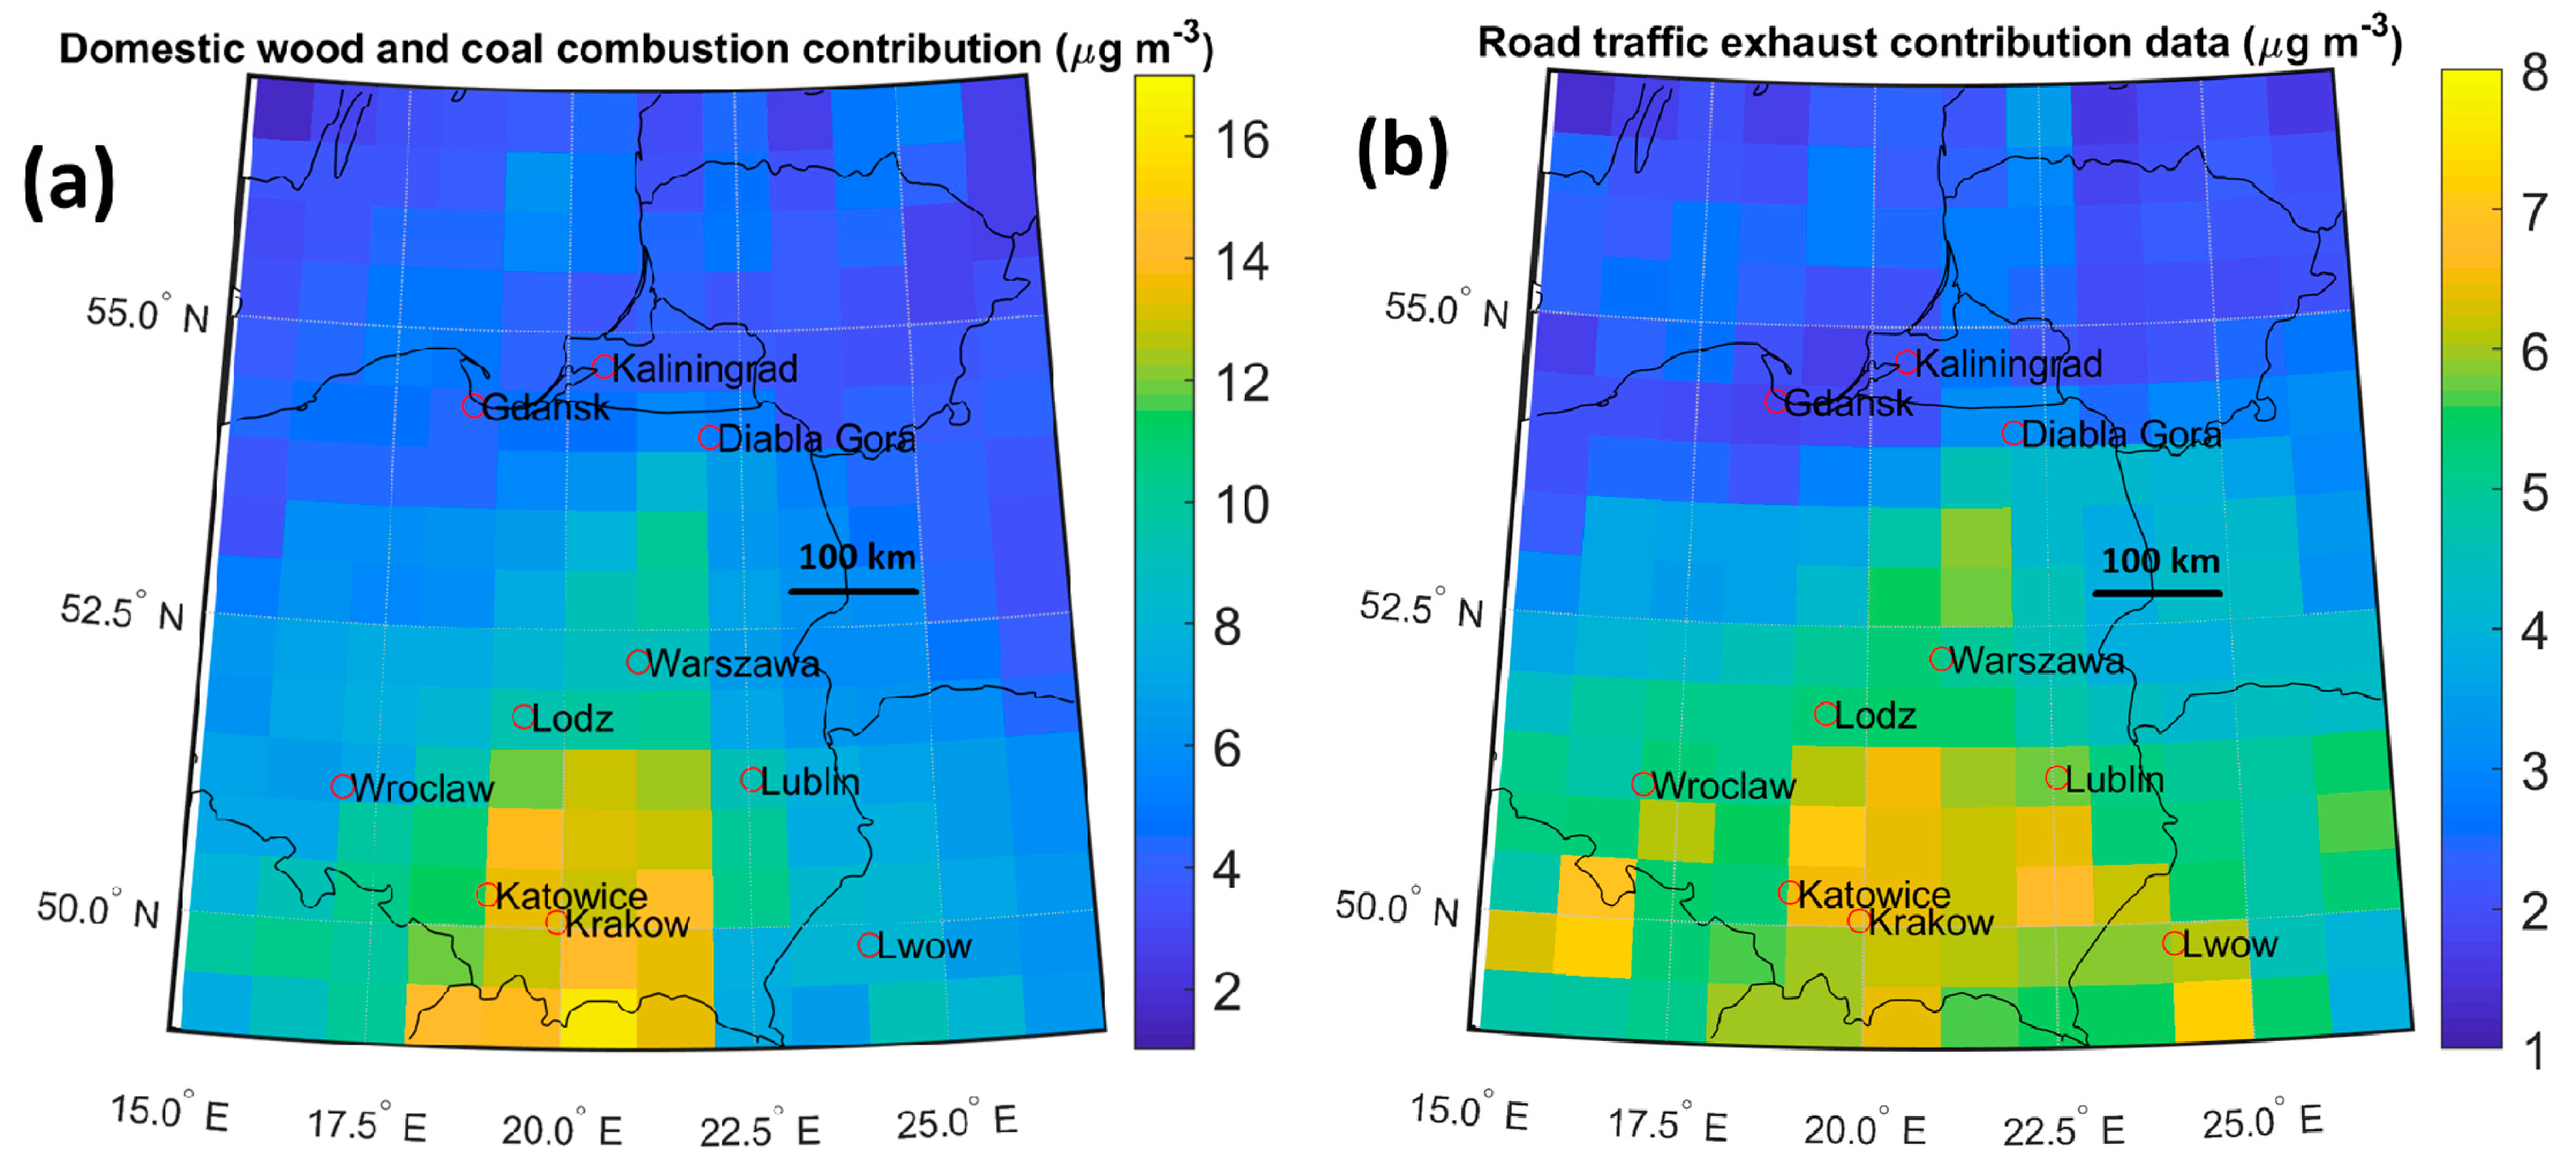
Next, we examined whether near-regional point sources within 100 km, towns or roads contributed significantly to the 1-h resolved source contributions from the aethalometer model. We tried with two independent methods to investigate this issue based on trajectories just missing or travelling through the point sources, and trajectories arrived from specific high spatially resolved grid boxes. However, it was not possible to observe that single point sources resulted in increased concentrations at the field site. Likely, all trajectories passed several important point sources on the way to the field site, and therefore this could be the reason why no single point source stood out. After this, we investigated in a similar way if certain grid cells with 0.5 and 1 degrees in latitudinal and longitudinal resolution respectively were especially important for high source contributions when long range transported (>100 km) trajectories reached Diabła Góra. The analysis showed that the Katowice and Kraków area about 500 km south of Diabła Góra contributed to high concentrations seen in Diabła Góra for the combined domestic wood combustion and coal combustion source in Figure 4a. Katowice and Kraków air reached the field site during parts of the days during 25–28 January, 2 February, 17 February, 12 March, and 14 March. This was in line with previous results that showed that Katowice and Kraków area had severe domestic coal combustion air quality problems [64]. Conversely, several major cities in Poland gave high contributions from the traffic exhaust source as seen in Figure 4b. Other major cities to the north and north-west of Diabła Góra, for example Gdańsk did not contribute significantly to enhanced concentrations since north-westerly winds were generally associated with clean air masses.
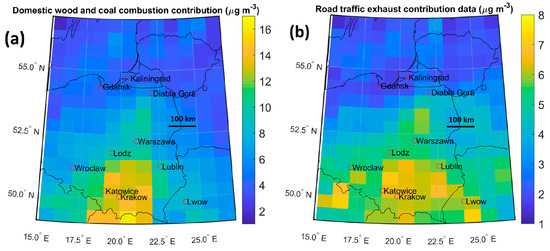
Figure 4.
Diabła Góra CM source contributions from (a) domestic wood and coal combustion, and from (b) road traffic exhaust as function of grid cell origin for grid cells with 0.5 and 1 degree resolution in the latitudinal and longitudinal direction. Data taken from aethalometer model with 1-h resolved aethalometer and trajectory data.
The source apportionment could not be directly compared to previous results for Diabła Góra due to different approaches and data. Nevertheless, a study by Reizer and Juda-Rezler indicated a possible influence from domestic sources as well as large point sources to PM10 concentrations in Diabła Góra [45]. Witkowska et al. [46] pointed to domestic wood and coal combustion as likely dominant sources in winter, but quantification of their respective contribution was not possible in that study.
Source contributions or periods with high concentrations showed no relation with time of the day despite that one would suspect high concentrations after morning rush hour for the traffic source and during heating periods in the morning and evening for the domestic sources. This proved that the nearest sources contributed less to pollution, but also that high concentrations of pollutants from long range sources arrived at different times to the field site.
4.3. Meteorological Influence on Concentrations and Source Apportionment
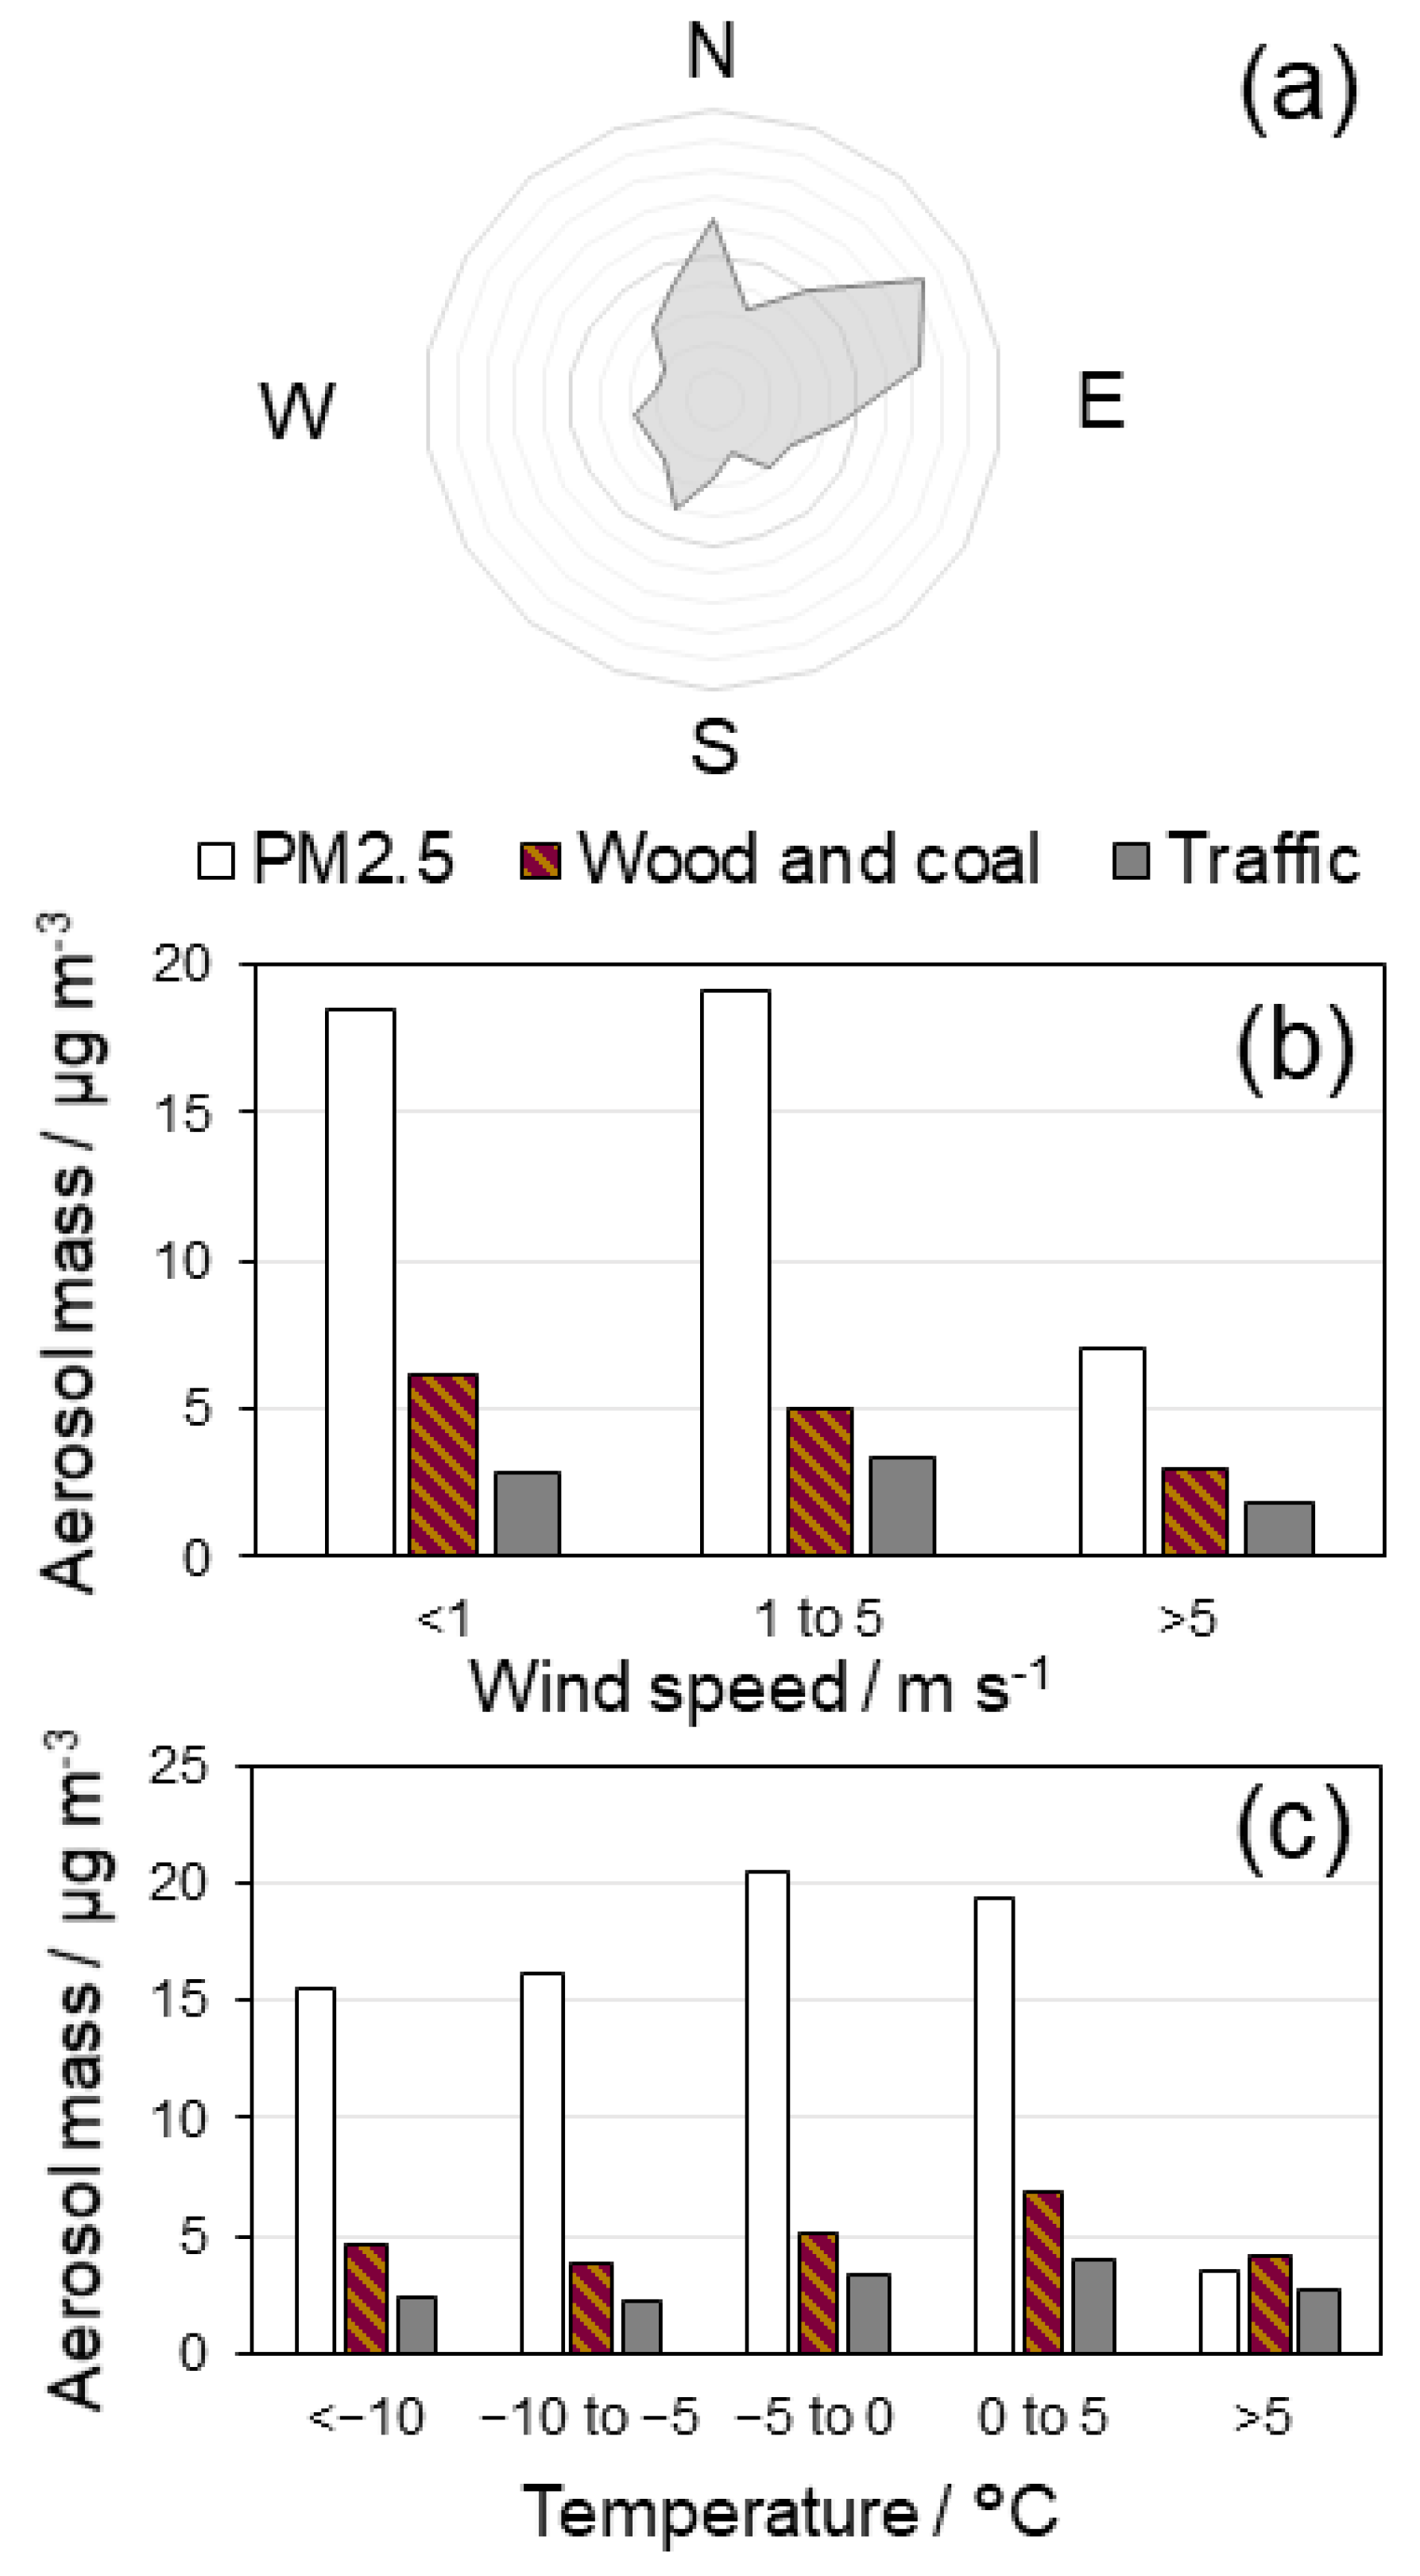
The average meteorological parameters, including standard deviations, minimum and maximum values, during the two-month measurement campaign are presented in Table 3. The measured wind direction at the site is shown in Figure 5a. The average temperature and wind speed were calculated based on 1-h values. The accumulated precipitation was obtained from the HYSPLIT trajectories described in Section 3.1. The average temperature, wind speed, and precipitation during our campaign were very similar to the winter conditions in Witkowska et al. [46], who described a year (2009) of PM measurements at Diabła Góra. Yet, the winds were predominantly from south-east and west-south-west in the winter of 2009, while in 2018 north-easterly winds were relatively more common (Figure 5a). Witkowska et al. [46] also observed the highest concentrations when air was transported from ESE and WSW, i.e., similar to the pattern in Figure 4 in this paper.

Table 3.
Meteorological parameters at the Diabła Góra field site. Average values, standard deviations (std), minimum and maximum values for 17 January–19 March 2018.
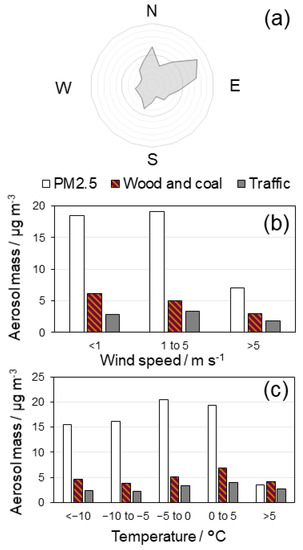
Figure 5.
(a) Wind directions at the field site Diabła Góra and average CM source contributions from traffic and wood/coal sources versus (b) wind speed and (c) versus temperature.
The average PM2.5 levels were similar to the levels in the corresponding time period described by Witkowska et al. [46] (18.5 ± 9.3 μg m−3 compared to 19.3 μg m−3). Also, they observed a negative correlation between PM2.5, OC, EC and wind speed. A similar pattern for wood and coal contribution was observed, and also, but not as clearly, for PM2.5 (Figure 5b). This pattern has been attributed to typical high-pressure phenomena, i.e., low boundary layer, and little dispersion and hence accumulation of pollutants at low wind speeds. However, traffic emissions did not show high contribution at very slow wind speeds (<1 m s−1). This was most likely due to other factors affecting the transport of pollutants. During the periods with low wind speeds in winter 2018, the air masses were predominantly coming from the north (including north-east and north-west). Hence, if the air came from polluted regions had a larger influence than wind speed during these time limited measurements. For a more accurate meteorological analysis, a longer measurement time series would be needed. For the source apportionment at Diabła Góra in general, the meteorological conditions were not of high importance, but for severe pollution events, meteorological conditions together with high emissions were of importance locally.
In Figure 5c, the PM concentrations and source distribution were shown as a function of air temperature. An observed increase in PM was anticipated, and especially in use of heating sources (wood and coal), during cold periods. This was not clear from Figure 5c, and low temperatures did not seem to affect pollution levels at Diabła Góra. Reizer and Juda-Rezler noted peak PM levels two to three days after the lowest air temperature (or maximum atmospheric air pressure), i.e., high pressure meteorological conditions [45]. A similar pattern at Diabła Góra was observed in the winter of 2018, which was in line with PM contribution being mostly of long-distance transport origin. Hence, the local temperatures were not of most importance, but rather the history of the air mass transported pollutants.
4.4. Comparison with a Nearby Lithuanian Site
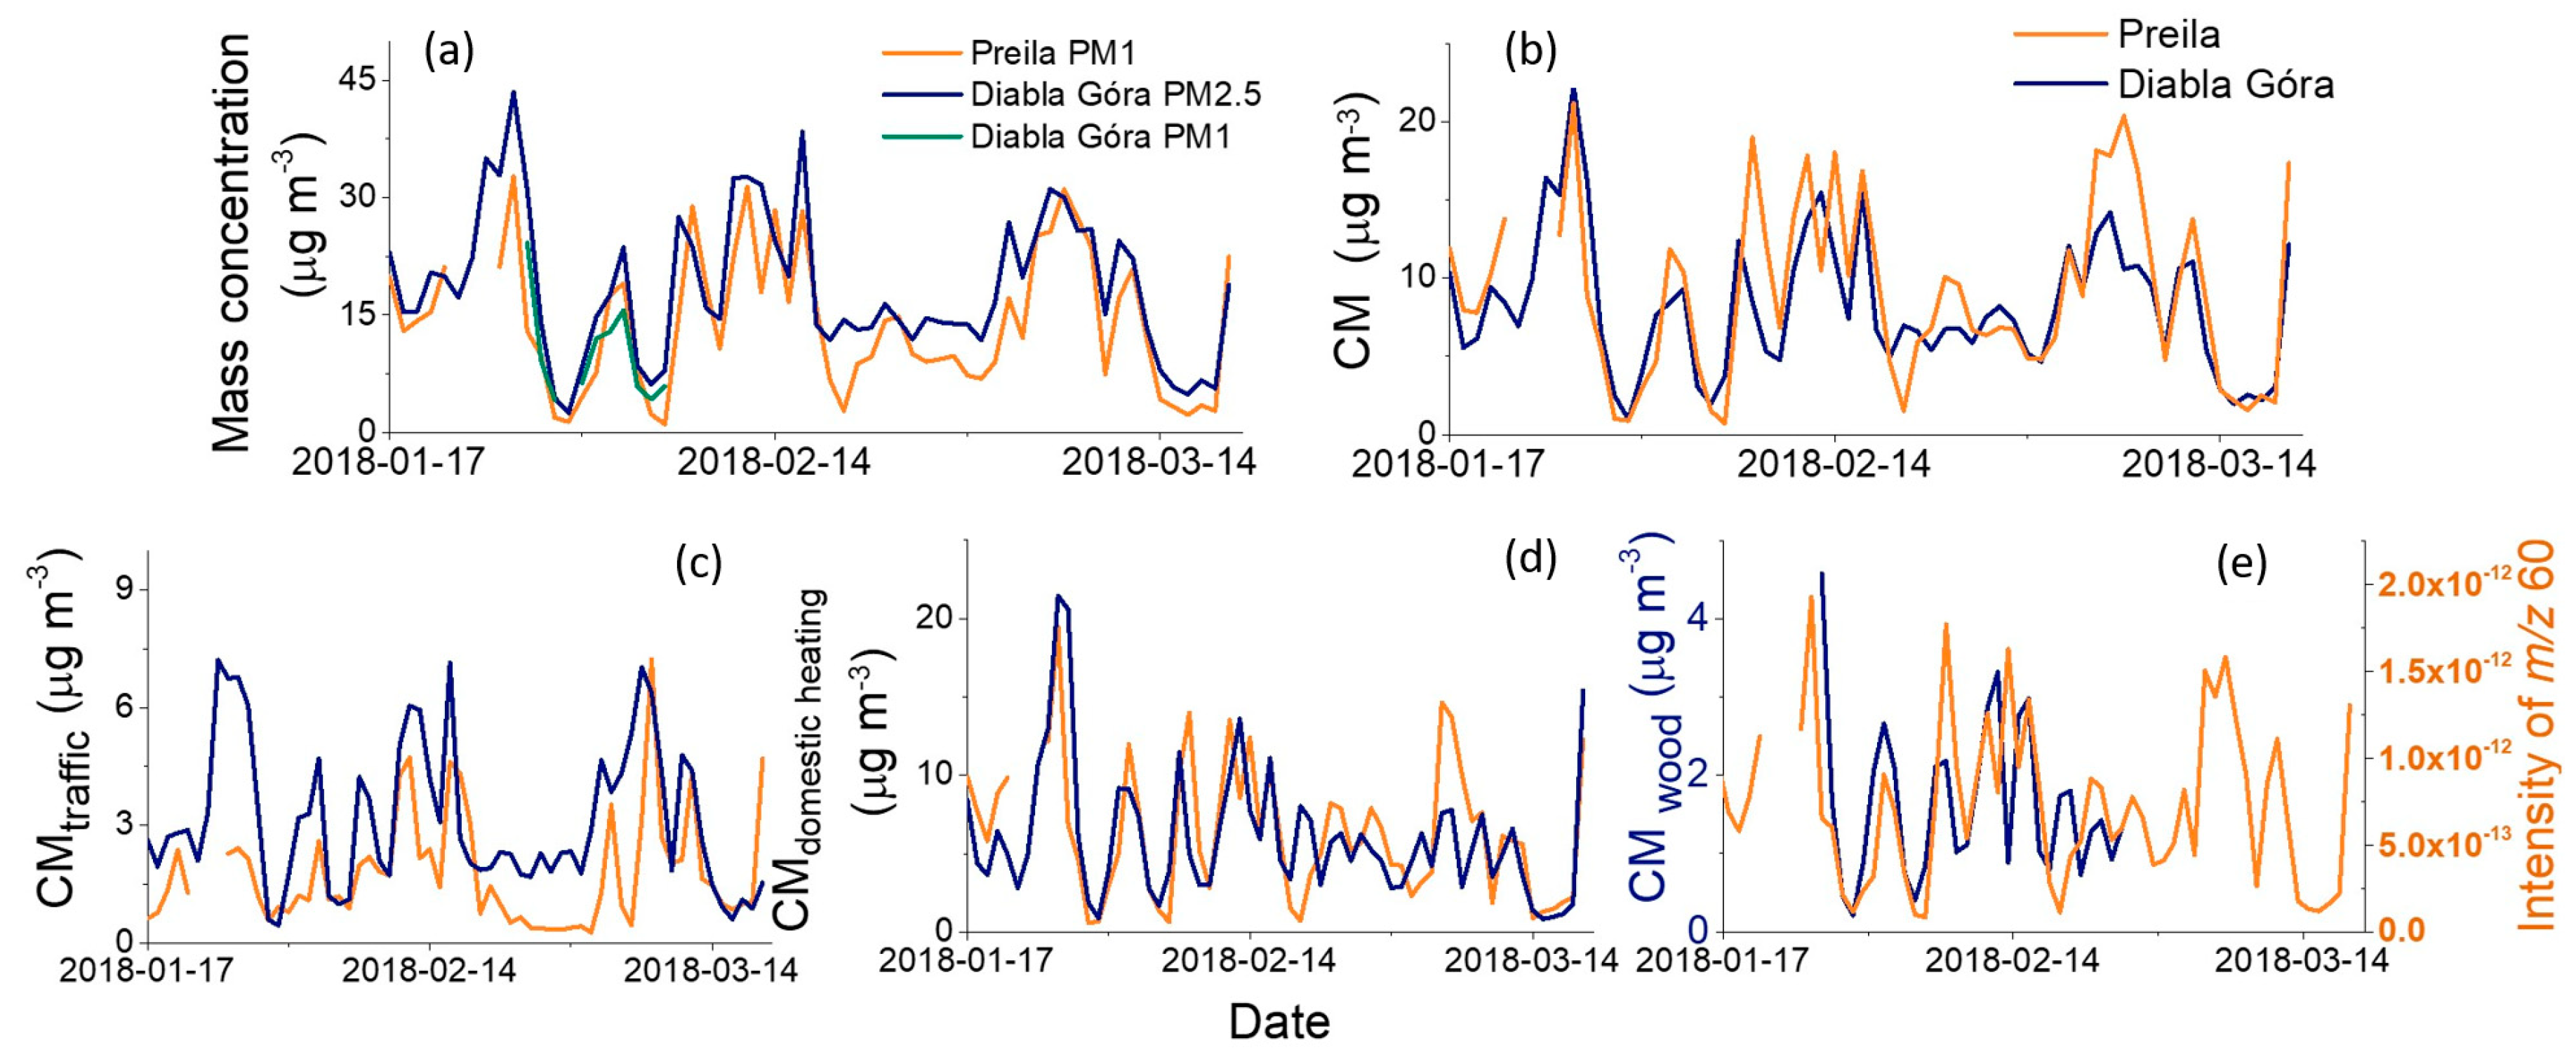
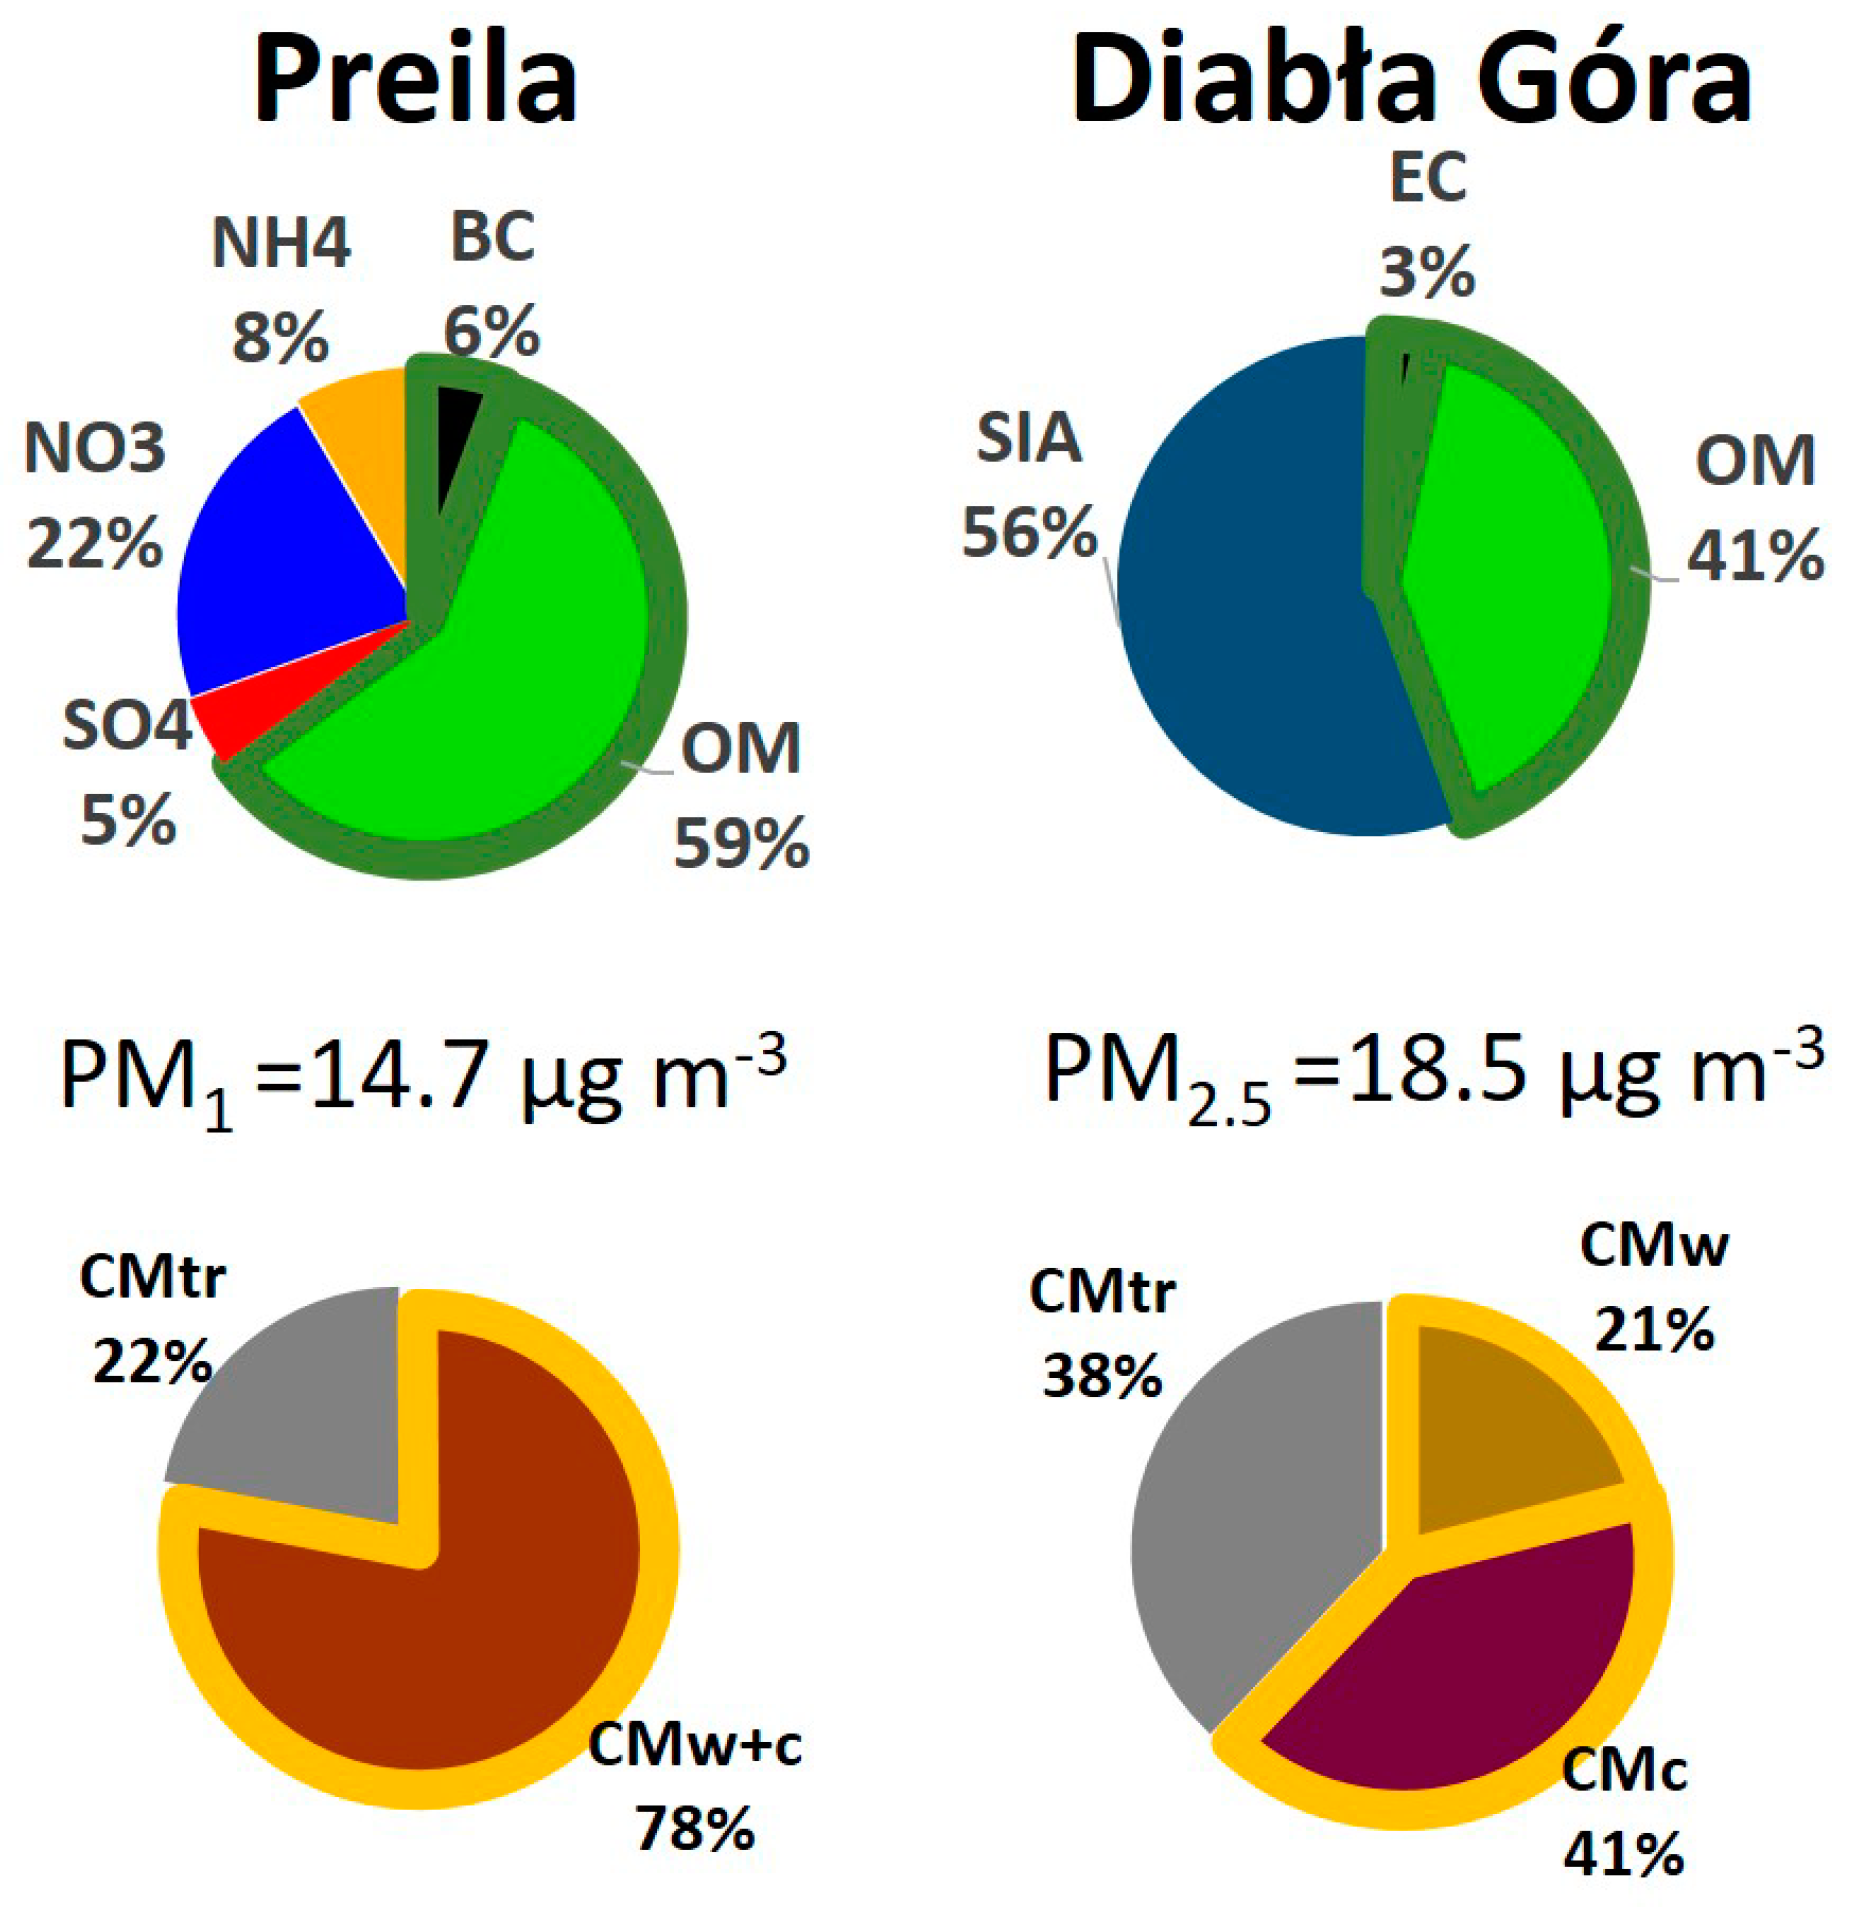
Data from the Preila site (see Section 2.2) were included to investigate the robustness of the Diabła Góra results. This probes the representativeness of Diabła Góra as a regional background site, and serves as quality control for the methods employed. We found a fair agreement for PM levels, carbonaceous fractions, and the subcategories thereof (sources), as shown in Figure 6 and Figure 7. For Diabła Góra, PM1 was available only for a few days (see Table 1). However, for those days, the difference between PM1 and PM2.5 was rather small (10.0 µg m−3 and 13.7 µg m−3). Furthermore, the results from each site were fairly similar despite different sampling size ranges used, indicating that PM1 was dominating PM2.5. The largest difference found between the sites was the traffic contribution, both the temporal variability (see Figure 6c) and average contribution to total CM (see Figure 7). This may reflect the fact that sources were more uncertain and/or that different methods were employed. Regarding wood combustion, levoglucosan data was not available for Preila. Therefore the ACSM signal intensity was plotted at m/z 60, as a proxy.
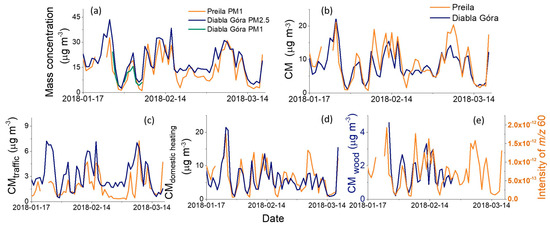
Figure 6.
Timeseries for Diabła Góra (blue) and Preila (orange). (a) PM1 (Preila and Diabła Góra) and PM2.5 (Diabła Góra). (b) Carbonaceous matter (CM) PM subfraction. (c) Traffic contribution to CM. (d) domestic heating contribution to CM. (e) wood burning contribution (subcategory of domestic heating) for Diabła Góra on the left y-axis. Right Y-axis shows ACSM signal intensity at m/z 60 for Preila, which is used to indicate wood burning influence.
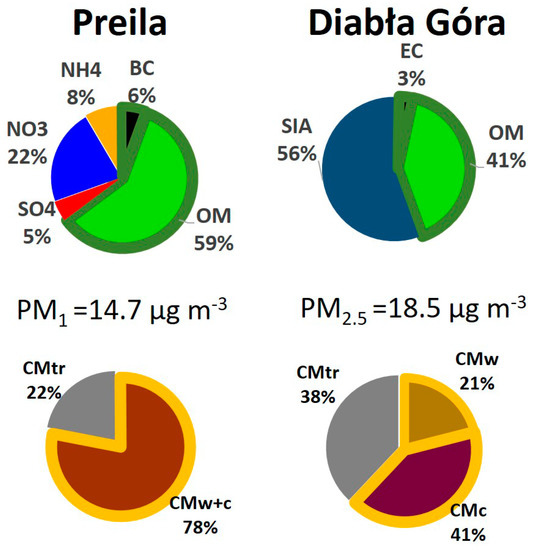
Figure 7.
Top: average contribution to PM chemical species. For Diabła Góra, Seconday Inorganic Aerosol (SIA) is calculated as the residual between PM2.5 and carbonaceous matter. Bottom: average source contribution to carbonaceous matter.
Notably, the last day included in our study was also the onset of the annual agricultural burns, which impacted on the regional air quality [65]. The fires, while banned in the European Union, were abundant throughout Kaliningrad on that day based on data from the MODIS satellite [66]. As the enclave spans the vast majority of the space in-between the two stations, both located within 23 km of its borders, we tentatively attributed this influence to the “residential” wood burning peak observed (see Figure 6d,e) at both sites.
5. Conclusions
A source apportionment for a rural background site in north-eastern Poland was performed during winter using low resolution 24-h data from PM2.5, OC/EC, levoglucosan, and high-resolution 1-h data from an aethalometer. CM constituted on average 44% of the measured average PM2.5 concentrations of 18.5 ± 9.3 µg m−3. Domestic wood and coal combustion and road traffic exhaust contributed 21, 41, and 38% respectively to CM concentrations on average. The source apportionment rested on several constraints and assumptions, why it should be repeated with relevant source markers and/or additional methods, where the sources could be constrained in a precise manner and add missing sources.
No specific individual source area in the near-region (<100 km) seemed to contribute to especially high concentrations or source contributions, while the emissions from the Katowice and Kraków area 500 km distance to Diabła Góra, resulted in relatively high 24-h concentrations and source contributions by the combined wood and coal combustion sources. All major cities to the south contributed to high source contributions from the traffic exhaust source. Meteorological factors did not influence the source contributions to a large extent.
Domestic coal combustion should be associated with AAE on the order of 2, similar to domestic wood combustion. This is important information for users of the aethalometer model for source apportionment. It is recommended not to only use the aethalometer instrument to seperate wood and coal combustion in an environment where both sources contribute, since it alone cannot help to distinguish between these sources.
Comparison with the nearby Lithuanian site Preila showed similar PM levels and subcategories, corroborating our results for Diabła Góra.
Author Contributions
A.K. wrote major part of the text in the manuscript and did most of the data analysis, performed some literature search, and prepared installations for AE33 before sending the instrument to the site. S.A. performed the meteorology influence analysis and did most of the literature search and wrote most of the introduction and meteorology influence on source apportionment sections. A.E. and E.A. contributed with discussions on source apportionments and AE33 data analysis, as well as performed the main part of correcting and proof-reading the written paper. S.B. managed the measurements and calibrations at Preila. J.P. analyzed the Preila data. A.E. and J.P. contributed with the site comparison. A.D. acted as principal investigator of the project, and planned and performed all Polish measurements. She wrote the sections about the analysis methods for PM2.5, PM1, OC/EC, and levoglucosan measurements. All authors have read and agreed to the published version of the manuscript.
Funding
The Swedish research council FORMAS, VR and the private foundation Crafoord have contributed to the AE33 measurements and the salaries of the Lund University people for performing their work on this paper. EU COST-action CA16109 COLOSSAL (Chemical On-Line cOmpo-Sition and Source Apportionment of fine aerosoL) granted a research visit to Lund University by Julija Pauraite. EMEP, ACTRIS and COLOSSAL are acknowledged for initiating the EMEP 2017/2018 intensive winter monitoring program (IMP 2018). PM2.5 measurements (sampling, concentration calculations and EC/OC content measurements) were performed within a contract with Chief Inspectorate of Environmental Protection, founded by National Fund for Environmental Protection and Water Management as part of State Environmental Monitoring. PM1 measurements (sampling, concentration calculations and EC/OC content measurements) and levoglucosan analysis were performed within a contract with the Polish Ministry of Environment.
Acknowledgments
We acknowledge the following people for their sampling and chemical analysis at the field site: PM1 and PM2.5 sampling at the station was performed by Urszula Białoskórska and Dorota Typiak-Nowak at the Institute of Environmental Protection–National Research Institute. AE33 measurements at the station and data acquisition were performed by Marcin Syrzycki and Jakub Bratkowski at the Institute of Environmental Protection–National Research Institute. PM1 and PM2.5 weighting was performed by Henryk Bruszewski at the Institute of Environmental Protection–National Research Institute. EC and OC analysis was performed by Barbara Mathews at the Polish Academy of Sciences, Institute of Environmental Engineering, Zabrze. The levoglucosan analysis was performed by Monika Asztemborska, Klara Nestorowicz at the Polish Academy of Sciences, Institute of Physical Chemistry, Warsaw.
Conflicts of Interest
Authors declare no conflict of interest.
References
- Lelieveld, J.; Klingmüller, K.; Pozzer, A.; Pöschl, U.; Fnais, M.; Daiber, A.; Münzel, T. Cardiovascular disease burden from ambient air pollution in Europe reassessed using novel hazard ratio functions. Eur. Heart J. 2019, 40, 1590–1596. [Google Scholar] [CrossRef] [PubMed]
- Englert, N. Fine particles and human health—A review of epidemiological studies. Toxicol. Lett. 2004, 149, 235–242. [Google Scholar] [CrossRef] [PubMed]
- Cho, S.-H.; Tong, H.; McGee, J.K.; Baldauf, R.W.; Krantz, Q.T.; Gilmour, M.I. Comparative Toxicity of Size-Fractionated Airborne Particulate Matter Collected at Different Distances from an Urban Highway. Environ. Health Perspect. 2009, 117, 1682–1689. [Google Scholar] [CrossRef] [PubMed]
- Baxter, L.K.; Duvall, R.M.; Sacks, J. Examining the effects of air pollution composition on within region differences in PM2.5 mortality risk estimates. J. Expo. Sci. Environ. Epidemiol. 2013, 23, 457–465. [Google Scholar] [CrossRef] [PubMed]
- Löndahl, J.; Massling, A.; Pagels, J.; Swietlicki, E.; Vaclavik, E.; Loft, S. Size-Resolved Respiratory-Tract Deposition of Fine and Ultrafine Hydrophobic and Hygroscopic Aerosol Particles During Rest and Exercise. Inhal. Toxicol. 2007, 19, 109–116. [Google Scholar] [CrossRef] [PubMed]
- Pope, C.A., 3rd; Burnett, R.T.; Thun, M.J. Lung Cancer, Cardiopulmonary Mortality, and Long-term Exposure to Fine Particulate Air Pollution. JAMA 2002, 287, 1132–1141. [Google Scholar] [CrossRef]
- Rückerl, R.; Schneider, A.; Breitner, S.; Cyrys, J.; Peters, A. Health effects of particulate air pollution: A review of epidemiological evidence. Inhal. Toxicol. 2011, 23, 555–592. [Google Scholar] [CrossRef]
- Pope, C.A.; Dockery, D.W. Health Effects of Fine Particulate Air Pollution: Lines that Connect. J. Air Waste Manag. Assoc. 2006, 56, 709–742. [Google Scholar] [CrossRef]
- IARC, International Agency for Research on Cancer (IARC). Outdoor Air Pollution. In Monographs on the Evaluation of Carcinogenic Risks to Humans; IARC: Lyon, France, 2016; Volume 109. [Google Scholar]
- Janssen, N.A.H.; Hoek, G.; Simic-Lawson, M.; Fischer, P.; van Bree, L.; ten Brink, H.; Keuken, M.; Atkinson, R.W.; Anderson, H.R.; Brunekreef, B.; et al. Black Carbon as an Additional Indicator of the Adverse Health Effects of Airborne Particles Compared with PM10 and PM2.5. Environ. Health Perspect. 2011, 119, 1691–1699. [Google Scholar] [CrossRef]
- Janssen, N.A.H.; Gerlofs-Nijland, M.E.; Lanki, T.; Salonen, R.O.; Cassee, F.; Hoek, G.; Fischer, P.; Brunekreef, B.; Kzyzanowski, M. Health Effects of Black Carbon; The WHO European Centre for Environment and Health: Bonn, Germany; World Health Organisation Regional Office for Europe: Copenhagen, Denmark, 2012. [Google Scholar]
- Grahame, T.J.; Klemm, R.; Schlesinger, R.B. Public health and components of particulate matter: The changing assessment of black carbon. J. Air Waste Manag. Assoc. 2014, 64, 620–660. [Google Scholar] [CrossRef]
- Laskin, A.; Laskin, J.; Nizkorodov, S.A. Chemistry of atmospheric brown carbon. Chem. Rev. 2015, 115, 4335–4382. [Google Scholar] [CrossRef] [PubMed]
- Alfarra, M.R.; Prevot, A.S.H.; Szidat, S.; Sandradewi, J.; Weimer, S.; Lanz, V.A.; Schreiber, D.; Mohr, M.; Baltensperger, U. Identification of the Mass Spectral Signature of Organic Aerosols from Wood Burning Emissions. Environ. Sci. Technol. 2007, 41, 5770–5777. [Google Scholar] [CrossRef] [PubMed]
- Kocbach, A.; Li, Y.; Yttri, K.E.; Cassee, F.R.; Schwarze, P.E.; Namork, E. Physicochemical characterisation of combustion particles from vehicle exhaust and residential wood smoke. Part. Fibre Toxicol. 2006, 3, 1. [Google Scholar] [CrossRef] [PubMed]
- Canagaratna, M.R.; Jayne, J.T.; Ghertner, D.A.; Herndon, S.; Shi, Q.; Jimenez, J.L.; Silva, P.J.; Williams, P.; Lanni, T.; Drewnick, F. Chase Studies of Particulate Emissions from in-use New York City Vehicles. Aerosol Sci. Technol. 2004, 38, 555–573. [Google Scholar] [CrossRef]
- Pöschl, U. Atmospheric Aerosols: Composition, Transformation, Climate and Health Effects. Angew. Chem. Int. Ed. 2005, 44, 7520–7540. [Google Scholar] [CrossRef]
- Petzold, A.; Ogren, J.A.; Fiebig, M.; Laj, P.; Li, S.-M.; Baltensperger, U.; Holzer-Popp, M.; Kinne, S.; Pappalardo, G.; Sugimoto, N.; et al. Recommendations for reporting “black carbon” measurements. Atmos. Chem. Phys. 2013, 13, 8365–8379. [Google Scholar] [CrossRef]
- Kirchstetter, T.W.; Novakov, T.; Hobbs, P.V. Evidence that the spectral dependence of light absorption by aerosols is affected by organic carbon. J. Geophys. Res. Atmos. 2004, 109. [Google Scholar] [CrossRef]
- Sandradewi, J.; Prevot, A.S.H.; Szidat, S.; Perron, N.; Alfarra, M.R.; Lanz, V.A.; Weingartner, E.; Baltensperger, U. Using Aerosol Light Absorption Measurements for the Quantitative Determination of Wood Burning and Traffic Emission Contributions to Particulate Matter. Environ. Sci. Technol. 2008, 42, 3316–3323. [Google Scholar] [CrossRef]
- Zotter, P.; Herich, H.; Gysel, M.; El-Haddad, I.; Zhang, Y.; Mocnik, G.; Hüglin, C.; Baltensperger, U.; Szidat, S.; Prevot, A.S.H. Evaluation of the absorption Ångström exponents for traffic and wood burning in the Aethalometer-based source apportionment using radiocarbon measurements of ambient aerosol. Atmos. Chem. Phys. 2017, 17, 4229–4249. [Google Scholar] [CrossRef]
- Zhang, G.; Peng, L.; Lian, X.; Lin, Q.; Bi, X.; Chen, D.; Li, M.; Li, L.; Wang, X.; Sheng, G. An improved Absorption Ångström Exponent (AAE)-Based method for evaluating the contribution of light absorption from brown carbon with a high-time resolution. Aerosol Air Qual. Res. 2018, 19, 15–24. [Google Scholar] [CrossRef]
- Diapouli, E.; Kalogridis, A.-C.; Markontanaki, C.; Vratolis, S.; Fetfatzis, P.; Colombi, C.; Eleftheriadis, E. Annual variability of Black Carbon concentrations originating from biomass and fossil fuel combustion for the suburban aerosol in Athens, Greece. Atmosphere 2017, 8, 234. [Google Scholar] [CrossRef]
- Martinsson, J.; Eriksson, A.; Elbæk Nielsen, I.; Malmborg, V.; Ahlberg, E.; Andersen, C.; Lindgren, R.; Nyström, R.; Nordin, E.; Brune, W.; et al. Impacts of Combustion Conditions and Photochemical Processing on the Light Absorption of Biomass Combustion Aerosol. Environ. Sci. Technol. 2015, 49, 14663–14671. [Google Scholar] [CrossRef] [PubMed]
- Garg, S.; Chandra, B.P.; Sinha, V.; Sarda-Esteve, R.; Gros, V.; Sinha, B. Limitation of the Use of the Absorption Angstrom Exponent for Source Apportionment of Equivalent Black Carbon: A Case Study from the North West Indo-Gangetic Plain. Environ. Sci. Technol. 2016, 50, 814–824. [Google Scholar] [CrossRef] [PubMed]
- Saleh, R.; Cheng, Z.; Atwi, K. The Brown–Black Continuum of Light-Absorbing Combustion Aerosols. Environ. Sci. Technol. Lett. 2018, 5, 508–513. [Google Scholar] [CrossRef]
- Malmborg, V. Characteristics of Particulate Emissions from Low Temperature Combustion and Renewable Fuels: Aerosol Mass Spectrometry of Refractory Carbonaceous Particles; Lund University: Lund, Sweden, 2020. [Google Scholar]
- Prasad, A.K.; Singh, R.P.; Kafatos, M. Influence of coal based thermal power plants on aerosol optical properties in the Indo-Gangetic basin. Geophys. Res. Lett. 2006, 33. [Google Scholar] [CrossRef]
- Singh, R.P.; Kumar, S.; Singh, A.K. Elevated black carbon concentrations and atmospheric pollution around Singrauli coal-fired thermal power plants (India) using ground and satellite data. Int. J. Environ. Res. Public Health 2018, 15, 2472. [Google Scholar] [CrossRef]
- Bond, T.C.; Bussemer, M.; Wehner, B.; Keller, S.; Charlson, R.J.; Heintzenberg, J. Light Absorption by Primary Particle Emissions from a Lignite Burning Plant. Environ. Sci. Technol. 1999, 33, 3887–3891. [Google Scholar] [CrossRef]
- Bond, T.C.; Covert, D.S.; Kramlich, J.C.; Larson, T.V.; Charlson, R.J. Primary particle emissions from residential coal burning: Optical properties and size distributions. J. Geophys. Res. Atmos. 2002, 107. [Google Scholar] [CrossRef]
- Sun, J.; Zhi, G.; Hitzenberger, R.; Chen, Y.; Tian, C.; Zhang, Y.; Feng, Y.; Cheng, M.; Zhang, Y.; Cai, J.; et al. Emission factors and light absorption properties of brown carbon from household coal combustion in China. Atmos. Chem. Phys. 2017, 17, 4769–4780. [Google Scholar] [CrossRef]
- Simoneit, B.R.T. Biomass burning—A review of organic tracers for smoke from incomplete combustion. Appl. Geochem. 2002, 17, 129–162. [Google Scholar] [CrossRef]
- Bhattarai, H.; Saikawa, E.; Wan, X.; Zhu, H.; Ram, K.; Gao, S.; Kang, S.; Zhang, Q.; Zhang, Y.; Wu, G.; et al. Levoglucosan as a tracer of biomass burning: Recent progress and perspectives. Atmos. Res. 2019, 220, 20–33. [Google Scholar] [CrossRef]
- Gelencsér, A.; May, B.; Simpson, D.; Sanchez-Ochoa, A.; Kasper-Giebl, A.; Puxbaum, H.; Caseiro, A.; Pio, C.; Legrand, M. Source apportionment of PM2.5 organic aerosol over Europe: Primary/secondary, natural/anthropogenic, and fossil/biogenic origin. J. Geophys. Res. Atmos. 2007, 112. [Google Scholar] [CrossRef]
- Reche, C.; Vian, M.; Amato, F.; Alastuey, A.; Moreno, T.; Hillamo, R.; Teinilä, K.; Saarnio, K.; Seco, R.; Peñuelas, J. Biomass burning contributions to urban aerosols in a coastal Mediterranean City. Sci. Total. Environ. 2012, 427, 175–190. [Google Scholar] [CrossRef] [PubMed]
- Stracquadanio, M.; Petralia, E.; Berico, M.; La Toretta, T.M.G.; Malaguti, A.; Mircea, M.; Gualtieri, M.; Ciancarella, L. Source Apportionment and Macro Tracer: Integration of Independent Methods for Quantification of Woody Biomass Burning Contribution to PM10. Aerosol Air Qual. Res. 2018, 19, 711. [Google Scholar] [CrossRef]
- Puxbaum, H.; Casiro, A.; Sanchez-Ochoa, A.; Kasper-Giebel, A.; Claeys, M.; Gelencsér, A.; Legrand, M.; Preunkert, S.; Pio, C. Levoglucosan levels at background sites in Europe for assessing the impact of biomass combustion on the European aerosol background. J. Geophys. Res. Atmos. 2007, 112. [Google Scholar] [CrossRef]
- Simpson, D.; Yttri, K.E.; Klimont, Z.; Kupiainen, K.; Caseiro, A.; Gelencsér, A.; Pio, C.; Puxbaum, H.; Legrand, M. Modeling carbonaceous aerosol over Europe: Analysis of the CARBOSOL and EMEP EC/OC campaigns. J. Geophys. Res. Atmos. 2007, 112. [Google Scholar] [CrossRef]
- Utry, N.; Ajtaj, T.; Filep, Á.; Pintér, M.; Török, Z.S.; Bozóki, Z.; Szabó, G. Correlations between absorption Angström exponent (AAE) of wintertime ambient urban aerosol and its physical and chemical properties. Atmos. Environ. 2014, 91, 52–59. [Google Scholar] [CrossRef]
- Maenhaut, W.; Vermeylen, R.; Claeys, M.; Vercauteren, J.; Matheeussen, C.; Roekens, E. Assessment of the contribution from wood burning to the PM10 aerosol in Flanders, Belgium. Sci. Total Environ. 2012, 437, 226–236. [Google Scholar] [CrossRef]
- Caseiro, A.; Bauer, H.; Schmidl, C.; Pio, C.A.; Puxbaum, H. Wood burning impact on PM10 in three Austrian regions. Atmos. Environ. 2009, 43, 2186–2195. [Google Scholar] [CrossRef]
- OECD. Energy and Air Pollution: World Energy Outlook Special Report 2016; OECD/IEA: Paris, France, 2016. [Google Scholar]
- Weagle, C.L.; Sinder, G.; Li, C.; van Donkelaar, A.; Philip, S.; Bissonnette, P.; Burke, J.; Jackson, J.; Latimer, R.; Stone, E.; et al. Global Sources of Fine Particulate Matter: Interpretation of PM2.5 Chemical Composition Observed by SPARTAN using a Global Chemical Transport Model. Environ. Sci. Technol. 2018, 52, 11670–11681. [Google Scholar] [CrossRef]
- Reizer, M.; Juda-Rezler, K. Explaining the high PM10 concentrations observed in Polish urban areas. Air Qual. Atmos. Health 2015, 9, 517–531. [Google Scholar] [CrossRef] [PubMed]
- Witkowska, A.; Levandowska, A.U.; Saniewska, D.; Falkowska, L.M. Effect of agriculture and vegetation on carbonaceous aerosol concentrations (PM2.5 and PM10) in Puszcza Borecka National Nature Reserve (Poland). Air Qual. Atmos. Health 2016, 9, 761–773. [Google Scholar] [CrossRef] [PubMed]
- Rogula-Kozłowska, W.; Klejnowski, K.; Rogula-Kopiec, P.; Ośródka, L.; Krajny, E.; Błaszczak, B.; Mathews, B. Spatial and seasonal variability of the mass concentration and chemical composition of PM 2.5 in Poland. Air Qual. Atmos. Health 2014, 7, 41–58. [Google Scholar] [CrossRef] [PubMed]
- Zielinski, T.; Petelski, T.; Strzalkowska, A.; Pakszys, P.; Makuch, P. Impact of wild forest fires in Eastern Europe on aerosol composition and particle optical properties. Oceanologia 2016, 58, 13–24. [Google Scholar] [CrossRef]
- Markowicz, K.M.; Chilinski, M.T.; Lisok, J.; Zawadzka, O.; Stachlweska, I.S.; Janicka, L.; Rozwadowska, A.; Makuch, P.; Pakszys, P.; Zielinski, T. Study of aerosol optical properties during long-range transport of biomass burning from Canada to Central Europe in July 2013. J. Aerosol Sci. 2016, 101, 156–173. [Google Scholar] [CrossRef]
- GIOŚ. Roczna Ocena Jakości Powietrza w Województwie Warmińsko-Mazurskim; Raport wojewódzki za rok 2018; Główny Inspektorat Ochrony Środowiska: Olsztyn, Poland, 2019. (in Polish) [Google Scholar]
- Pauraitė, J.; Mordas, G.; Byčenkienė, S.; Ulevicius, V. Spatial and temporal analysis of organic and black carbon mass concentrations in Lithuania. Atmosphere 2015, 6, 1229–1242. [Google Scholar] [CrossRef]
- Middlebrook, A.M.; Bahreini, R.; Jimenez, J.L.; Canagaratna, M.R. Evaluation of Composition-Dependent Collection Efficiencies for the Aerodyne Aerosol Mass Spectrometer using Field Data. Aerosol Sci. Technol. 2012, 46, 258–271. [Google Scholar] [CrossRef]
- Klejnowski, K.; Janoszka, K.; Czaplicka, M. Characterization and Seasonal Variations of Organic and Elemental Carbon and Levoglucosan in PM10 in Krynica Zdroj, Poland. Atmosphere 2017, 8, 190. [Google Scholar] [CrossRef]
- Drinovec, L.; Mocnik, G.; Zotter, P.; Prevot, A.S.H.; Ruckstuhl, C.; Coz, E.; Rupakheti, M.; Sciare, J.; Müller, T.; Wiedensohler, A.; et al. The” dual-spot” Aethalometer: An improved measurement of aerosol black carbon with real-time loading compensation. Atmos. Meas. Tech. 2015, 8, 1965–1979. [Google Scholar] [CrossRef]
- Martinsson, J.; Azeem, H.A.; Sporre, M.K.; Bergström, R.; Ahlberg, E.; Öström, E.; Kristensson, A.; Swietlicki, E.; Eriksson Stenström, K. Carbonaceous aerosol source apportionment using the Aethalometer model—Evaluation by radiocarbon and levoglucosan analysis at a rural background site in southern Sweden. Atmos. Chem. Phys. 2017, 17, 4265–4281. [Google Scholar] [CrossRef]
- Draxler, R.; Rolph, G. HYSPLIT (HYbrid Single-Particle Lagrangian Integrated Trajectory); NOAA Air Resources Laboratory: Silver Spring, MD, USA, 2003. Available online: http://www.arl.noaa.gov/ready/hysplit4.html (accessed on 5 March 2020)model access via NOAA ARL READY website.
- Hedberg, E.; Johansson, C.; Johansson, L.; Swietlicki, E.; Brorström-Lundén, E. Is Levoglucosan a Suitable Quantitative Tracer for Wood Burning? Comparison with Receptor Modeling on Trace Elements in Lycksele, Sweden. J. Air Waste Manag. Assoc. 2006, 56, 1669–1678. [Google Scholar] [CrossRef] [PubMed]
- Hennigan, C.J.; Sullivan, A.P.; Collet, J.L., Jr.; Robinson, A.L. Levoglucosan stability in biomass burning particles exposed to hydroxyl radicals. Geophys. Res. Lett. 2010, 37. [Google Scholar] [CrossRef]
- CAN Europe. Climate Action Network Europe Initiative of the Europe Beyond Coal campaign. In Last Gasp: The Coal Companies Making Europe Sick; CAN Europe: Brussels, Belgium, 2018. [Google Scholar]
- Kumar, N.K.; Corbin, J.C.; Bruns, E.A.; Massabo, D.; Slowik, J.G.; Drinovec, L.; Mocnik, G.; Prati, P.; Vlachou, A.; Baltensperger, U.; et al. Production of particulate brown carbon during atmospheric aging of residential wood-burning emissions. Atmos. Chem. Phys. 2018, 18, 17843–17861. [Google Scholar] [CrossRef]
- Zanatta, M.; Gysel, M.; Bukowiecki, N.; Müller, T.; Weingartner, E.; Areskoug, H.; Fiebig, M.; Yttri, K.E.; Mihalopoulos, N.; Kouvarakis, G.; et al. A European aerosol phenomenology-5: Climatology of black carbon optical properties at 9 regional background sites across Europe. Atmos. Environ. 2016, 145, 346–364. [Google Scholar] [CrossRef]
- Healy, R.M.; Sofowote, U.; Su, Y.; Debosz, J.; Noble, M.; Jeong, C.-H.; Wang, J.M.; Hilker, N.; Evans, G.J.; Doerksen, G.; et al. Ambient measurements and source apportionment of fossil fuel and biomass burning black carbon in Ontario. Atmos. Environ. 2017, 161, 34–47. [Google Scholar] [CrossRef]
- Lack, D.A.; Cappa, C.D. Impact of brown and clear carbon on light absorption enhancement, single scatter albedo and absorption wavelength dependence of black carbon. Atmos. Chem. Phys. Discuss. 2010, 10, 4207–4220. [Google Scholar] [CrossRef]
- Śląskie. Jakość Powietrza. Available online: https://powietrze.slaskie.pl/content/jakosc-powietrza (accessed on 27 January 2020).
- Ulevicius, V.; Byčenkienė, S.; Bozzetti, C.; Vlachaou, A.; Plauskaite, K.; Mordas, G.; Dudoitis, V.; Abbaszade, G.; Remeikis, V.; Garbaras, A.; et al. Fossil and non-fossil source contributions to atmospheric carbonaceous aerosols during extreme spring grassland fires in Eastern Europe. Atmos. Chem. Phys. 2016, 16, 5513–5529. [Google Scholar] [CrossRef]
- NASA. Fire Information for Resource Management System. 2020. Available online: https://firms.modaps.eosdis.nasa.gov/ (accessed on 5 March 2020).
© 2020 by the authors. Licensee MDPI, Basel, Switzerland. This article is an open access article distributed under the terms and conditions of the Creative Commons Attribution (CC BY) license (http://creativecommons.org/licenses/by/4.0/).

