Abstract
Previous investigations have reported that the impacts of the preceding climate signal in the Southern Hemisphere can extend to Northern Hemisphere middle latitudes during the following season. This study suggests that the positive (negative) boreal autumn south Pacific Ocean dipole (SPOD) sea surface temperature anomalies are usually followed by reduced (increased) precipitation in the following winter over the North American monsoon (NAM) region. The positive autumn SPOD has the potential to regulate the southward fluctuation of the eddy-driven westerly jet in the southern Pacific Ocean, and exert the Rossby wave train stretching across the Pacific Ocean to transport the related energy into the NAM region. This finally results in anomalous high pressure in the troposphere over the NAM region. The related sinking motion and the water vapor conditions further affect the precipitation variability in these regions. This entire process can be referred to as a “coupled oceanic–atmospheric bridge”, in which the “oceanic bridge” is the SPOD and the “atmospheric bridge” is the response of atmospheric circulation in the Pacific Ocean.
1. Introduction
In recent years, the interaction between the Northern and Southern hemispheres (NH and SH) has received increasing attention, especially the influence of the SH on the NH’s climate. For instance, as the dominant climate mode, the southern annular mode (SAM) and its related air–sea interactions can propagate their influence into the NH in various seasons. The positive spring SAM not only tends to decrease the dust weather frequency over northern China [1] and increase the summer surface air temperature over northeast China [2], but is also significantly linked to the weak East Asian monsoon [3,4,5], South China Sea monsoon [6], Indian monsoon [7], North American summer monsoon [8], and West African summer monsoon [9]. During summer, the SAM has the potential to regulate typhoon activity over the western North Pacific [10]. During winter, the influence of SAM is apparent in the spring precipitation over southern China [11] and also in the meridional circulation [12,13]. For autumn, the SAM can cross-seasonally modulate the behavior of the winter monsoon in China. A positive autumn SAM always heralds a weaker winter monsoon and warmer air temperatures in China via SAM-related sea surface temperature (SST) anomalies (SSTAs) that influence the meridional circulation [14]. In addition, the positive (negative) autumn SAM signal can also regulate the NH subtropical westerly jet [15] or intertropical convergence zone in the Pacific [16], inducing an anticyclonic (cyclonic) circulation with decreased (increased) winter precipitation over southern China. In addition to the atmospheric signal, the SST anomalies in the southern Indian Ocean [17] and southern Pacific Ocean [18,19] also act as precursors to the development of El Niño–Southern Oscillation (ENSO) events.
Such cross-equatorial and cross-seasonal impacts of the air or sea signals from the SH provide an additional source of predictability for NH climate, especially for the East Asian monsoon (EAM) region. The North American monsoon (NAM) is an important member of the global monsoon family [20]. The NAM region covers much of the northwestern Mexico and the southwestern United States [21]. The NAM exhibits a distinct seasonal reversal of the wind direction in the upper and lower levels of the troposphere [22,23]. As with its East Asian counterpart, climate variability in the NAM region has a significant influence on water resources, industrial and agricultural production, and public infrastructure facilities. Much effort has been made to explore the NAM in the summer season and its regional climate influence [22]. In addition, the previous studies reported the influence of Madden Julian Oscillation (MJO) on the winter climate variability in North America on intraseasonal scale [24,25,26]. However, little attention has been focused on the winter interannual climate variability in the NAM region to explore its possible precursors, especially from the perspective of the extratropical SH. Recent studies have shown that the climatic influence on the NH originating from the SH presents zonally consistent features [12,13]. Those previous studies reported that the SAM and its related air–sea interactions in the Southern Ocean can regulate both summer and winter climate variability over the EAM region. As with its East Asian counterpart, it has also been proposed that the positive spring SAM is associated with warmer spring and summer SST in the tropical Atlantic, which regulates the Bermuda High and correspondingly weakens the North American summer monsoon with decreased precipitation. Thus, it seems reasonable to explore the influence of possible precursors in the extratropical SH on winter climate variability in the NAM region, which has not yet been examined. In this study, we investigate a possible dynamic link between boreal autumn SST anomalies in the southern Pacific Ocean (SPO) and winter precipitation in the NAM region. The remainder of this paper is organized as follows. The datasets and methodology are described in Section 2. Section 3 provides an outline of the relationship between the boreal autumn SAM and winter precipitation in the NAM. And we explore in detail the physical mechanisms responsible for this relationship. Finally, a discussion and our concluding remarks are presented in Section 4.
2. Data and Methodology
2.1. Datasets
We used the following monthly precipitation datasets: (1) the Climate Prediction Center (CPC) Merged Analysis of Precipitation dataset, gridded at 2.5° × 2.5° resolution (CMAP); (2) the Global Precipitation Climatology Project (GPCP) Combined Precipitation dataset version 2.3 with a 2.5° × 2.5° global grid; (3) National Oceanic and Atmospheric Administration (NOAA)’s Precipitation Reconstruction dataset with a horizontal resolution of 2.5° × 2.5° (PREC); and (4) NOAA’s Precipitation Reconstruction over Land dataset with a horizontal resolution of 1.0° × 1.0° (PRECL). The atmospheric variables were obtained from the National Centers for Environmental Prediction–National Center for Atmospheric Research (NCEP/NCAR) reanalysis dataset, which has a horizontal resolution of 2.5° × 2.5°. SST data were extracted from the NOAA Extended Reconstructed SST (ERSST) version 5 (ERSST v5) dataset gridded at 2.0° × 2.0°. The Ninõ 3.4 index from the NOAA Climate Prediction Center was selected to represent the variability of ENSO. Our study period of 1979–2018 was selected to take advantage of the marked improvement in SH data quality that followed the onset of satellite observations. The long-term climatology (1980–2009) was removed from all data to form anomalies. In this paper, autumn (September, October, and November: SON) and winter (December, January, and February: DJF) refer to the boreal seasons.
2.2. Methodology
We used singular value decomposition (SVD) analysis to investigate the coupled connection between autumn SSTAs in the SPO and winter precipitation in the NAM region. To explore the possible physical mechanism, we used correlation, composite, and regression analysis. The results were robust for these three analysis techniques, and the results based on the correlation analysis are presented in this paper. We also conducted a two-tailed Student t test with the appropriate number of degrees of freedom [27] to statistically test the correlation coefficients of highly auto-correlated variable, such as SST in this study. We employed the partial correlation to exclude the influence of ENSO. For two variables and , the partial correlation after removing the effect of (as the ENSO in this study) is calculated as follows:
To provide better dynamic insights into the influence of SST anomalies on the atmosphere, we used the Rossby wave ray-tracing method to investigate the transport of the energy associated with the stationary Rossby wave. This method has been widely used to detect the trajectory of teleconnection patterns [5,6,28,29,30,31,32,33,34]. Based on horizontally nonuniform basic flow, the wave rays can explain various interhemispheric teleconnection phenomena. More detail regarding the Rossby wave ray-tracing method can be found in the study of Zhao et al. [31].
3. Results
3.1. Coupled Connection between the Autumn SSTAs in the SPO and Winter Precipitation in the NAM Region
Figure 1 presents the leading mode of the autumn SSTAs (Figure 1e–h) in the SPO and the corresponding winter precipitation pattern (Figure 1a–d) in the NAM region for the precipitation datasets described above. The explained covariance associated with the CMAP, GPCP, PREC, and PRECL datasets is 37.45%, 33.48%, 36.96%, and 30.76%, respectively. The oceanic signals are characterized by a dipole-like SSTAs in the SPO, with positive SSTAs in the middle latitudes and negative SSTAs in the high latitudes. In the following winter precipitation fields, large areas with a significant negative correlation cover the southwestern United States and northwestern Mexico, which is the scope of the NAM region. These results are independent of the choice of precipitation data and indicate that the dipole-like SSTAs in the SPO is usually the potential precursor for the following winter precipitation variability in the NAM region. Unless otherwise stated, the results are based on CMAP data.
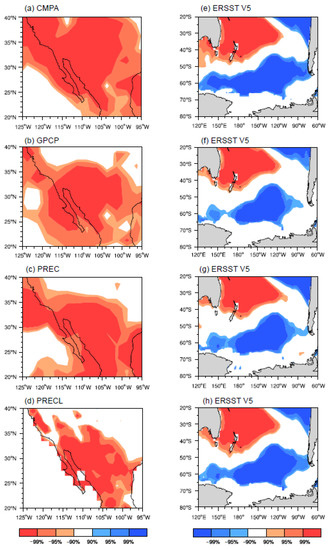
Figure 1.
Heterogeneous correlation maps of the leading singular value decomposition (SVD) mode for winter precipitation in the North American monsoon (NAM) region calculated using the (a) CPC Merged Analysis of Precipitation (CMAP), (b) GPCP, (c) Precipitation Reconstruction (PREC), and (d) Precipitation Reconstruction over Land (PRECL) datasets, and (e–h) autumn sea surface temperature (SST) in the South Pacific Ocean based on the ERSST V5 datasets. The shading indicates significance at the 90%, 95%, and 99% confidence levels.
The ENSO plays an important role in affecting the regional climate in the NAM region [21]. Moreover, there are mutual correlations between ENSO and the SSTAs in the SPO [18]. To confirm whether or not the above coupled relationship results depend on the influence of ENSO, we used the partial correlation as introduced in Section 2 to eliminate the possible influence of the ENSO signal. We defined the NAM precipitation index (NAMPI) as the corresponding leading mode of the time series from the SVD analysis, which is dominated the interannual variability (Figure 2 red line). Figure 3 presents a map of the partial correlation between the autumn SSTAs in the SPO and the winter NAMPI without the influence of the ENSO signal. The oceanic signal is also characterized by a typical dipole pattern of SSTAs between the high and mid-latitudes of the SH. To quantitatively depict the variability in the SPO dipole (SPOD) SSTAs, we defined the SPOD index (SPODI) as:
where [SSTAs]A and [SSTAs]B represent the normalized average SSTAs for the—boxes A, and B, respectively, in Figure 3. The autumn SPODI (Figure 2 blue line) is significantly correlated with the winter NAMPI, with a correlation coefficient of −0.75, which is significant at the 99% confidence level. This relationship is also significant at the 99% confidence level after removing the ENSO signal and has a correlation coefficient of −0.67. These results of the partial correlation analysis further indicate that the correlation between the autumn SPOD and winter precipitation in the NAM region remains robust even after removal of the ENSO signal and that the rich (less) winter precipitation in the NAM region is significantly related to the strength (weaken) of the SPOD in the preceding autumn. Thus, the autumn SPOD is one possible factor that affects winter precipitation in the NAM region. Unless otherwise stated, the ENSO signal has been removed from the results reported below.
SPODI = [SSTAs]A − [SSTAs]B
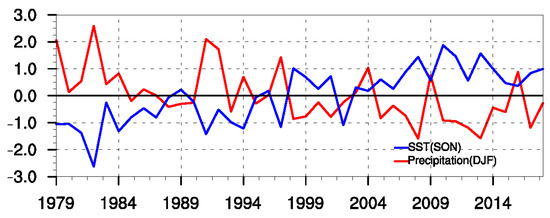
Figure 2.
The time series of winter NAM precipitation index (NAMPI) (red line) and autumn SPOD index (SPODI) (blue line).
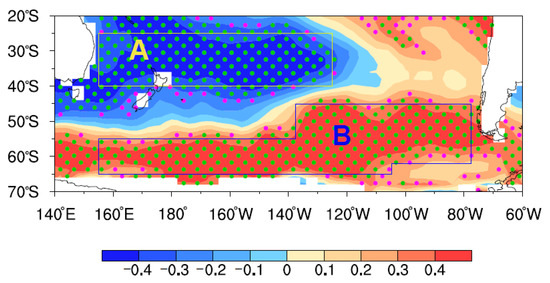
Figure 3.
Partial correlation map between the winter NAMPI and autumn sea surface temperature anomalies (SSTAs)s without the El Niño–Southern Oscillation (ENSO) signal. The magenta and green stippled areas indicate statistical significance at the 90% and 95% confidence levels, respectively.
3.2. Possible Physical Mechanisms
3.2.1. Persistence of the Autumn SPOD
As mentioned above, the autumn SPOD has the potential to influence precipitation during the following winter in the NAM region. Given the oceanic memory, we now consider the bridge role of the underlying ocean to explore the possible physical processes responsible for this cross-equatorial and cross-seasonal relationship. Figure 4 presents a map of the correlations between SSTAs and autumn SPODI cases. There is a prominent meridional dipole pattern, manifesting as out-of-phase variations in the SSTAs between the high and mid-latitudes in the SPO. In addition, the winter SPODI exhibits a highly consistent variability with the autumn SPODI, both before and after the removal of the ENSO signal, with correlation coefficients of 0.83 and 0.78, respectively (significant above the 99% confidence level with an effective number of degrees of freedom). Moreover, the winter SPODI is also closely correlated with the winter NAMPI, with correlation coefficients before and after removal of the ENSO signal of −0.79 and −0.70, respectively, which are both significant over the 99% level. Furthermore, the correlation coefficient between the autumn SPODI and winter NAMPI reduces from −0.75 (significant over the 99% level) to −0.27 (significant over the 90% level) when the winter SPOD signal is removed. The above results indicate that the autumn SPOD signal can be prolonged into the following winter via the oceanic memory. Furthermore, the relationship between the autumn SPOD and winter precipitation in the NAM region barely exists without the contribution from the winter SPOD. The winter SPOD is the oceanic bridge that facilitates the cross-seasonal and cross-equatorial propagation of the autumn SPOD signal. Therefore, we next investigate the physical processes involved in the influence of the winter SPOD on winter precipitation in the NAM region.
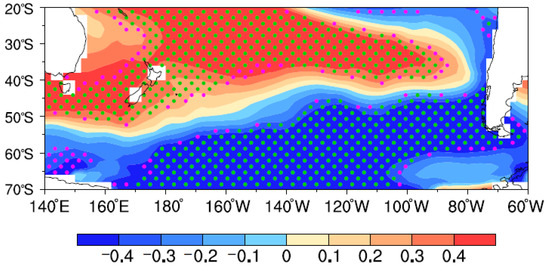
Figure 4.
Correlation map between the autumn southern Pacific Ocean (SPO) dipole (SPOD) index (SPODI) and winter SST anomalies (SSTAs). The magenta and green stippled areas indicate statistical significance at the 90% and 95% confidence levels, respectively, with effective numbers of degrees of freedom.
3.2.2. Response of Winter Atmospheric Circulation to Winter SPOD
As presented in Figure 3 and Figure 4, the SPOD reflects a seesaw feature in the meridional direction, which can result in changes in the meridional SST gradient in the SPO. Observational and model results have verified that changes to the meridional SST gradient have the potential to modulate the local baroclinicity, which affects the eddy activity. Subsequently, the corresponding meridional circulation responds to the meridional SST gradient through wave–mean flow interaction, and it further regulates the eddy-driven jet in the upper troposphere, following the principle of the Coriolis force. The response of the circulation to the extratropical thermal forcing associated with the SPOD even extends to the northern mid-latitudes [12,35,36,37].
In view of the above, we further investigate the influence of the winter SPOD on the modulated atmospheric circulation. Figure 5 presents the correlation coefficients of winter zonal wind averaged over the Pacific Ocean (200° E–260° E) with the winter SPODI. The positive (negative) winter SPOD usually corresponds to anomalous westerlies (easterlies) near 60° S and easterlies (westerlies) north of 50° S across the whole SH troposphere, indicating that a strengthened (weakened) SPOD favors an enhanced (decreased) and southward (Northward) fluctuation of the eddy-driven westerly jet in the SPO. This result is in accordance with previous research whereby the dipole-like SSTAs forcing has the potential to regulate the SH eddy-driven jet via alteration of the meridional SST gradient to induce wave–mean-flow interaction [12,35,36,37]. The shift of the eddy-driven westerly jet in the SPO can also influence the zonal wind in the tropics and the eddy-driven westerly jet in the NH, as the meridional circulation is not isolated in the two hemispheres. There are also significant anomalous easterlies (westerlies) across the region 20° N–40° N that are a response to the strengthened (weakened) SPOD, indicating that the influence of the winter SPOD can cross the tropics and even reach the NH.
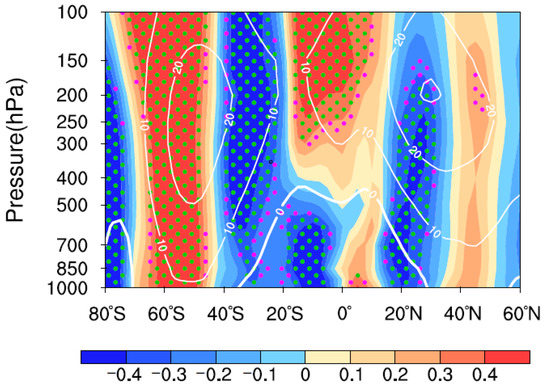
Figure 5.
Partial correlation map between the winter SPODI and winter zonal wind averaged over 200° E–260° E without the ENSO signal. The magenta and green stippled areas indicate statistical significance at the 90% and 95% confidence levels, respectively. The white contours represent the climatological mean zonal wind in winter.
The alternating positive and negative distribution of the zonal wind associated with the SPOD (as shown in Figure 5) usually corresponds to the anomalous cyclonic or anticyclonic circulation in the horizontal direction and the transport of the Rossby wave energy. Figure 6 presents the winter stream function (shading) and horizontal wind (vectors) at 300 hPa associated with the winter SPODI. The most striking feature is a teleconnection wave train across the Pacific Ocean that extends into the western coast of North America, which is referred to as the Southern Pacific–North America teleconnection (SPNA). We define the SPNA index (SPNAI) as
where , , and are the normalized stream functions in boxes A, B, and C, respectively, in Figure 6. The SPNAI shows significant covariability with the SPODI, having correlation coefficients of 0.76 and 0.58 before and after the removal of the ENSO signal, respectively (significant over the 99% level). The results of the wave ray-tracing method can further verify the interhemispheric teleconnection (Figure 7). The wave sources (black dots in Figure 7) located in the SH middle latitudes can excite the SPNA wave train, and this can cross the Pacific Ocean and transport the energy into the NAM (black box in Figure 7) region. In addition, both the winter positive (negative) SPOD and SPNA cases are associated with negative (positive) winter precipitation anomalies in the NAM region (Figure 8). These results indicate that the winter SPOD has the potential to modulate the eddy-driven westerly jet and trigger the SPNA to exert its influence on the NAM region, which induces precipitation anomalies in this region. Next, we explore how the winter SPNA affects precipitation in the NAM region.
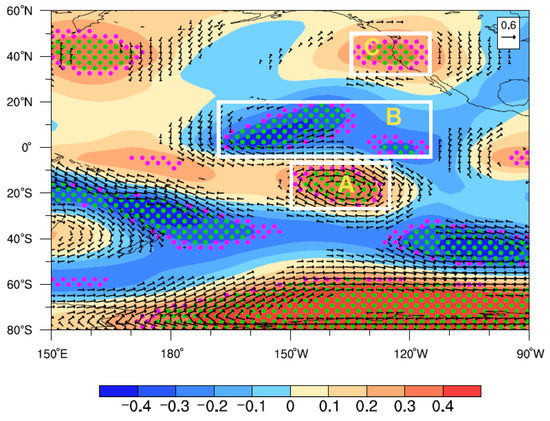
Figure 6.
Partial correlation map between the winter SPODI and winter stream function (shading) and horizontal wind (vectors) at 300 hPa without the ENSO signal. The magenta and green stippled areas indicate statistical significance at the 90% and 95% confidence levels, respectively. The black vectors indicate that the statistical significance exceeds the 90% confidence level.
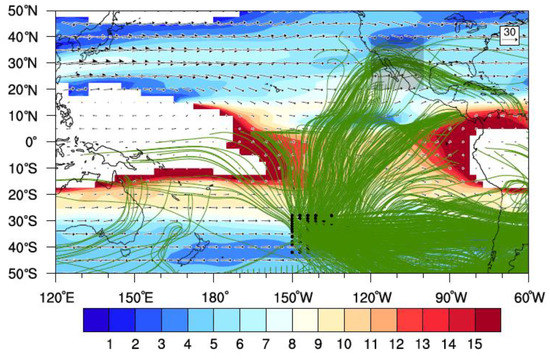
Figure 7.
The Rossby wave ray trajectories (green lines) starting from the southern Pacific region (black dots). The shading and the vectors indicate the climatological stationary total wavenumber and wind in winter at 300 hPa. The gray box indicates the location of the NAM region.
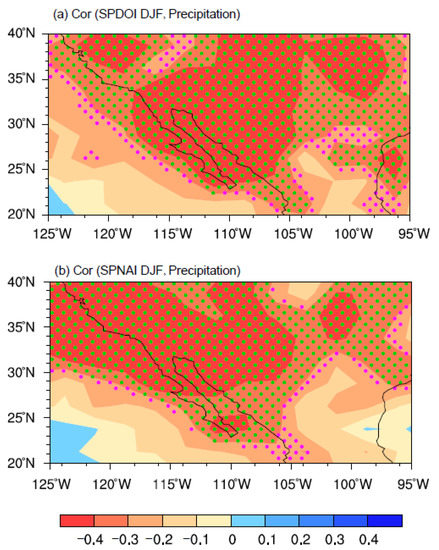
Figure 8.
Partial correlation maps between the winter (a) south Pacific Ocean dipole (SPOD) index (SPODI) and (b) Southern Pacific–North America teleconnection (SPNA) index (SPNAI) and winter precipitation without the ENSO signal. The magenta and green stippled areas indicate statistical significance at the 90% and 95% confidence levels, respectively.
3.2.3. Local Atmospheric Response to the Winter SPNA in the NAM Region
The combined influence of atmospheric circulation and the water vapor condition are closely associated with the distribution of precipitation. Thus, it is necessary to explore winter circulation and the water vapor anomalies that are associated with the winter SPNA, as this will provide insights into the connection between the winter SPNA and winter precipitation in the NAM region. Figure 9a–c shows maps of correlations between the winter SPNAI and winter atmospheric variables. When the SPNA is in its positive phase, the majority of the NAM region is dominated by anomalous high pressure through the whole troposphere (Figure 9). For convenience, we define the local geopotential height (HGT) index (HGTI) as the standardized HGT anomalies at 300 hPa over the North American region (20° N–40° N, 210° E–260° E). The local high pressure is usually associated with subsidence (Figure 10a) airflows prevailing over the NAM region. Corresponding to the local high pressure, there are negative relative humidity anomalies (Figure 10b) in the NAM region, which do not favor the formation of precipitation. Therefore, the configuration of atmospheric circulation and the water vapor condition associated with the local high pressure induced by the winter SPNA disfavors precipitation formation. When the autumn SPNA is in the opposite phase, the pattern is reversed.
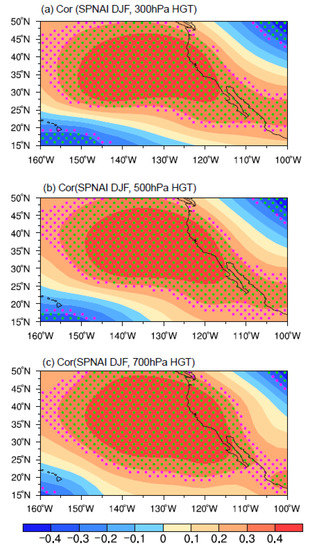
Figure 9.
Partial correlation maps between the winter SPNAI and winter local geopotential height (HGT) at (a) 300 hPa, (b) 500 hPa, and (c) 700 hPa without the ENSO signal. The magenta and green stippled areas indicate statistical significance at the 90% and 95% confidence levels, respectively.
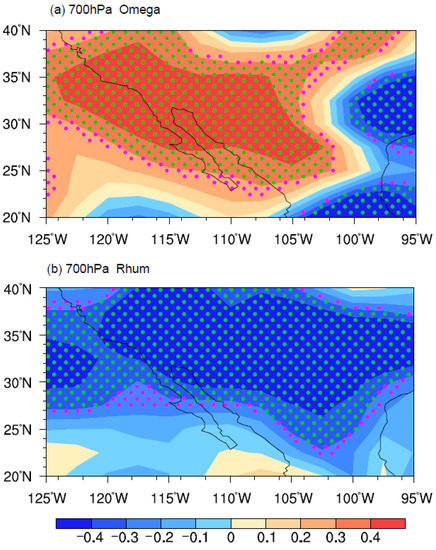
Figure 10.
Partial correlation maps between the winter local geopotential height index (HGTI) and winter (a) vertical velocity and (b) relative humidity at 700 hPa without the ENSO signal. The magenta and green stippled areas indicate statistical significance at the 90% and 95% confidence levels, respectively.
To summarize, the positive (negative) autumn SPOD records its signal to the SST and can persist into the winter to regulate the eddy-driven westerly jet in the SPO via wave–mean flow interaction. Variability in the eddy-driven westerly jet can excite the positive (negative) SPNA teleconnection and propagate its influence into the NAM region by inducing anomalous high (low) pressure, subsidence (ascending) airflow, and less (rich) water vapor. This anomalous atmospheric circulation and the water vapor conditions finally affect the variability in precipitation in the NAM region.
4. Conclusions and Discussion
Zheng et al. [12,13] demonstrated that the cross-equatorial and cross-seasonal influence of SH climate elements on NH climate is zonally consistent in both the observations and model simulations. These air–sea signals provide an additional source of predictability for both the summer and winter climate in the EAM region. At the same latitude, the influence of the SH climate signal has also been reported in the NAM region during summer [8]. Therefore, the connection between the preceding climate signal and the winter climate variability in the NAM region should be explored. This paper focused on the correlation between the autumn SPOD and winter precipitation in the NAM region. The positive autumn SPOD is usually associated with less precipitation in the NAM region, and the possible underlying mechanism can be summarized as the “coupled oceanic–atmospheric bridge” process in the SPO. Specifically, the positive autumn SPOD signal can be imprinted onto the SST in the SPO and persists to the following winter, a process that relies on the huge thermal inertia of the ocean. The positive winter SPOD can induce anomalous eddy activity that has the potential to regulate the southward fluctuation of the eddy-driven westerly jet in the SPO via local air–sea and wave–mean flow interactions. Variation in the eddy-driven westerly jet in the SPO further mobilizes the adjustment of the zonal wind in the tropics and NH, and triggers the positive SPNA wave train to transport the energy into the NAM region, which favors the development of anomalous high pressure through the whole troposphere over the NAM region. This anomalous high pressure and the related anomalous subsidence airflow and less water vapor result in less precipitation dominating the NAM region. When the SPOD in its negative phase, the situation is opposite. Thus, the SPOD plays an “oceanic bridge” role and the response of the atmospheric circulation in the Pacific Ocean to the SPOD plays an “atmospheric bridge” role, which allows the cross-equatorial and cross-seasonal propagation of the SPOD to influence precipitation during the following winter in the NAM region. The whole process is summarized in Figure 11.
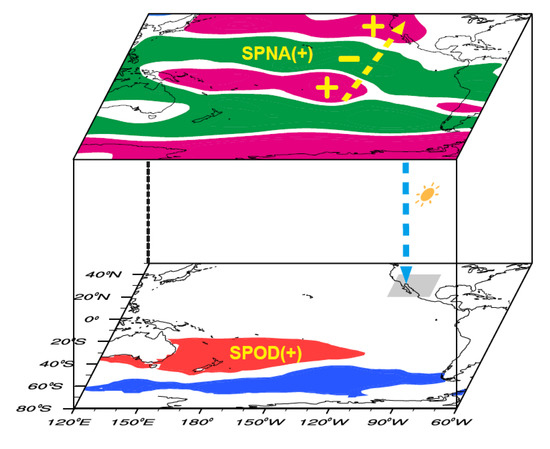
Figure 11.
Schematic diagram summarizing the influence of the autumn positive SPOD on winter precipitation in the NAM region. The red and blue shading indicates the SPOD, and the green and magenta shading indicates the SPNA exerted by the winter SPOD. The dotted blue arrow indicates the winter anomalous downward flows associated with the Rossby wave train. The gray box indicates the NAM region.
Our results suggest that the autumn SPOD provides an additional source of predictability for downscaled seasonal predictions for the following winter’s precipitation in the NAM region. However, the problem remains of how to construct a prediction model for the following winter’s precipitation, based on the autumn SPOD, or the assimilated SPOD signal in dynamic prediction, and further research is therefore required. Furthermore, given that ENSO also has effect on the climate in the NAM region, future studies should investigate the relative contributions of the extropical factor, SPOD, and tropical factor, ENSO, to climate variability in the NAM region via model simulation, and consider both when generating climate predictions, as this will provide additional insights for climate predictability research related to the NAM region. Moreover, the SPOD mode reported in this study is the leading mode of the interannual SSTA variability in the SPO, which accounts for 36.1% of the total variance. It resembles the SSTA pattern of the Southern Ocean dipole [38,39] in the SPO. Whether SPOD is one part of the SOD or whether it is an independent mode require further study in the future.
Author Contributions
Conceptualization, T.L. and J.L.; Formal analysis, T.L. and Q.W.; Resources, S.Z.; Writing–original draft, T.L. and J.L. All authors have read and agreed to the published version of the manuscript.
Funding
This research was jointly funded by the National Natural Science Foundation of China, 41705049, 41690124, 41790474, 41530424, and 41690120, the National Key R&D Program of China, 2016YFA0601801, the SOA International Cooperation Program on Global Change and Air–Sea Interactions, GASI-IPOVAI-03, the Fundamental Research Funds for the Central Universities, 201962009 and the Shandong Natural Science Foundation Project, ZR2019ZD12.
Conflicts of Interest
The authors declare no conflict of interest.
References
- Fan, K.; Wang, H.J. Antarctic oscillation and the dust weather frequency in North China. Geophys. Res. Lett. 2004, 31. [Google Scholar] [CrossRef]
- Zheng, F.; Li, J.P.; Clark, R.T.; Ding, R.Q.; Li, F.; Wang, L. Influence of the boreal spring Southern annular mode on summer surface air temperature over northeast China. Atmos. Sci. Lett. 2014, 16, 155–161. [Google Scholar] [CrossRef]
- Nan, S.L.; Li, J.P. The relationship between the summer precipitation in the Yangtze iver valley and the boreal spring Southern Hemisphere annular mode. Geophys. Res. Lett. 2003, 30, L018381. [Google Scholar] [CrossRef]
- Nan, S.L.; Li, J.P.; Yuan, X.J.; Zhao, P. Boreal spring Southern Hemisphere annular mode, Indian Ocean sea surface temperature, and East Asian summer monsoon. J. Geophys. Res. 2009, 114, D02103. [Google Scholar] [CrossRef]
- Dou, J.; Wu, Z.W.; Li, J.P. The strengthened relationship between the Yangtze River Valley summer rainfall and the Southern Hemisphere annular mode in recent decades. Clim. Dyn. 2020, 54, 1607–1624. [Google Scholar] [CrossRef]
- Liu, T.; Li, J.P.; Li, Y.J.; Zhao, S.; Zheng, F.; Zheng, J.Y.; Yao, Z.X. Influence of the May Southern Annular Mode on the South China Sea Summer Monsoon. Clim. Dyn. 2018, 51, 4094–4107. [Google Scholar] [CrossRef]
- Dou, J.; Wu, Z.W.; Zhou, Y. Potential impact of the May Southern Hemisphere annular mode on the Indian summer monsoon rainfall. Clim. Dyn. 2017, 49, 1257–1269. [Google Scholar] [CrossRef]
- Sun, J.Q. Possible impact of the boreal spring Antarctic Oscillation on the North American summer monsoon. Atmos. Ocean. Sci. Lett. 2010, 3, 232–236. [Google Scholar]
- Sun, J.Q.; Wang, H.J.; Yuan, W. Linkage of the boreal spring Antarctic Oscillation to the West African summer monsoon. J. Meteor. Soc. Japan 2010, 88, 15–28. [Google Scholar] [CrossRef]
- Ho, C.H.; Kim, J.H.; Kim, H.S.; Sui, C.H. Possible influence of the Antarctic Oscillation on tropical cyclone activity in the western North Pacific. J. Geophys. Res. 2005, 110, D19104. [Google Scholar] [CrossRef]
- Zheng, F.; Li, J.P. Impact of preceding boreal winter Southern Hemisphere annular mode on spring precipitation over South China and related mechanism. Chin. J. Geophys. 2012, 55, 3542–3557. (In Chinese) [Google Scholar]
- Zheng, F.; Li, J.P.; Wang, L.; Xie, F.; Li, X.F. Cross-Seasonal Influence of the December–February Southern Hemisphere Annular Mode on March–May Meridional Circulation and Precipitation. J. Clim. 2015, 28, 6859–6881. [Google Scholar] [CrossRef]
- Zheng, F.; Li, J.P.; Ding, R.Q.; Feng, J. Cross-Seasonal Influence of the SAM on Southern Hemisphere Extratropical SST and its Relationship with Meridional Circulation in CMIP5 models. Int. J. Climatol. 2018, 38, 1499–1519. [Google Scholar] [CrossRef]
- Wu, Z.W.; Li, J.P.; Wang, B.; Liu, X. Can the Southern Hemisphere annular mode afect China winter monsoon? J. Geophys. Res. 2009, 114. [Google Scholar] [CrossRef]
- Qian, Z.L. The impact of autumn Antarctic Oscillation (AAO) on winter precipitation in southern China. Chin. J. Atmos. Sci. 2014, 38, 190–200. (In Chinese) [Google Scholar]
- Wu, Z.W.; Dou, J.; Lin, H. Potential infuence of the November–December Southern Hemisphere annular mode on the East Asian winter precipitation: A new mechanism. Clim. Dyn. 2015, 44, 1215–1226. [Google Scholar] [CrossRef]
- Terray, P. Southern Hemisphere extra-tropical forcing: A new paradigm for El Niño—Southern Oscillation. Clim. Dyn. 2011, 36, 2171–2199. [Google Scholar] [CrossRef]
- Ding, R.Q.; Li, J.P.; Tseng, Y.H. The impact of South Pacific extratropical forcing on ENSO and comparisons with the North Pacific. Clim. Dyn. 2015, 44, 2017–2034. [Google Scholar] [CrossRef]
- Ding, R.Q.; Li, J.P.; Tseng, Y.H.; Sun, C.; Xie, F. Joint impact of North and South Pacific extratropical atmospheric variability on the onset of ENSO events. J. Geophys. Res. Atmos. 2017, 121, 279–298. [Google Scholar] [CrossRef]
- Li, J.P.; Zeng, Q.C. A new monsoon index and the geographical distribution of the global monsoons. Adv. Atmos. Sci. 2003, 20, 299–302. [Google Scholar]
- Adams, D.K.; Comrie, C. The North American Monsoon. Bull. Am. Meteorol. Soc. 1997, 78, 2197–2214. [Google Scholar] [CrossRef]
- Bordoni, S.; Ciesielski, P.E.; Johnson, R.H.; McNoldy, B.D.; Stevens, B. The low-level circulation of the North American Monsoon as revealed by Quik SCAT. Geophys. Res. Lett. 2004, 31, L10109. [Google Scholar] [CrossRef]
- Higgins, R.W.; Yao, Y.; Wang, X. Influence of the North American monsoon system on the U. S. summer precipitation regime. J. Clim. 1997, 10, 2600–2622. [Google Scholar] [CrossRef]
- Riddle, E.E.; Stoner, M.B.; Johnson, N.C.; L’Heureux, M.L.; Collins, D.C.; Feldstein, S.B. The impact of the MJO on clusters of wintertime circulation anomalies over the North American region. Clim. Dyn. 2013, 40, 1749–1766. [Google Scholar] [CrossRef]
- Schreck, C.J.; Cordeira, J.M.; Margolin, D. Which MJO events affect North American temperatures? Mon. Weather Rev. 2013, 141, 3840–3850. [Google Scholar] [CrossRef]
- Moon, J.Y.; Wang, B.; Ha, K.J. MJO modulation on 2009/10 winter snowstorms in the United States*. J. Clim. 2011, 25, 978–991. [Google Scholar] [CrossRef]
- Sun, C.; Li, J.P.; Jin, F.F. A delayed oscillator model for the quasi-periodic multidecadal variability of the NAO. Clim. Dyn. 2015, 45, 2083–2099. [Google Scholar] [CrossRef]
- Lee, S.-K.; Mechoso, C.R.; Wang, C.; Neelin, J.D. Interhemispheric influence of the northern summer monsoons on southern subtropical anticyclones. J. Clim. 2013, 26, 10193–10204. [Google Scholar] [CrossRef]
- Li, Y.J.; L, J.P.; Jin, F.F.; Zhao, S. Interhemispheric propagation of stationary Rossby waves in a horizontally nonuniform background flow. J. Atmos. Sci. 2015, 72, 3233–3256. [Google Scholar] [CrossRef]
- Li, Y.J.; Feng, J.; Li, J.P.; Hu, A.X. Equatorial Windows and Barriers for Stationary Rossby Wave Propagation. J. Clim. 2019, 32, 6117–6135. [Google Scholar] [CrossRef]
- Zhao, S.; Li, J.P.; Li, Y.J. Dynamics of an interhemispheric teleconnection across the critical latitude through a southerly duct during boreal winter. J. Clim. 2015, 28, 7437–7456. [Google Scholar] [CrossRef]
- Sakaguchi, K.; Lu, J.; Leung, L.R.; Zhao, C.; Li, Y.; Hagos, S. Sources and pathways of the upscale effects on the Southern Hemisphere jet in MPAS-CAM4 variable-resolution simulations. J. Adv. Model. Earth Syst. 2016, 8, 1786–1805. [Google Scholar] [CrossRef]
- Zhao, S.; Li, J.; Li, Y.; Jin, F.-F.; Zheng, J. Interhemispheric influence of Indo-Pacific convection oscillation on Southern Hemisphere rainfall through southward propagation of Rossby waves. Clim. Dyn. 2019, 52, 3203–3221. [Google Scholar] [CrossRef]
- Sun, C.; Li, J.; Feng, J.; Xie, F. A decadal-scale teleconnection between the North Atlantic Oscillation and subtropical eastern Australian rainfall. J. Clim. 2015, 28, 1074–1092. [Google Scholar] [CrossRef]
- Marshall, G.J.; Connolley, W.M. Effect of changing Southern Hemisphere winter sea surface temperatures on Southern Annular Mode strength. Geophys. Res. Lett. 2006, 33, L17717. [Google Scholar] [CrossRef]
- Frierson, D.M.W.; Lu, J.; Chen, G. Width of the Hadley cell in simple and comprehensive general circulation models. Geophys. Res. Lett. 2007, 34, L18804. [Google Scholar] [CrossRef]
- Chen, G.; Plumb, R.A.; Lu, J. Sensitivities of zonal mean atmospheric circulation to SST warming in an aqua-planet model. Geophys. Res. Lett. 2010, 37, L12701. [Google Scholar] [CrossRef]
- Li, J.P.; Swinbank, R.; Grotjahn, R.; Volkert, H. Dynamics and Predictability of Large-Scale, High-Impact Weather and Climate Events (Special Publications of the International Union of Geodesy and Geophysics); Cambridge University Press: Cambridge, UK, 2016; p. 370. [Google Scholar]
- Zheng, F.; Li, J.P.; Kucharski, F.; Ding, R.Q.; Liu, T. Dominant SST Mode in the Southern Hemisphere Extratropics and Its Influence on Atmospheric Circulation. Adv. Atmos. Sci. 2018, 35, 881–895. [Google Scholar] [CrossRef]


© 2020 by the authors. Licensee MDPI, Basel, Switzerland. This article is an open access article distributed under the terms and conditions of the Creative Commons Attribution (CC BY) license (http://creativecommons.org/licenses/by/4.0/).